
Social Determinants of Health Data Improve the Prediction of Cardiac Outcomes in Females with Breast Cancer


Abstract
:Simple Summary
Abstract
1. Introduction
2. Materials and Methods
2.1. Study Setting
2.2. Data Source
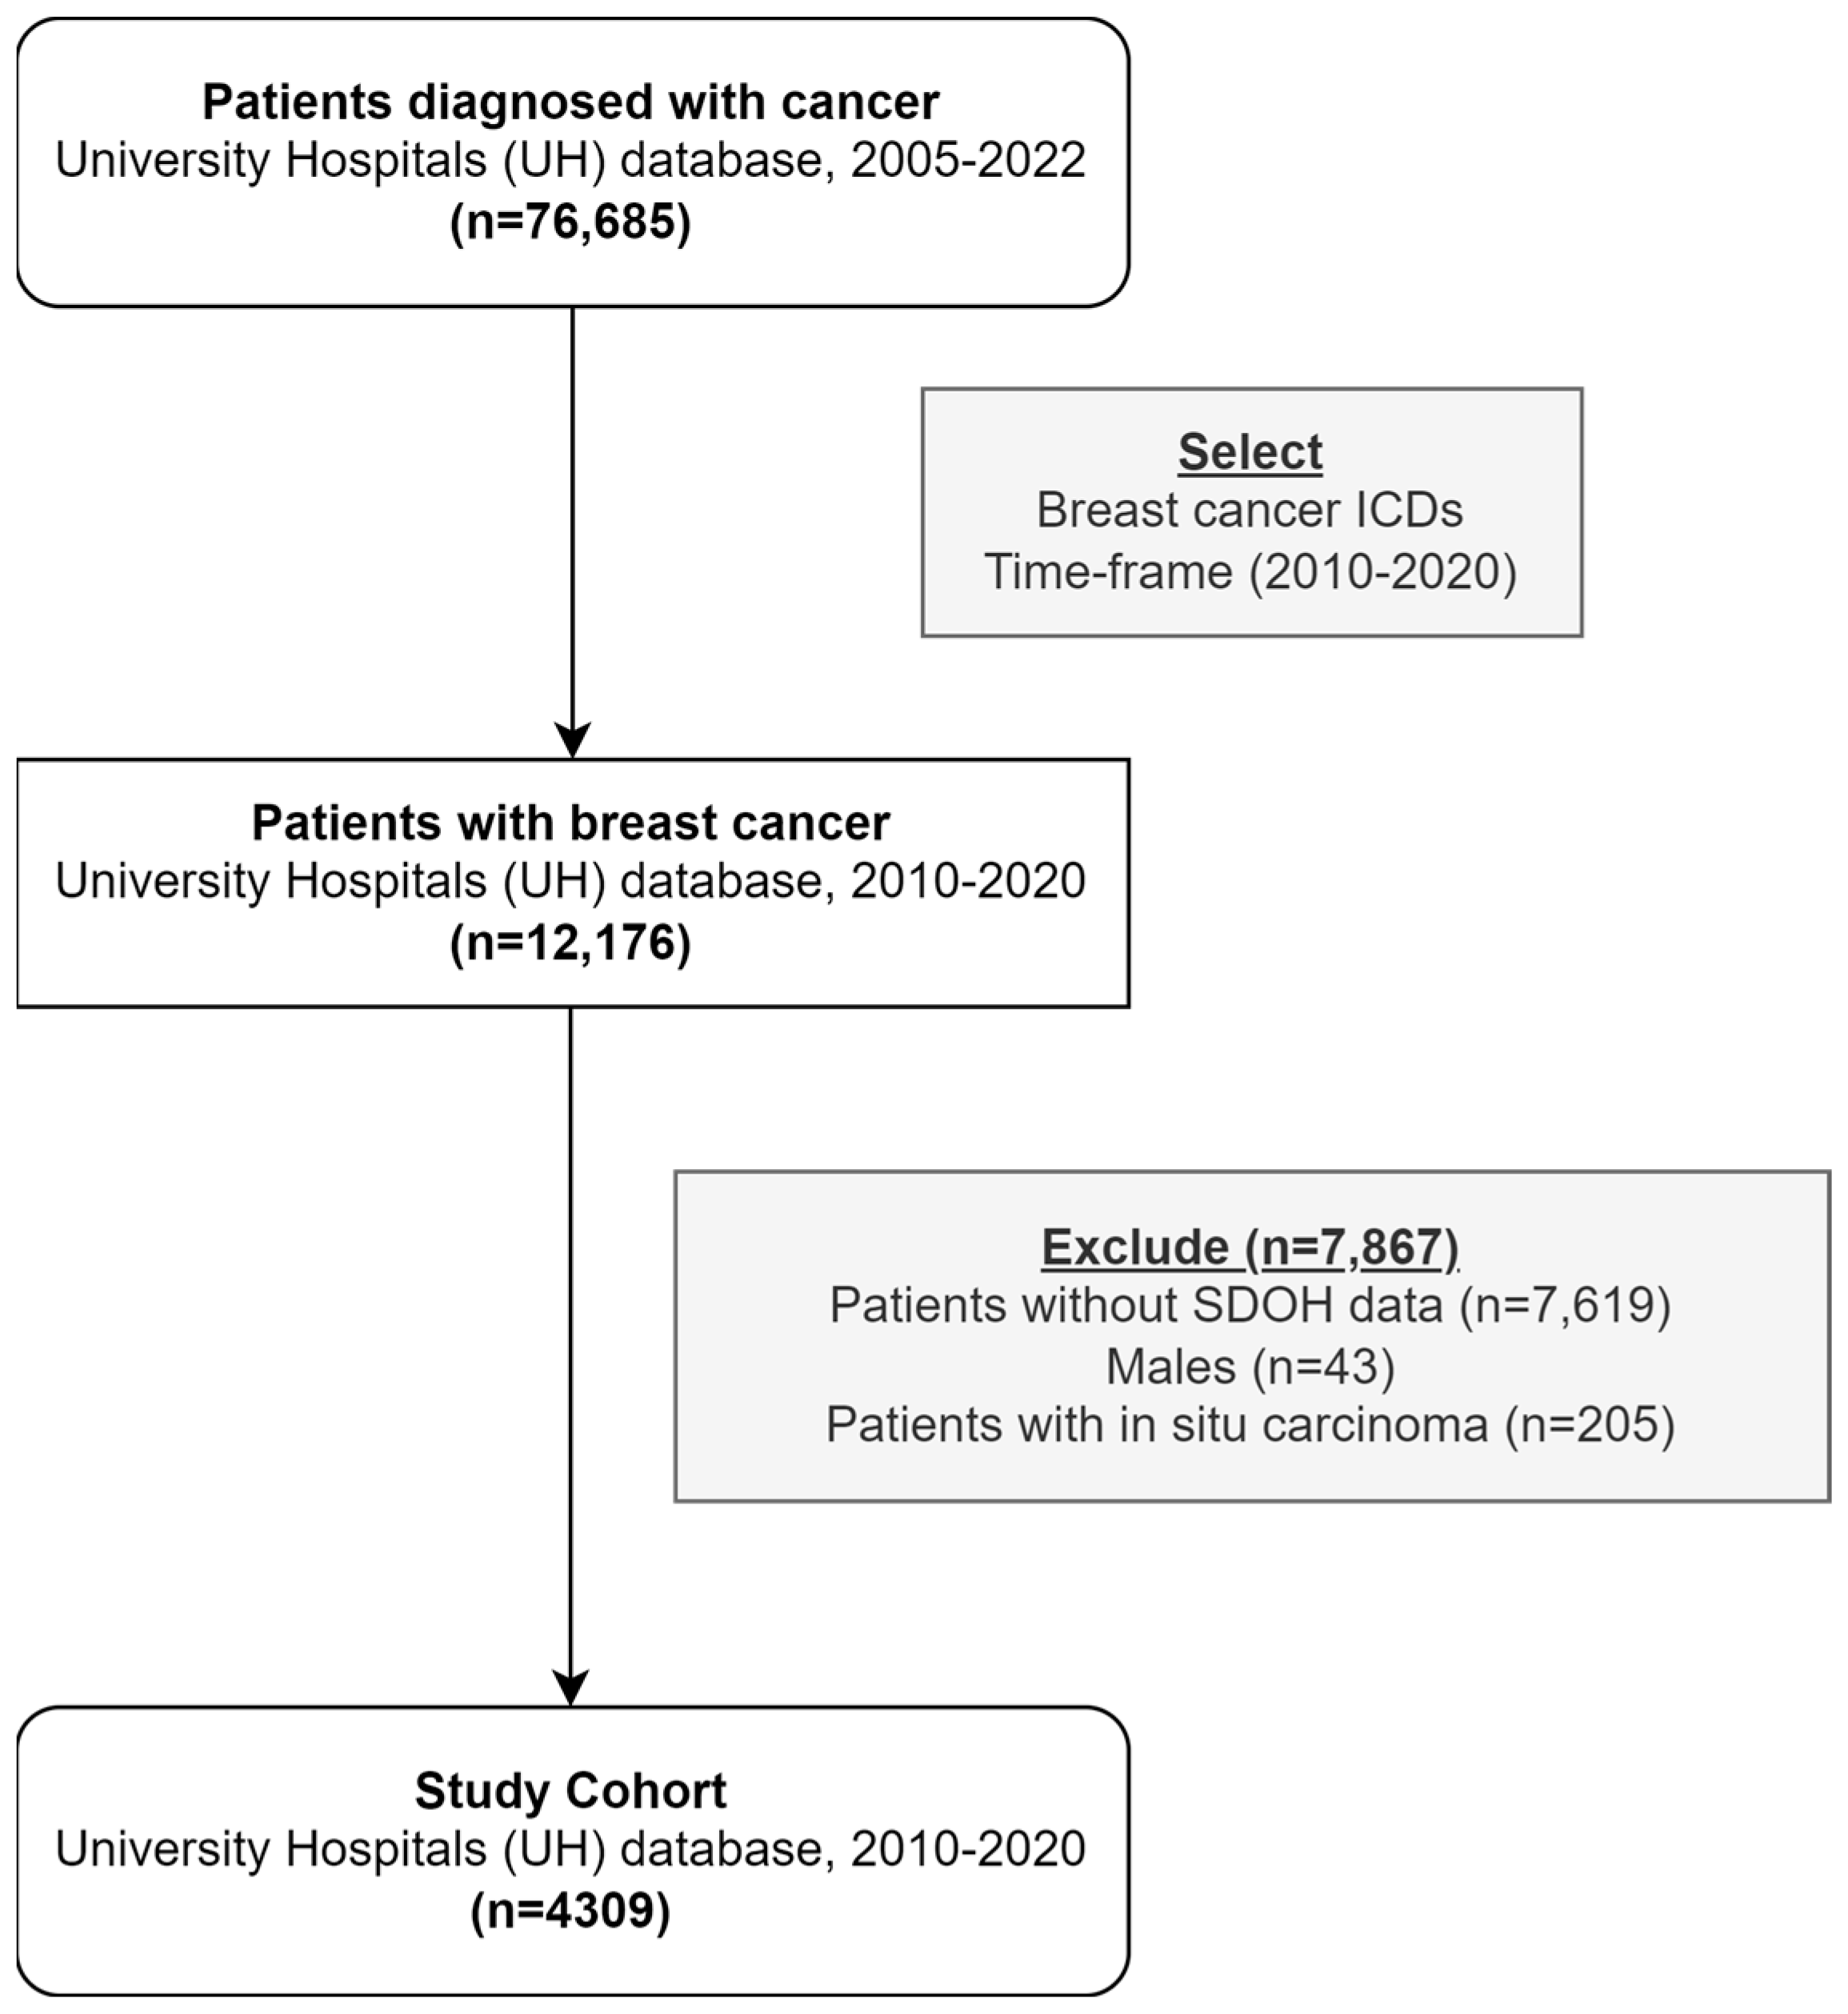
2.3. Inclusion and Exclusion Criteria
2.4. Outcome
2.5. Covariates
2.6. Descriptive Analysis
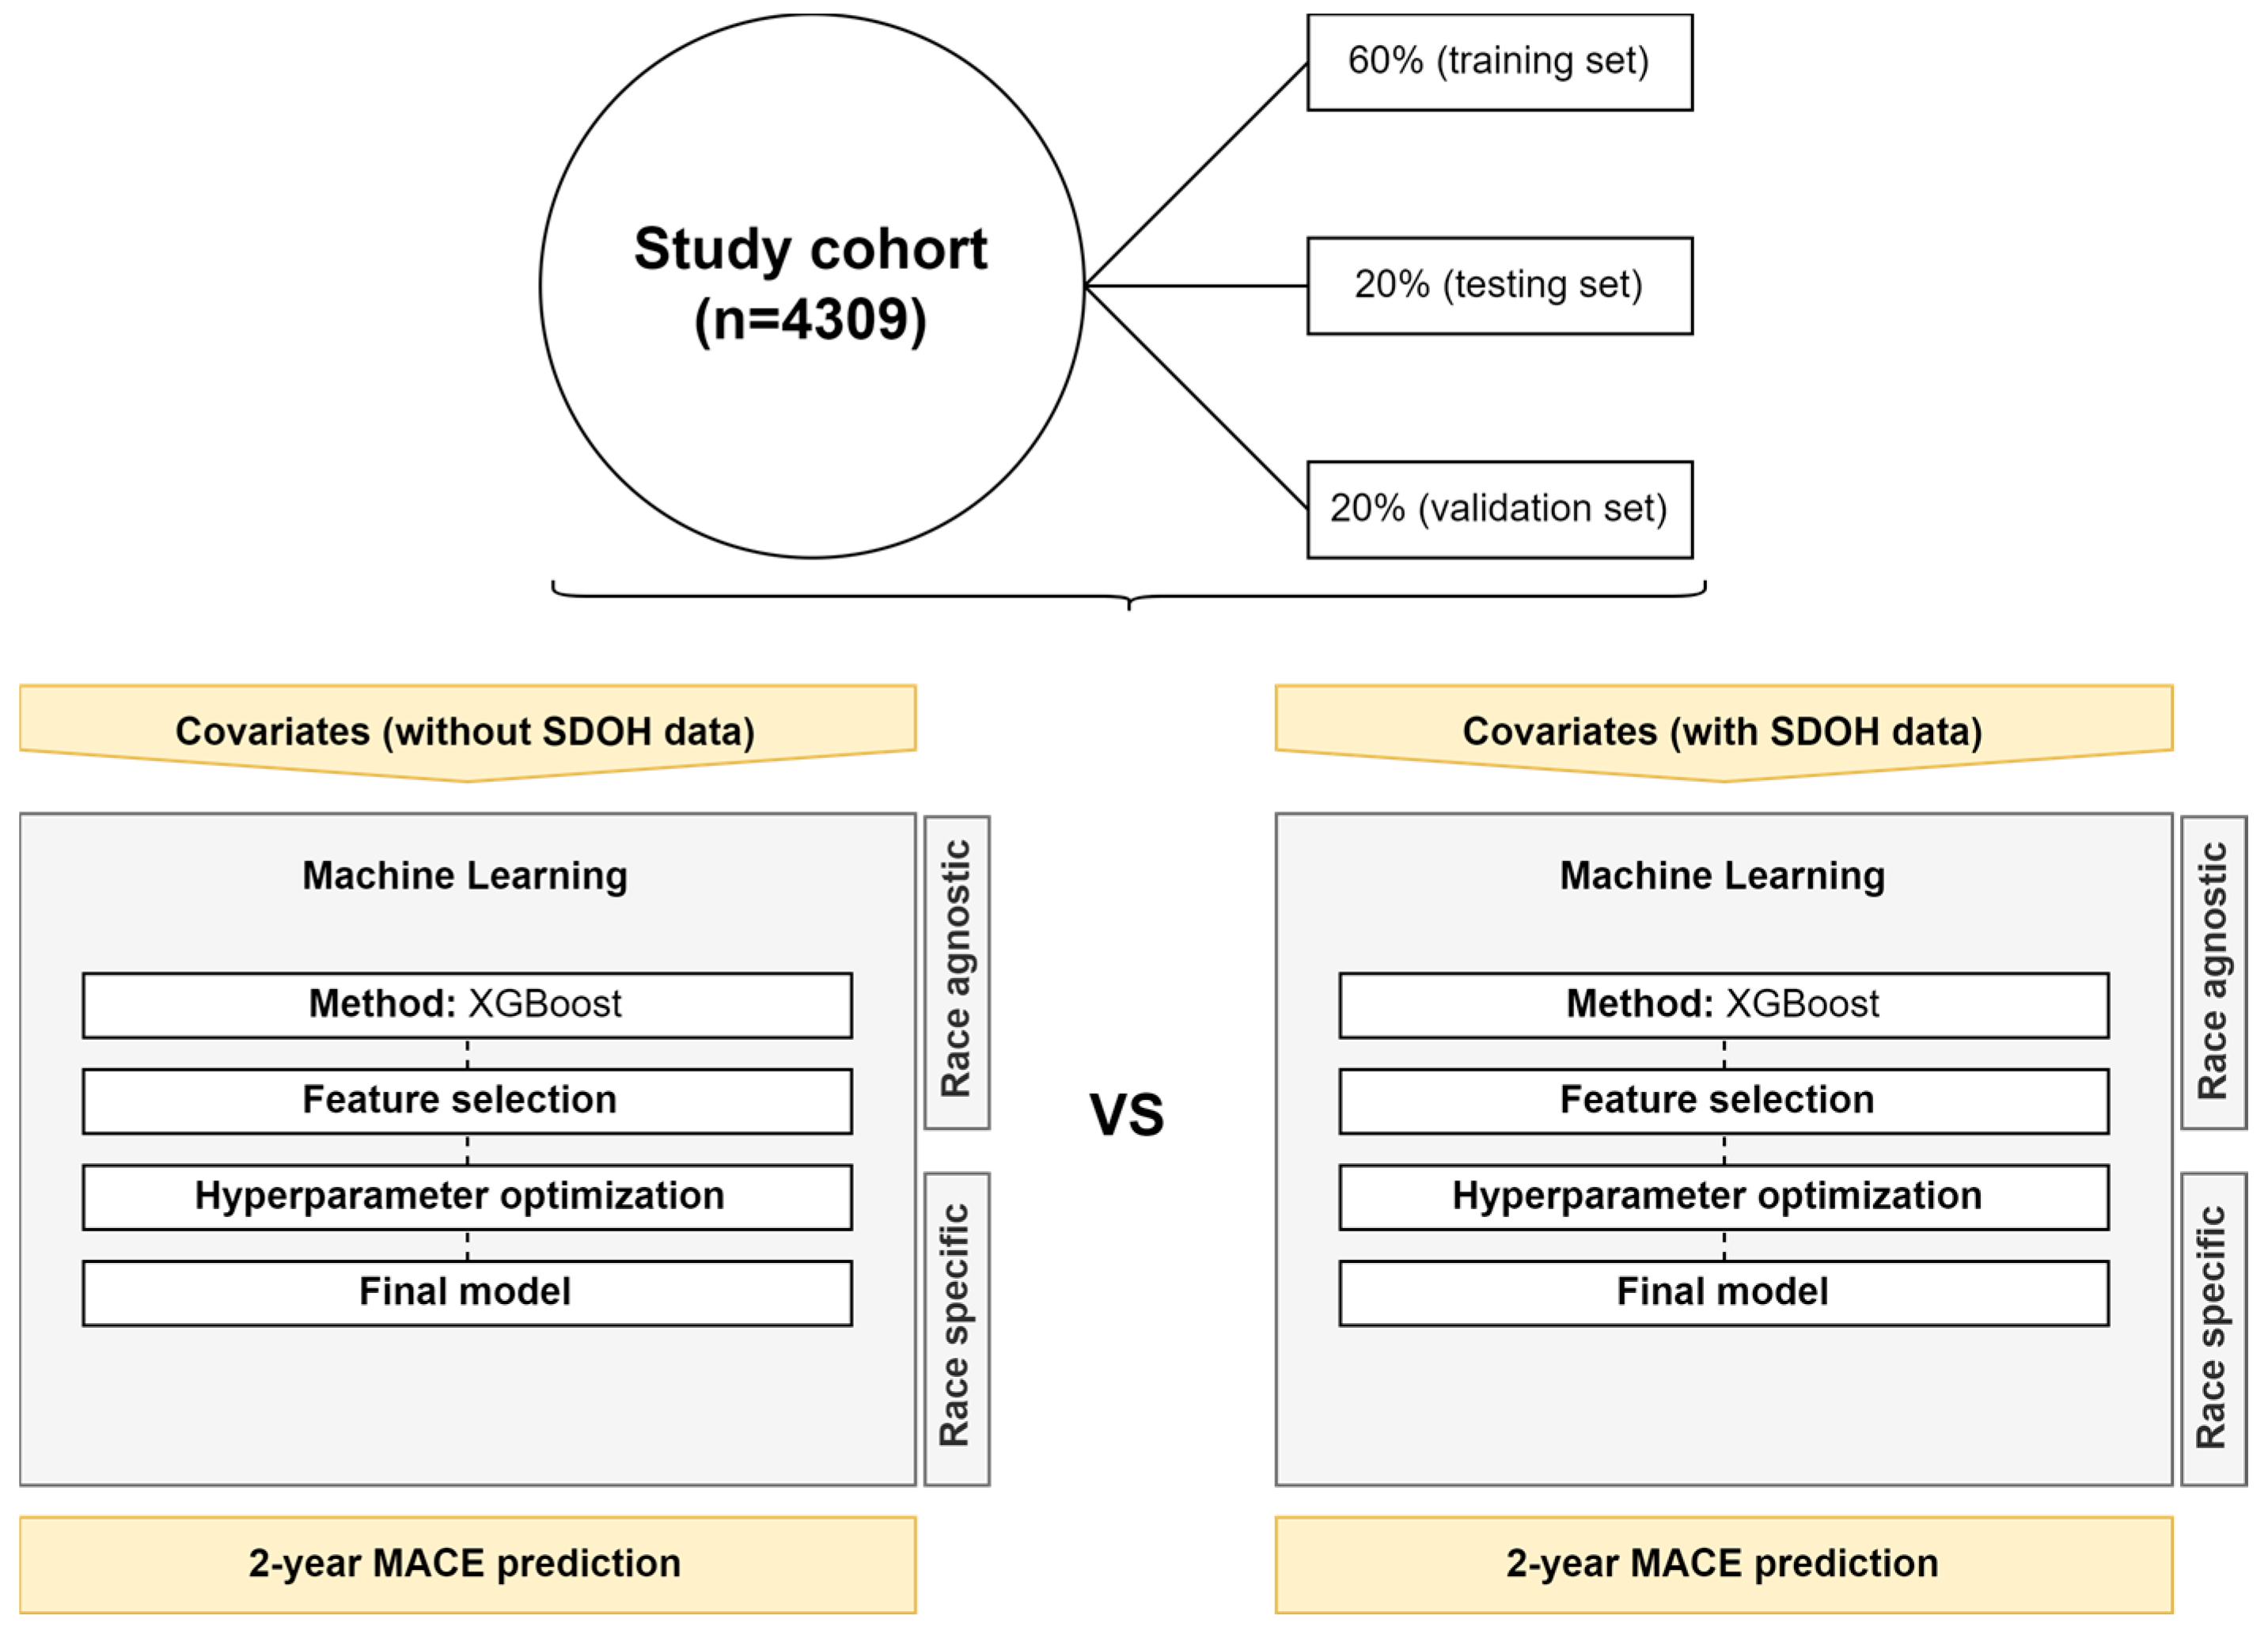
2.7. Machine Learning Development
2.8. Software and Packages
3. Results
3.1. Population
3.2. Outcomes
3.3. Race-Agnostic ML Models
3.4. Race-Specific ML Models—NHB
3.5. Race-Specific ML Model—NHW
4. Discussion
5. Conclusions
Supplementary Materials
Author Contributions
Funding
Institutional Review Board Statement
Informed Consent Statement
Data Availability Statement
Conflicts of Interest
Abbreviations
| ACS | acute coronary syndrome |
| A-fib | atrial fibrillation |
| BC | breast cancer |
| CI | confidence interval |
| CVD | cardiovascular disease |
| CV | cardiovascular |
| C-index | concordance index |
| EMERSE | Electronic Medical Record Search Engine |
| ER | estrogen receptor |
| HER | eletronic health records |
| HF | heart failure |
| IQR | Interquartile range |
| ICD | International Classification of Diseases |
| IS | ischemic stroke |
| MACE | major cardiac events |
| ML | machine learning |
| MI | myocardial infarction |
| NHB | non-Hispanic Black |
| NHW | non-Hispanic White |
| NOS | not specified |
| PR | progesterone receptor |
| SDOH | social determinants of health |
| SES | socioeconomic status |
| TIA | transient ischemic attack |
| US | United States |
| UH | University Hospitals |
References
- Sung, H.; Ferlay, J.; Siegel, R.L.; Laversanne, M.; Soerjomataram, I.; Jemal, A.; Bray, F. Global Cancer Statistics 2020: GLOBOCAN Estimates of Incidence and Mortality Worldwide for 36 Cancers in 185 Countries. CA. Cancer J. Clin. 2021, 71, 209–249. [Google Scholar] [CrossRef] [PubMed]
- Siegel, R.L.; Miller, K.D.; Wagle, N.S.; Jemal, A. Cancer statistics, 2023. CA. Cancer J. Clin. 2023, 73, 17–48. [Google Scholar] [CrossRef] [PubMed]
- SEER [Internet]. Cancer of the Breast (Female)—Cancer Stat Facts. Available online: https://seer.cancer.gov/statfacts/html/breast.html (accessed on 1 June 2022).
- Giaquinto, A.N.; Sung, H.; Miller, K.D.; Kramer, J.L.; Newman, L.A.; Minihan, A.; Jemal, A.; Siegel, R.L. Breast Cancer Statistics, 2022. CA. Cancer J. Clin. 2022, 72, 524–541. [Google Scholar] [CrossRef]
- Mehta, L.S.; Watson, K.E.; Barac, A.; Beckie, T.M.; Bittner, V.; Cruz-Flores, S.; Dent, S.; Kondapalli, L.; Ky, B.; Okwuosa, T.; et al. Cardiovascular Disease and Breast Cancer: Where These Entities Intersect: A Scientific Statement from the American Heart Association. Circulation 2018, 137, e30–e66. [Google Scholar] [CrossRef] [PubMed]
- Haque, R.; Prout, M.; Geiger, A.M.; Kamineni, A.; Thwin, S.S.; Avila, C.; Silliman, R.A.; Quinn, V.; Yood, M.U. Comorbidities and Cardiovascular Disease Risk in Older Breast Cancer Survivors. Am. J. Manag. Care 2014, 20, 86–92. [Google Scholar]
- Powell-Wiley, T.M.; Baumer, Y.; Baah, F.O.; Baez, A.S.; Farmer, N.; Mahlobo, C.T.; Pita, M.A.; Potharaju, K.A.; Tamura, K.; Wallen, G.R. Social Determinants of Cardiovascular Disease. Circ. Res. 2022, 130, 782–799. [Google Scholar] [CrossRef]
- Social Determinants of Health. Available online: https://www.who.int/health-topics/social-determinants-of-health (accessed on 25 August 2022).
- Coughlin, S.S. Social determinants of breast cancer risk, stage, and survival. Breast Cancer Res. Treat. 2019, 177, 537–548. [Google Scholar] [CrossRef]
- Shin, S.; Austin, P.C.; Ross, H.J.; Abdel-Qadir, H.; Freitas, C.; Tomlinson, G.; Chicco, D.; Mahendiran, M.; Lawler, P.R.; Billia, F.; et al. Machine learning vs. conventional statistical models for predicting heart failure readmission and mortality. ESC Heart Fail. 2020, 8, 106–115. [Google Scholar] [CrossRef]
- Stevens, L.M.; Mortazavi, B.J.; Deo, R.C.; Curtis, L.; Kao, D.P. Recommendations for Reporting Machine Learning Analyses in Clinical Research. Circ. Cardiovasc. Qual. Outcomes 2020, 13, e006556. [Google Scholar] [CrossRef]
- Stabellini, N.; Nazha, A.; Agrawal, N.; Huhn, M.; Shanahan, J.; Hamerschlak, N.; Waite, K.; Barnholtz-Sloan, J.S.; Montero, A.J. Thirty-Day Unplanned Hospital Readmissions in Patients with Cancer and the Impact of Social Determinants of Health: A Machine Learning Approach. JCO Clin. Cancer Inform. 2023, 7. [Google Scholar] [CrossRef]
- Krittanawong, C.; Virk, H.U.H.; Bangalore, S.; Wang, Z.; Johnson, K.W.; Pinotti, R.; Zhang, H.; Kaplin, S.; Narasimhan, B.; Kitai, T.; et al. Machine learning prediction in cardiovascular diseases: A meta-analysis. Sci. Rep. 2020, 10, 16057. [Google Scholar] [CrossRef] [PubMed]
- Segar, M.W.; Hall, J.L.; Jhund, P.S.; Powell-Wiley, T.M.; Morris, A.A.; Kao, D.; Fonarow, G.C.; Hernandez, R.; Ibrahim, N.E.; Rutan, C.; et al. Machine Learning–Based Models Incorporating Social Determinants of Health vs. Traditional Models for Predicting In-Hospital Mortality in Patients with Heart Failure. JAMA Cardiol. 2022, 7, 844–854. [Google Scholar] [CrossRef] [PubMed]
- Annual Report 2021|University Hospitals|Cleveland, OH|University Hospitals. Available online: https://www.uhhospitals.org/about-uh/publications/UH-Annual-Report/2021-annual-report (accessed on 5 March 2023).
- Stabellini, N.; Dmukauskas, M.; Bittencourt, M.S.; Cullen, J.; Barda, A.J.; Moore, J.X.; Dent, S.; Abdel-Qadir, H.; Kawatkar, A.A.; Pandey, A.; et al. Social Determinants of Health and Racial Disparities in Cardiac Events in Breast Cancer. J. Natl. Compr. Canc. Netw. 2023, 21, 705–714.e17. [Google Scholar] [CrossRef] [PubMed]
- Stabellini, N. Racial Differences in Chronic Stress/Allostatic Load variation due to Androgen Deprivation Therapy in Prostate Cancer. JACC Cardio Oncol. 2022, 4, 555–557. [Google Scholar] [CrossRef]
- Stabellini, N.; Bruno, D.S.; Dmukauskas, M.; Barda, A.J.; Cao, L.; Shanahan, J.; Waite, K.; Montero, A.J.; Barnholtz-Sloan, J.S. Sex Differences in Lung Cancer Treatment and Outcomes at a Large Hybrid Academic-Community Practice. JTO Clin. Res. Rep. 2022, 3, 100307. [Google Scholar] [CrossRef]
- Stabellini, N.; Chandar, A.K.; Chak, A.; Barda, A.J.; Dmukauskas, M.; Waite, K.; Barnholtz-Sloan, J.S. Sex differences in esophageal cancer overall and by histological subtype. Sci. Rep. 2022, 12, 5248. [Google Scholar] [CrossRef]
- Stabellini, N.; Cullen, J.; Cao, L.; Shanahan, J.; Hamerschlak, N.; Waite, K.; Barnholtz-Sloan, J.S.; Montero, A.J. Racial disparities in breast cancer treatment patterns and treatment related adverse events. Sci. Rep. 2023, 13, 1233. [Google Scholar] [CrossRef]
- Stabellini, N.; Cullen, J.; Bittencourt, M.S.; Moore, J.X.; Cao, L.; Weintraub, N.L.; Harris, R.A.; Wang, X.; Datta, B.; Coughlin, S.S.; et al. Allostatic load and cardiovascular outcomes in males with prostate cancer. JNCI Cancer Spectr. 2023, 7, pkad005. [Google Scholar] [CrossRef]
- Stabellini, N.; Tomlinson, B.; Cullen, J.; Shanahan, J.; Waite, K.; Montero, A.J.; Barnholtz-Sloan, J.S.; Hamerschlak, N. Sex differences in adults with acute myeloid leukemia and the impact of sex on overall survival. Cancer Med. 2023, 12, 6711–6721. [Google Scholar] [CrossRef]
- EMERSE: Electronic Medical Record Search Engine. Available online: https://project-emerse.org/index.html (accessed on 16 May 2022).
- ICD—ICD-9—International Classification of Diseases, Ninth Revision. Available online: https://www.cdc.gov/nchs/icd/icd9.htm (accessed on 25 July 2022).
- ICD-10 Version:2019. Available online: https://icd.who.int/browse10/2019/en (accessed on 15 April 2021).
- Bonsu, J.M.; Guha, A.; Charles, L.; Yildiz, V.O.; Wei, L.; Baker, B.; Brammer, J.E.; Awan, F.; Lustberg, M.; Reinbolt, R.; et al. Reporting of Cardiovascular Events in Clinical Trials Supporting FDA Approval of Contemporary Cancer Therapies. J. Am. Coll. Cardiol. 2020, 75, 620–628. [Google Scholar] [CrossRef]
- Guha, A.; Dey, A.K.; Omer, S.; Abraham, W.T.; Attizzani, G.; Jneid, H.; Addison, D. Contemporary Trends and Outcomes of Percutaneous and Surgical Mitral Valve Replacement or Repair in Patients with Cancer. Am. J. Cardiol. 2020, 125, 1355–1360. [Google Scholar] [CrossRef] [PubMed]
- Charlson, M.E.; Pompei, P.; Ales, K.L.; MacKenzie, C.R. A new method of classifying prognostic comorbidity in longitudinal studies: Development and validation. J. Chronic Dis. 1987, 40, 373–383. [Google Scholar] [CrossRef] [PubMed]
- Kerr, A.J.; Broad, J.; Wells, S.; Riddell, T.; Jackson, R. Should the first priority in cardiovascular risk management be those with prior cardiovascular disease? Heart Br. Card. Soc. 2009, 95, 125–129. [Google Scholar] [CrossRef] [PubMed]
- Social Determinants of Health. Available online: https://risk.lexisnexis.com/healthcare/social-determinants-of-health (accessed on 3 May 2022).
- Social Determinants of Health—Healthy People 2030|Health.Gov. Available online: https://health.gov/healthypeople/priority-areas/social-determinants-health (accessed on 3 May 2022).
- Accountable Care Organizations (ACOs)|CMS. Available online: https://www.cms.gov/Medicare/Medicare-Fee-for-Service-Payment/ACO (accessed on 19 October 2022).
- Osborne, J.W.; Overbay, A. The power of outliers (and why researchers should ALWAYS check for them). Pract. Assess. Res. Eval. 2004, 9, 6. [Google Scholar] [CrossRef]
- Nuzzo, R.L. The Box Plots Alternative for Visualizing Quantitative Data. PM&R 2016, 8, 268–272. [Google Scholar] [CrossRef]
- Lewis, E.F. Machine Learning and Social Determinants of Health—An Opportunity to Move Beyond Race for Inpatient Risk Prediction in Patients with Heart Failure. JAMA Cardiol. 2022, 7, 854–855. [Google Scholar] [CrossRef]
- Azuaje, F. Artificial intelligence for precision oncology: Beyond patient stratification. Npj Precis. Oncol. 2019, 3, 6. [Google Scholar] [CrossRef]
- Chen, T.; Guestrin, C. XGBoost: A Scalable Tree Boosting System. In Proceedings of the 22nd ACM SIGKDD International Conference on Knowledge Discovery and Data Mining, San Francisco, CA, USA, 13–17 August 2016; Association for Computing Machinery: New York, NY, USA, 2016; pp. 785–794, (KDD ’16). [Google Scholar] [CrossRef]
- Rusdah, D.A.; Murfi, H. XGBoost in handling missing values for life insurance risk prediction. SN Appl. Sci. 2020, 2, 1336. [Google Scholar] [CrossRef]
- Xu, Y.; Goodacre, R. On Splitting Training and Validation Set: A Comparative Study of Cross-Validation, Bootstrap and Systematic Sampling for Estimating the Generalization Performance of Supervised Learning. J. Anal. Test. 2018, 2, 249–262. [Google Scholar] [CrossRef]
- Verdonck, T.; Baesens, B.; Óskarsdóttir, M.; vanden Broucke, S. Special issue on feature engineering editorial. Mach. Learn. 2021. [Google Scholar] [CrossRef]
- Pudjihartono, N.; Fadason, T.; Kempa-Liehr, A.W.; O’Sullivan, J.M. A Review of Feature Selection Methods for Machine Learning-Based Disease Risk Prediction. Front. Bioinforma. 2022, 2. [Google Scholar] [CrossRef] [PubMed]
- Harrell, F.E., Jr.; Califf, R.M.; Pryor, D.B.; Lee, K.L.; Rosati, R.A. Evaluating the Yield of Medical Tests. JAMA 1982, 247, 2543–2546. [Google Scholar] [CrossRef] [PubMed]
- Bergstra, J.; Bengio, Y. Random Search for Hyper-Parameter Optimization. J. Mach. Learn. Res. 2012, 13, 281–305. [Google Scholar]
- Harrell, F.E.; Lee, K.L.; Mark, D.B. Multivariable prognostic models: Issues in developing models, evaluating assumptions and adequacy, and measuring and reducing errors. Stat. Med. 1996, 15, 361–387. [Google Scholar] [CrossRef]
- Longato, E.; Vettoretti, M.; Di Camillo, B. A practical perspective on the concordance index for the evaluation and selection of prognostic time-to-event models. J. Biomed. Inform. 2020, 108, 103496. [Google Scholar] [CrossRef] [PubMed]
- RStudio|Open Source & Professional Software for Data Science Teams. Available online: https://www.rstudio.com/ (accessed on 3 May 2022).
- Lang, M.; Bischl, B.; Richter, J.; Schratz, P.; Casalicchio, G.; Coors, S.; Au, Q.; Binder, M.; Becker, M. Mlr3: Machine Learning in R—Next Generation 2022. Available online: https://CRAN.R-project.org/package=mlr3 (accessed on 20 July 2023).
- Sonabend, R.; Király, F.J.; Bender, A.; Bischl, B.; Lang, M. mlr3proba: An R package for machine learning in survival analysis. Bioinformatics 2021, 37, 2789–2791. [Google Scholar] [CrossRef]
- Zhang, J.; Gajjala, S.; Agrawal, P.; Tison, G.H.; Hallock, L.A.; Beussink-Nelson, L.; Lassen, M.H.; Fan, E.; Aras, M.A.; Jordan, C.; et al. Fully Automated Echocardiogram Interpretation in Clinical Practice. Circulation 2018, 138, 1623–1635. [Google Scholar] [CrossRef]
- Madani, A.; Arnaout, R.; Mofrad, M.; Arnaout, R. Fast and accurate view classification of echocardiograms using deep learning. Npj Digit. Med. 2018, 1, 6. [Google Scholar] [CrossRef]
- Attia, Z.I.; Kapa, S.; Lopez-Jimenez, F.; McKie, P.M.; Ladewig, D.J.; Satam, G.; Pellikka, P.A.; Enriquez-Sarano, M.; Noseworthy, P.A.; Munger, T.M.; et al. Screening for cardiac contractile dysfunction using an artificial intelligence–enabled electrocardiogram. Nat. Med. 2019, 25, 70–74. [Google Scholar] [CrossRef]
- Javaid, A.; Zghyer, F.; Kim, C.; Spaulding, E.M.; Isakadze, N.; Ding, J.; Kargillis, D.; Gao, Y.; Rahman, F.; Brown, D.E.; et al. Medicine 2032: The future of cardiovascular disease prevention with machine learning and digital health technology. Am. J. Prev. Cardiol. 2022, 12, 100379. [Google Scholar] [CrossRef]
- Kakadiaris, I.A.; Vrigkas, M.; Yen, A.A.; Kuznetsova, T.; Budoff, M.; Naghavi, M. Machine Learning Outperforms ACC/AHA CVD Risk Calculator in MESA. J. Am. Heart Assoc. 2018, 7, e009476. [Google Scholar] [CrossRef]
- Alaa, A.M.; Bolton, T.; Angelantonio, E.D.; Rudd, J.H.F.; Schaar, M. van der Cardiovascular disease risk prediction using automated machine learning: A prospective study of 423,604 UK Biobank participants. PLoS ONE 2019, 14, e0213653. [Google Scholar] [CrossRef]
- Pal, M.; Parija, S.; Panda, G.; Dhama, K.; Mohapatra, R.K. Risk prediction of cardiovascular disease using machine learning classifiers. Open Med. 2022, 17, 1100–1113. [Google Scholar] [CrossRef]
- Kremers, H.M.; Crowson, C.S.; Therneau, T.M.; Roger, V.L.; Gabriel, S.E. High ten-year risk of cardiovascular disease in newly diagnosed rheumatoid arthritis patients: A population-based cohort study. Arthritis Rheum. 2008, 58, 2268–2274. [Google Scholar] [CrossRef]
- Damen, J.A.; Pajouheshnia, R.; Heus, P.; Moons, K.G.M.; Reitsma, J.B.; Scholten, R.J.P.M.; Hooft, L.; Debray, T.P.A. Performance of the Framingham risk models and pooled cohort equations for predicting 10-year risk of cardiovascular disease: A systematic review and meta-analysis. BMC Med. 2019, 17, 109. [Google Scholar] [CrossRef] [PubMed]
- Roth, G.A.; Mensah, G.A.; Johnson, C.O.; Addolorato, G.; Ammirati, E.; Baddour, L.M.; Barengo, N.C.; Beaton, A.Z.; Benjamin, E.J.; Benziger, C.P.; et al. Global Burden of Cardiovascular Diseases and Risk Factors, 1990–2019. J. Am. Coll. Cardiol. 2020, 76, 2982–3021. [Google Scholar] [CrossRef] [PubMed]
- Miller, G.E.; Chen, E.; Shimbo, D. Mechanistic Understanding of Socioeconomic Disparities in Cardiovascular Disease*. J. Am. Coll. Cardiol. 2019, 73, 3256–3258. [Google Scholar] [CrossRef] [PubMed]
- Schultz, W.M.; Kelli, H.M.; Lisko, J.C.; Varghese, T.; Shen, J.; Sandesara, P.; Quyyumi, A.A.; Taylor, H.A.; Gulati, M.; Harold, J.G.; et al. Socioeconomic Status and Cardiovascular Outcomes. Circulation 2018, 137, 2166–2178. [Google Scholar] [CrossRef] [PubMed]
- Rosengren, A.; Hawken, S.; Ôunpuu, S.; Sliwa, K.; Zubaid, M.; Almahmeed, W.A.; Blackett, K.N.; Sitthi-amorn, C.; Sato, H.; Yusuf, S. Association of psychosocial risk factors with risk of acute myocardial infarction in 11,119 cases and 13,648 controls from 52 countries (the INTERHEART study): Case-control study. The Lancet 2004, 364, 953–962. [Google Scholar] [CrossRef] [PubMed]
- Marmot, M.G.; Stansfeld, S.; Patel, C.; North, F.; Head, J.; White, I.; Brunner, E.; Feeney, A.; Marmot, M.G.; Smith, G.D. Health inequalities among British civil servants: The Whitehall II study. The Lancet 1991, 337, 1387–1393. [Google Scholar] [CrossRef]
- Malambo, P.; Kengne, A.P.; Villiers, A.D.; Lambert, E.V.; Puoane, T. Built Environment, Selected Risk Factors and Major Cardiovascular Disease Outcomes: A Systematic Review. PLoS ONE 2016, 11, e0166846. [Google Scholar] [CrossRef] [PubMed]
- Christine, P.J.; Auchincloss, A.H.; Bertoni, A.G.; Carnethon, M.R.; Sánchez, B.N.; Moore, K.; Adar, S.D.; Horwich, T.B.; Watson, K.E.; Diez Roux, A.V. Longitudinal Associations between Neighborhood Physical and Social Environments and Incident Type 2 Diabetes Mellitus: The Multi-Ethnic Study of Atherosclerosis (MESA). JAMA Intern. Med. 2015, 175, 1311–1320. [Google Scholar] [CrossRef] [PubMed]
- James, P.; Banay, R.F.; Hart, J.E.; Laden, F. A Review of the Health Benefits of Greenness. Curr. Epidemiol. Rep. 2015, 2, 131–142. [Google Scholar] [CrossRef] [PubMed]
- Yeager, R.; Riggs, D.W.; DeJarnett, N.; Tollerud, D.J.; Wilson, J.; Conklin, D.J.; O’Toole, T.E.; McCracken, J.; Lorkiewicz, P.; Xie, Z.; et al. Association between Residential Greenness and Cardiovascular Disease Risk. J. Am. Heart Assoc. 2018, 7, e009117. [Google Scholar] [CrossRef]
- Chandrabose, M.; Rachele, J.N.; Gunn, L.; Kavanagh, A.; Owen, N.; Turrell, G.; Giles-Corti, B.; Sugiyama, T. Built environment and cardio-metabolic health: Systematic review and meta-analysis of longitudinal studies. Obes. Rev. 2019, 20, 41–54. [Google Scholar] [CrossRef]
- Wu, Q.; Kling, J.M. Depression and the Risk of Myocardial Infarction and Coronary Death. Medicine 2016, 95, e2815. [Google Scholar] [CrossRef]
- Everson-Rose, S.A.; Lutsey, P.L.; Roetker, N.S.; Lewis, T.T.; Kershaw, K.N.; Alonso, A.; Diez Roux, A.V. Perceived Discrimination and Incident Cardiovascular Events: The Multi-Ethnic Study of Atherosclerosis. Am. J. Epidemiol. 2015, 182, 225–234. [Google Scholar] [CrossRef]
- Valtorta, N.K.; Kanaan, M.; Gilbody, S.; Hanratty, B. Loneliness, social isolation and risk of cardiovascular disease in the English Longitudinal Study of Ageing. Eur. J. Prev. Cardiol. 2018, 25, 1387–1396. [Google Scholar] [CrossRef]
- Deschênes, S.S.; Graham, E.; Kivimäki, M.; Schmitz, N. Adverse Childhood Experiences and the Risk of Diabetes: Examining the Roles of Depressive Symptoms and Cardiometabolic Dysregulations in the Whitehall II Cohort Study. Diabetes Care 2018, 41, 2120–2126. [Google Scholar] [CrossRef]
- Stewart, R.A.H.; Colquhoun, D.M.; Marschner, S.L.; Kirby, A.C.; Simes, J.; Nestel, P.J.; Glozier, N.; O’Neil, A.; Oldenburg, B.; White, H.D.; et al. Persistent psychological distress and mortality in patients with stable coronary artery disease. Heart 2017, 103, 1860–1866. [Google Scholar] [CrossRef]
- Everson-Rose, S.A.; Roetker, N.S.; Lutsey, P.L.; Kershaw, K.N.; Longstreth, W.T.; Sacco, R.L.; Diez Roux, A.V.; Alonso, A. Chronic Stress, Depressive Symptoms, Anger, Hostility, and Risk of Stroke and Transient Ischemic Attack in the Multi-Ethnic Study of Atherosclerosis. Stroke 2014, 45, 2318–2323. [Google Scholar] [CrossRef] [PubMed]
- Öhlin, B.; Nilsson, P.M.; Nilsson, J.-Å.; Berglund, G. Chronic psychosocial stress predicts long-term cardiovascular morbidity and mortality in middle-aged men. Eur. Heart J. 2004, 25, 867–873. [Google Scholar] [CrossRef] [PubMed]
- Demakakos, P.; Biddulph, J.P.; de Oliveira, C.; Tsakos, G.; Marmot, M.G. Subjective social status and mortality: The English Longitudinal Study of Ageing. Eur. J. Epidemiol. 2018, 33, 729–739. [Google Scholar] [CrossRef] [PubMed]
- Kivimäki, M.; Pentti, J.; Ferrie, J.E.; Batty, G.D.; Nyberg, S.T.; Jokela, M.; Virtanen, M.; Alfredsson, L.; Dragano, N.; Fransson, E.I.; et al. Work stress and risk of death in men and women with and without cardiometabolic disease: A multicohort study. Lancet Diabetes Endocrinol. 2018, 6, 705–713. [Google Scholar] [CrossRef]
- Addison, D.; Branch, M.; Baik, A.H.; Fradley, M.G.; Okwuosa, T.; Reding, K.W.; Simpson, K.E.; Suero-Abreu, G.A.; Yang, E.H.; Yancy, C.W.; et al. Equity in Cardio-Oncology Care and Research: A Scientific Statement From the American Heart Association. Circulation 2023, 148, 297–308. [Google Scholar] [CrossRef] [PubMed]


| Patients Diagnosed with Breast Cancer | |
|---|---|
| University Hospitals (UH), 2010–2020 | |
| n = 4309 | |
| Age at diagnosis—median (IQR) | 63 (53–72) |
| Race/ethnicity—n (%) | |
| non-Hispanic Black | 765 (17.7) |
| non-Hispanic White | 3321 (77.1) |
| Other | 223 (5.2) |
| Stage—n (%) | |
| III–IV | 326 (7.5) |
| Histology—n (%) | |
| Ductal | 2121 (49.2) |
| ER+—n (%) | 1936 (44.9) |
| PR+—n (%) | 1732 (40.2) |
| HER2+—n (%) | 90 (2.1) |
| Smoking status—n (%) | |
| Smoker | 303 (7) |
| Former smoker | 9897 (22.9) |
| Never smoker | 2182 (50.6) |
| Unknown | 837 (19.4) |
| Charlson comorbidity score—median (IQR) | 4 (2–7) |
| Cardiovascular history/risk factor—n (%) | 3123 (74.6) |
| Cardiomyopathy | 230 (5.3) |
| Coronary artery disease (CAD) | 775 (18) |
| Myocardial infarction (MI) | 261 (6.1) |
| Carotid disease (CD) | 141 (3.3) |
| Transient ischemic attack (TIA)/Stroke | 67 (1.6) |
| Chronic kidney disease (CKD) | 536 (12.4) |
| Dyslipidemia | 2285 (5.3) |
| Diagnosis per patient—median (IQR) | 2 (0–2) |
| Surgery—n (%) | |
| Mastectomy | 792 (18.4) |
| Lumpectomy | 964 (22.4) |
| Chemotherapy (C)—n (%) | 1213 (28.2) |
| Radiotherapy (R)—n (%) | 1699 (39.4) |
| Left | 401 (9.3) |
| Right | 436 (10.1) |
| Immunotherapy (I)—n (%) | 204 (4.7) |
| Endocrine therapy (E)—n (%) | 1982 (46) |
| Combined therapy—n (%) | |
| C + R | 761 (17.7) |
| I + R | 123 (2.9) |
| H + C + R | 459 (10.7) |
| H + C + R + I | 61 (1.4) |
| % appointments attended—median (IQR) | 66.6 (50–81.8) |
| Hyperparameters | Performance (C-Index) | ||
|---|---|---|---|
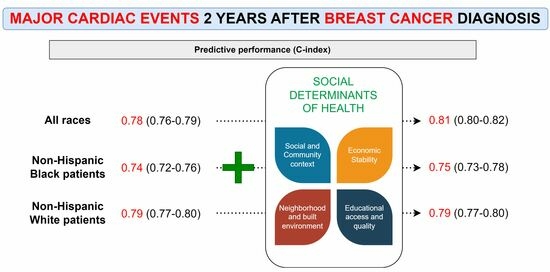
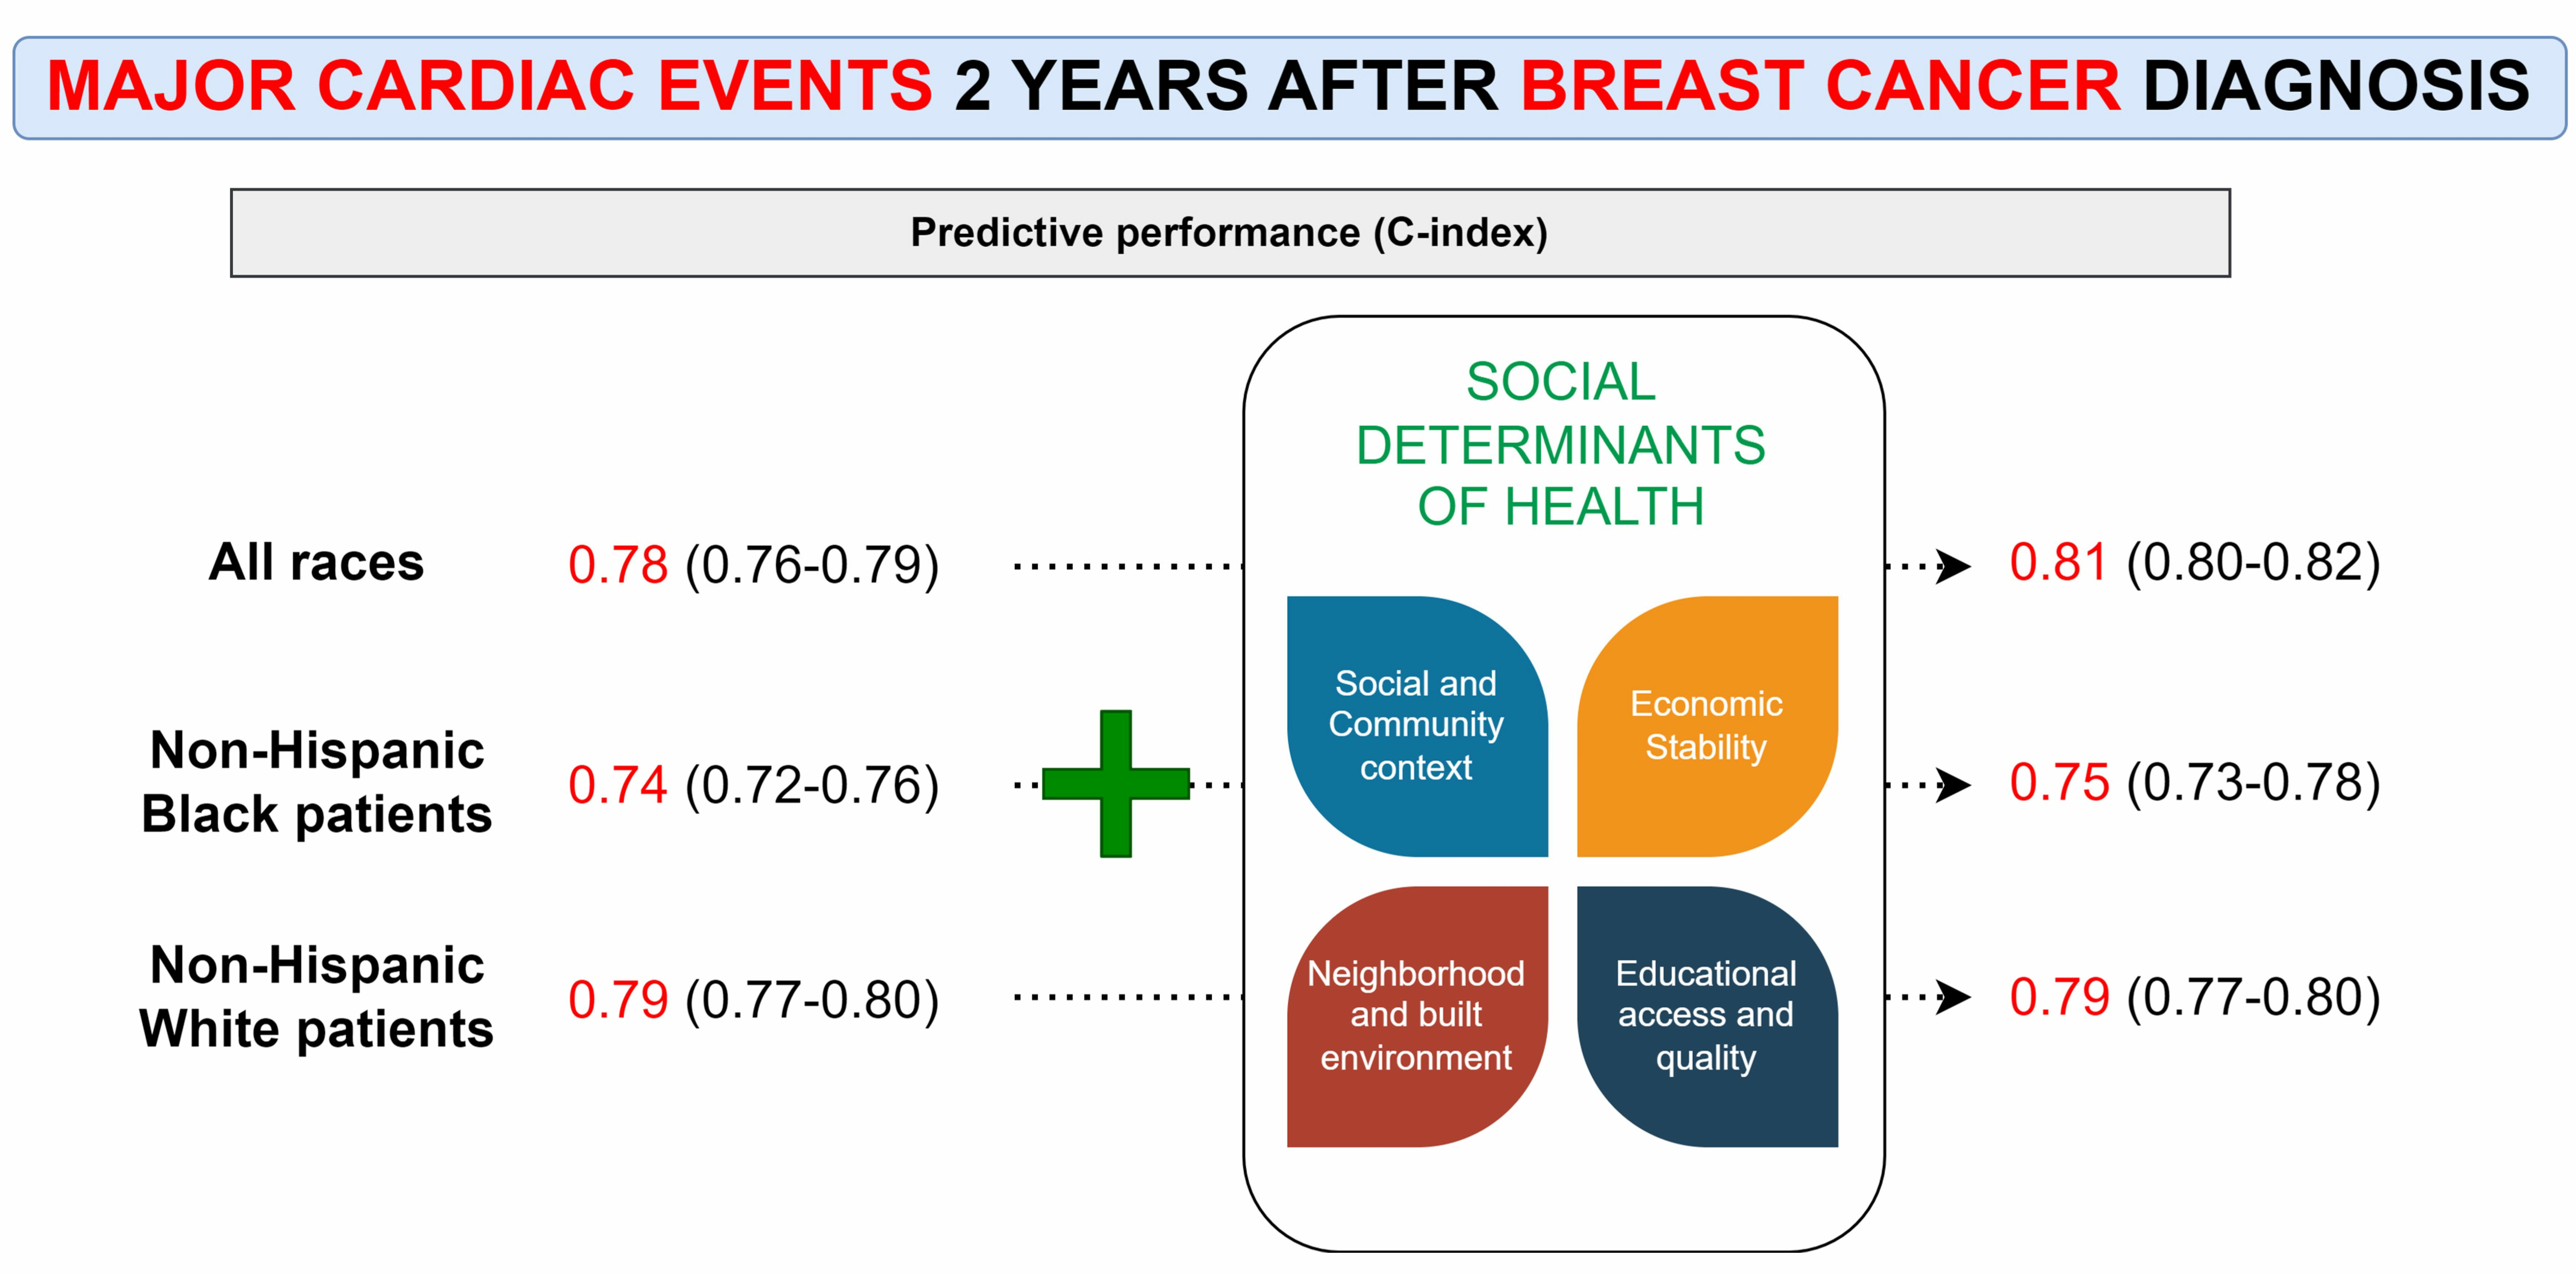
| Race-agnostic | Without SDOH data | nrounds = 2050; nthread = 10; verbose = 0; eta = 0.02715107; max_depth = 9; min_child_weight = 2.886243; gamma = 3.93808; subsample = 0.9668632; colsample_bytree = 0.9550104 | 0.78 (0.76–0.79) |
| With SDOH data | nrounds = 50; nthread = 8; verbose = 0; eta = 0.1013887; max_depth = 1; min_child_weight = 2.971928; gamma = 3.337559; subsample = 0.804832; colsample_bytree = 0.97875 | 0.81 (0.80–0.82) | |
| NHB | Without SDOH data | nrounds = 50; nthread = 14; verbose = 0; eta = 0.02364827; max_depth = 1; min_child_weight = 2.62171; gamma = 4.533674; subsample = 0.9894932; colsample_bytree = 0.6737331 | 0.74 (0.72–0.76) |
| With SDOH data | nrounds = 50; nthread = 16; verbose = 0; eta = 0.04240374; max_depth = 4; min_child_weight = 7.789127; gamma = 4.256919; subsample = 0.9581859; colsample_bytree = 0.6278961 | 0.75 (0.73–0.78) | |
| NHW | Without SDOH data | nrounds = 50; nthread = 4; verbose = 0; eta = 0.03734001; max_depth = 2; min_child_weight = 2.380759; gamma = 4.503645; subsample = 0.8980231; colsample_bytree = 0.8306106 | 0.79 (0.77–0.80) |
| With SDOH data | nrounds = 4050; nthread = 14; verbose = 0; eta = 0.06144029; max_depth = 2; min_child_weight = 0.1104873; gamma = 2.937595; subsample = 0.999557; colsample_bytree = 0.8240068 | 0.79 (0.77–0.80) |
Disclaimer/Publisher’s Note: The statements, opinions and data contained in all publications are solely those of the individual author(s) and contributor(s) and not of MDPI and/or the editor(s). MDPI and/or the editor(s) disclaim responsibility for any injury to people or property resulting from any ideas, methods, instructions or products referred to in the content. |
© 2023 by the authors. Licensee MDPI, Basel, Switzerland. This article is an open access article distributed under the terms and conditions of the Creative Commons Attribution (CC BY) license (https://creativecommons.org/licenses/by/4.0/).
Share and Cite
Stabellini, N.; Cullen, J.; Moore, J.X.; Dent, S.; Sutton, A.L.; Shanahan, J.; Montero, A.J.; Guha, A. Social Determinants of Health Data Improve the Prediction of Cardiac Outcomes in Females with Breast Cancer. Cancers 2023, 15, 4630. https://doi.org/10.3390/cancers15184630
Stabellini N, Cullen J, Moore JX, Dent S, Sutton AL, Shanahan J, Montero AJ, Guha A. Social Determinants of Health Data Improve the Prediction of Cardiac Outcomes in Females with Breast Cancer. Cancers. 2023; 15(18):4630. https://doi.org/10.3390/cancers15184630
Chicago/Turabian StyleStabellini, Nickolas, Jennifer Cullen, Justin X. Moore, Susan Dent, Arnethea L. Sutton, John Shanahan, Alberto J. Montero, and Avirup Guha. 2023. "Social Determinants of Health Data Improve the Prediction of Cardiac Outcomes in Females with Breast Cancer" Cancers 15, no. 18: 4630. https://doi.org/10.3390/cancers15184630
APA StyleStabellini, N., Cullen, J., Moore, J. X., Dent, S., Sutton, A. L., Shanahan, J., Montero, A. J., & Guha, A. (2023). Social Determinants of Health Data Improve the Prediction of Cardiac Outcomes in Females with Breast Cancer. Cancers, 15(18), 4630. https://doi.org/10.3390/cancers15184630