
Early Changes in Quantitative Ultrasound Imaging Parameters during Neoadjuvant Chemotherapy to Predict Recurrence in Patients with Locally Advanced Breast Cancer

 ,
,  ,
, 
Abstract
Simple Summary
Abstract

1. Introduction
2. Material and Methods
2.1. Patient Selection
2.2. Treatment Details
2.3. Quantitative Ultrasound Parameter Estimation
2.4. Texture Features and Texture Derivatives Evaluation
2.5. Statistical Analysis and Classification Algorithms
3. Results
3.1. Clinical Characteristics
3.2. Quantitative Ultrasound Feature Analysis
3.3. Classifier Results
3.4. Clinical Outcomes and Performance of Prediction Models
4. Discussion
5. Conclusions
Supplementary Materials
Author Contributions
Funding
Institutional Review Board Statement
Informed Consent Statement
Data Availability Statement
Acknowledgments
Conflicts of Interest
References
- Bray, F.; Ferlay, J.; Soerjomataram, I.; Siegel, R.L.; Torre, L.A.; Jemal, A. Global Cancer Statistics 2018: GLOBOCAN Estimates of Incidence and Mortality Worldwide for 36 Cancers in 185 Countries. CA A Cancer J. Clin. 2018, 68, 394–424. [Google Scholar] [CrossRef] [PubMed]
- Tryfonidis, K.; Senkus, E.; Cardoso, M.J.; Cardoso, F. Management of Locally Advanced Breast Cancer-Perspectives and Future Directions. Nat. Rev. Clin. Oncol. 2015, 12, 147–162. [Google Scholar] [CrossRef] [PubMed]
- Wang, M.; Hou, L.; Chen, M.; Zhou, Y.; Liang, Y.; Wang, S.; Jiang, J.; Zhang, Y. Neoadjuvant Chemotherapy Creates Surgery Opportunities For Inoperable Locally Advanced Breast Cancer. Sci. Rep. 2017, 7, 44673. [Google Scholar] [CrossRef] [PubMed]
- Vaidya, J.S.; Massarut, S.; Vaidya, H.J.; Alexander, E.C.; Richards, T.; Caris, J.A.; Sirohi, B.; Tobias, J.S. Rethinking Neoadjuvant Chemotherapy for Breast Cancer. BMJ 2018, 360, j5913. [Google Scholar] [CrossRef]
- Ziner, K.W.; Sledge, G.W.; Bell, C.J.; Johns, S.; Miller, K.D.; Champion, V.L. Predicting Fear of Breast Cancer Recurrence and Self-Efficacy in Survivors by Age at Diagnosis. Oncol. Nurs. Forum 2012, 39, 287–295. [Google Scholar] [CrossRef]
- Van’t Veer, L.J.; Dai, H.; Van de Vijver, M.J.; He, Y.D.; Hart, A.A.M.; Mao, M.; Peterse, H.L.; Van Der Kooy, K.; Marton, M.J.; Witteveen, A.T.; et al. Gene Expression Profiling Predicts Clinical Outcome of Breast Cancer. Nature 2002, 415, 530–536. [Google Scholar] [CrossRef]
- Sparano, J.A.; Gray, R.J.; Makower, D.F.; Pritchard, K.I.; Albain, K.S.; Hayes, D.F.; Geyer, C.E.; Dees, E.C.; Goetz, M.P.; Olson, J.A.; et al. Adjuvant Chemotherapy Guided by a 21-Gene Expression Assay in Breast Cancer. N. Engl. J. Med. 2018, 379, 111–121. [Google Scholar] [CrossRef]
- Sparano, J.A.; Gray, R.J.; Makower, D.F.; Albain, K.S.; Saphner, T.J.; Badve, S.S.; Wagner, L.I.; Kaklamani, V.G.; Keane, M.M.; Gomez, H.L.; et al. Clinical Outcomes in Early Breast Cancer with a High 21-Gene Recurrence Score of 26 to 100 Assigned to Adjuvant Chemotherapy Plus Endocrine Therapy: A Secondary Analysis of the TAILORx Randomized Clinical Trial. JAMA Oncol. 2020, 6, 367–374. [Google Scholar] [CrossRef]
- Tagliafico, A.S.; Piana, M.; Schenone, D.; Lai, R.; Massone, A.M.; Houssami, N. Overview of Radiomics in Breast Cancer Diagnosis and Prognostication. Breast 2020, 49, 74–80. [Google Scholar] [CrossRef]
- Czarnota, G.J.; Kolios, M.C.; Abraham, J.; Portnoy, M.; Ottensmeyer, F.P.; Hunt, J.W.; Sherar, M.D. Ultrasound Imaging of Apoptosis: High-Resolution Non-Invasive Monitoring of Programmed Cell Death In Vitro, In Situ and In Vivo. Br. J. Cancer 1999, 81, 520–527. [Google Scholar] [CrossRef]
- Feleppa, E.J.; Mamou, J.; Porter, C.R.; Machi, J. Quantitative Ultrasound in Cancer Imaging. Semin. Oncol. 2011, 38, 136–150. [Google Scholar] [CrossRef]
- Dasgupta, A.; Brade, S.; Sannachi, L.; Quiaoit, K.; Fatima, K.; DiCenzo, D.; Osapoetra, L.O.; Saifuddin, M.; Trudeau, M.; Gandhi, S.; et al. Quantitative Ultrasound Radiomics Using Texture Derivatives in Prediction of Treatment Response to Neo-Adjuvant Chemotherapy for Locally Advanced Breast Cancer. Oncotarget 2020, 11, 3782–3792. [Google Scholar] [CrossRef]
- Osapoetra, L.O.; Sannachi, L.; Quiaoit, K.; Dasgupta, A.; DiCenzo, D.; Fatima, K.; Wright, F.; Dinniwell, R.; Trudeau, M.; Gandhi, S.; et al. A Priori Prediction of Response in Multicentre Locally Advanced Breast Cancer (LABC) Patients Using Quantitative Ultrasound and Derivative Texture Methods. Oncotarget 2021, 12, 81–94. [Google Scholar] [CrossRef]
- DiCenzo, D.; Quiaoit, K.; Fatima, K.; Bhardwaj, D.; Sannachi, L.; Gangeh, M.; Sadeghi-Naini, A.; Dasgupta, A.; Kolios, M.C.; Trudeau, M.; et al. Quantitative Ultrasound Radiomics in Predicting Response to Neoadjuvant Chemotherapy in Patients with Locally Advanced Breast Cancer: Results from Multi-Institutional Study. Cancer Med. 2020, 9, 5798–5806. [Google Scholar] [CrossRef]
- Dasgupta, A.; Fatima, K.; DiCenzo, D.; Bhardwaj, D.; Quiaoit, K.; Saifuddin, M.; Karam, I.; Poon, I.; Husain, Z.; Tran, W.T.; et al. Quantitative Ultrasound Radiomics in Predicting Recurrence for Patients with Node-Positive Head-Neck Squamous Cell Carcinoma Treated with Radical Radiotherapy. Cancer Med. 2020, 10, 2579–2589. [Google Scholar] [CrossRef]
- Osapoetra, L.O.; Dasgupta, A.; DiCenzo, D.; Fatima, K.; Quiaoit, K.; Saifuddin, M.; Karam, I.; Poon, I.; Husain, Z.; Tran, W.T.; et al. Assessment of Clinical Radiosensitivity in Patients with Head-Neck Squamous Cell Carcinoma from Pre-Treatment Quantitative Ultrasound Radiomics. Sci. Rep. 2021, 11, 6117. [Google Scholar] [CrossRef]
- Quiaoit, K.; DiCenzo, D.; Fatima, K.; Bhardwaj, D.; Sannachi, L.; Gangeh, M.; Sadeghi-Naini, A.; Dasgupta, A.; Kolios, M.C.; Trudeau, M.; et al. Quantitative Ultrasound Radiomics for Therapy Response Monitoring in Patients with Locally Advanced Breast Cancer: Multi-Institutional Study Results. PLoS ONE 2020, 15, e0236182. [Google Scholar] [CrossRef]
- Fatima, K.; Dasgupta, A.; DiCenzo, D.; Kolios, C.; Quiaoit, K.; Saifuddin, M.; Sandhu, M.; Bhardwaj, D.; Karam, I.; Poon, I.; et al. Ultrasound Delta-Radiomics during Radiotherapy to Predict Recurrence in Patients with Head and Neck Squamous Cell Carcinoma. Clin. Transl. Radiat. Oncol. 2021, 28, 62–70. [Google Scholar] [CrossRef]
- Tadayyon, H.; Sadeghi-Naini, A.; Czarnota, G.J. Noninvasive Characterization of Locally Advanced Breast Cancer Using Textural Analysis of Quantitative Ultrasound Parametric Images. Transl. Oncol. 2014, 7, 759–767. [Google Scholar] [CrossRef]
- Lizzi, F.L.; Feleppa, E.J.; Kaisar Alam, S.; Deng, C.X. Ultrasonic Spectrum Analysis for Tissue Evaluation. Pattern Recognit. Lett. 2003, 24, 637–658. [Google Scholar] [CrossRef]
- Insana, M.F.; Hall, T.J. Parametric ultrasound imaging from backscatter coefficient measurements: Image formation and interpretation. Ultrason. Imaging 1990, 12, 245–267. [Google Scholar] [CrossRef]
- Labyed, Y.; Bigelow, T.A. A Theoretical Comparison of Attenuation Measurement Techniques from Backscattered Ultrasound Echoes. J. Acoust. Soc. Am. 2011, 129, 2316–2324. [Google Scholar] [CrossRef] [PubMed]
- Tro, I.N.; Tion, D.U.C. Application of Three Scattering Models to Characterization of Solid Tumors in Mice. Ultrason. Imaging 2015, 96, 83–96. [Google Scholar]
- Haralick, R.M.; Shanmugam, K.; Dinstein, I. Textural Features for Image Classification. IEEE Trans. Syst. Man Cybern. 1973, SMC-3, 610–621. [Google Scholar] [CrossRef]
- Jain, A.K.; Duin, R.P.W.; Mao, J. Statistical Pattern Recognition: A Review. IEEE Trans. Pattern Anal. Mach. Intell. 2000, 22, 4–37. [Google Scholar] [CrossRef]
- Dowsett, M.; Sestak, I.; Regan, M.M.; Dodson, A.; Viale, G.; Thurlimann, B.; Colleoni, M.; Cuzick, J. Integration of Clinical Variables for the Prediction of Late Distant Recurrence in Patients with Estrogen Receptor-Positive Breast Cancer Treated with 5 Years of Endocrine Therapy: CTS5. J. Clin. Oncol. 2018, 36, 1941–1948. [Google Scholar] [CrossRef] [PubMed]
- Paik, S.; Shak, S.; Tang, G.; Kim, C.; Baker, J.; Cronin, M.; Baehner, F.L.; Walker, M.G.; Watson, D.; Park, T.; et al. A Multigene Assay to Predict Recurrence of Tamoxifen-Treated, Node-Negative Breast Cancer. N. Engl. J. Med. 2004, 351, 2817–2826. [Google Scholar] [CrossRef]
- Prat, A.; Parker, J.S.; Fan, C.; Perou, C.M. PAM50 Assay and the Three-Gene Model for Identifying the Major and Clinically Relevant Molecular Subtypes of Breast Cancer. Breast Cancer Res. Treat. 2012, 135, 301–306. [Google Scholar] [CrossRef]
- Sutton, E.J.; Oh, J.H.; Dashevsky, B.Z.; Veeraraghavan, H.; Apte, A.P.; Thakur, S.B.; Deasy, J.O.; Morris, E.A. Breast Cancer Subtype Intertumor Heterogeneity: MRI-Based Features Predict Results of a Genomic Assay. J. Magn. Reson. Imaging 2015, 42, 1398–1406. [Google Scholar] [CrossRef]
- Woodard, G.A.; Ray, K.M.; Joe, B.N.; Price, E.R. Qualitative Radiogenomics: Association between Oncotype DX Test Recurrence Score and BI-RADS Mammographic and Breast MR Imaging Features. Radiology 2018, 286, 60–70. [Google Scholar] [CrossRef]
- Guo, R.; Lu, G.; Qin, B.; Fei, B. Ultrasound Imaging Technologies for Breast Cancer Detection and Management: A Review. Ultrasound Med. Biol. 2018, 44, 37–70. [Google Scholar] [CrossRef] [PubMed]
- Sadeghi-Naini, A.; Sannachi, L.; Pritchard, K.; Trudeau, M.; Gandhi, S.; Wright, F.C.; Zubovits, J.; Yaffe, M.J.; Kolios, M.C.; Czarnota, G.J. Early Prediction of Therapy Responses and Outcomes in Breast Cancer Patients Using Quantitative Ultrasound Spectral Texture. Oncotarget 2014, 5, 3497–3511. [Google Scholar] [CrossRef] [PubMed]
- Pasternak, M.M.; Wirtzfeld, L.A.; Kolios, M.C.; Czarnota, G.J. High-Frequency Ultrasound Analysis of Post-Mitotic Arrest Cell Death. Oncoscience 2016, 3, 109–121. [Google Scholar] [CrossRef] [PubMed][Green Version]
- Pasternak, M.M.; Sadeghi-Naini, A.; Ranieri, S.M.; Giles, A.; Oelze, M.L.; Kolios, M.C.; Czarnota, G.J. High-Frequency Ultrasound Detection of Cell Death: Spectral Differentiation of Different Forms of Cell Death in Vitro. Oncoscience 2016, 3, 275–287. [Google Scholar] [CrossRef] [PubMed][Green Version]
- Sannachi, L.; Gangeh, M.; Tadayyon, H.; Gandhi, S.; Wright, F.C.; Slodkowska, E.; Curpen, B.; Sadeghi-Naini, A.; Tran, W.; Czarnota, G.J. Breast Cancer Treatment Response Monitoring Using Quantitative Ultrasound and Texture Analysis: Comparative Analysis of Analytical Models. Transl. Oncol. 2019, 12, 1271–1281. [Google Scholar] [CrossRef]
- Dasgupta, A.; Bhardwaj, D.; DiCenzo, D.; Fatima, K.; Osapoetra, L.O.; Quiaoit, K.; Saifuddin, M.; Brade, S.; Trudeau, M.; Gandhi, S.; et al. Radiomics in Predicting Recurrence for Patients with Locally Advanced Breast Cancer Using Quantitative Ultrasound. Oncotarget 2021, 12, 2437–2448. [Google Scholar] [CrossRef]
- D’Astous, F.T.; Foster, F.S. Frequency Dependence of Ultrasound Attenuation and Backscatter in Breast Tissue. Ultrasound Med. Biol. 1986, 12, 795–808. [Google Scholar] [CrossRef]
- Landini, L.; Sarnelli, R. Evaluation of the Attenuation Coefficients in Normal and Pathological Breast Tissue. Med. Biol. Eng. Comput. 1986, 24, 243–247. [Google Scholar] [CrossRef]


| Features | Recurrence (n = 28) | Non-Recurrence (n = 55) | |||
|---|---|---|---|---|---|
| Patient Characteristics | n | % | n | % | |
| Age | Median (Range) | 50 (29–79) years | 48 (31–72) years | ||
| Menopausal Status | Premenopausal | 16 | 57 | 33 | 60 |
| Perimenopausal | 1 | 4 | 3 | 6 | |
| Postmenopausal | 10 | 36 | 17 | 31 | |
| Not specified | 1 | 4 | 2 | 4 | |
| Laterality | Right | 15 | 54 | 27 | 49 |
| Left | 13 | 46 | 28 | 51 | |
| Pathological features | n | % | n | % | |
| Histology | IDC | 25 | 89 | 51 | 93 |
| ILC | 2 | 7 | 1 | 2 | |
| Others | 1 | 4 | 3 | 5 | |
| HR+/HER2+ | 6 | 21 | 14 | 26 | |
| HR+/Her2− | 10 | 36 | 20 | 36 | |
| HR−/HER2+ | 4 | 14 | 5 | 9 | |
| TNBC | 8 | 29 | 16 | 29 | |
| Neoadjuvant Treatment | n | % | n | % | |
| Chemotherapy regimen | AC-T | 21 | 75 | 35 | 64 |
| FEC-D | 5 | 18 | 15 | 27 | |
| TC | 2 | 7 | 5 | 8 | |
| Dose Dense | No | 13 | 46 | 26 | 47 |
| Yes | 15 | 54 | 29 | 53 | |
| Trastuzumab | No | 18 | 64 | 36 | 66 |
| Yes | 10 | 36 | 19 | 34 | |
| Treatment Response | n | % | n | % | |
| Pathological Complete Response (pCR) | 0 | 0 | 16 | 29 | |
| Partial Responder (PR) | 21 | 75 | 33 | 60 | |
| Non Responder (NR) | 7 | 25 | 6 | 11 | |
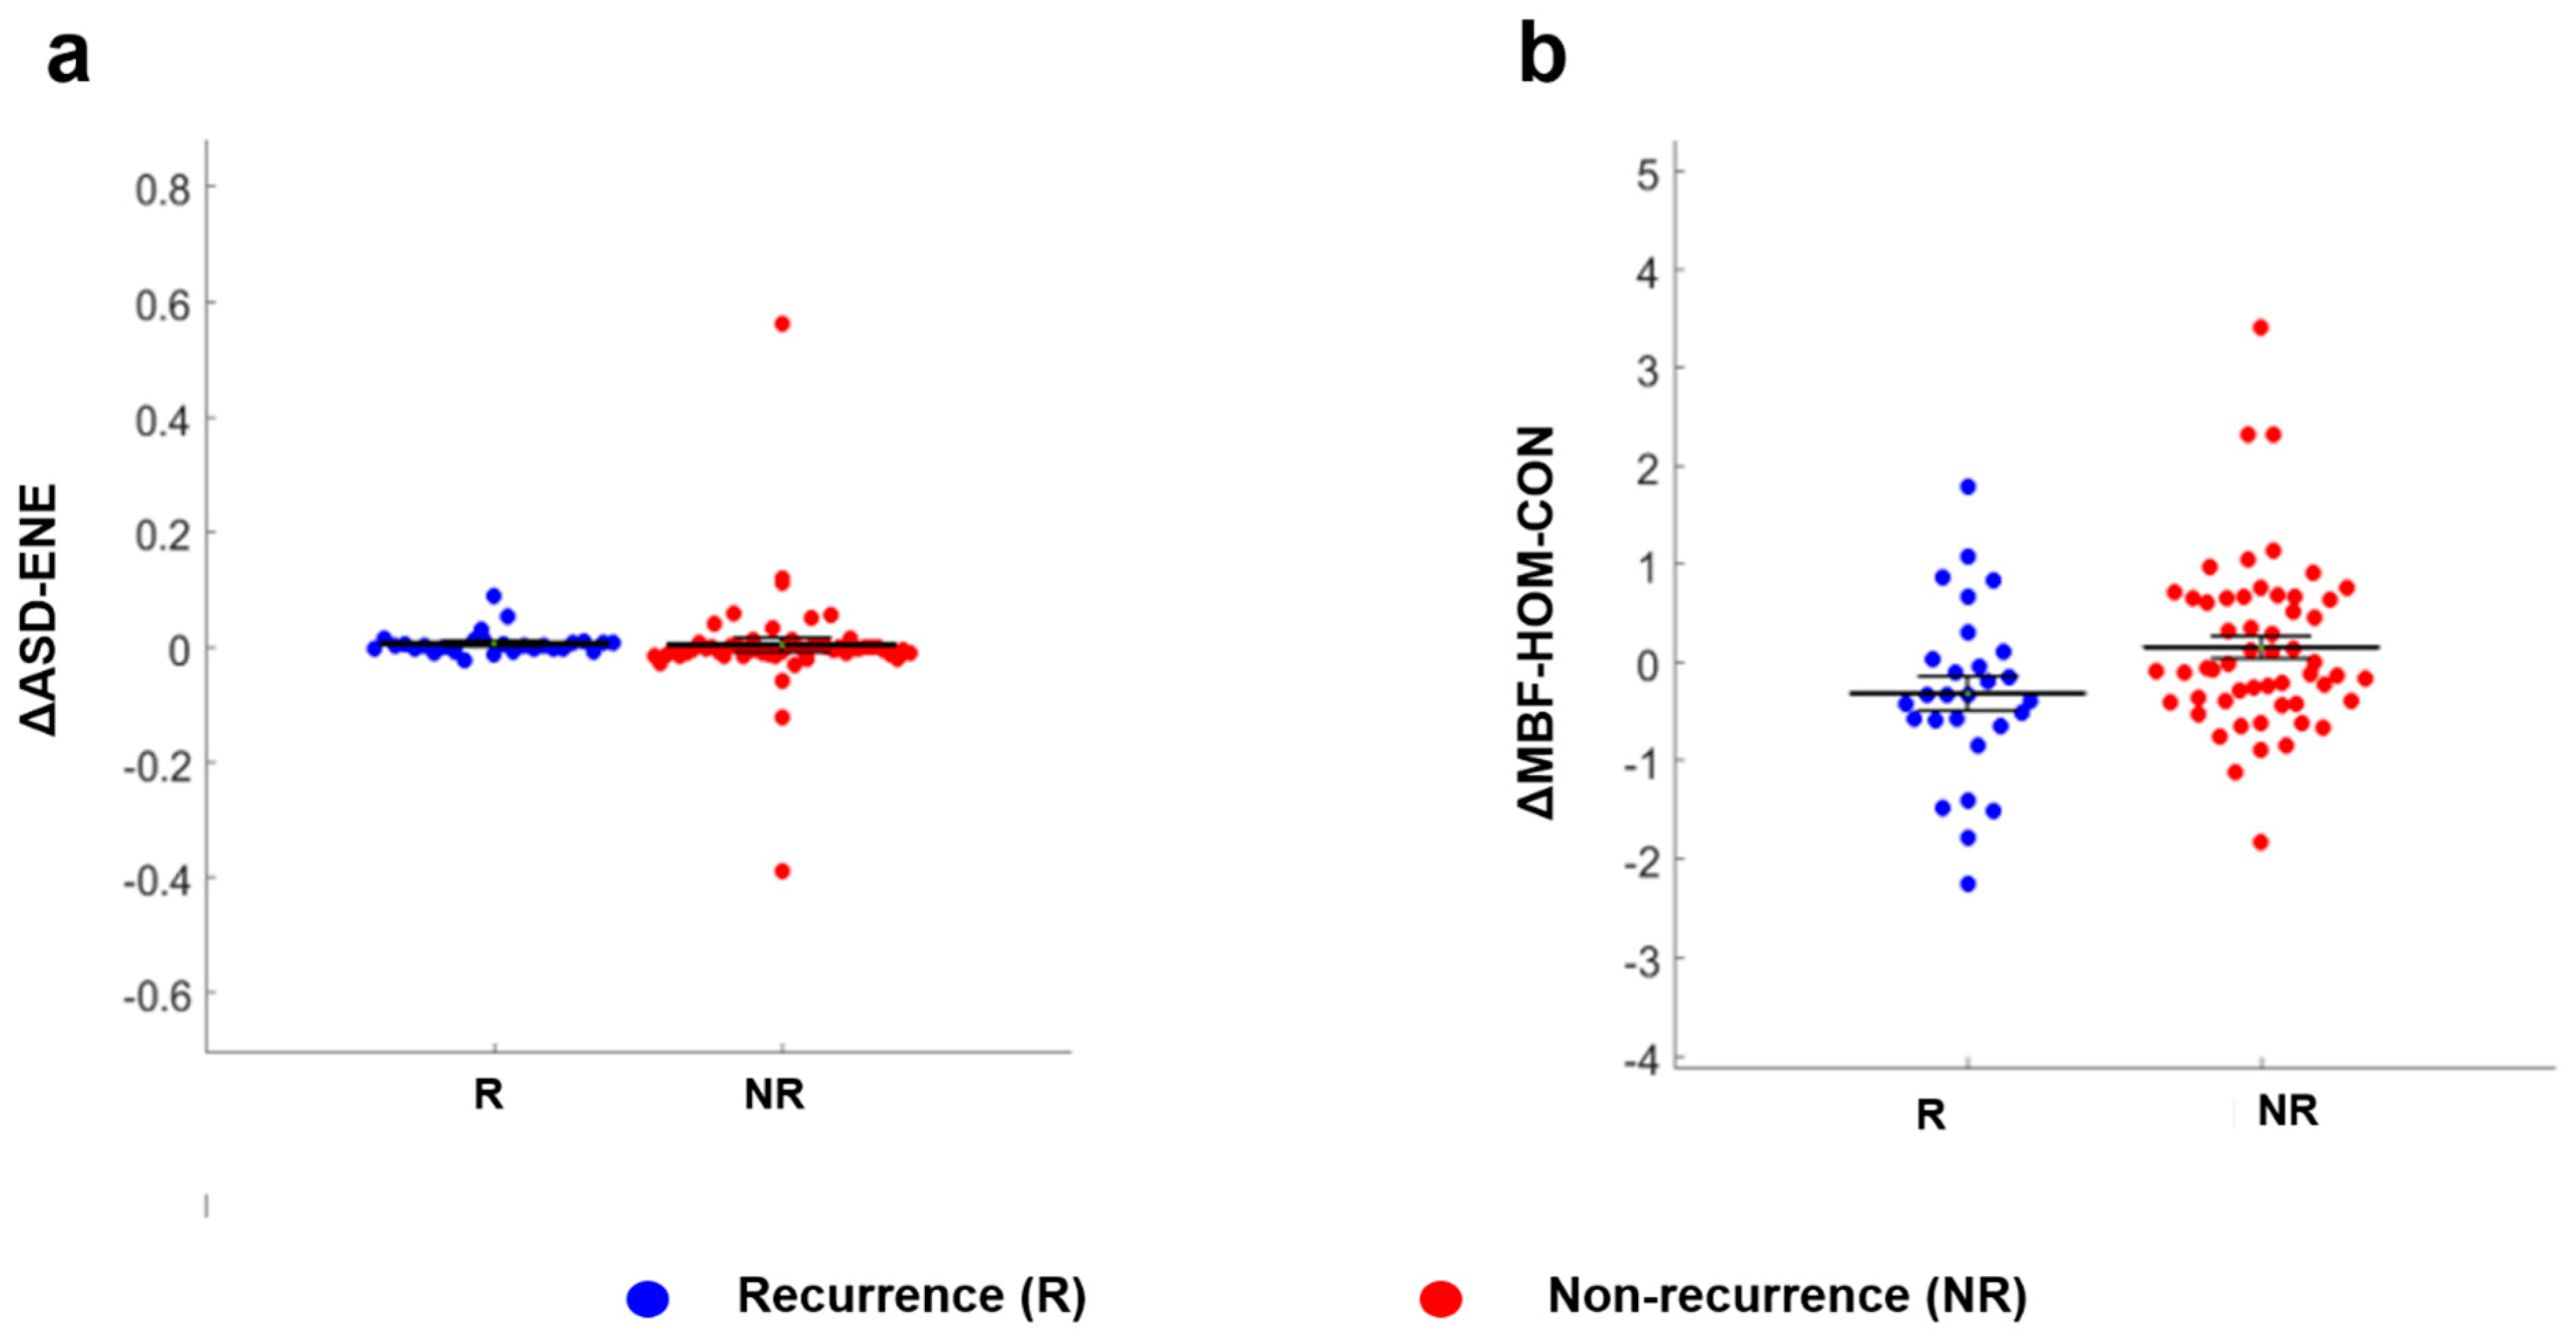
| Parameter | Recurrence Mean ± SEM | Non-Recurrence Mean ± SEM | p-Value |
|---|---|---|---|
| ∆ASD-ENE | 0.008 ± 0.021 | 0.005 ± 0.099 | 0.033 |
| ∆MBF-HOM-CON | −0.306 ± 0.889 | 0.160 ± 0.867 | 0.038 |
| Classification Performance | Model | %Sn | %Sp | %Acc | AUC | Selected Feature(s) |
|---|---|---|---|---|---|---|
| First and second-order (QUS + QUS-Tex1) | k-NN | 73 (61–83) | 64 (52–75) | 74 (63–85) | 0.70 (0.59–0.79) | ΔSAS ΔASD-ENE ASD-CONW0 |
| SVM | 74 (64–83) | 86 (77–95) | 84 (72–95) | 0.78 (0.66–0.89) | SASW0 ASD-CONW0 ΔAAC-HOM | |
| All features (QUS + QUS-Tex1 + QUS-Tex1-Tex2) | k-NN | 87 (78–95) | 75 (64–85) | 81 (70–93) | 0.83 (0.73–0.92) | ACEW0 AAC-CON-CONW0 ΔASD-CON-CON |
| SVM | 75 (62–87) | 85 (72–96) | 85 (73–97) | 0.78 (0.68–0.88) | SASW0 ASD-CONW0 ΔAAC-HOM |
Publisher’s Note: MDPI stays neutral with regard to jurisdictional claims in published maps and institutional affiliations. |
© 2022 by the authors. Licensee MDPI, Basel, Switzerland. This article is an open access article distributed under the terms and conditions of the Creative Commons Attribution (CC BY) license (https://creativecommons.org/licenses/by/4.0/).
Share and Cite
Bhardwaj, D.; Dasgupta, A.; DiCenzo, D.; Brade, S.; Fatima, K.; Quiaoit, K.; Trudeau, M.; Gandhi, S.; Eisen, A.; Wright, F.; et al. Early Changes in Quantitative Ultrasound Imaging Parameters during Neoadjuvant Chemotherapy to Predict Recurrence in Patients with Locally Advanced Breast Cancer. Cancers 2022, 14, 1247. https://doi.org/10.3390/cancers14051247
Bhardwaj D, Dasgupta A, DiCenzo D, Brade S, Fatima K, Quiaoit K, Trudeau M, Gandhi S, Eisen A, Wright F, et al. Early Changes in Quantitative Ultrasound Imaging Parameters during Neoadjuvant Chemotherapy to Predict Recurrence in Patients with Locally Advanced Breast Cancer. Cancers. 2022; 14(5):1247. https://doi.org/10.3390/cancers14051247
Chicago/Turabian StyleBhardwaj, Divya, Archya Dasgupta, Daniel DiCenzo, Stephen Brade, Kashuf Fatima, Karina Quiaoit, Maureen Trudeau, Sonal Gandhi, Andrea Eisen, Frances Wright, and et al. 2022. "Early Changes in Quantitative Ultrasound Imaging Parameters during Neoadjuvant Chemotherapy to Predict Recurrence in Patients with Locally Advanced Breast Cancer" Cancers 14, no. 5: 1247. https://doi.org/10.3390/cancers14051247
APA StyleBhardwaj, D., Dasgupta, A., DiCenzo, D., Brade, S., Fatima, K., Quiaoit, K., Trudeau, M., Gandhi, S., Eisen, A., Wright, F., Look-Hong, N., Curpen, B., Sannachi, L., & Czarnota, G. J. (2022). Early Changes in Quantitative Ultrasound Imaging Parameters during Neoadjuvant Chemotherapy to Predict Recurrence in Patients with Locally Advanced Breast Cancer. Cancers, 14(5), 1247. https://doi.org/10.3390/cancers14051247