

Association between Energy Balance-Related Factors and Clinical Outcomes in Patients with Ovarian Cancer: A Systematic Review and Meta-Analysis

 , , , , , ,
Abstract
Simple Summary
Abstract
1. Introduction
2. Materials and Methods
2.1. Search Strategy and Study Selection
2.2. Data Extraction
2.3. Risk of Bias
2.4. Best-Evidence Synthesis and Meta-Analysis
3. Results
3.1. Study Selection
3.2. Observational Studies

| Observational Studies | ||||||||
|---|---|---|---|---|---|---|---|---|
| Author Year | Country | Sample Size | Age (Years) (±SD or Range) | FIGO Stage (% of Patients) | Treatment (% of Patients) | Risk of Bias Assessment | Determinant | Outcome |
| Ansell 1993 [57] | South Africa | 127 | Median: 58 | IIIB-IV EOC | PDS followed by chemotherapy | Low | Weight change |
|
| Ataseven 2018 [58] | Germany | 323 | Median: 60 (21–89) | IIIB-IV EOC | PDS | Low | Muscle density Muscle mass |
|
| Aust 2015 [59] | Austria | 140 | Mean: 60 ± 13 | I-IV EOC | PDS followed by chemotherapy | Low | BMI Muscle density Muscle mass |
|
| Bacalbasa 2020 [60] | Romania | 80 | Median: 52.6 (24–83) | IIIC-IV EOC | PDS followed by chemotherapy (91.3%), NACT-IDS (8.7%) | Moderate | BMI |
|
| Backes 2011 [61] | USA | 187 | Mean: BMI < 25 = 57.2 ± 12.5 BMI 25–30 = 59.3 ± 9.7 BMI > 30 = 58.6 ± 8.8 | III-IV EOC, primary peritoneal or fallopian tube cancer | PDS followed by chemotherapy | Low | BMI |
|
| Bae 2014 [24] | Korea | 236 | Mean: BMI < 18.5 = 49 (29–76) BMI 18.5–22.9 = 51 (13–79) BMI 23–24.9 = 65 (24–76) BMI 25–29.9 = 69 (38–78) BMI ≥ 30 = 54 (35–76) | III-IV EOC | PDS followed by chemotherapy (98.3%), NACT-IDS (1.7%) | Low | BMI |
|
| Barrett 2008 [62] | Scotland | 1077 (survival analysis for 1067) | Median: 59 (19–85) | IC-IV OC or primary peritoneal cancer | PDS followed by chemotherapy (docetaxel-carboplatin, N = 537, or paclitaxel-carboplatin, N = 538) | Moderate | BMI |
|
| Bronger 2017 [63] | Germany | 128 | Median: 65 (33–85) | III-IV EOC | PDS followed by chemotherapy | Low | BMI Muscle mass and change |
|
| Bruno 2021 [64] | Brazil | 239 | Mean: 56.3 ± 11.4 | I-IV EOC | Chemotherapy | Low | Fat mass Muscle density Muscle mass |
|
| Califano 2013 [65] | Italy | 117 (BMI unknown for 10.3%) | Median: 56 (59–84) | I-II (9.4%), III-IV (90.6%) OC | PDS followed by chemotherapy | Low | BMI |
|
| Castro 2018 [20] | Brazil | 83 (BMI unknown for 1.2%) | 69.9% = ≤60 30.1% = >60 | III-IV OC | PDS followed by chemotherapy (51.8%), NACT-IDS (48.2%) | Low | BMI |
|
| Chae 2021 [66] | Korea | 82 | Median: 52 (18–83) | I-II OC | PDS followed by chemotherapy (91.5%), NACT-IDS (8.5%) | Low | Muscle mass |
|
| Chokshi 2022 [67] | USA | 90 | Mean: 63.13 ± 12.33 | III-IV OC, primary peritoneal or fallopian tube cancer | NACT | Moderate | BMI |
|
| Conrad 2018 [68] | USA | 102 | Mean: 55 ± 11 | III-IV EOC, primary peritoneal or fallopian tube cancer | PDS followed by chemotherapy | Low | Fat mass Muscle mass |
|
| Davis 2016 [69] | USA | 92 | Mean: BMI 18.5–24.9 = 58.7 BMI 25–29.9 = 55.8 BMI ≥ 30 = 59.4 | IIIC EOC, primary peritoneal or fallopian tube cancer | PDS followed by (intraperitoneal) chemotherapy | Low | BMI |
|
| Di Donato 2021 [70] | Italy | 263 | Mean: 55.2 ± 12.5 | III-IV OC | PDS followed by chemotherapy (61.2%), NACT-IDS (38.8%) | Low | BMI |
|
| Duska 2015 [18] | USA | 1873 | Patient not re-hospitalized = 59.8 Patients re-hospitalized = 62 | III-IV EOC, primary peritoneal or fallopian tube cancer | PDS followed by chemotherapy with or without BEV (NR) | Low | BMI |
|
| Element 2022 [56] | UK | 43 | Mean: Low VO2 max 68.34 ± 4.36 Normal VO2 max 61.76 ± 5.41 | III-IV OC | PDS followed by chemotherapy (N = 17), NACT-IDS (N = 26) | Low | VO2 max Anaerobic threshold |
|
| Fotopoulou 2011 [71] | Germany | 306 | Median: 58 (18–92) | I-IV EOC | PDS | Low | BMI |
|
| Hanna 2013 [72] | USA | 325 (BMI unknown for 9.8%) | Median: 60 (24–84) | III-IV EOC | PDS followed by chemotherapy | Low | BMI |
|
| Hawarden 2021 [73] | UK | 208 | Median: Survival < 100 days = 73 (37–84), Survival > 100 days = 67 (37–90) | I-IV OC | PDS followed by chemotherapy, NACT-IDS, best supportive care | Low | BMI |
|
| Hess 2007 [74] | USA | 645 | 44.3% = <55 28.5% = 55–64 27.2% = ≥65 | III EOC | PDS followed by chemotherapy | Low | Weight change |
|
| Heus 2021 [75] | Netherlands | 298 | Mean: 62 (21–91) | III-IV OC | PDS followed by chemotherapy, NACT-IDS (75.8%) | Low | Fat mass Muscle mass |
|
| Hew 2014 [76] | USA | 370 | Mean: BMI < 30 = 58.2 ± 12.2 BMI ≥ 30 = 57.3 ± 10.5 | I-II (39.2%), III-IV (59.2%), unstaged (1.6%) EOC | PDS followed by chemotherapy | Low | BMI |
|
| Huang 2020 [11] | Taiwan | 139 | Mean: 54.4 ± 10.3 | III EOC | PDS followed by chemotherapy | Low | Fat mass and change Muscle density and change Muscle mass and change |
|
| Inci 2021 [77] | Germany | 106 | Median: 57 (18–87) | I-IV OC | PDS followed by chemotherapy, NACT-IDS (N = 11) | Low | BMI |
|
| Jiang 2019 [48] | China | 160 | Median: 54 (28–73) | III-IV EOC, primary peritoneal or fallopian tube cancer | NACT-IDS | Low | BMI |
|
| Kanbergs 2020 [78] | USA | 507 | Mean: BMI ≥ 30 + NACT = 63.8 ± 9.5, BMI ≥ 30 + PDS = 61.8 ± 9.4 BMI < 30 + NACT 63.7 ± 10.6 BMI < 30 + PDS = 61.7 ± 10.8 | IIIC-IV EOV, primary peritoneal or fallopian tube cancer | NACT-IDS | Low | BMI |
|
| Kim 2014 [49] | Korea | 360 | Mean: 53.9 (18–80) | III-IV EOC, primary peritoneal or fallopian tube cancer | PDS followed by chemotherapy (84.2%), NACT-IDS 15.8% | Low | BMI and change |
|
| Kim 2020 [50] | Korea | 179 | Mean: 57.5 ± 11.3 | III-IV OC | PDS followed by chemotherapy (75.4%), NACT-IDS (24.6%) | Low | BMI Fat mass Muscle mass |
|
| Kim 2021 [51] | Korea | 208 | Mean: 54.4 ± 10.7 | I-IV OC, primary peritoneal or fallopian tube cancer | PDS followed by chemotherapy (82.2%), NACT-IDS (17.8%) | Low | BMI and change Fat mass and change Muscle mass and change |
|
| Kumar 2014 [4] | USA | 620 | Mean: 64.6 ± 11.4 | IIIC-IV EOC, primary peritoneal or fallopian tube cancer | PDS | Low | BMI |
|
| Kumar 2016 [19] | USA | 296 | Mean: 64.6 ± 10.6 | IIIC-IV EOC | PDS followed by (86.8%) or not followed by (3.4%) chemotherapy, unclear (9.8%) | Low | Muscle density Muscle mass |
|
| Lv 2019 [52] | China | 362 | Mean: 44.78 = ±9.17 only patients aged 35–55 included in analysis | I-IV OC | Surgery | Low | BMI |
|
| Mahdi 2016 [79] | USA | 2061 | 47% = 0–59 28% = 60–69 18% = 70–79 6.8% = ≥80 | OC | Surgery | Low | BMI |
|
| Mardas 2017 [80] | Poland | 190 | Mean: FIGO I-II = 53.8 ± 9.9 FIGO III-IV = 57.5 + 11.5 | I-II (28.9%), III-IV (71.1%) EOC | PDS followed by chemotherapy (86.3%), NACT-IDS (13.7%) | Low | Weight and change |
|
| Matsubara 2019 [81] | Japan | 92 | Mean: 55.3 (15–78) | I-IV OC | PDS followed by chemotherapy (66.3%), NACT-IDS (33.7%) | Low | Muscle mass |
|
| Matthews 2009 [82] | USA | 304 | Mean: BMI < 30 = 62.2 ± 11.3 BMI ≥ 30 = 58.3 ± 11.6 | II-IV EOC | PDS followed by chemotherapy | Moderate | BMI |
|
| Munstedt 2008 [83] | Germany | 824 | Mean: 60.9 ± 13.1 | I-IV EOC | Surgery, chemotherapy and/or radiation therapy (NR) | Low | BMI |
|
| Nakayama 2019 [84] | Japan | 94 | Mean: 61.8 (25–84) | I-IV OC | PDS followed by chemotherapy | Moderate | Muscle density Muscle mass |
|
| Orskov 2016 [21] | Denmark | 2654 (BMI unknown for 3%) | Median: ≤64 = 52% >64 = 48% | I-IV OC, I-II (36%), III-IV 63%), unknown (1%) | Surgery | Low | BMI |
|
| Pavelka 2006 [5] | USA | 216 | Mean: BMI < 18.5 = 59.8 BMI 18.5–24.9 = 57.3 BMI 25–29.9 = 63.9 BMI ≥ 30 = 59.3 | I-IV EOC or primary peritoneal cancer | PDS | Moderate | BMI |
|
| Pinar 2017 [85] | Turkey | 112 | Median: 56.4 (20–80) | I-II (17.8%), III-IV (82.2%) EOC | PDS followed by chemotherapy (78.6%) and (9.9%)/or (20.5%) radiation therapy | Low | BMI |
|
| Popovic 2017 [45] | Republic of Srpska | 163 | Mean: 59.03 ± 11.81 | III-IV OC (including non-epithelial OC) | Surgery | Low | BMI |
|
| Previs 2014 [86] | USA | 81 | Median: 56 (21–86) | I-IV EOC | Surgery | Low | BMI |
|
| Roy 2020 [87] | USA | 1786 | <50 = 311 50–59 = 490 60–69 = 543 ≥70 = 442 | OC or primary peritoneal cancer | Surgery | Low | BMI |
|
| Rutten 2016 [88] | Netherlands | 123 | Mean: 66.5 ± 0.8 | IIB-IV OC | NACT-IDS | Low | Fat mass change Muscle mass and change |
|
| Rutten 2017 [89] | Netherlands | 216 | Mean: 63.1 ± 0.8 | II-IV OC | PDS | Low | Fat mass Muscle density Muscle mass |
|
| Schlumbrecht 2011 [90] | USA | 194 (BMI unknown for 29.7%) | Mean: 44.9 | I-IV EOC | PDS followed by chemotherapy or NACT-IDS, 12.4% received hormone treatment after adjuvant chemotherapy | Low | BMI |
|
| Skirnisdottir 2008 [91] | Sweden | 635 | Mean: 60 | IA-IIC EOC | PDS followed by chemotherapy (47.7%) or radiotherapy (52.3%) | Low | BMI |
|
| Skirnisdottir 2010 [92] | Sweden | 446 | Mean: 62.5 (25–91) | I-II (36%), III-IV (64%) EOC | PDS followed by chemotherapy | Low | BMI |
|
| Slaughter 2014 [93] | USA | 46 | Median: PDS group = 62.4 PDS + BEV group = 63.4 | III-IV EOC | PDS followed by chemotherapy (N = 25) or PDS followed by chemotherapy with BEV (n = 21) | Low | BMI Fat mass |
|
| Smits 2015 [94] | UK | 228 | Median: BMI < 25 = 63.1 (21–88) BMI 25–29.9 = 65.6 (28–85) BMI ≥ 30 = 64.6 (19–81) | I-IV OC, primary peritoneal or fallopian tube cancer | PDS followed by chemotherapy (82%) or NACT-IDS (28%) | Low | BMI |
|
| Son 2018 [95] | UK | 68 | Median: 57 (38–80) | IIIC-IVB EOC | NACT-IDS | Moderate | BMI |
|
| Staley 2020 [96] | USA | 201 | Median: 63.6 (24.1–91.5) | I-IV EOC | PDS followed by chemotherapy, NACT-IDS (NR) | Moderate | Muscle mass |
|
| Suh 2012 [53] | Korea | 486 | Mean: BMI < 23.0 = 48.6 BMI ≥ 23.0 = 53.2 | I-IV EOC or primary peritoneal cancer I-II (36.6%), III-IV (62.6%), unknown (0.8%) | PDS followed by chemotherapy, NACT-IDS (9.3%) | Low | BMI |
|
| Torres 2013 [97] | USA | 82 | Mean: 67.4 ± 11.7 | IIIC-IV OC | PDS | Low | BMI Fat mass Muscle mass |
|
| Ubachs 2020 [46] | Netherlands | 212 | Mean: 60.9 ± 8.2 | III EOC, primary peritoneal or fallopian tube cancer | NACT | Moderate | Muscle mass change |
|
| Uccella 2018 [7] | Italy | 70 (52 included in analysis on post-surgical complications | Median: 58.5 (27–78) | IIIC-IV OC | PDS | Low | BMI |
|
| Vitarello 2021 [98] | USA | 102 | Median: 64 (38–90) | III-IV OC | NACT | Moderate | BMI Fat mass Muscle mass |
|
| Wade 2019 [99] | USA | 1538 | 3.4% = <40 14.6% = 40–49 32.3% = 50–59 32.2% = 60–69 15.6% = 70–79 1.8% = ≥80 | III-IV EOC, primary peritoneal or fallopian tube cancer | PDS followed by chemotherapy with or without BEV (NR) | Moderate | BMI Fat mass |
|
| Wang 2021 [100] | China | 273 (BMI unknown for 7.3%) | Median (IQR): 51 (46–60) | IIIC-IV EOC | PDS followed by chemotherapy (35.6%), NACT (64.4%) | Low | BMI |
|
| Wolfberg 2004 [101] | USA | 128 | Mean (SE): BMI < 30 = 56.3 (1.26) BMI ≥ 30 = 55.7 (2.11) | III-IV EOC | Surgery | Moderate | BMI |
|
| Wright 2008 [102] | USA | 387 | Median: 56.8 (21.8–85.5) | III EOC | PDS followed by chemotherapy | Low | BMI |
|
| Yan 2021 [103] | China | 415 | Median: 50 (25–75) | III-IV EOC | PDS incorporating bowel resection | Low | BMI |
|
| Yao 2019 [104] | USA | 535 | Mean: 64.3 ± 11.3 | IIIC-IV EOC, primary peritoneal or fallopian tube cancer | PDS followed by chemotherapy | Low | BMI |
|
| Yim 2016 [10] | Korea | 213 | Median: 53 (22–81) | III-IV EOC | PDS followed by chemotherapy | Low | BMI |
|
| Yoshikawa 2017 [105] | Japan | 76 | Median: 62 (33–81) | I-IV OC | Chemotherapy | Low | Muscle mass |
|
| Yoshikawa 2021 [106] | Japan | 72 | Median: High psoas muscle index = 60 (33–78) Low psoas muscle index = 65 (41–81) | I-IV EOC | PDS followed by chemotherapy (N = 41), NACT-IDS (N = 31) | Low | Muscle mass |
|
| Yoshino 2020 [54] | Japan | 60 | Median: 63.5 (43–81) | III-IV EOC | Induction chemotherapy | Low | BMI Muscle mass and change |
|
| Zanden, van der 2021 [107] | Netherlands | 213 | Median: 75.9 (70–89) | IIIA-IV OC | Surgery | Low | Muscle density Muscle mass |
|
| Zhang 2004 [55] | China | 254 | Alive = 44.1 ± 13.7 Deceased = 51.1 ± 9.0 | I-IV EOC | NR | Low | Green tea consumption |
|
| Zhang 2005 [44] | China | 207 | Alive = 46.7 ± 12.7 Deceased = 51.6 ± 8.8 | I-IV EOC | Surgery and chemotherapy | Low | BMI |
|
| Experimental studies | ||||||||
| Author Year Country | Study design | Sample size | Age (years) ( ± SD or range) | FIGO stage (% of patients) | Treatment (% of patients) | Risk of bias assessment | Intervention (duration and frequency) versus comparison | Outcome |
| Newton 2011 Australia [108] | Non-randomized phase 2 trial | 17 | Mean: 60.4 (44–71) | I-IV EOC (76%) or primary peritoneal cancer (24%) | PDS followed by chemotherapy (82%) or chemotherapy followed by IDS (18%) | High | Weekly individualized walking prescription by an exercise physiologist, supervised biweekly (in-person or telephone) meetings |
|
| Qin 2021 China [109] | Randomized controlled trial | 60 | Mean: 53.3 (10.32) intervention group and 54.67 (11.91) control group | I-IV OC | Completed primary treatment and decided to receive chemotherapy treatment | High | Nutrition education by a nutritionist and 250 mL oral nutrition supplements (1.06 kcal, 0.0356 g protein/mL) three times a day versus nutrition education alone |
|
| Von Gruenigen 2011 USA [110] | Prospective, single group trial | 27 | Mean: 59.6 ± 9.2 (45–76) | I-IV EOC, primary peritoneal or fallopian tube cancer | Receiving at least 6 cycles of adjuvant chemotherapy | High | 1 guided session every chemotherapy visit for 6 cycles. Individual sessions by registered dietitian. Guidance on intake of nutrient-dense food and staying as physically active as possible |
|
| Zhang 2018 China [111] | Randomized, single-blind controlled trial | 67 | Range 18–65 with ~45% in the range of 46–55 years | I-V OC | Surgery and completed first cycle of adjuvant chemotherapy | High | Nurse-led, home-based exercise and cognitive behavioral therapy versus usual care |
|
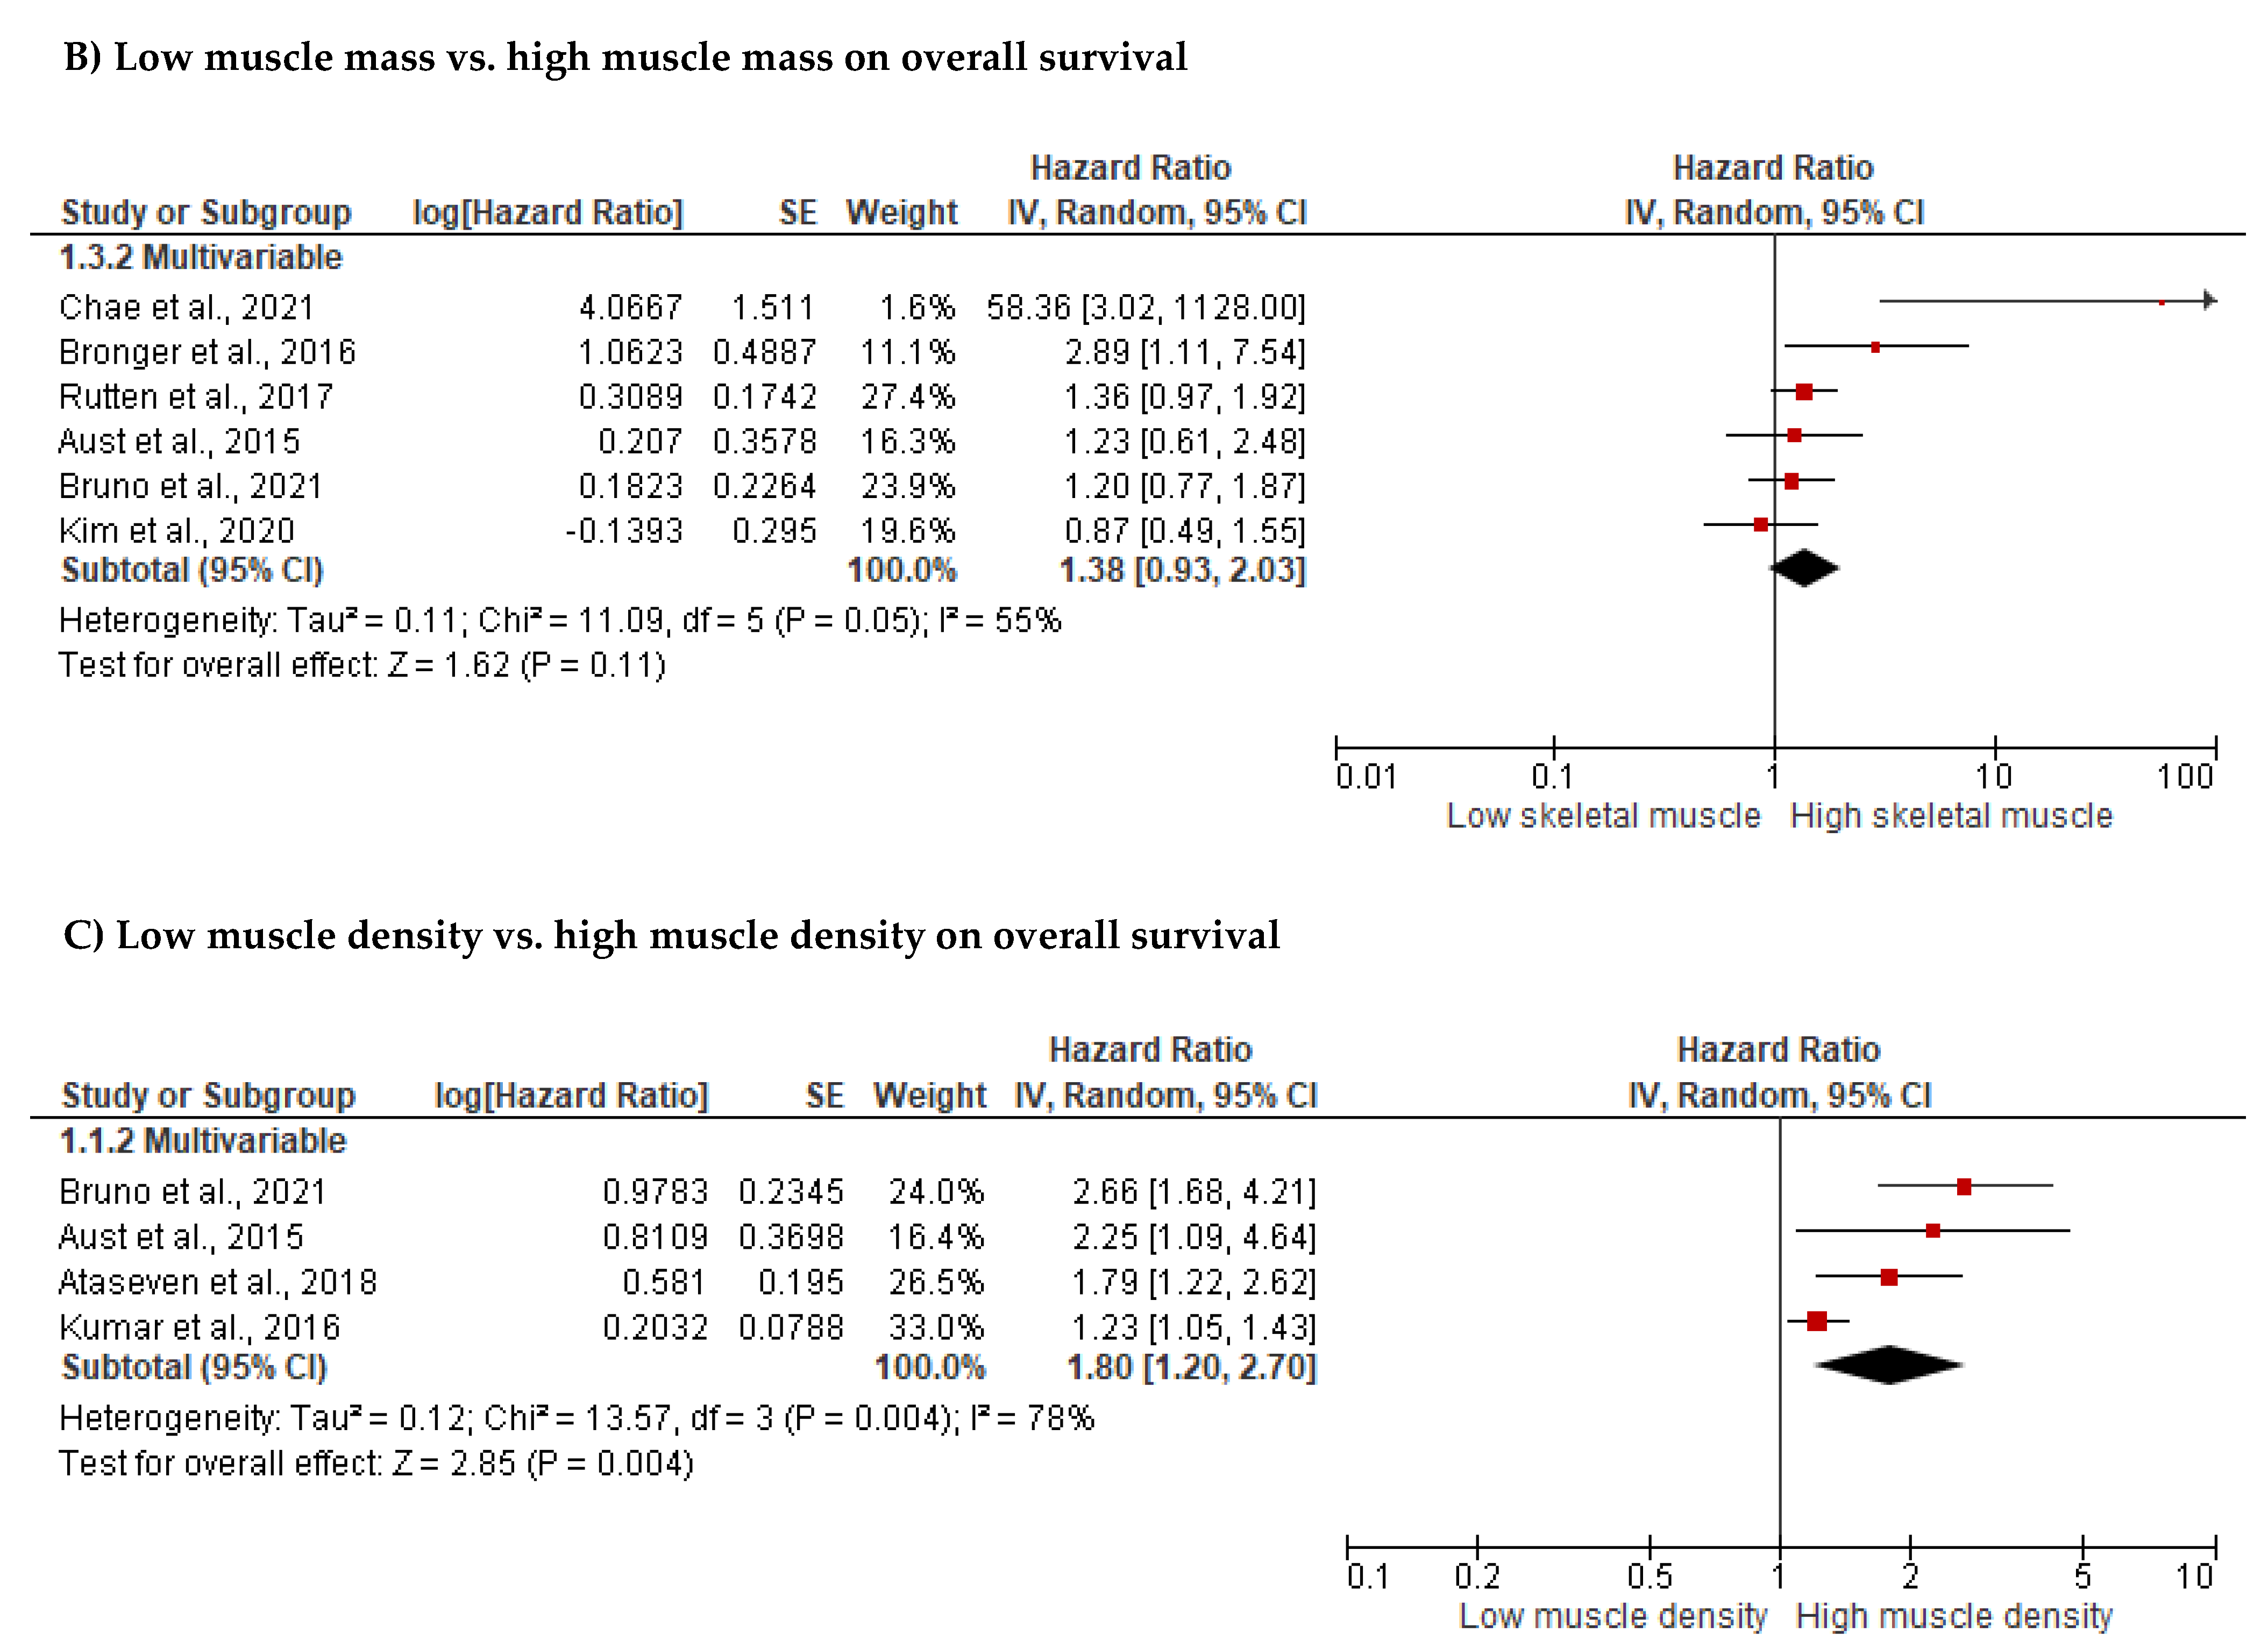
3.2.1. Associations between Energy Balance-Related Factors or Behaviors at Diagnosis and Survival
| Survival Outcomes | ||||||||||||||||
|---|---|---|---|---|---|---|---|---|---|---|---|---|---|---|---|---|
| Body Mass Index | Muscle Mass | Muscle Density | Fat Mass | |||||||||||||
| N+ | N- | NS | LoE | N+ | N- | NS | LoE | N+ | N- | NS | LoE | N+ | N- | NS | LoE | |
| Overall survival | n = 4 ([4,49,69,86]) * | n = 3 [45,52,90] | n = 30 [5] †, [10], [21] *, [24] *, [44] *, [50] *, [53,54], [82] †, [94], [59] *, [61], [62] †, [63], [65] *, [71], [72] *, [73,79,80,83], [85] *, [91,92], [93] *b,d, [97], [99] †, [100,102,103] | A | n = 4 [11], [66] *, [63] *, [106] | n = 13 [19], [50] *, [54], [58], [59] *, [64] *, [68], [81], [84] †, [88], [89] *, [96] †, [97] | A | n = 4 [19] *, [58] *, [59] *, [64] * | n = 3 [11], [84] †, [89] | C1 | n = 1 [97] | n = 2 [50] b, [93] a | n = 8 [11], [50] c, [64], [68], [89], [97], [99] †, [93] d | C1 | ||
| Progression-free survival | n = 5 [5] †e, [80,90], [93] b, [100] | n = 19 [4,10,49], [50] *, [53], [82] †, [59] *, [61] *, [62] †, [65] *, [69], [71] *, [72,76,86,91], [93] *d, [102] *, [103] | A | n = 1 [11] | n = 1 [63] * | n = 6 [19], [50] *, [59] *, [68], [81], [96] † | A | n = 1 [11] | n = 2 [19,59] | C1 | n = 4 [11], [50] a, [68], [93] d | A | ||||
| Disease-free survival | n = 1 [69] | C2 | n = 1 [66] | n = 1 [84] † | C1 | n = 1 [84] † | C2 | |||||||||
| Platinum disease-free survival | n = 1 [69] | C2 | ||||||||||||||
| (Platinum) Recurrence-free survival | n = 3 [53], [82] †, [76] | A | ||||||||||||||
| Disease-specific survival | n = 3 [86,91,92] | A | ||||||||||||||
| Change in body mass index/weight | Change in muscle mass | Change in muscle density | Change in fat mass | |||||||||||||
| N+ | N- | NS | LoE | N+ | N- | NS | LoE | N+ | N- | NS | LoE | N+ | N- | NS | LoE | |
| Overall survival | n = 5 [49,51,57,74,80] | A | n = 4 [11], [51] f, [54,88] | n = 3 [46], [51] g, [63] | C1 | n = 1 [11] | C2 | n = 2 [51] g, [88] | n = 2 [11], [51] f | C1 | ||||||
| Progression-free survival | n = 3 [49,51,80] | n = 1 [74] | A | n = 1 [11] | n = 1 [51] | C1 | n = 1 [11] | C2 | n = 2 [11,51] | A | ||||||
| Recurrence-free survival | n = 1 [46] | C2 | ||||||||||||||
| Surgical outcomes | ||||||||||||||||
| Body mass index | Muscle mass | Muscle density | Fat mass | |||||||||||||
| N+ | N- | NS | LoE | N+ | N- | NS | LoE | N+ | N- | NS | LoE | N+ | N- | NS | LoE | |
| Intra-operative outcomes | n = 3 [53] h,i, [82] †h,i,j, [94] h,j | A | ||||||||||||||
| Total post-surgical complications | n = 4 [52], [60] †, [77] *, [78] * | n = 11 [4] *, [7,20,53], [82] †, [94], [70] *, [71] *, [79] *, [97], [101] † | C1 | n = 5 [68,75,89,97,107] | A | n = 1 [107] | n = 1 [89] | C1 | n = 1 [75] | n = 3 [75,89,97] | C1 | |||||
| Specific post-surgical complications | n = 4 [53] k, [82] k, [94] k, [58] l | A | n = 1 [107] m | C2 | ||||||||||||
| Discharge location (other than home) | n = 1 [104] | n = 1 [87] | C1 | n = 1 [107] | C2 | |||||||||||
| Extent of debulking surgery | n = 1 [98] † | n = 1 [95] † | n = 10 [4], [5] †, [7,48,53], [82] †, [94], [62] †, [71], [101] † | A | n = 1 [98] † | C2 | n = 1 [98] † | C2 | ||||||||
| ICU-admission | n = 1 [101] † | n = 1 [104] | C1 | n = 1 [68] | C2 | |||||||||||
| Length of hospital stay | n = 1 [52] | n = 5 [53], [82] †, [94,97], [101] † | A | n = 2 [68,97] | A | n = 1 [107] | C2 | n = 1 [97] | n = 1 [97] | C1 | ||||||
| Re-hospitalization | n = 2 [18,78] | n = 1 [94] | C1 | n = 1 [107] | C2 | |||||||||||
| Chemotherapy outcomes | ||||||||||||||||
| Body mass index | Muscle mass | Muscle density | Fat mass | |||||||||||||
| N+ | N- | NS | LoE | N+ | N- | NS | LoE | N+ | N- | NS | LoE | N+ | N- | NS | LoE | |
| Response | n = 1 [65] | n = 1 [69] | C1 | |||||||||||||
| Toxicity induced modification of treatment | n = 1 [72] n | n = 2 [20] o, [102] n,o | n = 5 [4] o, [62] †n, [69] p, [78] o, [102] p | C1 | n = 3 [64], [68] o, [96] †n,o | A | n = 1 [64] | C2 | n = 1 [64] | C2 | ||||||
| Total toxicities | n = 1 [69] | C2 | n = 4 [64] q, [68], [96] †, [105] q | A | n = 1 [64] q | C2 | n = 1 [64] q | C2 | ||||||||
| Specific toxicities | n = 1 [102] r | n = 2 [69] r,s, [102] t,u,v | C1 | n = 1 [105] t,u | n = 2 [96] †r, [105] r | C1 | ||||||||||
| Complications | n = 2 [67] †x, [69] w | B | ||||||||||||||
| Treatment-related hospitalizations | n = 1 [96] † | C2 | ||||||||||||||
| Change in body mass index/weight | Change in muscle mass | Change in muscle density | Change in fat mass | |||||||||||||
| N+ | N- | NS | LoE | N+ | N- | NS | LoE | N+ | N- | NS | LoE | N+ | N- | NS | LoE | |
| Total toxicities | n = 1 [46] | C2 | ||||||||||||||
| Main Effect | |||||
|---|---|---|---|---|---|
| Outcomes | n | Sample Size | HR (95% CI) | p-Value | I2 |
| Overall survival | |||||
| Body mass index | |||||
| Overall effect | 14 | 5058 | 1.07 (0.88; 1.30) | 0.480 | 64% |
| Skeletal muscle mass | |||||
| Overall effect | 6 | 961 | 1.38 (0.93; 2.03) | 0.110 | 55% |
| Without outlier a | 5 | 879 | 1.27 (0.98; 1.64) | 0.070 | 15% |
| Skeletal muscle density | |||||
| Overall effect | 4 | 998 | 1.80 (1.20; 2.70) | 0.004 | 78% |
| Without outlier b | 3 | 702 | 2.12 (1.62; 2.79) | <0.001 | 0% |
| Progression-free survival | |||||
| Body mass index | |||||
| Overall effect | 8 | 1350 | 1.11 (0.89; 1.38) | 0.350 | 45% |
| Skeletal muscle mass | |||||
| Overall effect | 3 | 424 | 1.41 (1.04; 1.91) | 0.030 | 9% |
| Outcome | n | Sample size | OR (95% CI) | p-value | I2 |
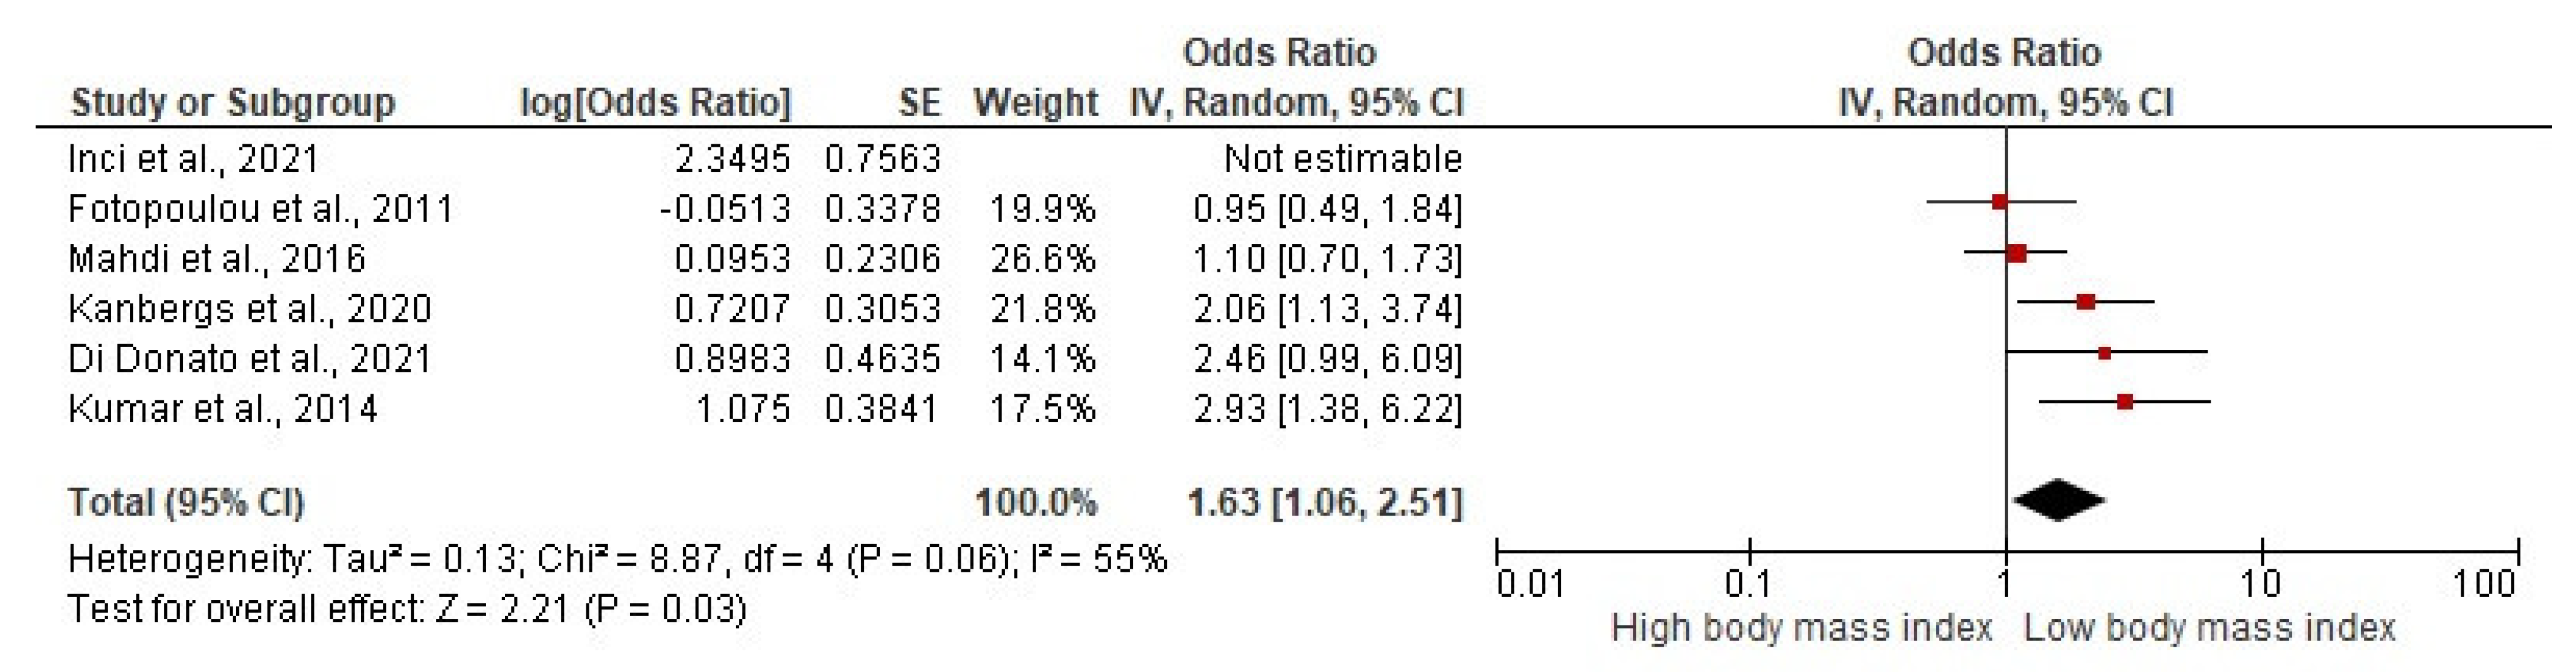
| Post-surgical complications | |||||
| Body mass index | |||||
| Overall effect | 6 | 3863 | 1.94 (1.16; 3.24) | 0.010 | 67% |
| Without outlier c | 5 | 1802 | 1.63 (1.06; 2.51) | 0.030 | 55% |


3.2.2. Associations between Body Weight or Body Composition Changes during Treatment and Survival
3.2.3. Associations between Body Composition and Surgical Outcomes
3.2.4. Associations between Body Composition and Chemotherapy Outcomes
3.3. Experimental Studies
4. Discussion
5. Conclusions
Author Contributions
Funding
Institutional Review Board Statement
Informed Consent Statement
Data Availability Statement
Conflicts of Interest
References
- Stewart, C.; Ralyea, C.; Lockwood, S. Ovarian cancer: An integrated review. Semin. Oncol. Nurs. 2019, 35, 151–156. [Google Scholar] [CrossRef] [PubMed]
- Sato, S.; Itamochi, H. Neoadjuvant chemotherapy in advanced ovarian cancer: Latest results and place in therapy. Ther. Adv. Med. Oncol. 2014, 6, 293–304. [Google Scholar] [CrossRef] [PubMed]
- Gil, K.M.; von Gruenigen, V.E. Physical activity and gynecologic cancer survivorship. Recent Results Cancer Res. 2011, 186, 305–315. [Google Scholar] [PubMed]
- Kumar, A.; Bakkum-Gamez, J.N.; Weaver, A.L.; McGree, M.E.; Cliby, W.A. Impact of obesity on surgical and oncologic outcomes in ovarian cancer. Gynecol. Oncol. 2014, 135, 19–24. [Google Scholar] [CrossRef]
- Pavelka, J.C.; Brown, R.S.; Karlan, B.Y.; Cass, I.; Leuchter, R.S.; Lagasse, L.D.; Li, A.J. Effect of obesity on survival in epithelial ovarian cancer. Cancer 2006, 107, 1520–1524. [Google Scholar] [CrossRef]
- Schofield, C.; Newton, R.U.; Cohen, P.A.; Galvão, D.A.; McVeigh, J.A.; Hart, N.H.; Mohan, G.R.; Tan, J.; Salfinger, S.G.; Straker, L.M.; et al. Activity behaviors and physiological characteristics of women with advanced-stage ovarian cancer: A preliminary cross-sectional investigation. Int. J. Gynecol. Cancer 2018, 28, 604–613. [Google Scholar] [CrossRef]
- Uccella, S.; Mele, M.C.; Quagliozzi, L.; Rinninella, E.; Nero, C.; Cappuccio, S.; Gasbarrini, A.; Scambia, G.; Fagotti, A. Assessment of preoperative nutritional status using BIA-derived phase angle (PhA) in patients with advanced ovarian cancer: Correlation with the extent of cytoreduction and complications. Gynecol. Oncol. 2018, 149, 263–269. [Google Scholar] [CrossRef]
- Purcell, S.A.; Elliott, S.A.; Kroenke, C.H.; Sawyer, M.B.; Prado, C.M. Impact of Body Weight and Body Composition on Ovarian Cancer Prognosis. Curr. Oncol. Rep. 2016, 18, 8. [Google Scholar] [CrossRef]
- Tranoulis, A.; Kwong, F.L.A.; Lakhiani, A.; Georgiou, D.; Yap, J.; Balega, J. Prevalence of computed tomography-based sarcopenia and the prognostic value of skeletal muscle index and muscle attenuation amongst women with epithelial ovarian malignancy: A systematic review and meta-analysis. Eur. J. Surg. Oncol. 2022, 48, 1441–1454. [Google Scholar] [CrossRef]
- Yim, G.W.; Eoh, K.J.; Kim, S.W.; Nam, E.J.; Kim, Y.T. Malnutrition Identified by the Nutritional Risk Index and Poor Prognosis in Advanced Epithelial Ovarian Carcinoma. Nutr. Cancer 2016, 68, 772–779. [Google Scholar] [CrossRef]
- Huang, C.Y.; Yang, Y.C.; Chen, T.C.; Chen, J.R.; Chen, Y.J.; Wu, M.H.; Jan, Y.T.; Chang, C.L.; Lee, J. Muscle loss during primary debulking surgery and chemotherapy predicts poor survival in advanced-stage ovarian cancer. J. Cachexia Sarcopenia Muscle 2020, 11, 534–546. [Google Scholar] [CrossRef]
- Protani, M.M.; Nagle, C.M.; Webb, P.M. Obesity and ovarian cancer survival: A systematic review and meta-analysis. Cancer Prev. Res. 2012, 5, 901–910. [Google Scholar] [CrossRef]
- Gupta, D.; Lis, C.G.; Vashi, P.G.; Lammersfeld, C.A. Impact of improved nutritional status on survival in ovarian cancer. Support. Care Cancer 2010, 18, 373–381. [Google Scholar] [CrossRef]
- Jones, T.L.; Sandler, C.X.; Spence, R.R.; Hayes, S.C. Physical activity and exercise in women with ovarian cancer: A systematic review. Gynecol. Oncol. 2020, 158, 803–811. [Google Scholar] [CrossRef]
- Webber, K.; Carolus, E.; Mileshkin, L.; Sommeijer, D.; McAlpine, J.; Bladgen, S.; Coleman, R.I.; Herzog, T.J.; Sehouli, J.; Nasser, S.; et al. OVQUEST—Life after the diagnosis and treatment of ovarian cancer—An international survey of symptoms and concerns in ovarian cancer survivors. Gynecol. Oncol. 2019, 155, 126–134. [Google Scholar] [CrossRef]
- Nayak, P.; Vernon, S.W.; Savas, L.S.; Basen-Engquist, K.; Morgan, R.O.; Elting, L.S. Functional Impairment and Physical Activity Adherence Among Gynecologic Cancer Survivors: A Population-Based Study. Int. J. Gynecol. Cancer 2016, 26, 381–388. [Google Scholar] [CrossRef]
- Staneva, A.A.; Beesley, V.L.; Niranjan, N.; Gibson, A.F.; Rowlands, I.; Webb, P.M. “I Wasn’t Gonna Let It Stop Me”: Exploring Women’s Experiences of Getting through Chemotherapy for Ovarian Cancer. Cancer Nurs. 2019, 42, E31–E38. [Google Scholar] [CrossRef]
- Duska, L.R.; Java, J.J.; Cohn, D.E.; Burger, R.A. Risk factors for readmission in patients with ovarian, fallopian tube, and primary peritoneal carcinoma who are receiving front-line chemotherapy on a clinical trial (GOG 218): An NRG oncology/gynecologic oncology group study (ADS-1236). Gynecol. Oncol. 2015, 139, 221–227. [Google Scholar] [CrossRef]
- Kumar, A.; Moynagh, M.R.; Multinu, F.; Cliby, W.A.; McGree, M.E.; Weaver, A.L.; Young, P.M.; Bakkum-Gamez, J.N.; Langstraat, C.I.; Dowdy, S.C.; et al. Muscle composition measured by CT scan is a measurable predictor of overall survival in advanced ovarian cancer. Gynecol. Oncol. 2016, 142, 311–316. [Google Scholar] [CrossRef]
- Castro, B.G.R.; Dos Reis, R.; Cintra, G.F.; Sousa, M.M.A.; Vieira, M.A.; Andrade, C. Predictive Factors for Surgical Morbidities and Adjuvant Chemotherapy Delay for Advanced Ovarian Cancer Patients Treated by Primary Debulking Surgery or Interval Debulking Surgery. Int. J. Gynecol. Cancer 2018, 28, 1520–1528. [Google Scholar] [CrossRef]
- Ørskov, M.; Iachina, M.; Guldberg, R.; Mogensen, O.; Mertz Nørgård, B. Predictors of mortality within 1 year after primary ovarian cancer surgery: A nationwide cohort study. BMJ Open. 2016, 6, e010123. [Google Scholar]
- Singh, S.; Guetzko, M.; Resnick, K. Preoperative predictors of delay in initiation of adjuvant chemotherapy in patients undergoing primary debulking surgery for ovarian cancer. Gynecol. Oncol. 2016, 143, 241–245. [Google Scholar] [CrossRef]
- Pereira, A.; Pérez-Medina, T.; Magrina, J.F.; Magtibay, P.M.; Rodríguez-Tapia, A.; Cuesta-Guardiola, T.; Peregrin, I.; Mendizabal, E.; Lizarraga, S.; Ortiz-Quintana, L. The impact of debulking surgery in patients with node-positive epithelial ovarian cancer: Analysis of prognostic factors related to overall survival and progression-free survival after an extended long-term follow-up period. Surg. Oncol. 2016, 25, 49–59. [Google Scholar] [CrossRef]
- Bae, H.S.; Hong, J.H.; Ki, K.D.; Song, J.Y.; Shin, J.W.; Lee, J.M.; Lee, J.K.; Lee, N.W.; Lee, C.; Lee, K.W.; et al. The effect of body mass index on survival in advanced epithelial ovarian cancer. J. Korean Med. Sci. 2014, 29, 793–797. [Google Scholar] [CrossRef]
- Yang, H.S.; Yoon, C.; Myung, S.K.; Park, S.M. Effect of obesity on survival of women with epithelial ovarian cancer: A systematic review and meta-analysis of observational studies. Int. J. Gynecol. Cancer 2011, 21, 1525–1532. [Google Scholar] [CrossRef]
- Pergialiotis, V.; Doumouchtsis, S.K.; Perrea, D.; Vlachos, G.D. The Impact of Underweight Status on the Prognosis of Ovarian Cancer Patients: A Meta-Analysis. Nutr. Cancer 2016, 68, 918–925. [Google Scholar] [CrossRef]
- Ubachs, J.; Ziemons, J.; Minis-Rutten, I.J.G.; Kruitwagen, R.; Kleijnen, J.; Lambrechts, S.; Olde Damink, S.W.M.; Rensen, S.S.; van Gorp, T. Sarcopenia and ovarian cancer survival: A systematic review and meta-analysis. J. Cachexia Sarcopenia Muscle 2019, 10, 1165–1174. [Google Scholar] [CrossRef]
- Rinninella, E.; Fagotti, A.; Cintoni, M.; Raoul, P.; Scaletta, G.; Scambia, G.; Gasbarrini, A.; Mele, M.C. Skeletal muscle mass as a prognostic indicator of outcomes in ovarian cancer: A systematic review and meta-analysis. Int. J. Gynecol. Cancer 2020, 30, 654–663. [Google Scholar] [CrossRef]
- McSharry, V.; Mullee, A.; McCann, L.; Rogers, A.C.; McKiernan, M.; Brennan, D.J. The Impact of Sarcopenia and Low Muscle Attenuation on Overall Survival in Epithelial Ovarian Cancer: A Systematic Review and Meta-analysis. Ann. Surg. Oncol. 2020, 27, 3553–3564. [Google Scholar] [CrossRef]
- Tucker, K.; Staley, S.A.; Clark, L.H.; Soper, J.T. Physical Activity: Impact on Survival in Gynecologic Cancer. Obstet. Gynecol. Surv. 2019, 74, 679–692. [Google Scholar] [CrossRef]
- Rock, C.L.; Thomson, C.A.; Sullivan, K.R.; Howe, C.L.; Kushi, L.H.; Caan, B.J.; Neuhouser, M.L.; Bandera, E.V.; Wang, Y.; Robien, K. American Cancer Society nutrition and physical activity guideline for cancer survivors. CA Cancer J. Clin. 2022, 72, 230–262. [Google Scholar] [CrossRef] [PubMed]
- Campbell, K.L.; Winters-Stone, K.M.; Wiskemann, J.; May, A.M.; Schwartz, A.L.; Courneya, K.S.; Zucker, D.S.; Matthews, C.E.; Ligibel, J.A.; Gerber, L.H. Exercise Guidelines for Cancer Survivors: Consensus Statement from International Multidisciplinary Roundtable. Med. Sci. Sports Exerc. 2019, 51, 2375–2390. [Google Scholar] [CrossRef] [PubMed]
- Rinninella, E.; Fagotti, A.; Cintoni, M.; Raoul, P.; Scaletta, G.; Quagliozzi, L.; Miggiano, G.A.D.; Scambia, G.; Gasbarrini, A.; Mele, M.C. Nutritional Interventions to Improve Clinical Outcomes in Ovarian Cancer: A Systematic Review of Randomized Controlled Trials. Nutrients 2019, 11, 1404. [Google Scholar] [CrossRef] [PubMed]
- Yeganeh, L.; Harrison, C.; Vincent, A.J.; Teede, H.; Boyle, J.A. Effects of lifestyle modification on cancer recurrence, overall survival and quality of life in gynaecological cancer survivors: A systematic review and meta-analysis. Maturitas 2018, 111, 82–89. [Google Scholar] [CrossRef]
- Ouzzani, M.; Hammady, H.; Fedorowicz, Z.; Elmagarmid, A. Rayyan—A web and mobile app for systematic reviews. Syst. Rev. 2016, 5, 210. [Google Scholar] [CrossRef]
- Furlan, A.D.; Pennick, V.; Bombardier, C.; van Tulder, M. 2009 updated method guidelines for systematic reviews in the Cochrane Back Review Group. Spine (Phila Pa 1976) 2009, 34, 1929–1941. [Google Scholar] [CrossRef]
- Liberati, A.; Altman, D.G.; Tetzlaff, J.; Mulrow, C.; Gøtzsche, P.C.; Ioannidis, J.P.A.; Clarke, M.; Devereaux, P.J.; Kleijnen, J.; Moher, D. The PRISMA statement for reporting systematic reviews and meta-analyses of studies that evaluate health care interventions: Explanation and elaboration. J. Clin. Epidemiol. 2009, 62, e1–e34. [Google Scholar] [CrossRef]
- Joanna Briggs Institute. Checklist for Cohort Studies 2020. Available online: https://jbi.global (accessed on 11 May 2022).
- Luctkar-Flude, M.; Groll, D. A Systematic Review of the Safety and Effect of Neurofeedback on Fatigue and Cognition. Integr. Cancer Ther. 2015, 14, 318–340. [Google Scholar] [CrossRef]
- Sterne, J.A.C.; Savović, J.; Page, M.J.; Elbers, R.G.; Blencowe, N.S.; Boutron, I.; Cates, C.J.; Cheng, H.Y.; Corbett, M.S.; Eldridge, S.M.; et al. RoB 2: A revised tool for assessing risk of bias in randomised trials. BMJ 2019, 366, l4898. [Google Scholar] [CrossRef]
- Kampshoff, C.S.; Jansen, F.; van Mechelen, W.; May, A.M.; Brug, J.; Chinapaw, M.J.M.; Buffart, L.M. Determinants of exercise adherence and maintenance among cancer survivors: A systematic review. IJBNPA 2014, 11, 80. [Google Scholar] [CrossRef]
- Higgins, J.; Thomas, J.; Chandler, J.; Cumpston, M.; Li, T.; Page, M.J.; Welch, V.A. (Eds.) Handbook for Systematic Reviews of Interventions Version 6.3 (Updated February 2022); Cochrane: Oxford, UK, 2022; Available online: http://www.training.cochrane.org/handbook (accessed on 29 April 2022).
- Peters, J.L.; Sutton, A.J.; Jones, D.R.; Abrams, K.R.; Rushton, L. Contour-enhanced meta-analysis funnel plots help distinguish publication bias from other causes of asymmetry. J. Clin. Epidemiol. 2008, 61, 991–996. [Google Scholar] [CrossRef]
- Zhang, M.; Xie, X.; Lee, A.H.; Binns, C.W.; Holman, C.D. Body mass index in relation to ovarian cancer survival. Cancer Epidemiol. Biomark. Prev. 2005, 14, 1307–1310. [Google Scholar] [CrossRef]
- Popovic, M.; Terzic, M.; Dotlic, J.; Ceric-Banicevic, A. Evaluation of clinical characteristics linked with the survival of patients with advanced-stage ovarian malignancies. J. BUON 2017, 22, 966–972. [Google Scholar]
- Ubachs, J.; Koole, S.N.; Lahaye, M.; Fabris, C.; Bruijs, L.; Schagen van Leeuwen, J.; Schreuder, H.W.R.; Hermans, R.H.; de Hingh, I.H.; van der Velden, J.; et al. No influence of sarcopenia on survival of ovarian cancer patients in a prospective validation study. Gynecol. Oncol. 2020, 159, 706–711. [Google Scholar] [CrossRef]
- Obesity: Preventing and managing the global epidemic. Report of a WHO consultation. World Health Organ Tech. Rep. Ser. 2000, 894, 1–253.
- Jiang, Q.X.; Jiang, Y.X.; Wang, X.; Luo, S.J.; Zhou, R.; Linghu, H. Multifactorial impact on the outcome of interval debulking surgery in patients with advanced epithelial ovarian or peritoneal cancers. Clin. Chim. Acta 2019, 495, 148–153. [Google Scholar] [CrossRef]
- Kim, S.I.; Kim, H.S.; Kim, T.H.; Suh, D.H.; Kim, K.; No, J.H.; Chung, H.H.; Kim, Y.B.; Song, Y. Impact of underweight after treatment on prognosis of advanced-stage ovarian cancer. J. Immunol. Res. 2014, 2014, 349546. [Google Scholar] [CrossRef]
- Kim, S.I.; Kim, T.M.; Lee, M.; Kim, H.S.; Chung, H.H.; Cho, J.Y.; Song, Y. Impact of CT-Determined Sarcopenia and Body Composition on Survival Outcome in Patients with Advanced-Stage High-Grade Serous Ovarian Carcinoma. Cancers 2020, 12, 559. [Google Scholar] [CrossRef]
- Kim, S.I.; Yoon, S.; Kim, T.M.; Cho, J.Y.; Chung, H.H.; Song, Y.S. Prognostic implications of body composition change during primary treatment in patients with ovarian cancer: A retrospective study using an artificial intelligence-based volumetric technique. Gynecol. Oncol. 2021, 162, 72–79. [Google Scholar] [CrossRef]
- Lv, H.; Wu, S. Influence of obesity on surgical complications of patients with ovarian tumors. Oncol. Lett. 2019, 17, 4590–4594. [Google Scholar] [CrossRef] [PubMed]
- Suh, D.H.; Kim, H.S.; Chung, H.H.; Kim, J.W.; Park, N.H.; Song, Y.S.; Kang, S.B. Body mass index and survival in patients with epithelial ovarian cancer. J. Obstet. Gynaecol. Res. 2012, 38, 70–76. [Google Scholar] [CrossRef] [PubMed]
- Yoshino, Y.; Taguchi, A.; Nakajima, Y.; Takao, M.; Kashiyama, T.; Furusawa, A.; Kino, N.; Yasugi, T. Extreme skeletal muscle loss during induction chemotherapy is an independent predictor of poor survival in advanced epithelial ovarian cancer patients. J. Obstet. Gynaecol. Res. 2020, 46, 2662–2671. [Google Scholar] [CrossRef] [PubMed]
- Zhang, M.; Lee, A.H.; Binns, C.W.; Xie, X. Green tea consumption enhances survival of epithelial ovarian cancer. Int. J. Cancer 2004, 112, 465–469. [Google Scholar] [CrossRef]
- Element, K.; Asher, V.; Bali, A.; Abdul, S.; Gomez, D.; Tou, S.; Curtis, R.; Low, J.; Philips, A. Poor anaerobic threshold and VO(2) max recorded during cardiopulmonary exercise testing (CPET) prior to cytoreductive surgery in advanced (stage 3/4) ovarian cancer (AOC) is associated with suboptimal cytoreduction but does not preclude maximum effort cytoreduction. J. Obstet. Gynaecol. 2022, 42, 294–300. [Google Scholar]
- Ansell, S.M.; Rapoport, B.L.; Falkson, G.; Raats, J.I.; Moeken, C.M. Survival determinants in patients with advanced ovarian cancer. Gynecol. Oncol. 1993, 50, 215–220. [Google Scholar] [CrossRef]
- Ataseven, B.; Luengo, T.G.; du Bois, A.; Waltering, K.U.; Traut, A.; Heitz, F.; Alesina, P.F.; Prader, S.; Meier, B.; Schneider, S.; et al. Skeletal Muscle Attenuation (Sarcopenia) Predicts Reduced Overall Survival in Patients with Advanced Epithelial Ovarian Cancer Undergoing Primary Debulking Surgery. Ann. Surg. Oncol. 2018, 25, 3372–3379. [Google Scholar] [CrossRef]
- Aust, S.; Knogler, T.; Pils, D.; Obermayr, E.; Reinthaller, A.; Zahn, L.; Radigruber, I.; Maverhoefer, M.E.; Grimm, C.; Polterauer, S. Skeletal Muscle Depletion and Markers for Cancer Cachexia Are Strong Prognostic Factors in Epithelial Ovarian Cancer. PLoS ONE 2015, 10, e0140403. [Google Scholar] [CrossRef]
- Bacalbasa, N.; Balescu, I.; Dimitriu, M.; Iliescu, L.; Diaconu, C.; Dima, S.; Vilcu, M.; Brezean, I. The Influence of the Preoperative Status on the Risk of Postoperative Complications After Cytoreductive Surgery for Advanced-stage Ovarian Cancer. In Vivo 2020, 34, 839–844. [Google Scholar] [CrossRef]
- Backes, F.J.; Nagel, C.I.; Bussewitz, E.; Donner, J.; Hade, E.; Salani, R. The impact of body weight on ovarian cancer outcomes. Int. J. Gynecol. Cancer 2011, 21, 1601–1605. [Google Scholar] [CrossRef]
- Barrett, S.V.; Paul, J.; Hay, A.; Vasey, P.A.; Kaye, S.B.; Glasspool, R.M. Does body mass index affect progression-free or overall survival in patients with ovarian cancer? Results from SCOTROC I trial. Ann. Oncol. 2008, 19, 898–902. [Google Scholar] [CrossRef]
- Bronger, H.; Hederich, P.; Hapfelmeier, A.; Metz, S.; Noël, P.B.; Kiechle, M.; Schmalfeldt, B. Sarcopenia in Advanced Serous Ovarian Cancer. Int. J. Gynecol. Cancer 2017, 27, 223–232. [Google Scholar] [CrossRef]
- Bruno, K.A.; Sobreira da Silva, M.J.; Chaves, G.V. Association of body composition with toxicity to first-line chemotherapy and three-year survival in women with ovarian adenocarcinoma. Acta Oncol. 2021, 60, 1611–1620. [Google Scholar] [CrossRef]
- Califano, D.; Pignata, S.; Losito, N.S.; Ottaiano, A.; Greggi, S.; De Simone, V.; Cecera, S.; Aiello, C.; Esposito, F.; Fusco, A.; et al. High HMGA2 expression and high body mass index negatively affect the prognosis of patients with ovarian cancer. J. Cell Physiol. 2014, 229, 53–59. [Google Scholar] [CrossRef]
- Chae, S.H.; Lee, C.; Yoon, S.H.; Shim, S.H.; Lee, S.J.; Kim, S.N.; Chung, S.; Lee, J.Y. Sarcopenia as a Predictor of Prognosis in Early Stage Ovarian Cancer. J. Korean Med. Sci. 2021, 36, e2. [Google Scholar] [CrossRef]
- Chokshi, S.K.; Gaughan, J.P.; Krill, L. Incidence and patient characteristics of venous thromboembolism during neoadjuvant chemotherapy for ovarian cancer. J. Thromb. Thrombolysis 2022, 53, 202–207. [Google Scholar] [CrossRef]
- Conrad, L.B.; Awdeh, H.; Acosta-Torres, S.; Conrad, S.A.; Bailey, A.A.; Miller, D.S.; Lea, J.S. Pre-operative core muscle index in combination with hypoalbuminemia is associated with poor prognosis in advanced ovarian cancer. J. Surg. Oncol. 2018, 117, 1020–1028. [Google Scholar] [CrossRef]
- Davis, M.; Aviki, E.; Rauh-Hain, J.A.; Worley, M., Jr.; Berkowitz, R.; Schorge, J.; Muto, M.; Sisodia, R.C.; Horowitz, N.; Del Carmen, M. Investigating the Impact of Body Mass Index on Intraperitoneal Chemotherapy Outcomes in Ovarian and Fallopian Tube Cancer. Int. J. Gynecol. Cancer 2016, 26, 1033–1040. [Google Scholar] [CrossRef]
- Di Donato, V.; Di Pinto, A.; Giannini, A.; Caruso, G.; D’Oria, O.; Tomao, F.; Fischetti, M.; Perniola, G.; Palaia, I.; Muzii, L.; et al. Modified fragility index and surgical complexity score are able to predict postoperative morbidity and mortality after cytoreductive surgery for advanced ovarian cancer. Gynecol. Oncol. 2021, 161, 4–10. [Google Scholar] [CrossRef]
- Fotopoulou, C.; Richter, R.; Braicu, E.I.; Kuhberg, M.; Feldheiser, A.; Schefold, J.C.; Lichtenegger, W.; Sehouli, J. Impact of obesity on operative morbidity and clinical outcome in primary epithelial ovarian cancer after optimal primary tumor debulking. Ann. Surg. Oncol. 2011, 18, 2629–2637. [Google Scholar] [CrossRef]
- Hanna, R.K.; Poniewierski, M.S.; Laskey, R.A.; Lopez, M.A.; Shafer, A.; Van Le, L.; Crawford, J.; Dale, D.C.; Gehrig, P.A.; Secord, A.A.; et al. Predictors of reduced relative dose intensity and its relationship to mortality in women receiving multi-agent chemotherapy for epithelial ovarian cancer. Gynecol. Oncol. 2013, 129, 74–80. [Google Scholar] [CrossRef]
- Hawarden, A.; Russell, B.; Gee, M.E.; Kayali, F.; Clamp, A.; Crosbie, E.J.; Edmondson, R.J. Correction to: Factors determining ultra-short-term survival and the commencement of active treatment in high-grade serous ovarian cancer: A case comparison study. BMC Cancer 2021, 21, 614. [Google Scholar] [CrossRef] [PubMed]
- Hess, L.M.; Barakat, R.; Tian, C.; Ozols, R.F.; Alberts, D.S. Weight change during chemotherapy as a potential prognostic factor for stage III epithelial ovarian carcinoma: A Gynecologic Oncology Group study. Gynecol. Oncol. 2007, 107, 260–265. [Google Scholar] [CrossRef] [PubMed]
- Heus, C.; Smorenburg, A.; Stoker, J.; Rutten, M.J.; Amant, F.C.H.; van Lonkhuijzen, L. Visceral obesity and muscle mass determined by CT scan and surgical outcome in patients with advanced ovarian cancer. A retrospective cohort study. Gynecol. Oncol. 2021, 160, 187–192. [Google Scholar] [CrossRef]
- Hew, K.E.; Bakhru, A.; Harrison, E.; Turan, M.O.; MacDonald, R.; Im, D.D.; Rosenshein, N.B. The Effect of Obesity on the Time to Recurrence in Ovarian Cancer: A Retrospective Study. Clin. Ovarian Cancer Other Gynecol. Malig. 2013, 6, 31–35. [Google Scholar] [CrossRef]
- Inci, M.G.; Rasch, J.; Woopen, H.; Mueller, K.; Richter, R.; Sehouli, J. ECOG and BMI as preoperative risk factors for severe postoperative complications in ovarian cancer patients: Results of a prospective study (RISC-GYN-trial). Arch. Gynecol. Obstet. 2021, 304, 1323–1333. [Google Scholar] [CrossRef]
- Kanbergs, A.N.; Manning-Geist, B.L.; Pelletier, A.; Sullivan, M.W.; Del Carmen, M.G.; Horowitz, N.S.; Growdon, W.B.; Clark, R.M.; Muto, M.G.; Worley, M.J., Jr. Neoadjuvant chemotherapy does not disproportionately influence post-operative complication rates or time to chemotherapy in obese patients with advanced-stage ovarian cancer. Gynecol. Oncol. 2020, 159, 687–691. [Google Scholar] [CrossRef]
- Mahdi, H.; Alhassani, A.A.; Lockhart, D.; Al-Fatlawi, H.; Wiechert, A. The Impact of Obesity on the 30-day Morbidity and Mortality After Surgery for Ovarian Cancer. Int. J. Gynecol. Cancer 2016, 26, 276–281. [Google Scholar] [CrossRef]
- Mardas, M.; Stelmach-Mardas, M.; Madry, R. Body weight changes in patients undergoing chemotherapy for ovarian cancer influence progression-free and overall survival. Support. Care Cancer 2017, 25, 795–800. [Google Scholar] [CrossRef]
- Matsubara, Y.; Nakamura, K.; Matsuoka, H.; Ogawa, C.; Masuyama, H. Pre-treatment psoas major volume is a predictor of poor prognosis for patients with epithelial ovarian cancer. Mol. Clin. Oncol. 2019, 11, 376–382. [Google Scholar] [CrossRef]
- Matthews, K.S.; Straughn, J.M., Jr.; Kemper, M.K.; Hoskins, K.E.; Wang, W.; Rocconi, R.P. The effect of obesity on survival in patients with ovarian cancer. Gynecol. Oncol. 2009, 112, 389–393. [Google Scholar] [CrossRef]
- Münstedt, K.; Wagner, M.; Kullmer, U.; Hackethal, A.; Franke, F.E. Influence of body mass index on prognosis in gynecological malignancies. Cancer Causes Control. 2008, 19, 909–916. [Google Scholar] [CrossRef] [PubMed]
- Nakayama, N.; Nakayama, K.; Nakamura, K.; Razia, S.; Kyo, S. Sarcopenic Factors May Have No Impact on Outcomes in Ovarian Cancer Patients. Diagnostics 2019, 9, 206. [Google Scholar] [CrossRef]
- Pinar, G.; Pinar, T.; Durukan, A.; Ayhan, A. Prognostic factors affecting survival in patients with ovarian cancer: A 5-year experience in an university hospital. UHOD—Uluslar. Hematol.-Onkol. Derg. 2017, 27, 43–52. [Google Scholar] [CrossRef]
- Previs, R.A.; Kilgore, J.; Craven, R.; Broadwater, G.; Bean, S.; Wobker, S.; DiFurio, M.; Bae-Jump, V.; Gehrig, P.A.; Secord, A.A. Obesity is associated with worse overall survival in women with low-grade papillary serous epithelial ovarian cancer. Int. J. Gynecol. Cancer 2014, 24, 670–675. [Google Scholar] [CrossRef]
- Roy, A.G.; Brensinger, C.M.; Latif, N.; Giuntoli, R.; Kim, S.; Morgan, M.; Ko, E.M. Assessment of poor functional status and post-acute care needs following primary ovarian cancer debulking surgery. Int. J. Gynecol. Cancer 2020, 30, 227–232. [Google Scholar] [CrossRef]
- Rutten, I.J.; van Dijk, D.P.; Kruitwagen, R.F.; Beets-Tan, R.G.; Olde Damink, S.W.; van Gorp, T. Loss of skeletal muscle during neoadjuvant chemotherapy is related to decreased survival in ovarian cancer patients. J. Cachexia Sarcopenia Muscle 2016, 7, 458–466. [Google Scholar] [CrossRef]
- Rutten, I.J.; Ubachs, J.; Kruitwagen, R.F.; van Dijk, D.P.; Beets-Tan, R.G.; Massuger, L.F.; Olde Damink, S.W.M.; van Gorp, T. The influence of sarcopenia on survival and surgical complications in ovarian cancer patients undergoing primary debulking surgery. Eur. J. Surg. Oncol. 2017, 43, 717–724. [Google Scholar] [CrossRef]
- Schlumbrecht, M.P.; Sun, C.C.; Wong, K.N.; Broaddus, R.R.; Gershenson, D.M.; Bodurka, D.C. Clinicodemographic factors influencing outcomes in patients with low-grade serous ovarian carcinoma. Cancer 2011, 117, 3741–3749. [Google Scholar] [CrossRef]
- Skírnisdóttir, I.; Sorbe, B. Prognostic impact of body mass index and effect of overweight and obesity on surgical and adjuvant treatment in early-stage epithelial ovarian cancer. Int. J. Gynecol. Cancer 2008, 18, 345–351. [Google Scholar] [CrossRef]
- Skírnisdóttir, I.; Sorbe, B. Body mass index as a prognostic factor in epithelial ovarian cancer and correlation with clinico-pathological factors. Acta Obstet Gynecol. Scand. 2010, 89, 101–107. [Google Scholar] [CrossRef]
- Slaughter, K.N.; Thai, T.; Penaroza, S.; Benbrook, D.M.; Thavathiru, E.; Ding, K.; Nelson, T.; McMeekin, D.S.; Moore, K.N. Measurements of adiposity as clinical biomarkers for first-line bevacizumab-based chemotherapy in epithelial ovarian cancer. Gynecol. Oncol. 2014, 133, 11–15. [Google Scholar] [CrossRef]
- Smits, A.; Lopes, A.; Das, N.; Kumar, A.; Cliby, W.; Smits, E.; Bekkers, R.; Massuger, L.; Galaal, K. Surgical morbidity and clinical outcomes in ovarian cancer—The role of obesity. BJOG 2016, 123, 300–308. [Google Scholar] [CrossRef]
- Son, J.H.; Chang, K.; Kong, T.W.; Paek, J.; Chang, S.J.; Ryu, H.S. A study of clinicopathologic factors as indicators for early prediction of suboptimal debulking surgery after neoadjuvant chemotherapy in advanced ovarian cancer. J. Obstet. Gynaecol. Res. 2018, 44, 1294–1301. [Google Scholar] [CrossRef]
- Staley, S.A.; Tucker, K.; Newton, M.; Ertel, M.; Oldan, J.; Doherty, I.; West, L.; Zhang, Y.; Gehrig, P.A. Sarcopenia as a predictor of survival and chemotoxicity in patients with epithelial ovarian cancer receiving platinum and taxane-based chemotherapy. Gynecol. Oncol. 2020, 156, 695–700. [Google Scholar] [CrossRef]
- Torres, M.L.; Hartmann, L.C.; Cliby, W.A.; Kalli, K.R.; Young, P.M.; Weaver, A.L.; Langstraat, C.L.; Jatoi, A.; Kumar, S.; Mariani, A. Nutritional status, CT body composition measures and survival in ovarian cancer. Gynecol. Oncol. 2013, 129, 548–553. [Google Scholar] [CrossRef]
- Vitarello, J.; Goncalves, M.D.; Zhou, Q.C.; Iasonos, A.; Halpenny, D.F.; Plodkowski, A.; Schwitzer, E.; Mueller, J.J.; Zivanovic, O.; Jones, L.W.; et al. The effects of neoadjuvant chemotherapy and interval debulking surgery on body composition in patients with ovarian cancer. JCSM Clin. Rep. 2021, 6, 11–16. [Google Scholar] [CrossRef]
- Wade, K.N.S.; Brady, M.F.; Thai, T.; Wang, Y.; Zheng, B.; Salani, R.; Tewari, K.S.; Gray, H.I.; Bakkum-Gamez, J.N.; Burger, R.; et al. Measurements of adiposity as prognostic biomarkers for survival with anti-angiogenic treatment in epithelial ovarian cancer: An NRG Oncology/Gynecologic Oncology Group ancillary data analysis of GOG 218. Gynecol. Oncol. 2019, 155, 69–74. [Google Scholar] [CrossRef]
- Wang, D.; Zhang, G.; Peng, C.; Shi, Y.; Shi, X. Choosing the right timing for interval debulking surgery and perioperative chemotherapy may improve the prognosis of advanced epithelial ovarian cancer: A retrospective study. J. Ovarian Res. 2021, 14, 49. [Google Scholar] [CrossRef]
- Wolfberg, A.J.; Montz, F.J.; Bristow, R.E. Role of obesity in the surgical management of advanced-stage ovarian cancer. J. Reprod Med. 2004, 49, 473–476. [Google Scholar]
- Wright, J.D.; Tian, C.; Mutch, D.G.; Herzog, T.J.; Nagao, S.; Fujiwara, K.; Powell, M. Carboplatin dosing in obese women with ovarian cancer: A Gynecologic Oncology Group study. Gynecol. Oncol. 2008, 109, 353–358. [Google Scholar] [CrossRef]
- Yan, X.; Zhang, S.; Jia, J.; Yang, J.; Song, Y.; Duan, H. Exploring the malnutrition status and impact of total parenteral nutrition on the outcome of patients with advanced stage ovarian cancer. BMC Cancer 2021, 21, 799. [Google Scholar] [CrossRef] [PubMed]
- Yao, T.; DeJong, S.R.; McGree, M.E.; Weaver, A.L.; Cliby, W.A.; Kumar, A. Frailty in ovarian cancer identified the need for increased postoperative care requirements following cytoreductive surgery. Gynecol. Oncol. 2019, 153, 68–73. [Google Scholar] [CrossRef] [PubMed]
- Yoshikawa, T.; Takano, M.; Miyamoto, M.; Yajima, I.; Shimizu, Y.; Aizawa, Y.; Suguchi, Y.; Moriiwa, M.; Aoyama, T.; Soyama, H. Psoas muscle volume as a predictor of peripheral neurotoxicity induced by primary chemotherapy in ovarian cancers. Cancer Chemother. Pharmacol. 2017, 80, 555–561. [Google Scholar] [CrossRef] [PubMed]
- Yoshikawa, T.; Miyamoto, M.; Aoyama, T.; Matsuura, H.; Iwahashi, H.; Ishibashi, H.; Kakimoto, S.; Sakamato, T.; Takasaki, K.; Suminokura, J.; et al. Psoas muscle index at the fifth lumbar vertebra as a predictor of survival in epithelial ovarian cancers. Mol. Clin. Oncol. 2021, 15, 177. [Google Scholar] [CrossRef] [PubMed]
- van der Zanden, V.; van Soolingen, N.J.; Viddeleer, A.R.; Trum, J.W.; Amant, F.; Mourits, M.J.E.; Portielje, J.E.; Bos, F.V.D.; de Kroon, C.D.; Kagie, M.J.; et al. Low preoperative skeletal muscle density is predictive for negative postoperative outcomes in older women with ovarian cancer. Gynecol. Oncol. 2021, 162, 360–367. [Google Scholar] [CrossRef] [PubMed]
- Newton, M.J.; Hayes, S.C.; Janda, M.; Webb, P.M.; Obermair, A.; Eakin, E.G.; Wyld, D.; Gordon, L.G.; Beesley, V.L. Safety, feasibility and effects of an individualised walking intervention for women undergoing chemotherapy for ovarian cancer: A pilot study. BMC Cancer 2011, 11, 389. [Google Scholar] [CrossRef] [PubMed]
- Qin, N.; Jiang, G.; Zhang, X.; Sun, D.; Liu, M. The Effect of Nutrition Intervention with Oral Nutritional Supplements on Ovarian Cancer Patients Undergoing Chemotherapy. Front. Nutr. 2021, 8, 685967. [Google Scholar] [CrossRef]
- von Gruenigen, V.E.; Frasure, H.E.; Kavanagh, M.B.; Lerner, E.; Waggoner, S.E.; Courneya, K.S. Feasibility of a lifestyle intervention for ovarian cancer patients receiving adjuvant chemotherapy. Gynecol. Oncol. 2011, 122, 328–333. [Google Scholar] [CrossRef]
- Zhang, Q.; Li, F.; Zhang, H.; Yu, X.; Cong, Y. Effects of nurse-led home-based exercise & cognitive behavioral therapy on reducing cancer-related fatigue in patients with ovarian cancer during and after chemotherapy: A randomized controlled trial. Int. J. Nurs. Stud. 2018, 78, 52–60. [Google Scholar]
- Greenlee, H.; Unger, J.M.; LeBlanc, M.; Ramsey, S.; Hershman, D.L. Association between Body Mass Index and Cancer Survival in a Pooled Analysis of 22 Clinical Trials. Cancer Epidemiol. Biomark. Prev. 2017, 26, 21–29. [Google Scholar] [CrossRef]
- Petrelli, F.; Cortellini, A.; Indini, A.; Tomasello, G.; Ghidini, M.; Nigro, O.; Salati, M.; Dottorini, L.; Iaculli, A.; Varricchio, A. Association of Obesity with Survival Outcomes in Patients with Cancer: A Systematic Review and Meta-analysis. JAMA Netw. Open. 2021, 4, e213520. [Google Scholar] [CrossRef]
- Aleixo, G.F.P.; Shachar, S.S.; Nyrop, K.A.; Muss, H.B.; Malpica, L.; Williams, G.R. Myosteatosis and prognosis in cancer: Systematic review and meta-analysis. Crit. Rev. Oncol. Hematol. 2020, 145, 102839. [Google Scholar] [CrossRef]
- Au, P.C.; Li, H.L.; Lee, G.K.; Li, G.H.; Chan, M.; Cheung, B.M.; Wong, I.C.K.; Lee, V.H.F.; Mok, J.; Yip, B.H.K. Sarcopenia and mortality in cancer: A meta-analysis. Osteoporos Sarcopenia 2021, 7 (Suppl. S1), S28–S33. [Google Scholar] [CrossRef]
- Shachar, S.S.; Williams, G.R.; Muss, H.B.; Nishijima, T.F. Prognostic value of sarcopenia in adults with solid tumours: A meta-analysis and systematic review. Eur. J. Cancer 2016, 57, 58–67. [Google Scholar] [CrossRef]
- Lopez, P.A.; Newton, R.U.; Taaffe, D.R.; Singh, F.; Buffart, L.M.; Spry, N.; Tang, C.; Saad, F.; Galvao, D.A. Associations of fat and muscle mass with overall survival in men with prostate cancer: A systematic review with meta-analysis. Prostate Cancer Prostatic Dis. 2021, 1–12. [Google Scholar] [CrossRef]
- Pedersen, L.; Christensen, J.F.; Hojman, P. Effects of exercise on tumor physiology and metabolism. Cancer J. 2015, 21, 111–116. [Google Scholar] [CrossRef]
- Padilha, C.S.; Marinello, P.C.; Galvao, D.A.; Newton, R.U.; Borges, F.H.; Frajacomo, F.; Deminice, R. Evaluation of resistance training to improve muscular strength and body composition in cancer patients undergoing neoadjuvant and adjuvant therapy: A meta-analysis. J. Cancer Surviv. 2017, 11, 339–349. [Google Scholar] [CrossRef]
- Jager, R.; Kerksick, C.M.; Campbell, B.I.; Cribb, P.J.; Wells, S.D.; Skwiat, T.M.; Purpura, M.; Ziegenfuss, T.N.; Ferrando, A.A.; Arent, S.M.; et al. International Society of Sports Nutrition Position Stand: Protein and exercise. J. Int. Soc. Sports Nutr. 2017, 14, 20. [Google Scholar] [CrossRef]
- Arends, J.; Bachmann, P.; Baracos, V.; Barthelemy, N.; Bertz, H.; Bozzetti, F.; Fearon, K.; Hütterer, E.; Isenring, E.; Kaasa, S.; et al. ESPEN guidelines on nutrition in cancer patients. Clin. Nutr. 2017, 36, 11–48. [Google Scholar] [CrossRef]
- Pierpont, Y.N.; Dinh, T.P.; Salas, R.E.; Johnson, E.L.; Wright, T.G.; Robson, M.C.; Payne, W.G. Obesity and surgical wound healing: A current review. ISRN Obes. 2014, 2014, 638936. [Google Scholar] [CrossRef]
- Sparreboom, A.; Wolff, A.C.; Mathijssen, R.H.; Chatelut, E.; Rowinsky, E.K.; Verweij, J.; Baker, S.D. Evaluation of alternate size descriptors for dose calculation of anticancer drugs in the obese. J. Clin. Oncol. 2007, 25, 4707–4713. [Google Scholar] [CrossRef]
- van Doorn, L.; Crombag, M.B.S.; Rier, H.N.; van Vugt, J.L.A.; van Kesteren, C.; Bins, S.; Mathijssen, R.H.J.; Levin, M.D.; Koolen, S.L.W. The Influence of Body Composition on the Systemic Exposure of Paclitaxel in Esophageal Cancer Patients. Pharmaceuticals 2021, 14, 47. [Google Scholar] [CrossRef]
- Mourtzakis, M.; Prado, C.M.; Lieffers, J.R.; Reiman, T.; McCargar, L.J.; Baracos, V.E. A practical and precise approach to quantification of body composition in cancer patients using computed tomography images acquired during routine care. Appl. Physiol. Nutr. Metab. 2008, 33, 997–1006. [Google Scholar] [CrossRef]
- Aubrey, J.; Esfandiari, N.; Baracos, V.E.; Buteau, F.A.; Frenette, J.; Putman, C.T.; Mazurak, V.C. Measurement of skeletal muscle radiation attenuation and basis of its biological variation. Acta Physiol. 2014, 210, 489–497. [Google Scholar] [CrossRef]
- Bolanowski, M.; Nilsson, B.E. Assessment of human body composition using dual-energy X-ray absorptiometry and bioelectrical impedance analysis. Med. Sci. 2001, 7, 1029–1033. [Google Scholar]


| Systematic searches | ||||
| Q1: What is the association between body weight, body composition, diet, exercise, sedentary behavior, and physical fitness at diagnosis and during treatment with clinical outcomes in patients with ovarian cancer? | Q2: What is the effect of exercise and/or dietary intervention during treatment in patients with ovarian cancer? | |||
| Inclusion | Exclusion | Inclusion | Exclusion | |
| Availability of full text and language | Full text available (no restriction on publication date); papers written in English | Unavailable full text; non-English language studies | Full text available (no restriction on publication date); papers written in English | Unavailable full text; non-English language studies |
| Publication type | Original research article | Review, conference abstract, case presentation, commentaries, editorials, grey literature | Original research article | Review, conference abstract, case presentation, commentaries, editorials, grey literature |
| Population | Studies involving patients with primary epithelial ovarian, peritoneal, or fallopian tube cancer (≥75% of the study sample), or separate reporting of results for patients with epithelial ovarian cancer in studies involving various types of gynecological cancer | Studies involving patients with recurrent or any other type of cancer besides epithelial ovarian, peritoneal or fallopian tube cancer | Studies involving patients with primary epithelial ovarian, peritoneal, or fallopian tube cancer (≥75% of the study sample), or separate reporting of results for patients with epithelial ovarian cancer in a sample of various types of gynecological cancer | Studies involving patients with recurrent or any other type of cancer besides epithelial ovarian, peritoneal, or fallopian tube cancer |
| Study design | Prospective or retrospective cohort studies, cross sectional studies, case-control studies | Experimental studies | Controlled intervention studies with an attention control, wait-list, or usual care group, randomized controlled trials, non-randomized controlled trials (including pilot studies) | Observational studies |
| Exposure/intervention | Body weight, body composition, diet, exercise, sedentary behavior, or physical fitness | Mind-body therapies (e.g., yoga, Tai chi), phytochemicals (e.g., carotenoids, flavonoids), or enteral/parenteral nutrition | Exercise and/or nutritional interventions | Mind-body therapies (e.g., yoga, Tai chi), phytochemicals (e.g., carotenoids, flavonoids), or enteral/parenteral nutrition |
| Timing of assessment of determinant/timing of intervention | At diagnosis and/or during first-line cancer treatment | Before diagnosis or during treatment for recurrent cancer | At diagnosis and/or during first-line cancer treatment | Before diagnosis or during treatment for recurrent cancer |
| Outcome variable | Treatment-related outcomes (i.e., surgical and chemotherapy-related outcomes) and survival outcomes | All other outcomes | Body weight, body composition, dietary intake, physical activity, biomarkers, patient-reported outcomes (e.g., quality of life, symptoms of ovarian cancer), treatment-related outcomes or survival outcomes | All other outcomes |
| Search | Query | Items Found |
|---|---|---|
| #41 | Search (#38 NOT (animals [mh] NOT humans [mh])) | 1874 |
| #39 | Search (#37 NOT (animals [mh] NOT humans [mh])) | 3266 |
| #38 | Search (#31 OR #35) | 2061 |
| #37 | Search (#31 OR #32 OR #33 OR #34) | 3547 |
| #31 | Search #25 #26 | 608 |
| #35 | Search #25 #30 | 1605 |
| #34 | Search #25 #29 | 3066 |
| #33 | Search #25 #28 | 92 |
| #32 | Search #25 #27 | 62 |
| #30 | Search (“Nutritional Status”[Mesh] OR “Nutrition Therapy”[Mesh] OR diet[tiab] OR diets[tiab] OR dietary[tiab] OR dietetic*[tiab] OR nutriti*[tiab]) | 740,947 |
| #29 | Search (“Body Composition”[Mesh] OR “Body Fat Distribution”[Mesh] OR “Body Mass Index”[Mesh] OR “Body Weight”[Mesh] OR “Waist Circumference”[Mesh] OR “Waist-Height Ratio”[Mesh] OR “Skinfold Thickness”[Mesh] AND “Waist-Hip Ratio”[Mesh] OR body composition*[tiab] OR body fat*[tiab] OR adiposity[tiab] OR fat mass*[tiab] OR body mass*[tiab] OR muscle mass*[tiab] OR sarcopenia[tiab] OR sarcopaenia[tiab] OR bmi[tiab] OR bmis[tiab] OR waist to hip[tiab] OR waist hip[tiab] OR obese[tiab] OR obesity[tiab] OR body weight*[tiab] OR weight los*[tiab] OR weight gain*[tiab] OR overweight[tiab] OR overweightness[tiab] OR anthropometric*[tiab] OR skeletal muscle index[tiab] OR hip circumference*[tiab] OR waist circumference*[tiab] OR thigh circumference*[tiab] OR abdominal circumference*[tiab] OR skinfold thickness*[tiab] OR fat free mass*[tiab] OR hip waist[tiab] OR hip to waist[tiab]) | 767,972 |
| #28 | Search (“Physical Fitness”[Mesh] OR “Physical Endurance”[Mesh] OR physical fitness[tiab] OR physical function*[tiab] OR cardiorespiratory fitness[tiab] OR physical endurance[tiab] OR physical performance[tiab]) | 89,758 |
| #27 | Search (“Sedentary Behavior”[Mesh] OR sedentary[tiab] OR physical inactivity[tiab] OR physically inactive[tiab]) | 39,207 |
| #26 | Search (“Exercise”[Mesh:noexp] OR “Physical Conditioning, Human”[Mesh] OR “Running”[Mesh] OR “Swimming”[Mesh] OR “Walking”[Mesh] OR “Exercise Therapy”[Mesh] OR exercis*[tiab] OR physical training[tiab] OR endurance training[tiab] OR aerobic training[tiab] OR resistance training[tiab] OR anaerobic training[tiab] OR circuit training[tiab] OR high intensity interval training[tiab] OR hiit[tiab] OR walking[tiab] OR jogging[tiab] OR swimming[tiab] OR running[tiab] OR bicycling[tiab] OR physical activit*[tiab] OR sports activit*[tiab] OR activity behavi*[tiab]) | 558,674 |
| #25 | Search ((“Ovarian Neoplasms”[Mesh] OR ((ovarian[tiab] OR ovary[tiab] OR ovaries[tiab]) AND (neoplasm*[tiab] OR cancer*[tiab] OR tumor[tiab] OR tumors[tiab] OR tumour[tiab] OR tumours[tiab] OR carcinoma*[tiab] OR malignan*[tiab] OR oncolog*[tiab])) OR gynecological cancer*[tiab] OR gynaecological cancer*[tiab]) NOT (polycystic[ti] OR pcos[ti])) | 127,070 |
| Observational Studies | |||||||||||
|---|---|---|---|---|---|---|---|---|---|---|---|
| Author, year | Similar groups and recruited from same population? | Exposure measured similarly? | Exposure measured in valid and reliable way? | Confounding factors identified? 1 | Strategies to deal with confounders stated? | Free of outcome at the start of study? | Outcomes measured in valid and reliable way? | Follow-up time reported and sufficient? 2 | Follow-up complete? Were reasons to loss to follow-up described and explored? 3 | Strategies to address incomplete follow-up utilized? 4 | Appropriate statistical analysis? |
| Ansell, 1993 [57] | Low | Low | Unclear | Low | Low | Low | Low | Low | Unclear | Unclear | Low |
| Ataseven, 2018 [58] | Low | Low | Low | High | Low | Low | Low | Low | Unclear | Unclear | Low |
| Aust, 2015 [59] | Low | Low | Low | Low | Low | Low | Low | Low | Unclear | Unclear | Low |
| Bacalbasa, 2020 [60] | Low | Unclear | Unclear | High | NA | Low | Low | Low | Low | NA | Unclear |
| Backes, 2011 [61] | Low | Low | Low | Low | Low | Low | Low | High | Unclear | Unclear | Low |
| Bae, 2014 [24] | Low | Low | Low | Low | Low | Low | Low | High | Unclear | Unclear | Low |
| Barrett, 2008 [62] | Low | Low | Low | High | NA | Low | Unclear | High | Unclear | Unclear | Low |
| Bronger, 2017 [63] | Low | Low | Low | Low | Low | Low | Unclear | Low | Low | Unclear | Low |
| Bruno, 2021 [64] | Low | Low | Low | Low | Low | Low | Low | Low | Unclear | Unclear | Low |
| Califano, 2013 [65] | Low | Low | Low | High | Low | Low | Unclear | Low | Unclear | Unclear | Low |
| Castro, 2018 [20] | Low | Low | Unclear | Low | Low | Low | Low | Low | Low | NA | Low |
| Chae, 2021 [66] | Low | Low | Low | High | NA | Low | Low | Low | Unclear | Unclear | Low |
| Chokshi, 2022 [67] | Low | Unclear | Unclear | High | NA | Low | Low | Low | Low | NA | Low |
| Conrad, 2018 [68] | Low | Low | Low | Low | Low | Low | Low | Low | Unclear | Unclear | Low |
| Davis, 2016 [69] | Low | Low | Low | Low | Low | Low | Low | High | Unclear | Unclear | Low |
| Di Donato, 2021 [70] | Low | Low | Unclear | Low | Low | Low | Low | Low | Low | NA | Low |
| Duska, 2015 [18] | Low | Low | High | Low | Low | Low | Low | Low | Unclear | Unclear | Low |
| Element, 2022 [56] | Low | Low | Low | High | NA | Low | Low | Low | Low | NA | High |
| Fotopoulou, 2011 [71] | Low | Low | Low | Low | Low | Low | Unclear | High | Unclear | Unclear | Low |
| Hanna, 2013 [72] | Low | Low | Unclear | Low | Low | Low | Unclear | Low | Unclear | Unclear | Low |
| Hawarden, 2021 [73] | Low | Low | Low | High | NA | Low | Low | Low | Low | NA | High |
| Hess, 2007 [74] | Low | Low | Low | Low | Low | Low | Unclear | High | Unclear | Unclear | Low |
| Heus, 2021 [75] | Low | Low | Low | Low | Low | Low | Low | Low | Low | NA | Low |
| Hew, 2014 [76] | Low | Low | Low | Low | Low | Low | Low | High | Low | NA | Low |
| Huang, 2020 [11] | Low | Low | Low | Low | Low | Low | Low | Low | Unclear | Unclear | Low |
| Inci, 2021 [77] | Low | Low | Unclear | Low | Low | Low | Low | Low | Low | NA | Low |
| Jiang, 2019 [48] | Low | Low | Low | Low | Low | Low | Low | Low | Low | NA | Low |
| Kanbergs, 2020 [78] | Low | Low | Low | Low | High | Low | Low | Low | Low | NA | Low |
| Kim, 2014 [49] | Low | Low | Low | Low | Low | Low | Low | High | Unclear | Unclear | Low |
| Kim, 2020 [50] | Low | Low | Low | Low | Low | Low | Low | Low | Unclear | Unclear | Low |
| Kim, 2021 [51] | Low | Low | Low | High | Low | Low | Low | Low | Low | NA | Low |
| Kumar, 2014 [4] | Low | Low | Low | Low | Low | Low | Unclear | High | Unclear | Unclear | Low |
| Kumar, 2016 [19] | Low | Low | Low | Low | Low | Low | Unclear | Unclear | Unclear | Unclear | Low |
| Lv, 2019 [52] | Low | Low | Unclear | High | NA | Low | Low | Low | Low | NA | Low |
| Mahdi, 2016 [79] | Low | Low | Unclear | Low | Low | Low | Low | Low | Low | NA | Low |
| Mardas, 2017 [80] | Low | Low | Low | Low | Low | Low | Low | Low | Unclear | Unclear | Low |
| Matsubara, 2019 [81] | Low | Low | Low | Low | Low | Low | Unclear | High | Unclear | Unclear | Low |
| Matthews, 2009 [82] | Low | Low | Unclear | Low | High | Low | Unclear | High | Unclear | Unclear | Low |
| Munstedt, 2008 [83] | Low | Low | Low | Low | High | Low | Unclear | Low | Low | NA | Low |
| Nakayama, 2019 [84] | Low | Low | Low | High | NA | Low | Unclear | High | Unclear | Unclear | Low |
| Orskov, 2016 [21] | Low | Low | Low | Low | Low | Low | Low | Low | Low | NA | Low |
| Pavelka, 2006 [5] | Low | Low | Low | Low | Unclear | Low | Unclear | High | Unclear | Unclear | Low |
| Pinar, 2017 [85] | Low | Low | Low | Low | Low | Low | Low | Low | Low | NA | Low |
| Popovic, 2017 [45] | Low | Low | Low | High | Low | Low | Unclear | Low | High | Unclear | Low |
| Previs, 2014 [86] | Low | Low | Low | High | Low | Low | Low | High | High | Low | Low |
| Roy, 2020 [87] | Low | Low | Unclear | Low | Low | Low | Low | Low | Low | Low | Low |
| Rutten, 2016 [88] | Low | Low | Low | Low | Low | Low | Unclear | High | Unclear | Unclear | Low |
| Rutten, 2017 [89] | Low | Low | Low | Low | Low | Low | Low | High | Unclear | Unclear | Low |
| Schlumbrecht, 2011 [90] | Low | Low | Low | Low | Low | Low | Low | Low | Unclear | Unclear | Low |
| Skirnisdottir, 2008 [91] | Low | Low | Low | High | Low | Low | Unclear | Low | Unclear | Unclear | Low |
| Skirnisdottir, 2010 [92] | Low | Low | Low | High | Low | Low | Low | Low | Unclear | Unclear | Low |
| Slaughter, 2014 [93] | Low | Low | Low | Low | Low | Low | Low | High | Unclear | Unclear | Low |
| Smits, 2015 [94] | Low | Low | Low | Low | High | Low | Low | Low | Low | NA | Low |
| Son, 2018 [95] | Low | Low | Unclear | High | Low | Low | Low | High | Unclear | Unclear | Low |
| Staley, 2020 [96] | Low | Low | Low | High | NA | Low | Low | High | Unclear | Unclear | Low |
| Suh, 2012 [53] | Low | Low | Low | Low | High | Low | Low | Low | Unclear | Unclear | Low |
| Torres, 2013 97] | Low | Low | Low | Low | Low | Low | Low | Low | Low | NA | Low |
| Ubachs, 2020 [46] | Low | Low | Low | High | NA | Low | Unclear | Low | Unclear | Unclear | Low |
| Uccella, 2018 [7] | Low | Low | Low | Low | Low | Low | Low | Low | Low | NA | Low |
| Vitarello, 2021 [98] | Low | Low | Low | High | NA | Low | Low | High | Unclear | Unclear | Low |
| Wade, 2019 [99] | Low | Low | Low | High | Low | Low | Unclear | High | Unclear | Unclear | Low |
| Wang, 2021 [100] | Low | Unclear | Unclear | Low | Low | Low | Low | Low | Low | NA | Low |
| Wolfberg, 2004 [101] | Low | Low | Unclear | High | NA | Low | Low | High | Low | NA | Low |
| Wright, 2008 [102] | Low | Low | Low | Low | Low | Low | Low | Low | Unclear | Unclear | Low |
| Yan, 2021 [103] | Low | Low | Low | High | Low | Low | Low | Low | Low | NA | Low |
| Yao, 2019 [104] | Low | Low | Unclear | Low | Low | Low | Low | Low | Low | NA | Low |
| Yim, 2016 [10] | Low | Low | Low | Low | Low | Low | Unclear | Low | Unclear | Unclear | Low |
| Yoshikawa, 2017 [105] | Low | Low | Low | Low | Low | Low | Low | High | Unclear | Unclear | Low |
| Yoshikawa, 2021 [106] | Low | Low | Low | Low | Low | Low | Low | Low | Unclear | Unclear | Low |
| Yoshino, 2020 [54] | Low | Low | Low | Low | Low | Low | Low | High | Unclear | Unclear | Low |
| Zanden, van der,2021 [107] | Low | Low | Low | Low | Low | Low | Low | Low | Low | Low | Low |
| Zhang, 2004 [55] | Low | Low | Low | Low | Low | Low | Low | Low | Low | NA | Low |
| Zhang, 2005 [44] | Low | Low | Low | Low | Low | Low | Low | Low | Low | NA | Low |
| Experimental studies | |||||||||||
| Author, year | Randomization process | Effect of assignment to intervention | Effect of adhering to intervention | Missing outcome data | Measurement of outcome | Selective reporting | |||||
| Newton, 2011 [108] | High (single-arm trial) | High | High | Low | Some concerns | Low | |||||
| Zhang, 2018 [111] | Low | Some concerns | Some concerns | Some concerns | Some concerns | High | |||||
| Qin, 2021 [109] | Low | High | High | Low | Low | Some concerns | |||||
| Von Gruenigen, 2011 [110] | High (single-arm trial) | High | High | Low | Some concerns | High | |||||
| Author Year | Adherence | Physical Outcomes | Within/Between Group Differences | Psychosocial Outcomes | Within/Between Group Differences |
|---|---|---|---|---|---|
| Newton 2011 [108] | Overall group adherence was 90% (range 55–100%). On average women walked four days a week (range 0–7) | Six-minute walk test Physical symptoms | Median (min, max): 332 (266, 356) to 395 m (356, 460), p = 0.01 1.06 (0.0, 2.33) to 0.60 (0.06, 2.06), p = 0.14 | Anxiety | Median (min, max): 4 (1, 15) to 4 (0.16), p = 0.63 |
| Depression | 3 (0, 16) to 4 (0, 13), p = 016 | ||||
| Quality of Life1 | 109 (72, 46), to 113 (67, 148), p = 0.10 | ||||
| Ovarian-specific concerns | 31 (20, 41) to 36 (21, 44), p = 0.44 | ||||
| Zhang 2018 [111] | 83.2% at T1, 76.1% at T2 and 73.7% at T3 | Cancer-related fatigue | T2: 4.24 (1.40), 4.94 (1.39), p = 0.011 T3: 3.90 (1.42), 5.04 (1.41), p = 0.002 | ||
| Total fatigue 1 | T2: 45.03 (7.07), 50.34 (5.88), p = 0.001 T3: 43.23 (7.07), 50.04 (5.53), p < 0.001 | ||||
| Symptoms of depression | T2: 7.25 (3.36), 8.86 (3.14), p = 0.044 | ||||
| Sleep quality 1 | T3: 6.29 (2.96), 7.86 (2.91), p = 0.032 | ||||
| Qin 2021 [109] | All participants reported that they completed the intervention goal (750 mL of supplements per day) | Nutritional status | Between-group differences at T1 2 −1.17 (−2.23, −0.11), p = 0.01 | ||
| Leukocytes | −0.35 (−1.69, 1.00), p = 0.61 | ||||
| Lymphocytes | 0.41 (−0.04, 0.88), p = 0.07 | ||||
| Red blood cells | 0.05 (−0.20, 0.30), p = 0.69 | ||||
| Hemoglobin | 1.83 (−4.48, 8.15), p = 0.57 | ||||
| Albumin | 3.71 (0.75 (0.75, 6.68), p = 0.01 | ||||
| Total blood protein | 5.49 (−0.36, 11.34), p = 0.07 | ||||
| Von Gruenigen 2011 [110] | 92% | Physical activity | Baseline 65 (132), #3: 77(112), #6: 138 (197). p = 0.582 (baseline to cycle #3), p = 0.063 (cycle #3 to #6) and p = 0.082 (baseline to #6). | Quality of life | Baseline: 75.4 #3: 77.6, #6: 83.9 (p = 0.001 Baseline-#6) |
| Dietary intake | NS | ||||
| Symptoms | Baseline: 20.6, #3: 26.6, #6: 17.0 (p = 0.013, #3-#6). |
Publisher’s Note: MDPI stays neutral with regard to jurisdictional claims in published maps and institutional affiliations. |
© 2022 by the authors. Licensee MDPI, Basel, Switzerland. This article is an open access article distributed under the terms and conditions of the Creative Commons Attribution (CC BY) license (https://creativecommons.org/licenses/by/4.0/).
Share and Cite
Stelten, S.; Schofield, C.; Hartman, Y.A.W.; Lopez, P.; Kenter, G.G.; Newton, R.U.; Galvão, D.A.; Hoedjes, M.; Taaffe, D.R.; van Lonkhuijzen, L.R.C.W.; et al. Association between Energy Balance-Related Factors and Clinical Outcomes in Patients with Ovarian Cancer: A Systematic Review and Meta-Analysis. Cancers 2022, 14, 4567. https://doi.org/10.3390/cancers14194567
Stelten S, Schofield C, Hartman YAW, Lopez P, Kenter GG, Newton RU, Galvão DA, Hoedjes M, Taaffe DR, van Lonkhuijzen LRCW, et al. Association between Energy Balance-Related Factors and Clinical Outcomes in Patients with Ovarian Cancer: A Systematic Review and Meta-Analysis. Cancers. 2022; 14(19):4567. https://doi.org/10.3390/cancers14194567
Chicago/Turabian StyleStelten, Stephanie, Christelle Schofield, Yvonne A. W. Hartman, Pedro Lopez, Gemma G. Kenter, Robert U. Newton, Daniel A. Galvão, Meeke Hoedjes, Dennis R. Taaffe, Luc R. C. W. van Lonkhuijzen, and et al. 2022. "Association between Energy Balance-Related Factors and Clinical Outcomes in Patients with Ovarian Cancer: A Systematic Review and Meta-Analysis" Cancers 14, no. 19: 4567. https://doi.org/10.3390/cancers14194567
APA StyleStelten, S., Schofield, C., Hartman, Y. A. W., Lopez, P., Kenter, G. G., Newton, R. U., Galvão, D. A., Hoedjes, M., Taaffe, D. R., van Lonkhuijzen, L. R. C. W., McIntyre, C., & Buffart, L. M. (2022). Association between Energy Balance-Related Factors and Clinical Outcomes in Patients with Ovarian Cancer: A Systematic Review and Meta-Analysis. Cancers, 14(19), 4567. https://doi.org/10.3390/cancers14194567