
Live Cell Detection of Poly(ADP-Ribose) for Use in Genetic and Genotoxic Compound Screens


 and
and 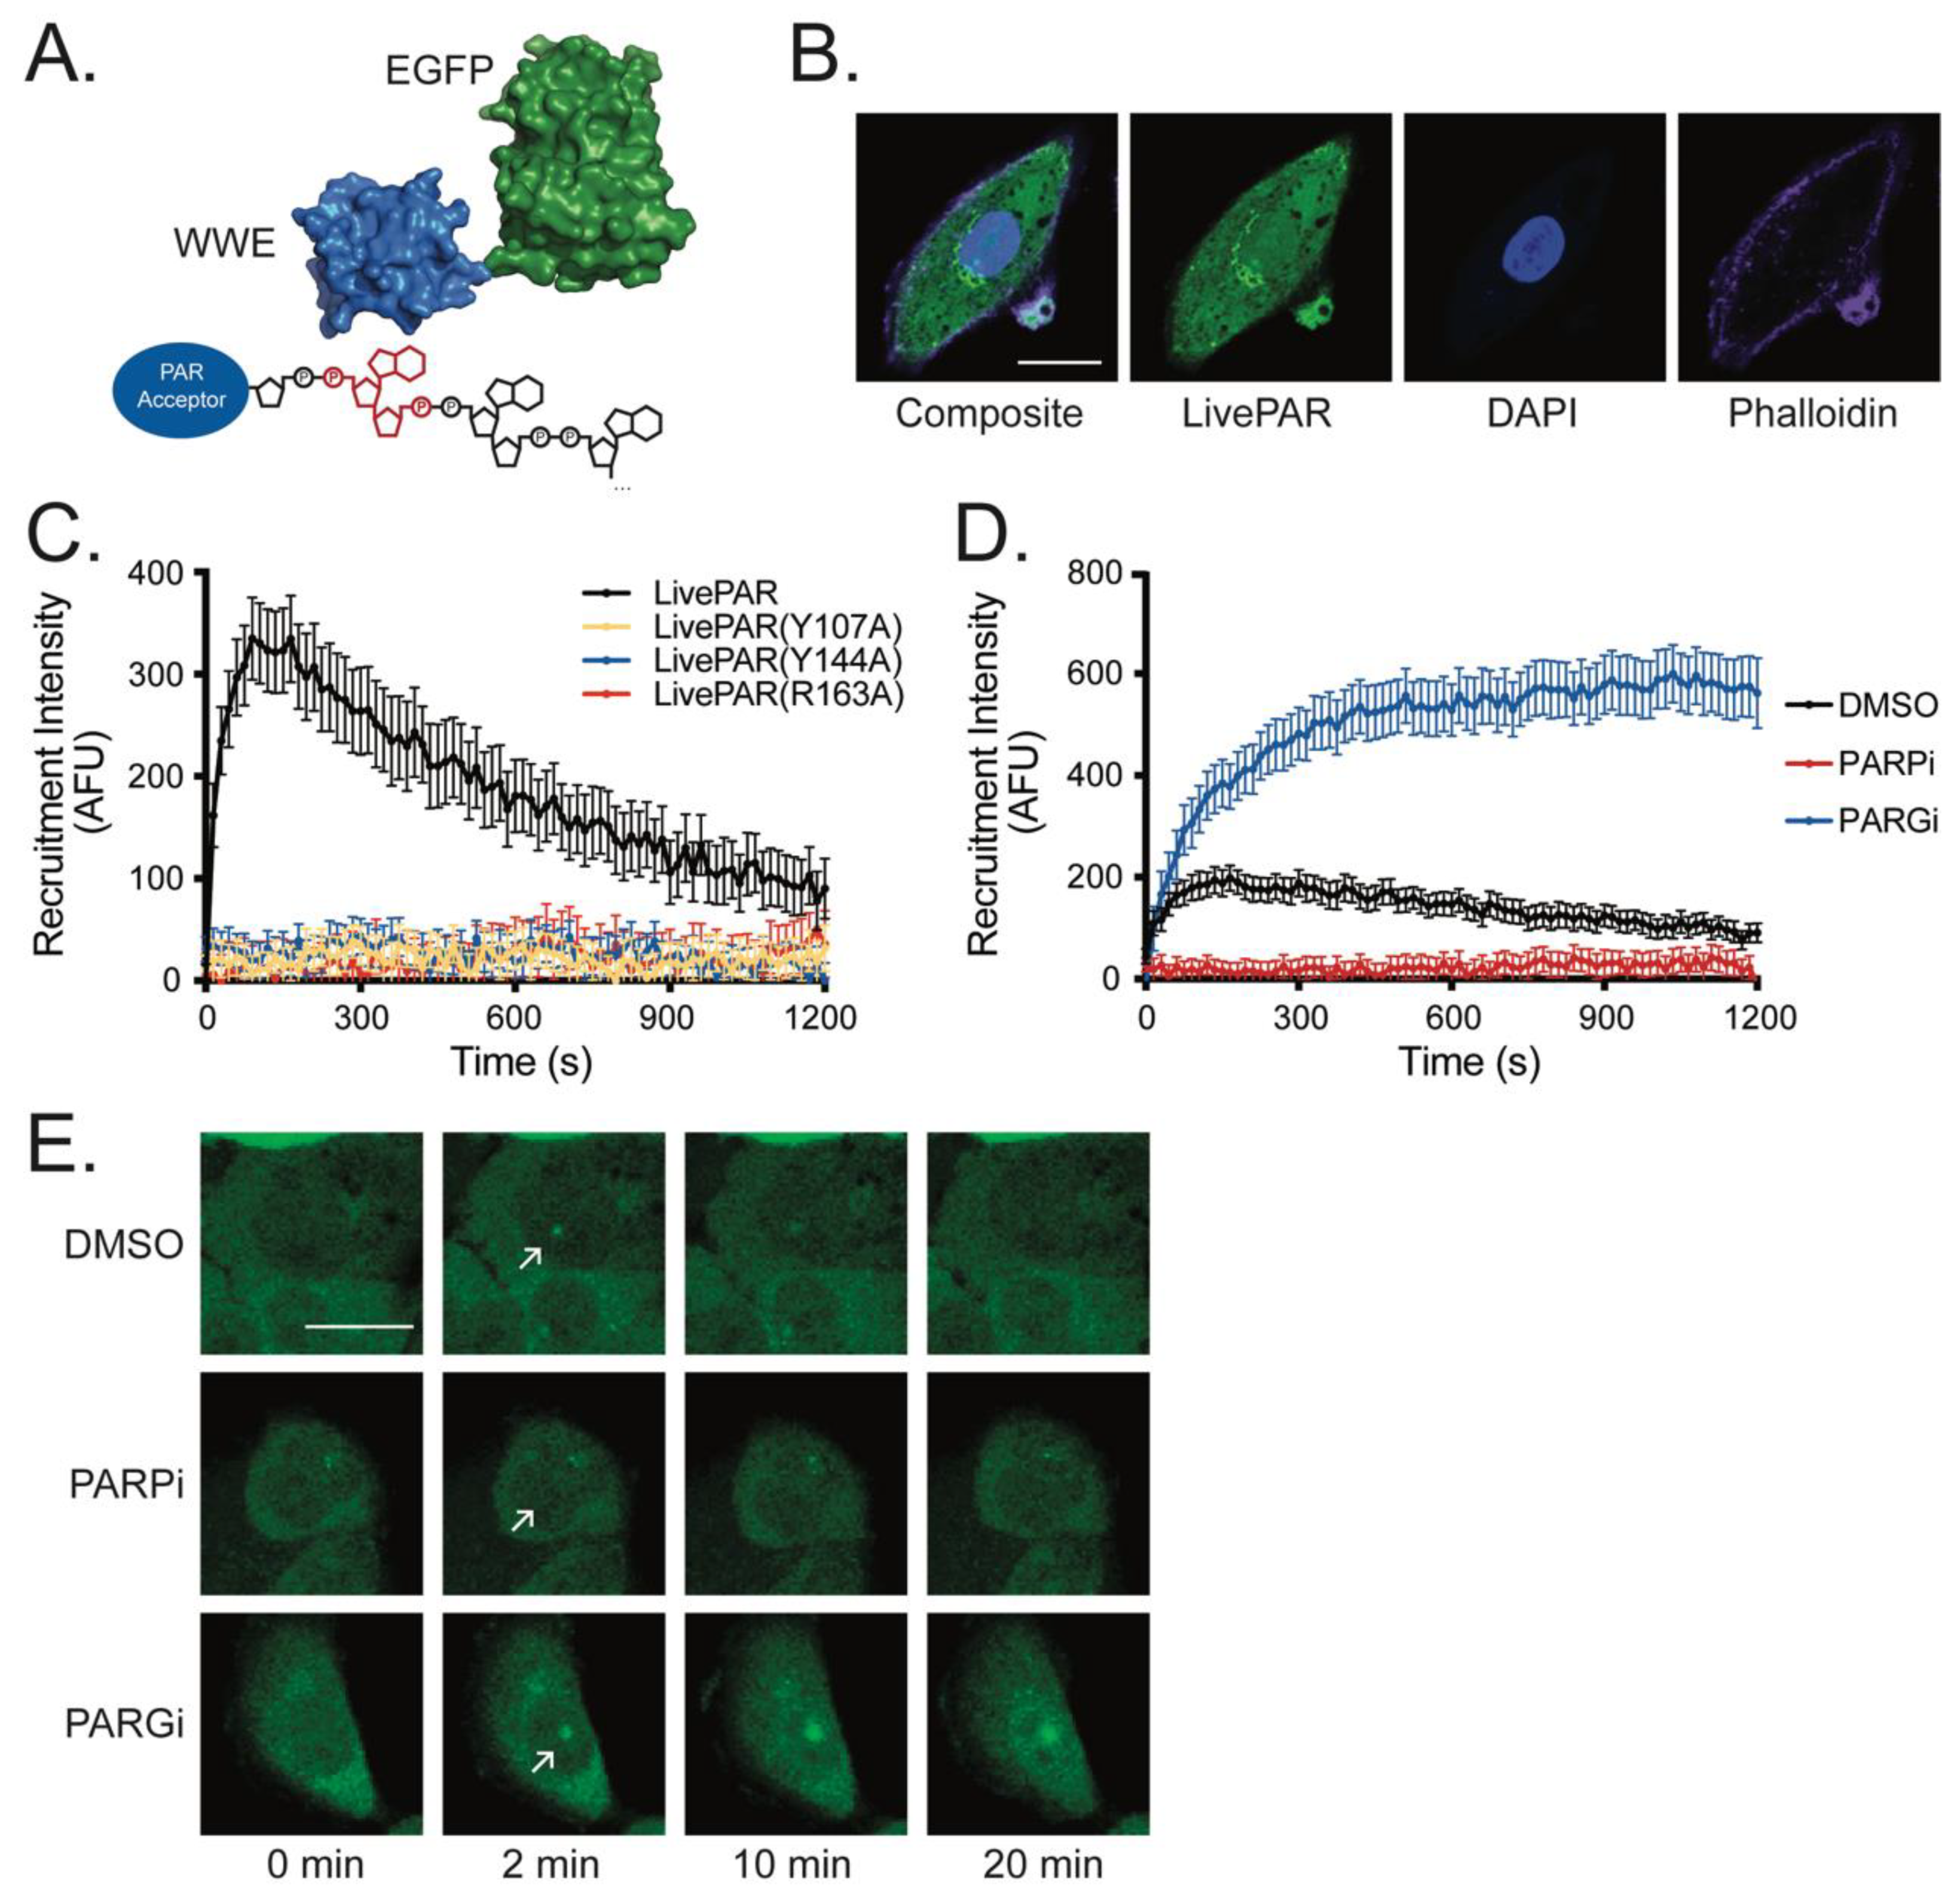
Abstract
:Simple Summary
Abstract
1. Introduction
2. Materials and Methods
2.1. Reagents and Chemicals
2.2. Cells and Cell Culture
2.3. Lentivirus Production and Cell Transduction
2.4. CRISPR/Cas9-Mediated Knockout Cell Lines
2.5. Cell Protein Extract Preparation and Immunoblot
2.6. Characterization of LivePAR Distribution
2.7. Nuclear Enrichment of LivePAR
2.8. PAR Detection Using WWE Split Luciferase
2.9. PAR ELISA
2.10. Laser Micro-Irradiation
2.11. CometChip Analysis
2.12. Statistical Analysis
3. Results
3.1. LivePAR as a Tool for Live-Cell PAR Measurement
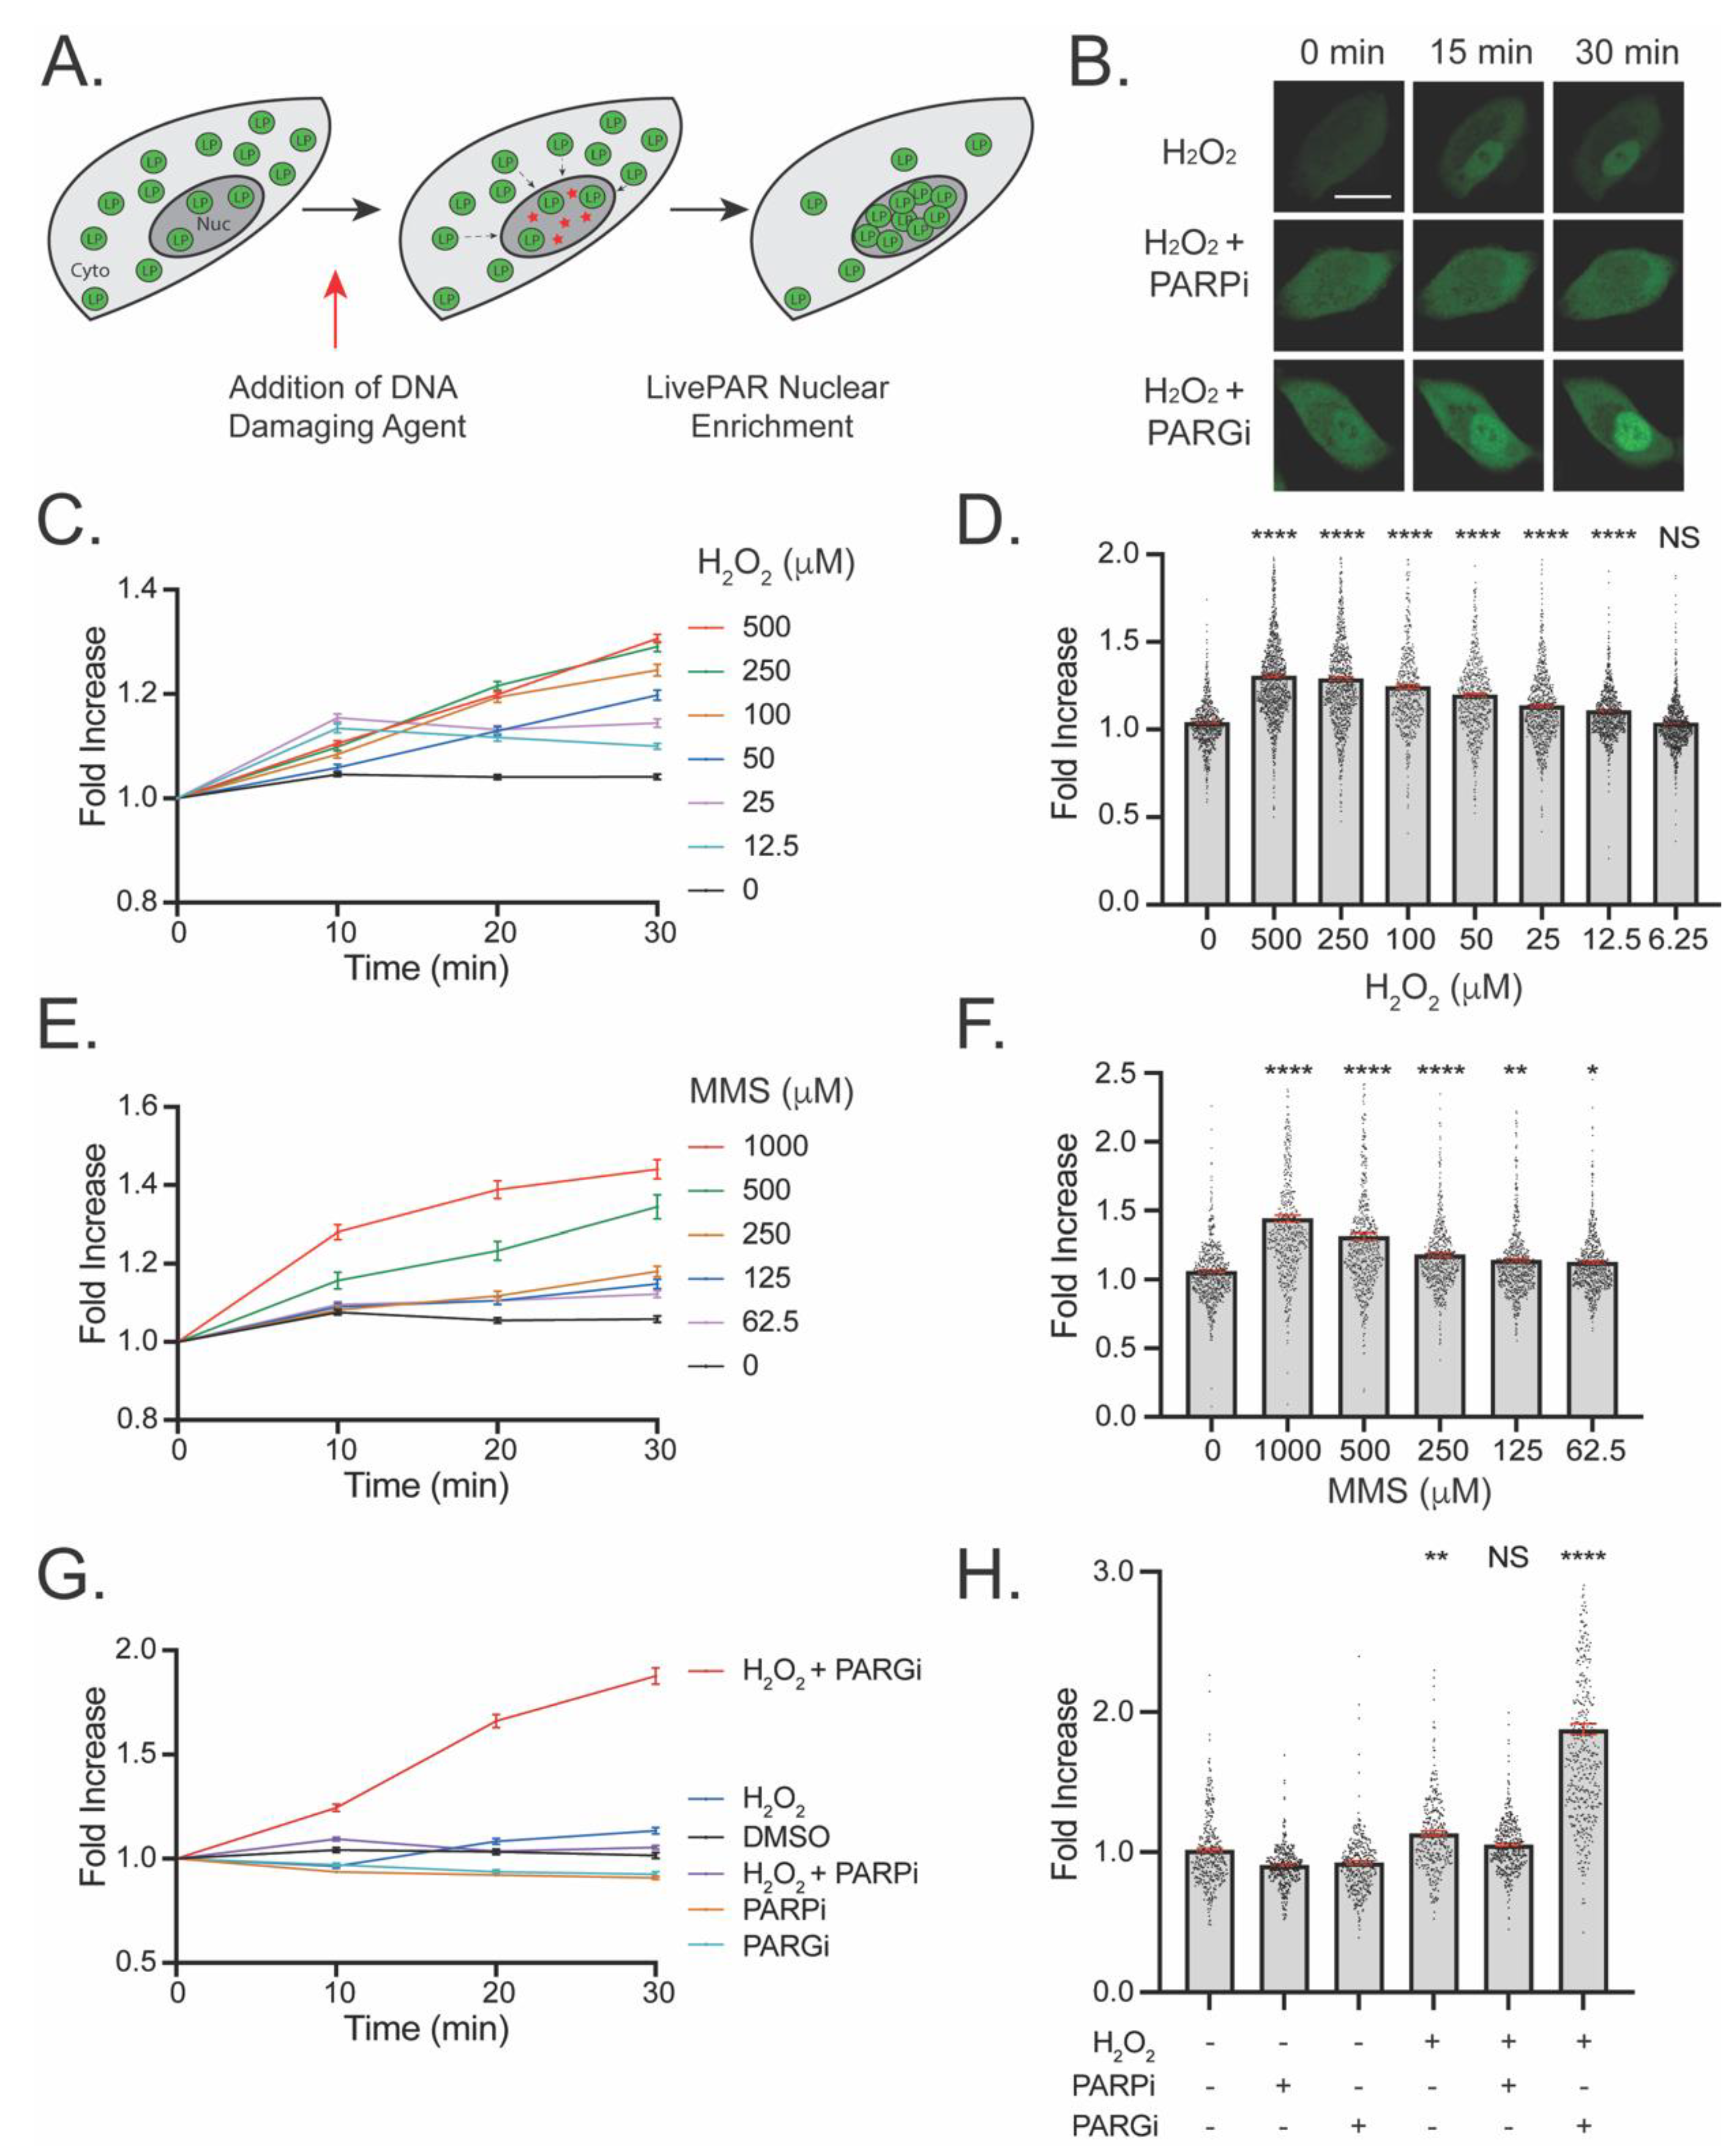
3.2. Development of the LivePAR Nuclear Enrichment Assay
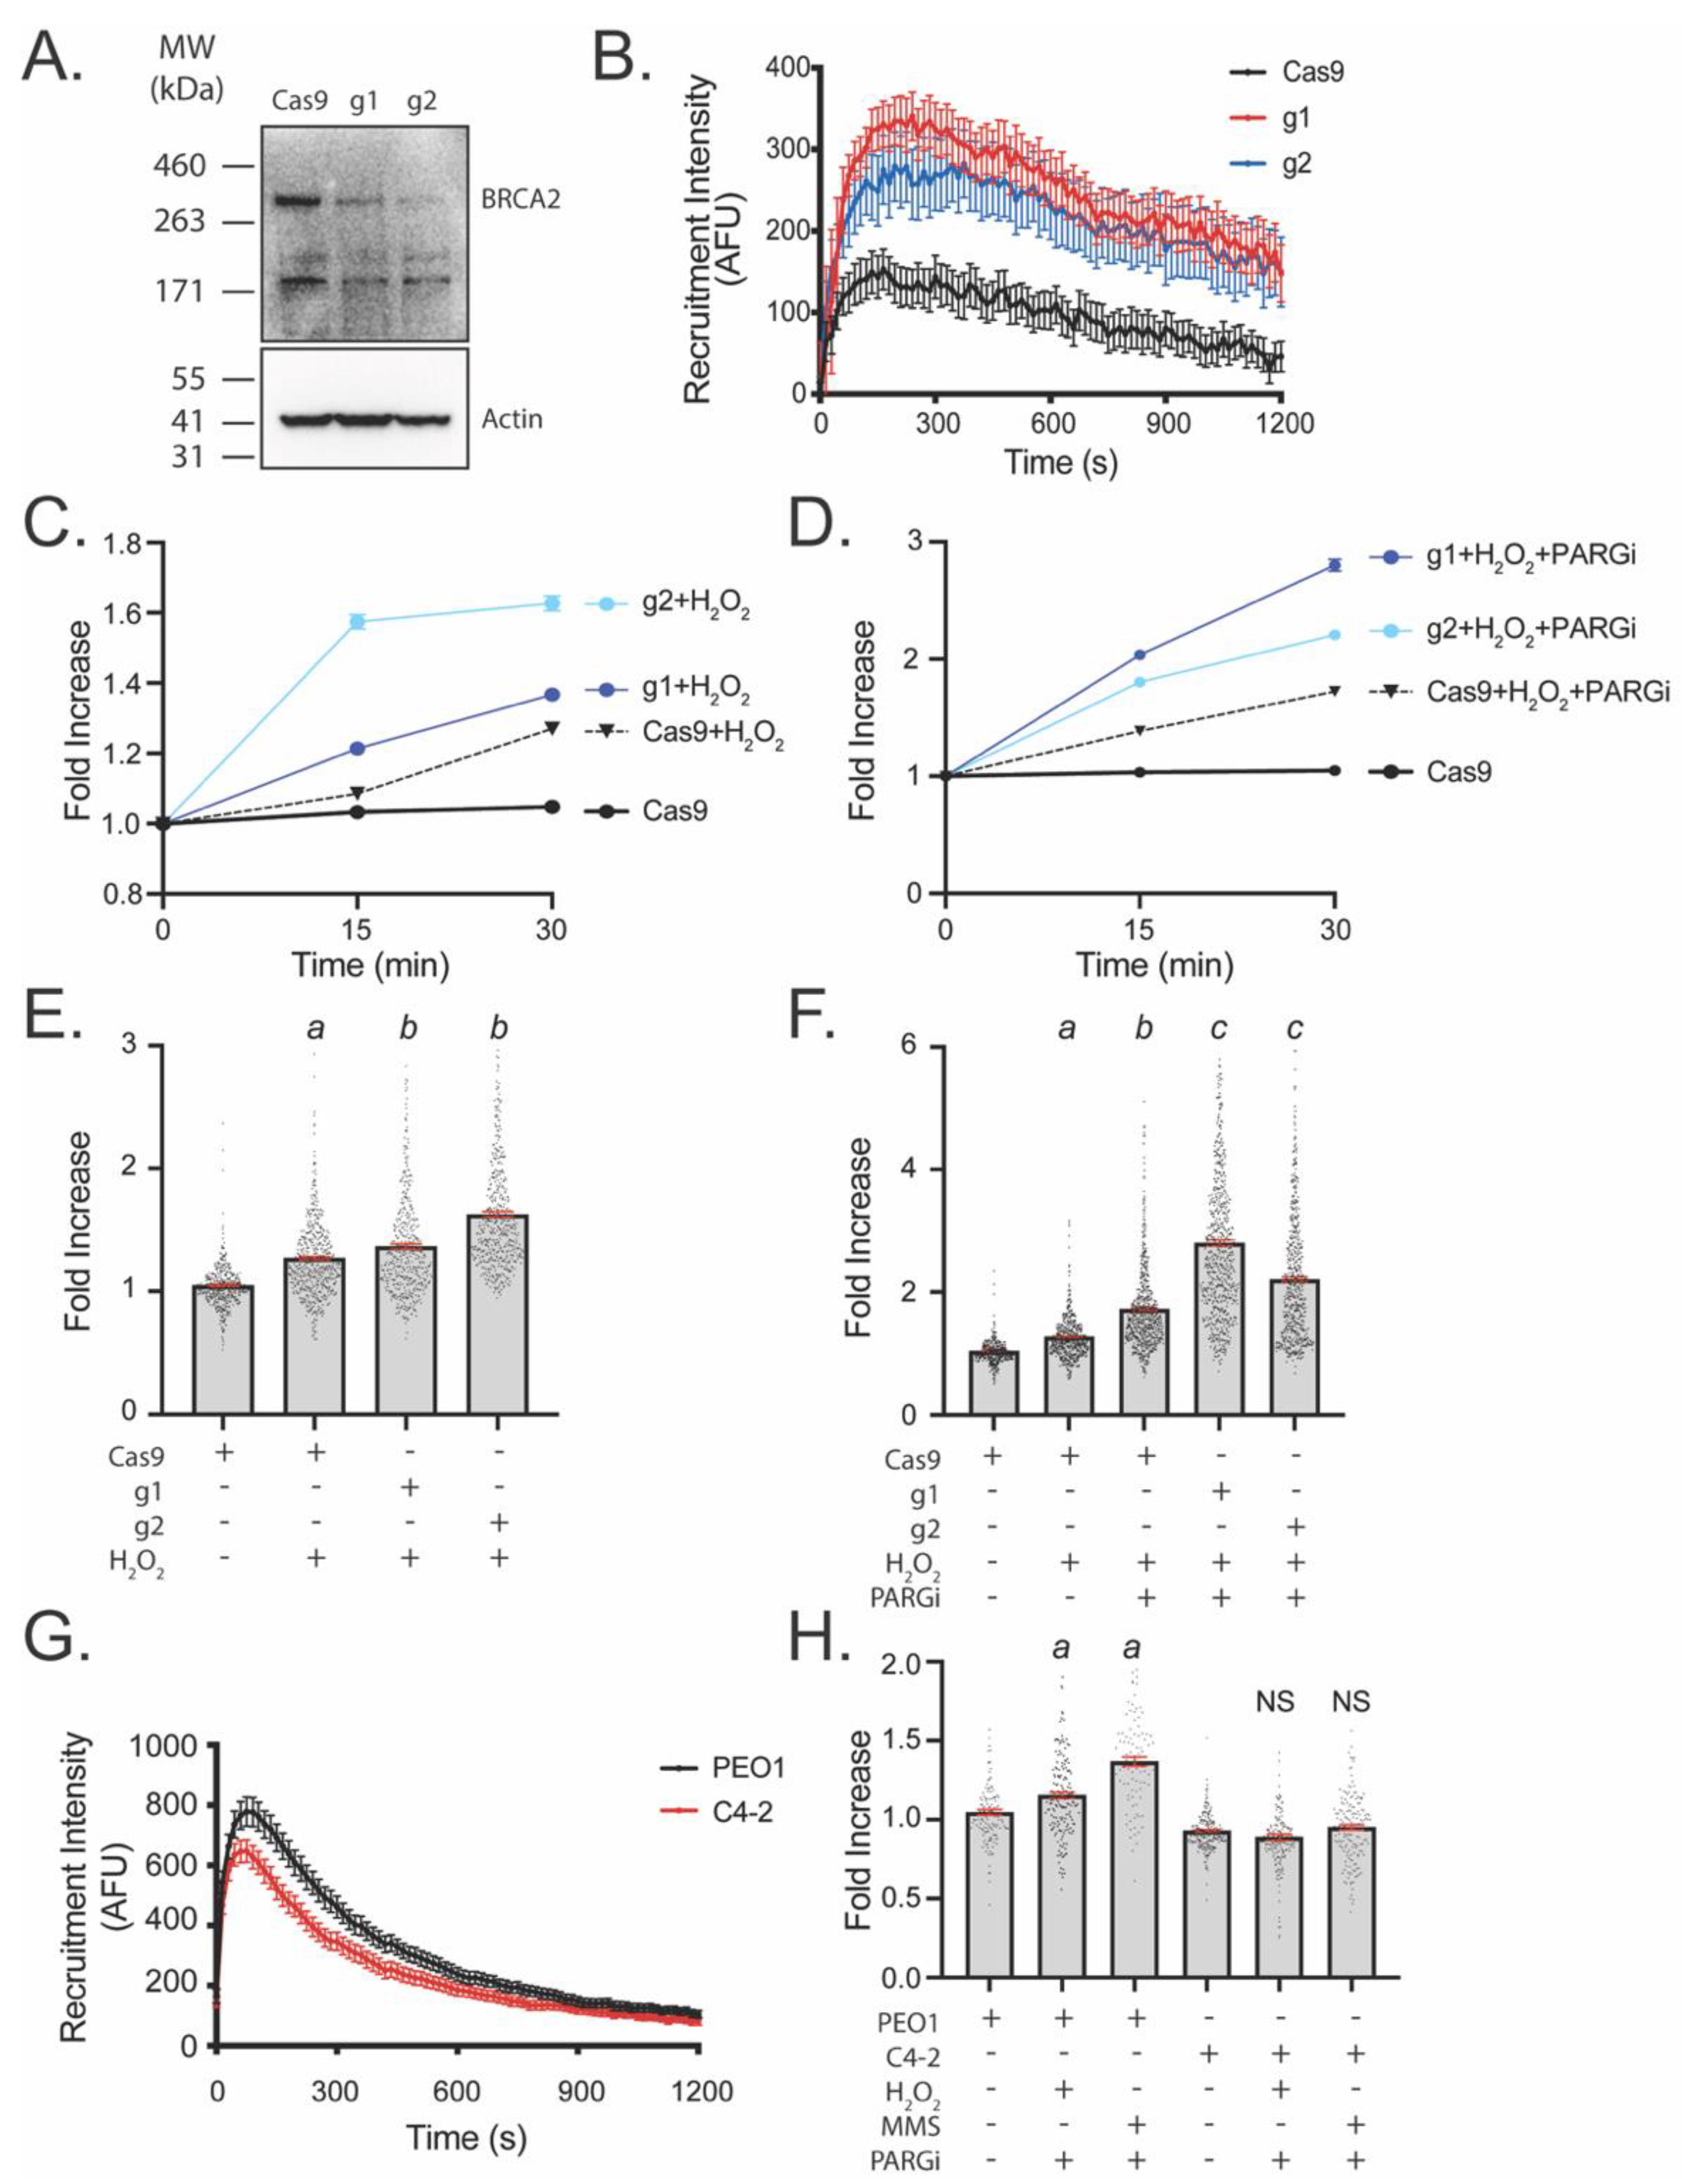
3.3. LivePAR Nuclear Enrichment to Detect BRCA2 Deficiency
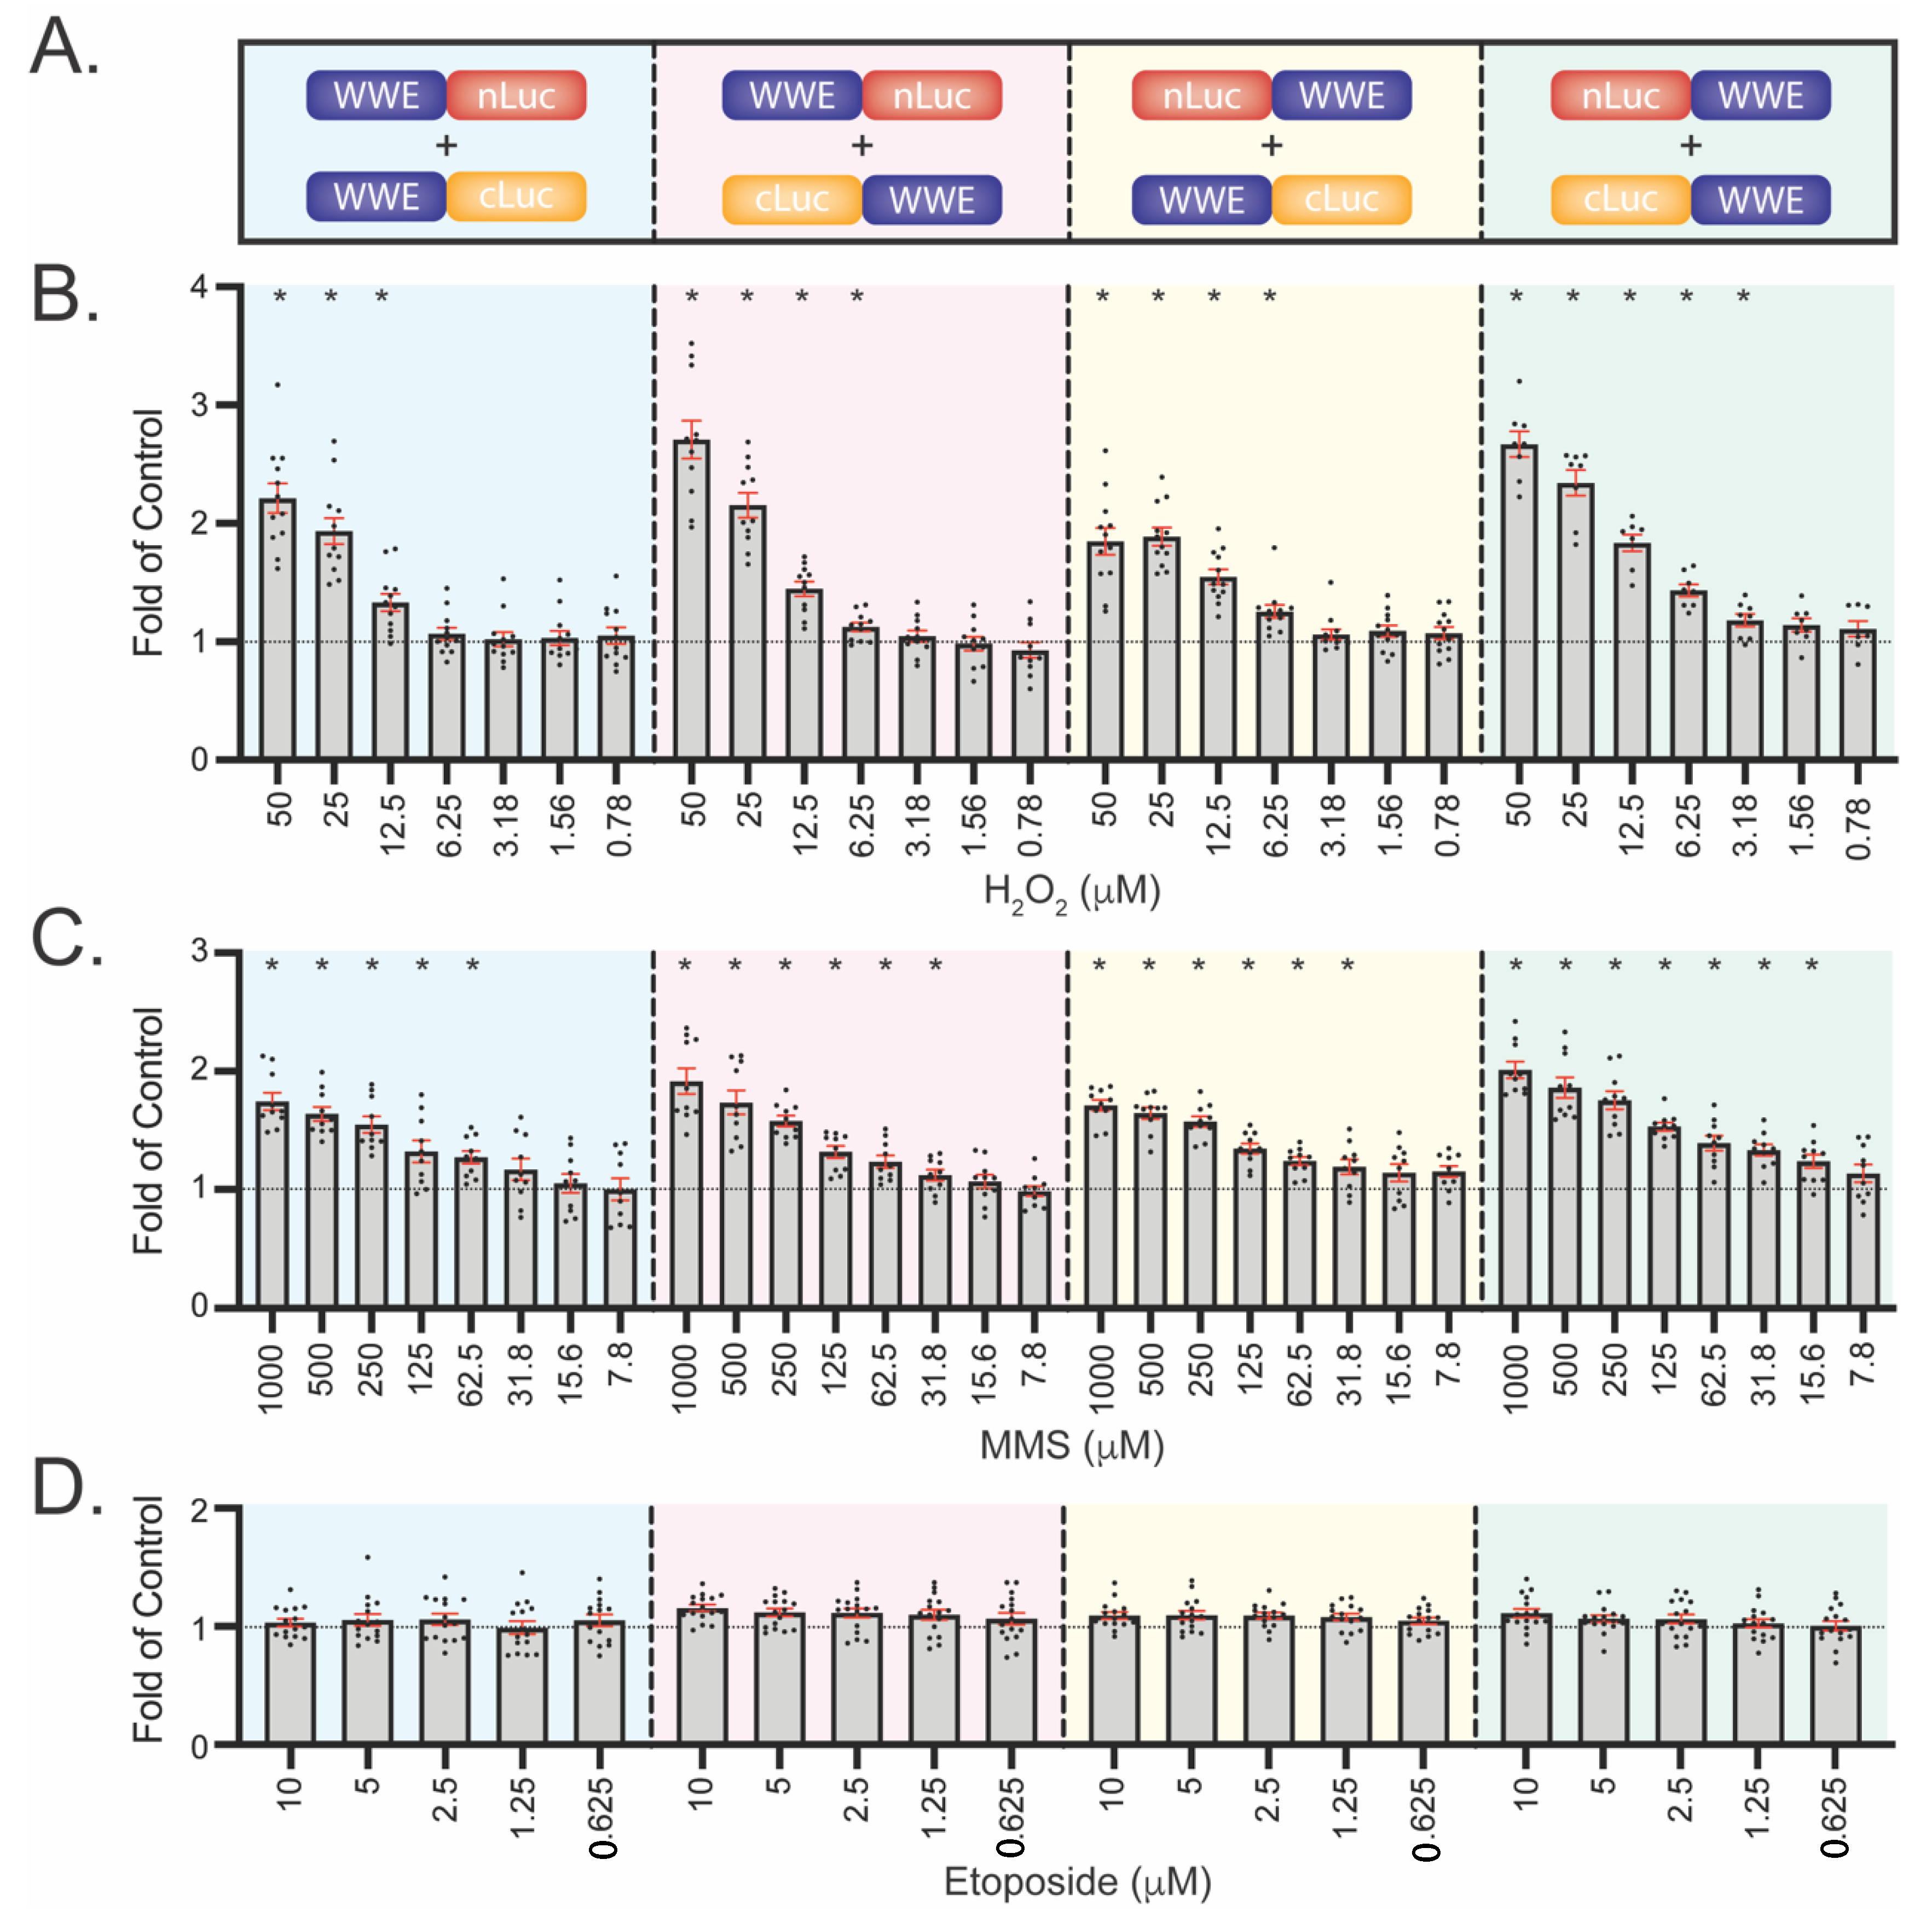
3.4. Development of WWE-Mediated Split Luciferase PAR Detection Assay
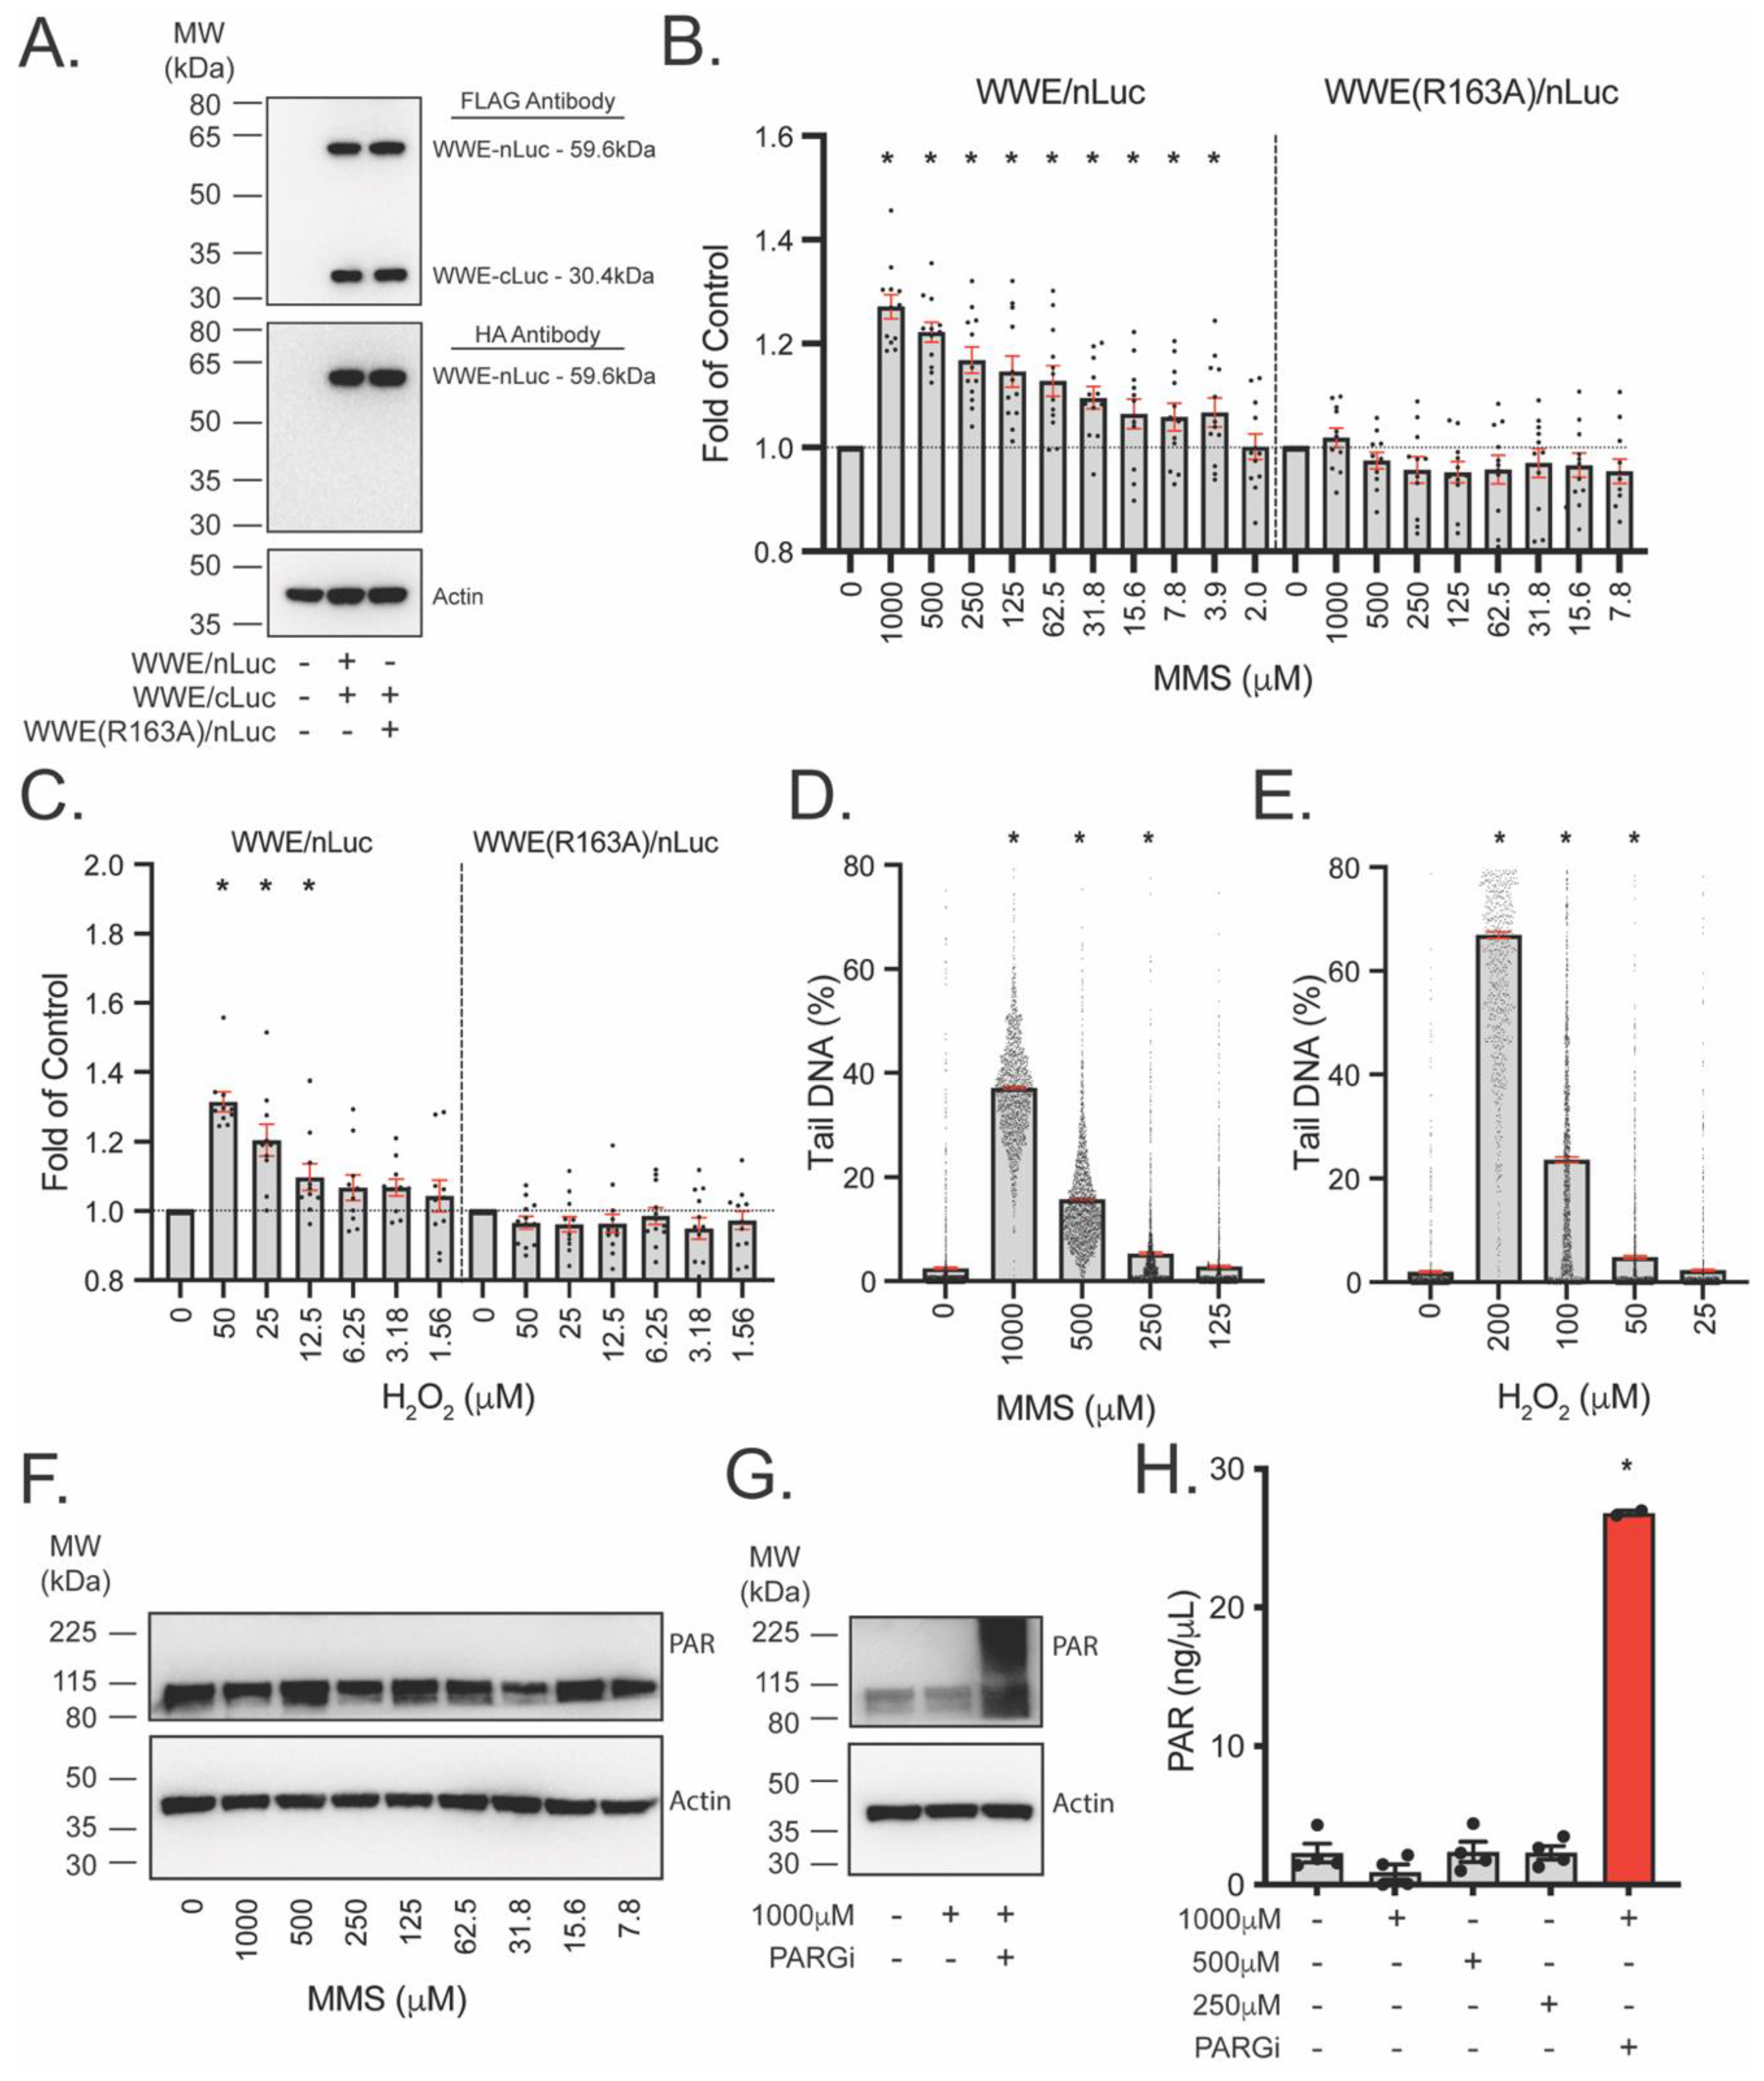
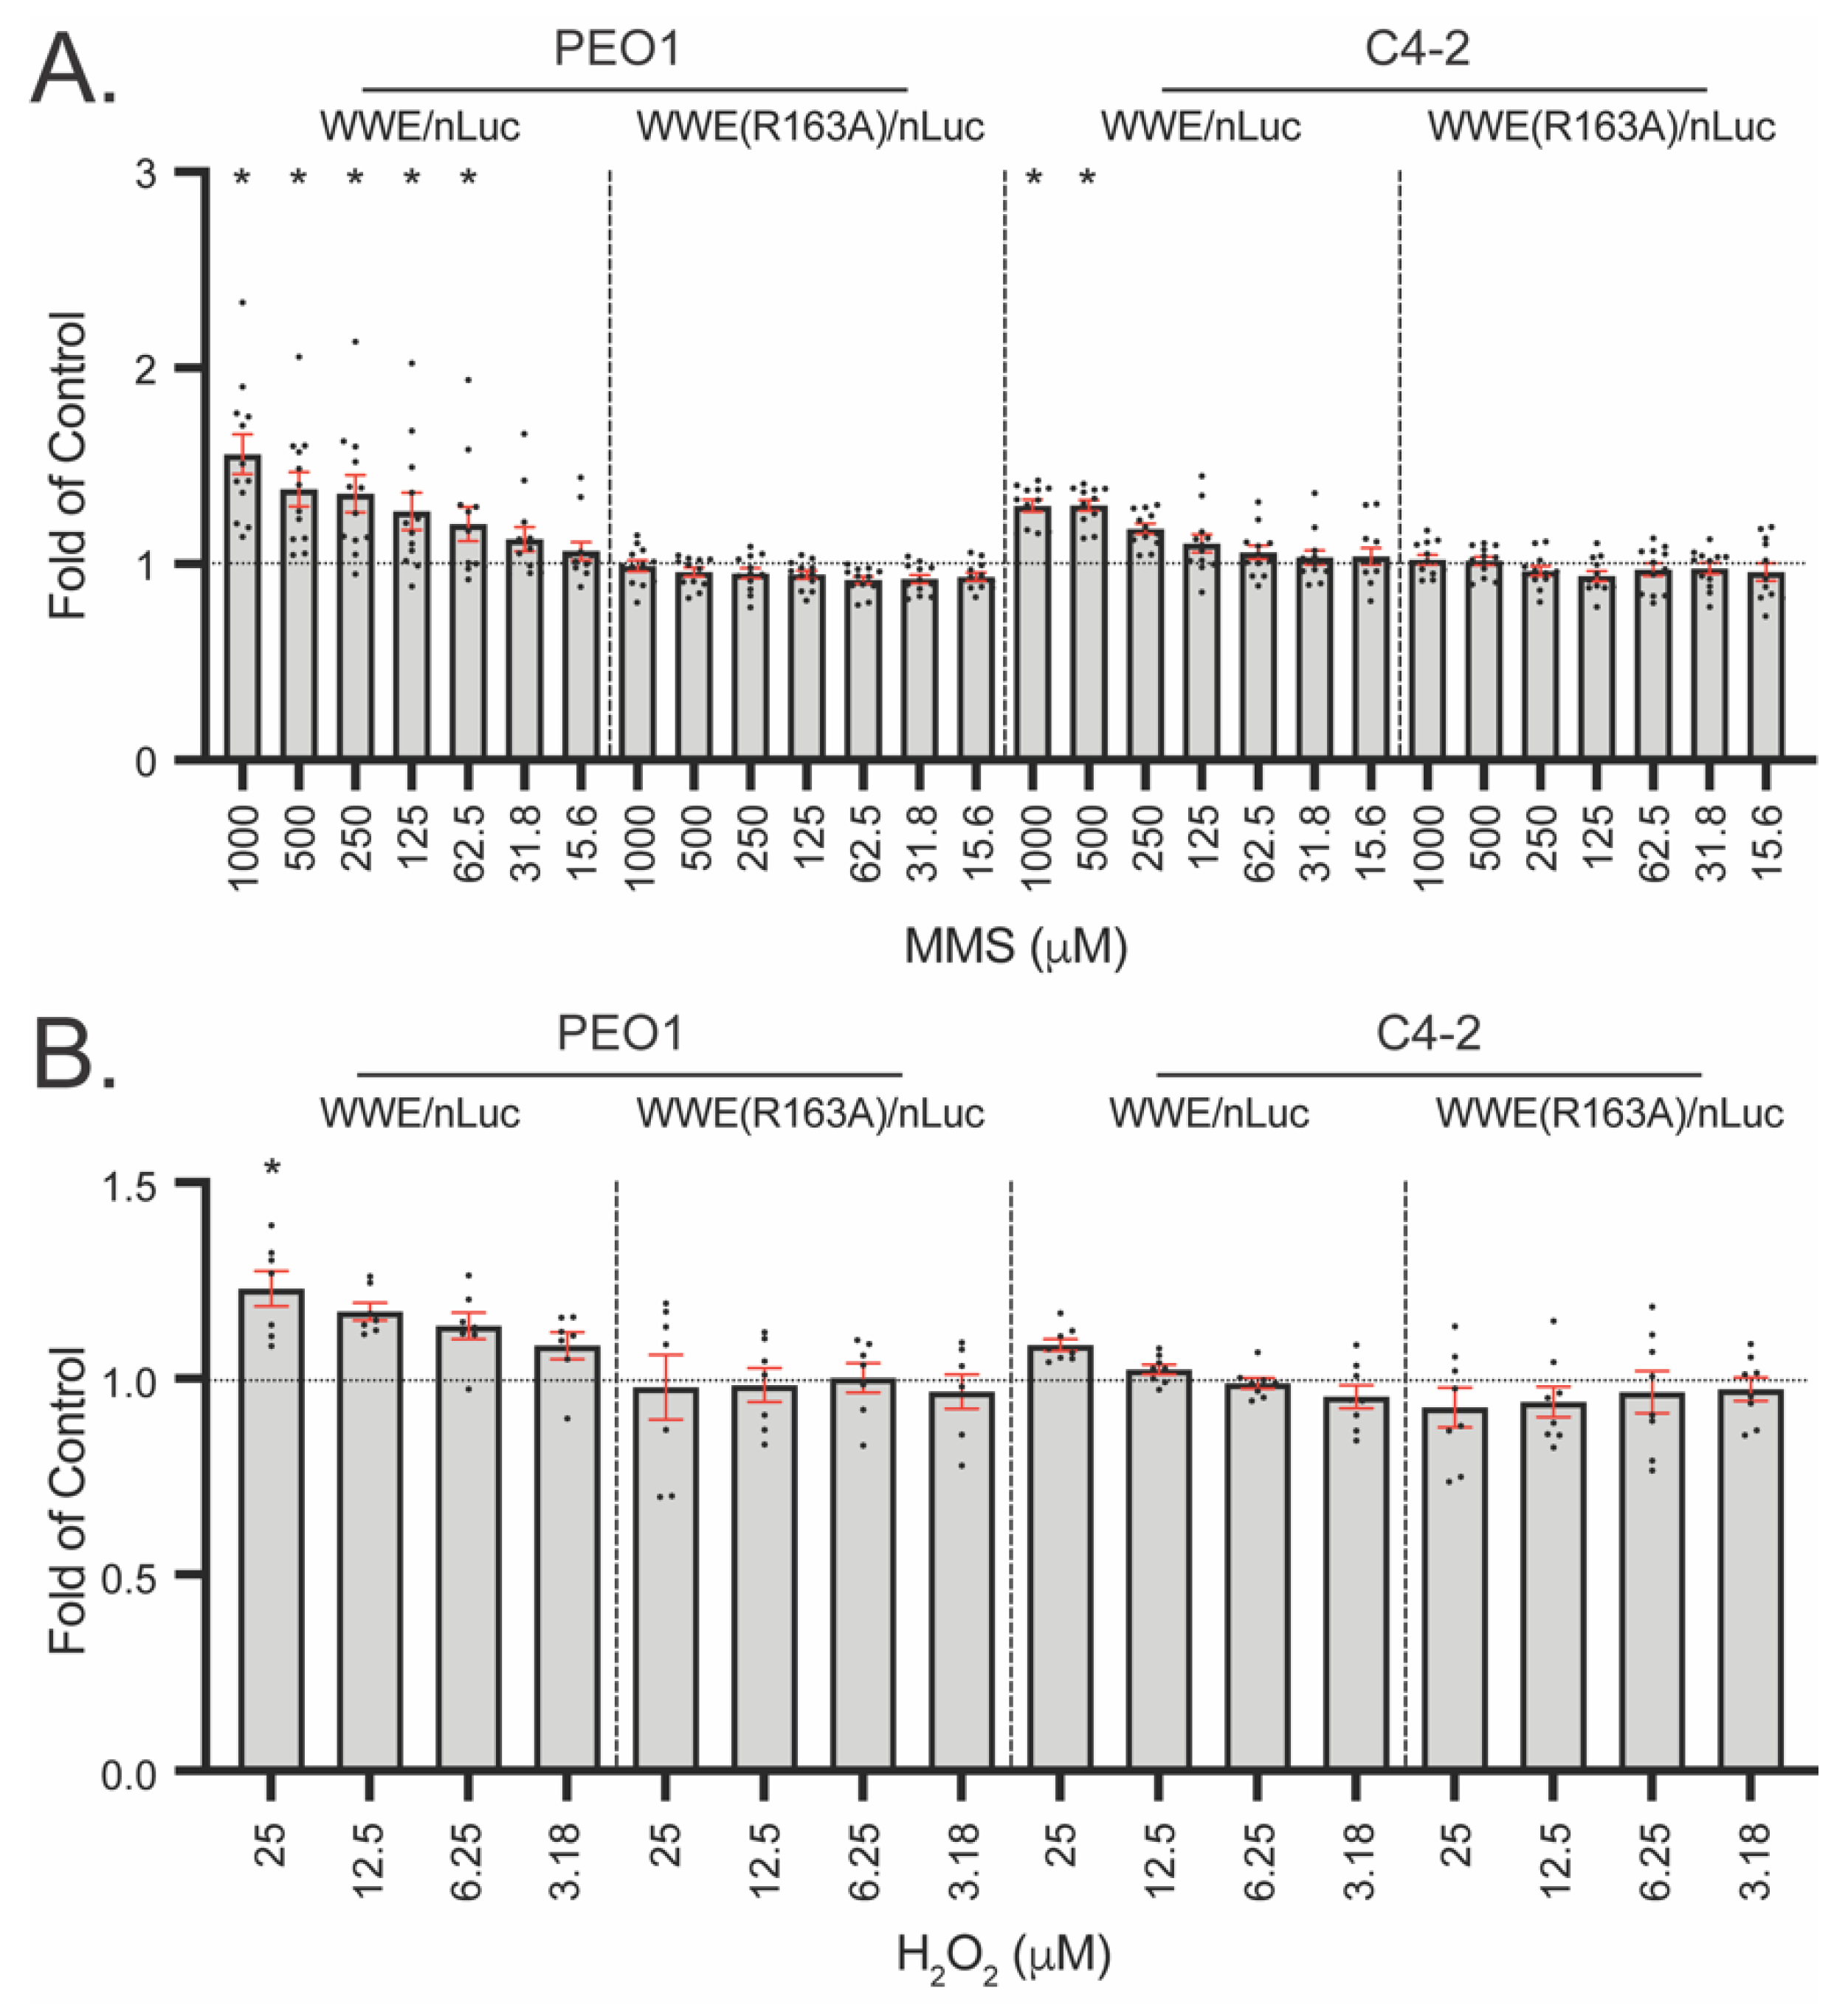
3.5. WWE Split Luciferase Assay for Detecting BRCA2 Deficiency
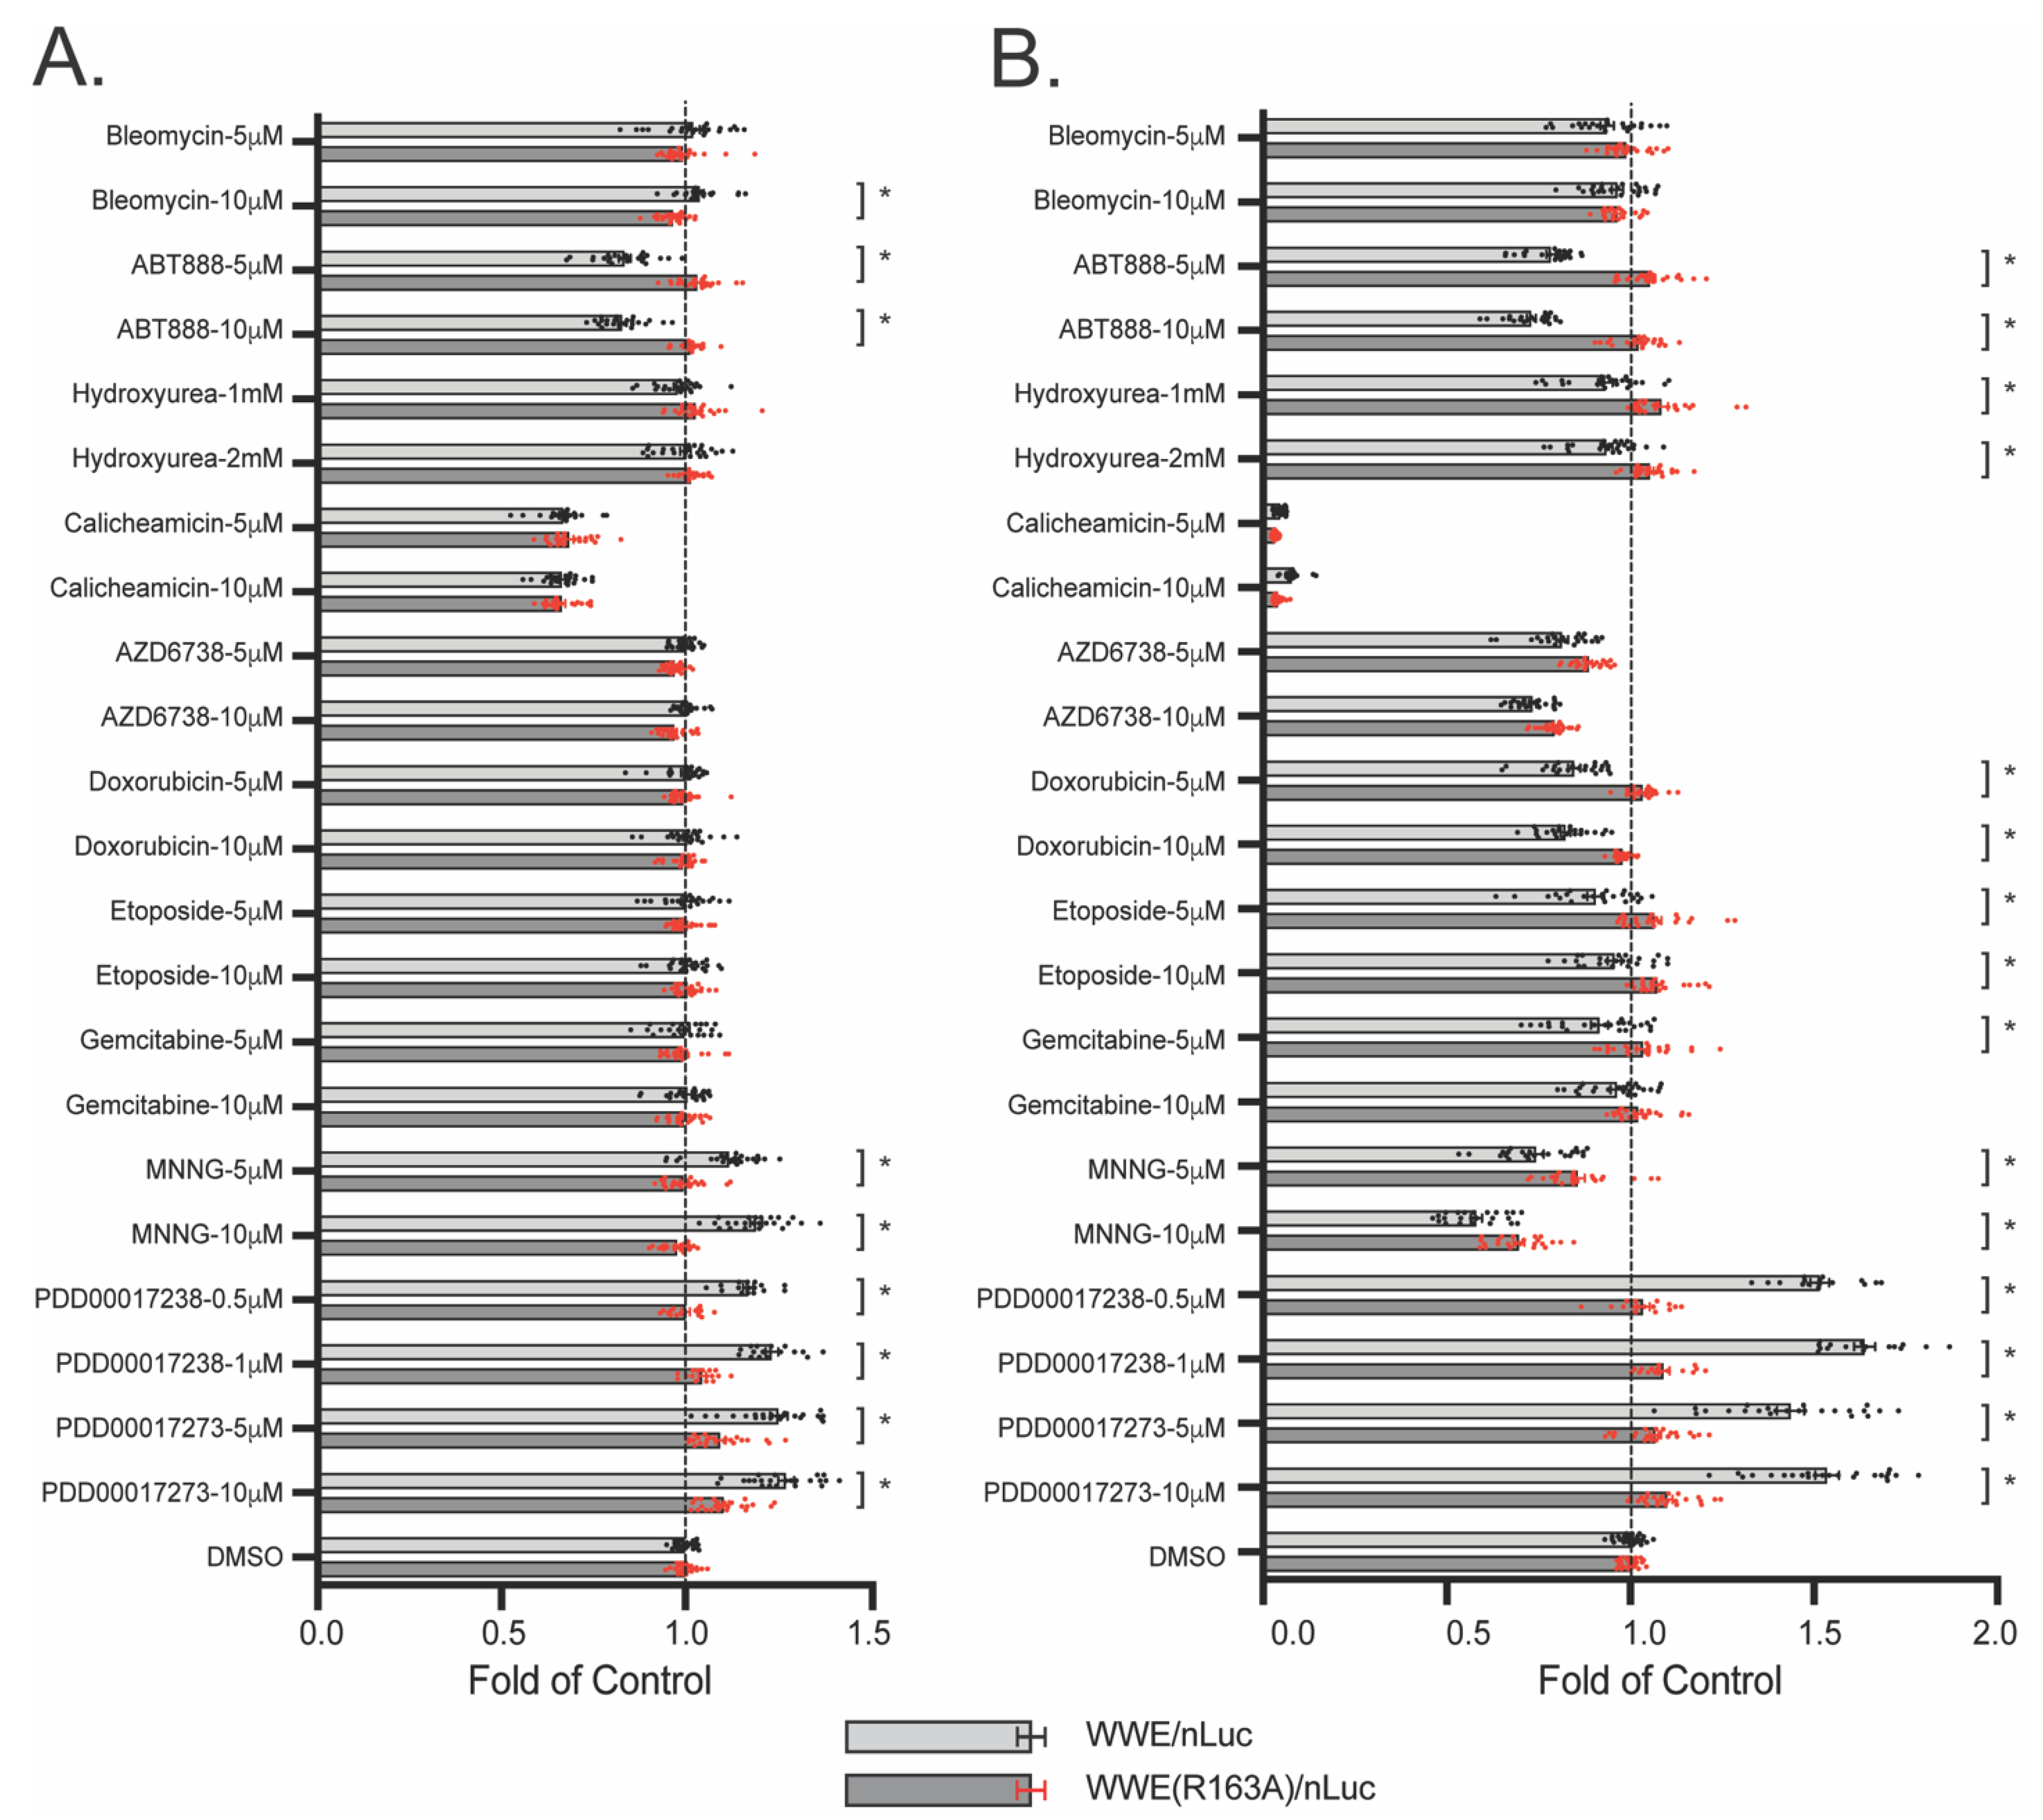
3.6. WWE Split Luciferase Assay as a Screening Tool
4. Discussion
5. Conclusions
Supplementary Materials
Author Contributions
Funding
Institutional Review Board Statement
Informed Consent Statement
Data Availability Statement
Acknowledgments
Conflicts of Interest
References
- Hanahan, D.; Weinberg, R.A. Hallmarks of cancer: The next generation. Cell 2011, 144, 646–674. [Google Scholar] [CrossRef] [Green Version]
- Almeida, K.H.; Sobol, R.W. A unified view of base excision repair: Lesion-dependent protein complexes regulated by post-translational modification. DNA Repair 2007, 6, 695–711. [Google Scholar] [CrossRef] [Green Version]
- Krokan, H.E.; Bjoras, M. Base excision repair. Cold Spring Harb. Perspect. Biol. 2013, 5, a012583. [Google Scholar] [CrossRef] [PubMed]
- Abbotts, R.; Wilson, D.M., 3rd. Coordination of DNA single strand break repair. Free Radic. Biol. Med. 2017, 107, 228–244. [Google Scholar] [CrossRef] [PubMed]
- Koczor, C.A.; Saville, K.M.; Andrews, J.F.; Clark, J.; Fang, Q.; Li, J.; Al-Rahahleh, R.Q.; Ibrahim, M.; McClellan, S.; Makarov, M.V.; et al. Temporal dynamics of base excision/single-strand break repair protein complex assembly/disassembly are modulated by the PARP/NAD(+)/SIRT6 axis. Cell Rep. 2021, 37, 109917. [Google Scholar] [CrossRef] [PubMed]
- El-Khamisy, S.F.; Masutani, M.; Suzuki, H.; Caldecott, K.W. A requirement for PARP-1 for the assembly or stability of XRCC1 nuclear foci at sites of oxidative DNA damage. Nucleic Acids Res. 2003, 31, 5526–5533. [Google Scholar] [CrossRef] [Green Version]
- Dantzer, F.; de La Rubia, G.; Menissier-De Murcia, J.; Hostomsky, Z.; de Murcia, G.; Schreiber, V. Base excision repair is impaired in mammalian cells lacking Poly(ADP-ribose) polymerase-1. Biochemistry 2000, 39, 7559–7569. [Google Scholar] [CrossRef]
- Schreiber, V.; Ame, J.C.; Dolle, P.; Schultz, I.; Rinaldi, B.; Fraulob, V.; Menissier-de Murcia, J.; de Murcia, G. Poly(ADP-ribose) polymerase-2 (PARP-2) is required for efficient base excision DNA repair in association with PARP-1 and XRCC1. J. Biol. Chem. 2002, 277, 23028–23036. [Google Scholar] [CrossRef] [Green Version]
- Teloni, F.; Altmeyer, M. Readers of poly(ADP-ribose): Designed to be fit for purpose. Nucleic Acids Res. 2016, 44, 993–1006. [Google Scholar] [CrossRef] [Green Version]
- Saville, K.M.; Clark, J.; Wilk, A.; Rogers, G.D.; Andrews, J.F.; Koczor, C.A.; Sobol, R.W. NAD(+)-mediated regulation of mammalian base excision repair. DNA Repair 2020, 93, 102930. [Google Scholar] [CrossRef]
- Fouquerel, E.; Sobol, R.W. ARTD1 (PARP1) activation and NAD(+) in DNA repair and cell death. DNA Repair 2014, 23, 27–32. [Google Scholar] [CrossRef] [Green Version]
- Bryant, H.E.; Schultz, N.; Thomas, H.D.; Parker, K.M.; Flower, D.; Lopez, E.; Kyle, S.; Meuth, M.; Curtin, N.J.; Helleday, T. Specific killing of BRCA2-deficient tumours with inhibitors of poly(ADP-ribose) polymerase. Nature 2005, 434, 913–917. [Google Scholar] [CrossRef]
- Farmer, H.; McCabe, N.; Lord, C.J.; Tutt, A.N.; Johnson, D.A.; Richardson, T.B.; Santarosa, M.; Dillon, K.J.; Hickson, I.; Knights, C.; et al. Targeting the DNA repair defect in BRCA mutant cells as a therapeutic strategy. Nature 2005, 434, 917–921. [Google Scholar] [CrossRef]
- Cong, K.; Peng, M.; Kousholt, A.N.; Lee, W.T.C.; Lee, S.; Nayak, S.; Krais, J.; VanderVere-Carozza, P.S.; Pawelczak, K.S.; Calvo, J.; et al. Replication gaps are a key determinant of PARP inhibitor synthetic lethality with BRCA deficiency. Mol. Cell 2021, 81, 3227. [Google Scholar] [CrossRef]
- Paes Dias, M.; Tripathi, V.; van der Heijden, I.; Cong, K.; Manolika, E.M.; Bhin, J.; Gogola, E.; Galanos, P.; Annunziato, S.; Lieftink, C.; et al. Loss of nuclear DNA ligase III reverts PARP inhibitor resistance in BRCA1/53BP1 double-deficient cells by exposing ssDNA gaps. Mol. Cell 2021, 81, 4692–4708.e4699. [Google Scholar] [CrossRef]
- Vaitsiankova, A.; Burdova, K.; Sobol, M.; Gautam, A.; Benada, O.; Hanzlikova, H.; Caldecott, K.W. PARP inhibition impedes the maturation of nascent DNA strands during DNA replication. Nat. Struct. Mol. Biol. 2022, 29, 329–338. [Google Scholar] [CrossRef]
- Hanzlikova, H.; Kalasova, I.; Demin, A.A.; Pennicott, L.E.; Cihlarova, Z.; Caldecott, K.W. The Importance of Poly(ADP-Ribose) Polymerase as a Sensor of Unligated Okazaki Fragments during DNA Replication. Mol. Cell 2018, 71, 319–331.e313. [Google Scholar] [CrossRef] [PubMed] [Green Version]
- Gottipati, P.; Vischioni, B.; Schultz, N.; Solomons, J.; Bryant, H.E.; Djureinovic, T.; Issaeva, N.; Sleeth, K.; Sharma, R.A.; Helleday, T. Poly(ADP-ribose) polymerase is hyperactivated in homologous recombination-defective cells. Cancer Res. 2010, 70, 5389–5398. [Google Scholar] [CrossRef] [PubMed] [Green Version]
- Panzarino, N.J.; Krais, J.J.; Cong, K.; Peng, M.; Mosqueda, M.; Nayak, S.U.; Bond, S.M.; Calvo, J.A.; Doshi, M.B.; Bere, M.; et al. Replication Gaps Underlie BRCA Deficiency and Therapy Response. Cancer Res. 2021, 81, 1388–1397. [Google Scholar] [CrossRef] [PubMed]
- Fong, P.C.; Boss, D.S.; Yap, T.A.; Tutt, A.; Wu, P.; Mergui-Roelvink, M.; Mortimer, P.; Swaisland, H.; Lau, A.; O’Connor, M.J.; et al. Inhibition of poly(ADP-ribose) polymerase in tumors from BRCA mutation carriers. N. Engl. J. Med. 2009, 361, 123–134. [Google Scholar] [CrossRef] [Green Version]
- Sakai, W.; Swisher, E.M.; Jacquemont, C.; Chandramohan, K.V.; Couch, F.J.; Langdon, S.P.; Wurz, K.; Higgins, J.; Villegas, E.; Taniguchi, T. Functional restoration of BRCA2 protein by secondary BRCA2 mutations in BRCA2-mutated ovarian carcinoma. Cancer Res. 2009, 69, 6381–6386. [Google Scholar] [CrossRef] [Green Version]
- Sakai, W.; Swisher, E.M.; Karlan, B.Y.; Agarwal, M.K.; Higgins, J.; Friedman, C.; Villegas, E.; Jacquemont, C.; Farrugia, D.J.; Couch, F.J.; et al. Secondary mutations as a mechanism of cisplatin resistance in BRCA2-mutated cancers. Nature 2008, 451, 1116–1120. [Google Scholar] [CrossRef] [PubMed] [Green Version]
- Edwards, S.L.; Brough, R.; Lord, C.J.; Natrajan, R.; Vatcheva, R.; Levine, D.A.; Boyd, J.; Reis-Filho, J.S.; Ashworth, A. Resistance to therapy caused by intragenic deletion in BRCA2. Nature 2008, 451, 1111–1115. [Google Scholar] [CrossRef] [PubMed]
- Kawamitsu, H.; Hoshino, H.; Okada, H.; Miwa, M.; Momoi, H.; Sugimura, T. Monoclonal antibodies to poly(adenosine diphosphate ribose) recognize different structures. Biochemistry 1984, 23, 3771–3777. [Google Scholar] [CrossRef] [PubMed]
- Gibson, B.A.; Conrad, L.B.; Huang, D.; Kraus, W.L. Generation and Characterization of Recombinant Antibody-like ADP-Ribose Binding Proteins. Biochemistry 2017, 56, 6305–6316. [Google Scholar] [CrossRef] [PubMed]
- Furman, J.L.; Mok, P.W.; Shen, S.; Stains, C.I.; Ghosh, I. A turn-on split-luciferase sensor for the direct detection of poly(ADP-ribose) as a marker for DNA repair and cell death. Chem. Commun. 2011, 47, 397–399. [Google Scholar] [CrossRef] [Green Version]
- Krastev, D.B.; Pettitt, S.J.; Campbell, J.; Song, F.; Tanos, B.E.; Stoynov, S.S.; Ashworth, A.; Lord, C.J. Coupling bimolecular PARylation biosensors with genetic screens to identify PARylation targets. Nat. Commun. 2018, 9, 2016. [Google Scholar] [CrossRef]
- Serebrovskaya, E.O.; Podvalnaya, N.M.; Dudenkova, V.V.; Efremova, A.S.; Gurskaya, N.G.; Gorbachev, D.A.; Luzhin, A.V.; Kantidze, O.L.; Zagaynova, E.V.; Shram, S.I.; et al. Genetically Encoded Fluorescent Sensor for Poly-ADP-Ribose. Int. J. Mol. Sci. 2020, 21, 5004. [Google Scholar] [CrossRef]
- Guillemette, S.; Serra, R.W.; Peng, M.; Hayes, J.A.; Konstantinopoulos, P.A.; Green, M.R.; Cantor, S.B. Resistance to therapy in BRCA2 mutant cells due to loss of the nucleosome remodeling factor CHD4. Genes Dev. 2015, 29, 489–494. [Google Scholar] [CrossRef]
- Fouquerel, E.; Goellner, E.M.; Yu, Z.; Gagne, J.P.; Barbi de Moura, M.; Feinstein, T.; Wheeler, D.; Redpath, P.; Li, J.; Romero, G.; et al. ARTD1/PARP1 negatively regulates glycolysis by inhibiting hexokinase 1 independent of NAD+ depletion. Cell Rep. 2014, 8, 1819–1831. [Google Scholar] [CrossRef] [Green Version]
- Fang, Q.; Inanc, B.; Schamus, S.; Wang, X.H.; Wei, L.; Brown, A.R.; Svilar, D.; Sugrue, K.F.; Goellner, E.M.; Zeng, X.; et al. HSP90 regulates DNA repair via the interaction between XRCC1 and DNA polymerase beta. Nat. Commun. 2014, 5, 5513. [Google Scholar] [CrossRef] [PubMed] [Green Version]
- Slyskova, J.; Sabatella, M.; Ribeiro-Silva, C.; Stok, C.; Theil, A.F.; Vermeulen, W.; Lans, H. Base and nucleotide excision repair facilitate resolution of platinum drugs-induced transcription blockage. Nucleic Acids Res. 2018, 46, 9537–9549. [Google Scholar] [CrossRef] [PubMed] [Green Version]
- Fang, Q.; Andrews, J.; Sharma, N.; Wilk, A.; Clark, J.; Slyskova, J.; Koczor, C.A.; Lans, H.; Prakash, A.; Sobol, R.W. Stability and sub-cellular localization of DNA polymerase beta is regulated by interactions with NQO1 and XRCC1 in response to oxidative stress. Nucleic Acids Res. 2019, 47, 6269–6286. [Google Scholar] [CrossRef] [PubMed] [Green Version]
- Sanjana, N.E.; Shalem, O.; Zhang, F. Improved vectors and genome-wide libraries for CRISPR screening. Nat. Methods 2014, 11, 783–784. [Google Scholar] [CrossRef] [PubMed] [Green Version]
- Sykora, P.; Witt, K.L.; Revanna, P.; Smith-Roe, S.L.; Dismukes, J.; Lloyd, D.G.; Engelward, B.P.; Sobol, R.W. Next generation high throughput DNA damage detection platform for genotoxic compound screening. Sci. Rep. 2018, 8, 2771. [Google Scholar] [CrossRef]
- Wang, Z.; Michaud, G.A.; Cheng, Z.; Zhang, Y.; Hinds, T.R.; Fan, E.; Cong, F.; Xu, W. Recognition of the iso-ADP-ribose moiety in poly(ADP-ribose) by WWE domains suggests a general mechanism for poly(ADP-ribosyl)ation-dependent ubiquitination. Genes Dev. 2012, 26, 235–240. [Google Scholar] [CrossRef] [PubMed] [Green Version]
- Donawho, C.K.; Luo, Y.; Luo, Y.; Penning, T.D.; Bauch, J.L.; Bouska, J.J.; Bontcheva-Diaz, V.D.; Cox, B.F.; DeWeese, T.L.; Dillehay, L.E.; et al. ABT-888, an orally active poly(ADP-ribose) polymerase inhibitor that potentiates DNA-damaging agents in preclinical tumor models. Clin. Cancer Res. 2007, 13, 2728–2737. [Google Scholar] [CrossRef] [Green Version]
- James, D.I.; Smith, K.M.; Jordan, A.M.; Fairweather, E.E.; Griffiths, L.A.; Hamilton, N.S.; Hitchin, J.R.; Hutton, C.P.; Jones, S.; Kelly, P.; et al. First-in-Class Chemical Probes against Poly(ADP-ribose) Glycohydrolase (PARG) Inhibit DNA Repair with Differential Pharmacology to Olaparib. ACS Chem. Biol. 2016, 11, 3179–3190. [Google Scholar] [CrossRef]
- Svilar, D.; Goellner, E.M.; Almeida, K.H.; Sobol, R.W. Base excision repair and lesion-dependent subpathways for repair of oxidative DNA damage. Antioxid. Redox Signal. 2011, 14, 2491–2507. [Google Scholar] [CrossRef] [Green Version]
- Royant, A.; Noirclerc-Savoye, M. Stabilizing role of glutamic acid 222 in the structure of Enhanced Green Fluorescent Protein. J. Struct. Biol. 2011, 174, 385–390. [Google Scholar] [CrossRef]
- Donnelly, M.L.L.; Hughes, L.E.; Luke, G.; Mendoza, H.; Ten Dam, E.; Gani, D.; Ryan, M.D. The ‘cleavage’ activities of foot-and-mouth disease virus 2A site-directed mutants and naturally occurring ‘2A-like’ sequences. J. Gen. Virol. 2001, 82, 1027–1041. [Google Scholar] [CrossRef]
- Rouleau, M.; Patel, A.; Hendzel, M.J.; Kaufmann, S.H.; Poirier, G.G. PARP inhibition: PARP1 and beyond. Nat. Rev. Cancer 2010, 10, 293–301. [Google Scholar] [CrossRef] [PubMed] [Green Version]
- Buntz, A.; Wallrodt, S.; Gwosch, E.; Schmalz, M.; Beneke, S.; Ferrando-May, E.; Marx, A.; Zumbusch, A. Real-Time Cellular Imaging of Protein Poly(ADP-ribos)ylation. Angew. Chem. Int. Ed. 2016, 55, 11256–11260. [Google Scholar] [CrossRef] [Green Version]
- Wallrodt, S.; Buntz, A.; Wang, Y.; Zumbusch, A.; Marx, A. Bioorthogonally Functionalized NAD(+) Analogues for In-Cell Visualization of Poly(ADP-Ribose) Formation. Angew. Chem. Int. Ed. 2016, 55, 7660–7664. [Google Scholar] [CrossRef] [PubMed]
- Smith, R.; Timinszky, G. Monitoring Poly(ADP-Ribosyl)ation in Response to DNA Damage in Live Cells Using Fluorescently Tagged Macrodomains. Methods Mol. Biol. 2018, 1813, 11–24. [Google Scholar] [CrossRef] [PubMed]
- Walker, S.; Landovitz, R.; Ding, W.D.; Ellestad, G.A.; Kahne, D. Cleavage behavior of calicheamicin gamma 1 and calicheamicin T. Proc. Natl. Acad. Sci. USA 1992, 89, 4608–4612. [Google Scholar] [CrossRef] [PubMed] [Green Version]
- Li, J.; Saville, K.M.; Ibrahim, M.; Zeng, X.; McClellan, S.; Angajala, A.; Beiser, A.; Andrews, J.F.; Sun, M.; Koczor, C.A.; et al. NAD(+) bioavailability mediates PARG inhibition-induced replication arrest, intra S-phase checkpoint and apoptosis in glioma stem cells. NAR Cancer 2021, 3, zcab044. [Google Scholar] [CrossRef] [PubMed]
- Gravells, P.; Grant, E.; Smith, K.M.; James, D.I.; Bryant, H.E. Specific killing of DNA damage-response deficient cells with inhibitors of poly(ADP-ribose) glycohydrolase. DNA Repair 2017, 52, 81–91. [Google Scholar] [CrossRef]
- Houl, J.H.; Ye, Z.; Brosey, C.A.; Balapiti-Modarage, L.P.F.; Namjoshi, S.; Bacolla, A.; Laverty, D.; Walker, B.L.; Pourfarjam, Y.; Warden, L.S.; et al. Selective small molecule PARG inhibitor causes replication fork stalling and cancer cell death. Nat. Commun. 2019, 10, 5654. [Google Scholar] [CrossRef] [Green Version]
- Schindelin, J.; Arganda-Carreras, I.; Frise, E.; Kaynig, V.; Longair, M.; Pietzsch, T.; Preibisch, S.; Rueden, C.; Saalfeld, S.; Schmid, B.; et al. Fiji: An open-source platform for biological-image analysis. Nat. Methods 2012, 9, 676–682. [Google Scholar] [CrossRef] [Green Version]


Publisher’s Note: MDPI stays neutral with regard to jurisdictional claims in published maps and institutional affiliations. |
© 2022 by the authors. Licensee MDPI, Basel, Switzerland. This article is an open access article distributed under the terms and conditions of the Creative Commons Attribution (CC BY) license (https://creativecommons.org/licenses/by/4.0/).
Share and Cite
Koczor, C.A.; Haider, A.J.; Saville, K.M.; Li, J.; Andrews, J.F.; Beiser, A.V.; Sobol, R.W. Live Cell Detection of Poly(ADP-Ribose) for Use in Genetic and Genotoxic Compound Screens. Cancers 2022, 14, 3676. https://doi.org/10.3390/cancers14153676
Koczor CA, Haider AJ, Saville KM, Li J, Andrews JF, Beiser AV, Sobol RW. Live Cell Detection of Poly(ADP-Ribose) for Use in Genetic and Genotoxic Compound Screens. Cancers. 2022; 14(15):3676. https://doi.org/10.3390/cancers14153676
Chicago/Turabian StyleKoczor, Christopher A., Aaron J. Haider, Kate M. Saville, Jianfeng Li, Joel F. Andrews, Alison V. Beiser, and Robert W. Sobol. 2022. "Live Cell Detection of Poly(ADP-Ribose) for Use in Genetic and Genotoxic Compound Screens" Cancers 14, no. 15: 3676. https://doi.org/10.3390/cancers14153676
APA StyleKoczor, C. A., Haider, A. J., Saville, K. M., Li, J., Andrews, J. F., Beiser, A. V., & Sobol, R. W. (2022). Live Cell Detection of Poly(ADP-Ribose) for Use in Genetic and Genotoxic Compound Screens. Cancers, 14(15), 3676. https://doi.org/10.3390/cancers14153676