
Gastrointestinal Stromal Tumors (GIST): A Population-Based Study Using the SEER Database, including Management and Recent Advances in Targeted Therapy


 ,
,  , ,
, ,  , , ,
, , ,
Abstract
:Simple Summary
Abstract
1. Introduction
2. Methods
3. Results
3.1. I- Demographic Characteristics
3.2. I- Primary Site, Size, Grade, and SEER Stage
3.3. I- Treatment
3.3.1. Overall and Location Based
3.3.2. Treatment According to Tumor Size, Stage, and Grade
3.4. I- Overall and Cause-Specific Survival by Treatment
- ⮚
- Five-year survival by location:
- ⮚
- Five-year disease-specific survival by treatment:
- ⮚
- Survival trends for 5-year disease-specific survival by treatment:
3.5. I- Univariate and Multivariable Analysis
4. Discussion
4.1. Targeted Treatments and Emerging Therapies
4.2. Limitations
5. Conclusions
Author Contributions
Funding
Institutional Review Board Statement
Informed Consent Statement
Data Availability Statement
Acknowledgments
Conflicts of Interest
References
- Moch, H. Soft Tissue and Bone Tumours, WHO Classification of Tumours, 5th ed.; Series/Who-Classification-Of-Tumours/Soft-Tissue-And-Bone-Tumours-2020; IARC: Lyon, France, 2020; Volume 3, Available online: https://publications.iarc.fr/Book-And-Report (accessed on 20 May 2022).
- Soreide, K.; Sandvik, O.M.; Soreide, J.A.; Giljaca, V.; Jureckova, A.; Bulusu, V.R. Global epidemiology of gastrointestinal stromal tumours (GIST): A systematic review of population-based cohort studies. Cancer Epidemiol. 2016, 40, 39–46. [Google Scholar] [CrossRef] [PubMed] [Green Version]
- Demetri, G.D.; von Mehren, M.; Antonescu, C.R.; DeMatteo, R.P.; Ganjoo, K.N.; Maki, R.G.; Wayne, J.D. NCCN Task Force report: Update on the management of patients with gastrointestinal stromal tumors. J. Natl. Comp. Cancer Netw. 2010, 8, S-1. [Google Scholar] [CrossRef] [PubMed] [Green Version]
- Miettinen, M.; Wang, Z.F.; Lasota, J. DOG1 antibody in the differential diagnosis of gastrointestinal stromal tumors: A study of 1840 cases. Am. J. Surg. Pathol. 2009, 33, 1401–1408. [Google Scholar] [CrossRef] [PubMed]
- Nilsson, B.; Bümming, P.; Meis-Kindblom, J.M.; Odén, A.; Dortok, A.; Gustavsson, B.; Sablinska, K.; Kindblom, L.G. Gastrointestinal stromal tumors: The incidence, prevalence, clinical course, and prognostication in the preimatinib mesylate era—A population-based study in western Sweden. Cancer 2005, 103, 821–829. [Google Scholar] [CrossRef]
- Ma, G.L.; Murphy, J.D.; Martinez, M.E.; Sicklick, J.K. Epidemiology of gastrointestinal stromal tumors in the era of histology codes: Results of a population-based study. Cancer Epidemiol. Biomark. Prev. 2015, 24, 298–302. [Google Scholar]
- DeMatteo, R.P.; Lewis, J.J.; Leung, D.; Mudan, S.S.; Woodruff, J.M.; Brennan, M.F. Two hundred gastrointestinal stromal tumors: Recurrence patterns and prognostic factors for survival. Ann. Surg. 2000, 231, 51–58. [Google Scholar] [CrossRef]
- Miettinen, M.; Sobin, L.H.; Lasota, J. Gastrointestinal stromal tumors of the stomach: A clinicopathologic, immunohistochemical, and molecular genetic study of 1765 cases with long-term follow-up. Am. J. Surg. Pathol. 2005, 29, 52–68. [Google Scholar] [CrossRef]
- Papanikolaou, I.S.; Triantafyllou, K.; Kourikou, A.; Rösch, T. Endoscopic ultrasonography for gastric submucosal lesions. World J. Gastrointest. Endosc. 2011, 3, 86–94. [Google Scholar] [CrossRef]
- Kim, J.S.; Kim, H.J.; Park, S.H.; Lee, J.S.; Kim, A.Y.; Ha, H.K. Computed tomography features and predictive findings of ruptured gastrointestinal stromal tumors. Eur. Radiol. 2017, 27, 2583–2590. [Google Scholar] [CrossRef]
- Schaefer, I.M.; DeMatteo, R.P.; Serrano, C. The GIST of Advances in Treatment of Advanced Gastrointestinal Stromal Tumor. Am. Soc. Clin. Oncol. Educ. Book. 2022, 42, 885–889. [Google Scholar] [CrossRef]
- Medeiros, F.; Corless, C.L.; Duensing, A.; Hornick, J.L.; Oliveira, A.M.; Heinrich, M.C.; Fletcher, J.A.; Fletcher, C.D. KIT-negative gastrointestinal stromal tumors: Proof of concept and therapeutic implications. Am. J. Surg. Pathol. 2004, 28, 889–894. [Google Scholar] [CrossRef]
- Ricci, R.; Martini, M.; Cenci, T.; Carbone, A.; Lanza, P.; Biondi, A.; Rindi, G.; Cassano, A.; Larghi, A.; Persiani, R.; et al. PDGFRA-mutant syndrome . Mod. Pathol. 2015, 28, 954–964. [Google Scholar] [CrossRef] [Green Version]
- Bardsley, M.R.; Horváth, V.J.; Asuzu, D.T.; Lorincz, A.; Redelman, D.; Hayashi, Y.; Popko, L.N.; Young, D.L.; Lomberk, G.A.; Urrutia, R.A.; et al. Kitlow stem cells cause resistance to Kit/platelet-derived growth factor alpha inhibitors in murine gastrointestinal stromal tumors. Gastroenterology 2010, 139, 942–952. [Google Scholar] [CrossRef] [Green Version]
- Ricci, R.; Giustiniani, M.C.; Gessi, M.; Lanza, P.; Castri, F.; Biondi, A.; Persiani, R.; Vecchio, F.M.; Risio, M. Telocytes are the physiological counterpart of inflammatory fibroid polyps and PDGFRA-mutant GISTs. J. Cell. Mol. Med. 2018, 22, 4856–4862. [Google Scholar] [CrossRef] [Green Version]
- Miettinen, M.; Killian, J.K.; Wang, Z.F.; Lasota, J.; Lau, C.; Jones, L.; Walker, R.; Pineda, M.; Zhu, Y.J.; Kim, S.Y.; et al. Immunohistochemical loss of succinate dehydrogenase subunit A (SDHA) in gastrointestinal stromal tumors (GISTs) signals SDHA germline mutation. Am. J. Surg. Pathol. 2013, 37, 234–240. [Google Scholar] [CrossRef] [Green Version]
- Boikos, S.A.; Pappo, A.S.; Killian, J.K.; LaQuaglia, M.P.; Weldon, C.B.; George, S.; Trent, J.C.; von Mehren, M.; Wright, J.A.; Schiffman, J.D.; et al. Molecular Subtypes of KIT/PDGFRA Wild-Type Gastrointestinal Stromal Tumors: A Report From the National Institutes of Health Gastrointestinal Stromal Tumor Clinic. JAMA Oncol. 2016, 2, 922–928. [Google Scholar] [CrossRef] [Green Version]
- Kondo, J.; Huh, W.J.; Franklin, J.L.; Heinrich, M.C.; Rubin, B.P.; Coffey, R.J. A smooth muscle-derived, Braf-driven mouse model of gastrointestinal stromal tumor (GIST): Evidence for an alternative GIST cell-of-origin. J. Pathol. 2020, 252, 441–450. [Google Scholar] [CrossRef]
- IJzerman, N.S.; Drabbe, C.; den Hollander, D.; Mohammadi, M.; van Boven, H.; Desar, I.M.E.; Gelderblom, H.; Grünhagen, D.J.; Reyners, A.K.L.; van Noesel, M.M.; et al. Gastrointestinal Stromal Tumours (GIST) in Young Adult (18–40 Years) Patients: A Report from the Dutch GIST Registry. Cancers 2020, 12, 730. Available online: https://pubmed.ncbi.nlm.nih.gov/32244864 (accessed on 20 May 2022). [CrossRef] [Green Version]
- Güller, U.; Tarantino, I.; Cerny, T.; Schmied, B.M.; Warschkow, R. Population-based SEER trend analysis of overall and cancer-specific survival in 5138 patients with gastrointestinal stromal tumor. BMC Cancer 2015, 15, 557. [Google Scholar] [CrossRef] [Green Version]
- Kukar, M.; Kapil, A.; Papenfuss, W.; Groman, A.; Grobmyer, S.R.; Hochwald, S.N. Gastrointestinal stromal tumors (GISTs) at uncommon locations: A large population based analysis. J. Surg. Oncol. 2015, 111, 696–701. [Google Scholar] [CrossRef]
- Tryggvason, G.; Gíslason, H.G.; Magnússon, M.K.; Jónasson, J.G. Gastrointestinal stromal tumors in Iceland, 1990–2003: The icelandic GIST study, a population-based incidence, and pathologic risk stratification study. Int. J. Cancer 2005, 117, 289–293. [Google Scholar] [CrossRef]
- Guller, U.; Tarantino, I.; Cerny, T.; Ulrich, A.; Schmied, B.M.; Warschkow, R. Revisiting a dogma: Similar survival of patients with small bowel and gastric GIST. A population-based propensity score SEER analysis. Gastric Cancer Off. J. Int. Gastric Cancer Assoc. Jpn. Gastric Cancer Assoc. 2017, 20, 49–60. [Google Scholar] [CrossRef] [Green Version]
- Heinrich, M.C.; Corless, C.L. Gastric GI stromal tumors (GISTs): The role of surgery in the era of targeted therapy. J. Surg. Oncol. 2005, 90, 195–207. [Google Scholar] [CrossRef]
- Frankel, T.L.; Chang, A.E.; Wong, S.L. Surgical options for localized and advanced gastrointestinal stromal tumors. J. Surg. Oncol. 2011, 104, 882–887. [Google Scholar] [CrossRef] [Green Version]
- Ceccarelli, G.; Costa, G.; De Rosa, M.; Codacci Pisanelli, M.; Frezza, B.; De Prizio, M.; Bravi, I.; Scacchi, A.; Gallo, G.; Amato, B.; et al. Minimally Invasive Approach to Gastric GISTs: Analysis of a Multicenter Robotic and Laparoscopic Experience with Literature Review. Cancers 2021, 13, 4351. [Google Scholar] [CrossRef]
- Akahoshi, K.; Oya, M.; Koga, T.; Shiratsuchi, Y. Current clinical management of gastrointestinal stromal tumor. World J. Gastroenterol. 2018, 24, 2806–2817. [Google Scholar] [CrossRef]
- Nishida, T.; Yoshinaga, S.; Takahashi, T.; Naito, Y. Recent Progress and Challenges in the Diagnosis and Treatment of Gastrointestinal Stromal Tumors. Cancers 2021, 13, 3158. [Google Scholar] [CrossRef]
- Casali, P.G.; Abecassis, N.; Aro, H.T.; Bauer, S.; Biagini, R.; Bielack, S.; Bonvalot, S.; Boukovinas, I.; Bovee, J.V.M.G.; Brodowica, T.; et al. Gastrointestinal stromal tumors: ESMO-EURACAN Clinical Practice Guidelines diagnosis, treatment, and follow-up. Ann. Oncol. Off. J. Eur. Soc. Med. Oncol. 2018, 29, 68–78. [Google Scholar] [CrossRef]
- Oppelt, P.J.; Hirbe, A.C.; Van Tine, B.A. Gastrointestinal stromal tumors (GISTs): Point mutations matter in management, a review. J. Gastrointest. Oncol. 2017, 8, 466–473. [Google Scholar] [CrossRef] [Green Version]
- Künstlinger, H.; Huss, S.; Merkelbach-Bruse, S.; Binot, E.; Kleine, M.A.; Loeser, H.; Mittler, J.; Hartmann, W.; Hohenberger, P.; Reichardt, P.; et al. Gastrointestinal stromal tumors with KIT exon 9 mutations: Update on genotype-phenotype correlation and validation of a high-resolution melting assay for mutational testing. Am. J. Surg. Pathol. 2013, 37, 1648–1659. [Google Scholar] [CrossRef]
- Lasota, J.; Corless, C.L.; Heinrich, M.C.; Debiec-Rychter, M.; Sciot, R.; Wardelmann, E.; Merkelbach-Bruse, S.; Schildhaus, H.U.; Steigen, S.E.; Stachura, J.; et al. Clinicopathologic profile of gastrointestinal stromal tumors (GISTs) with primary KIT exon 13 or exon 17 mutations: A multicenter study on 54 cases. Mod. Pathol. 2008, 21, 476–484. [Google Scholar] [CrossRef] [PubMed] [Green Version]
- Parab, T.M.; DeRogatis, M.J.; Boaz, A.M.; Grasso, S.A.; Issack, P.S.; Duarte, D.A.; Urayeneza, O.; Vahdat, S.; Qiao, J.-H.; Hinika, G.S. Gastrointestinal stromal tumors: A comprehensive review. J. Gastrointest. Oncol. 2019, 10, 144–154. [Google Scholar] [CrossRef] [PubMed]
- Blay, J.-Y.; Serrano, C.; Heinrich, M.C.; Zalcberg, J.; Bauer, S.; Gelderblom, H.; Schöffskiet, P.; Jones, R.L.; Attia, S.; D’Amato, G.; et al. Ripretinib in patients with advanced gastrointestinal stromal tumours (INVICTUS): A double-blind, randomized, placebo-controlled, phase 3 trial. Lancet Oncol. 2020, 21, 923–934. [Google Scholar] [CrossRef]


| Demographics | Frequency, Total = 10,833, (n, %) | p-Value | |
|---|---|---|---|
| Age in years | 0–14 | 19 (0.2) | <0.001 |
| 15–29 | 153 (1.4) | ||
| 30–44 | 857 (7.9) | ||
| 45–59 | 2979 (27.5) | ||
| 60–74 | 4280 (39.5) | ||
| >75 | 2545 (23.5) | ||
| Gender | Male | 5633 (52) | <0.035 |
| Female | 5200 (48) | ||
| Race | Unknown | 84 (0.8) | <0.001 |
| Known | 10,749 (99.2) | ||
| White | 7340 (68.3) | ||
| African American | 1992 (18.5) | ||
| Other (American Indian/Alaskan native, and Asian/Pacific Islander) | 1417 (13.2) | ||
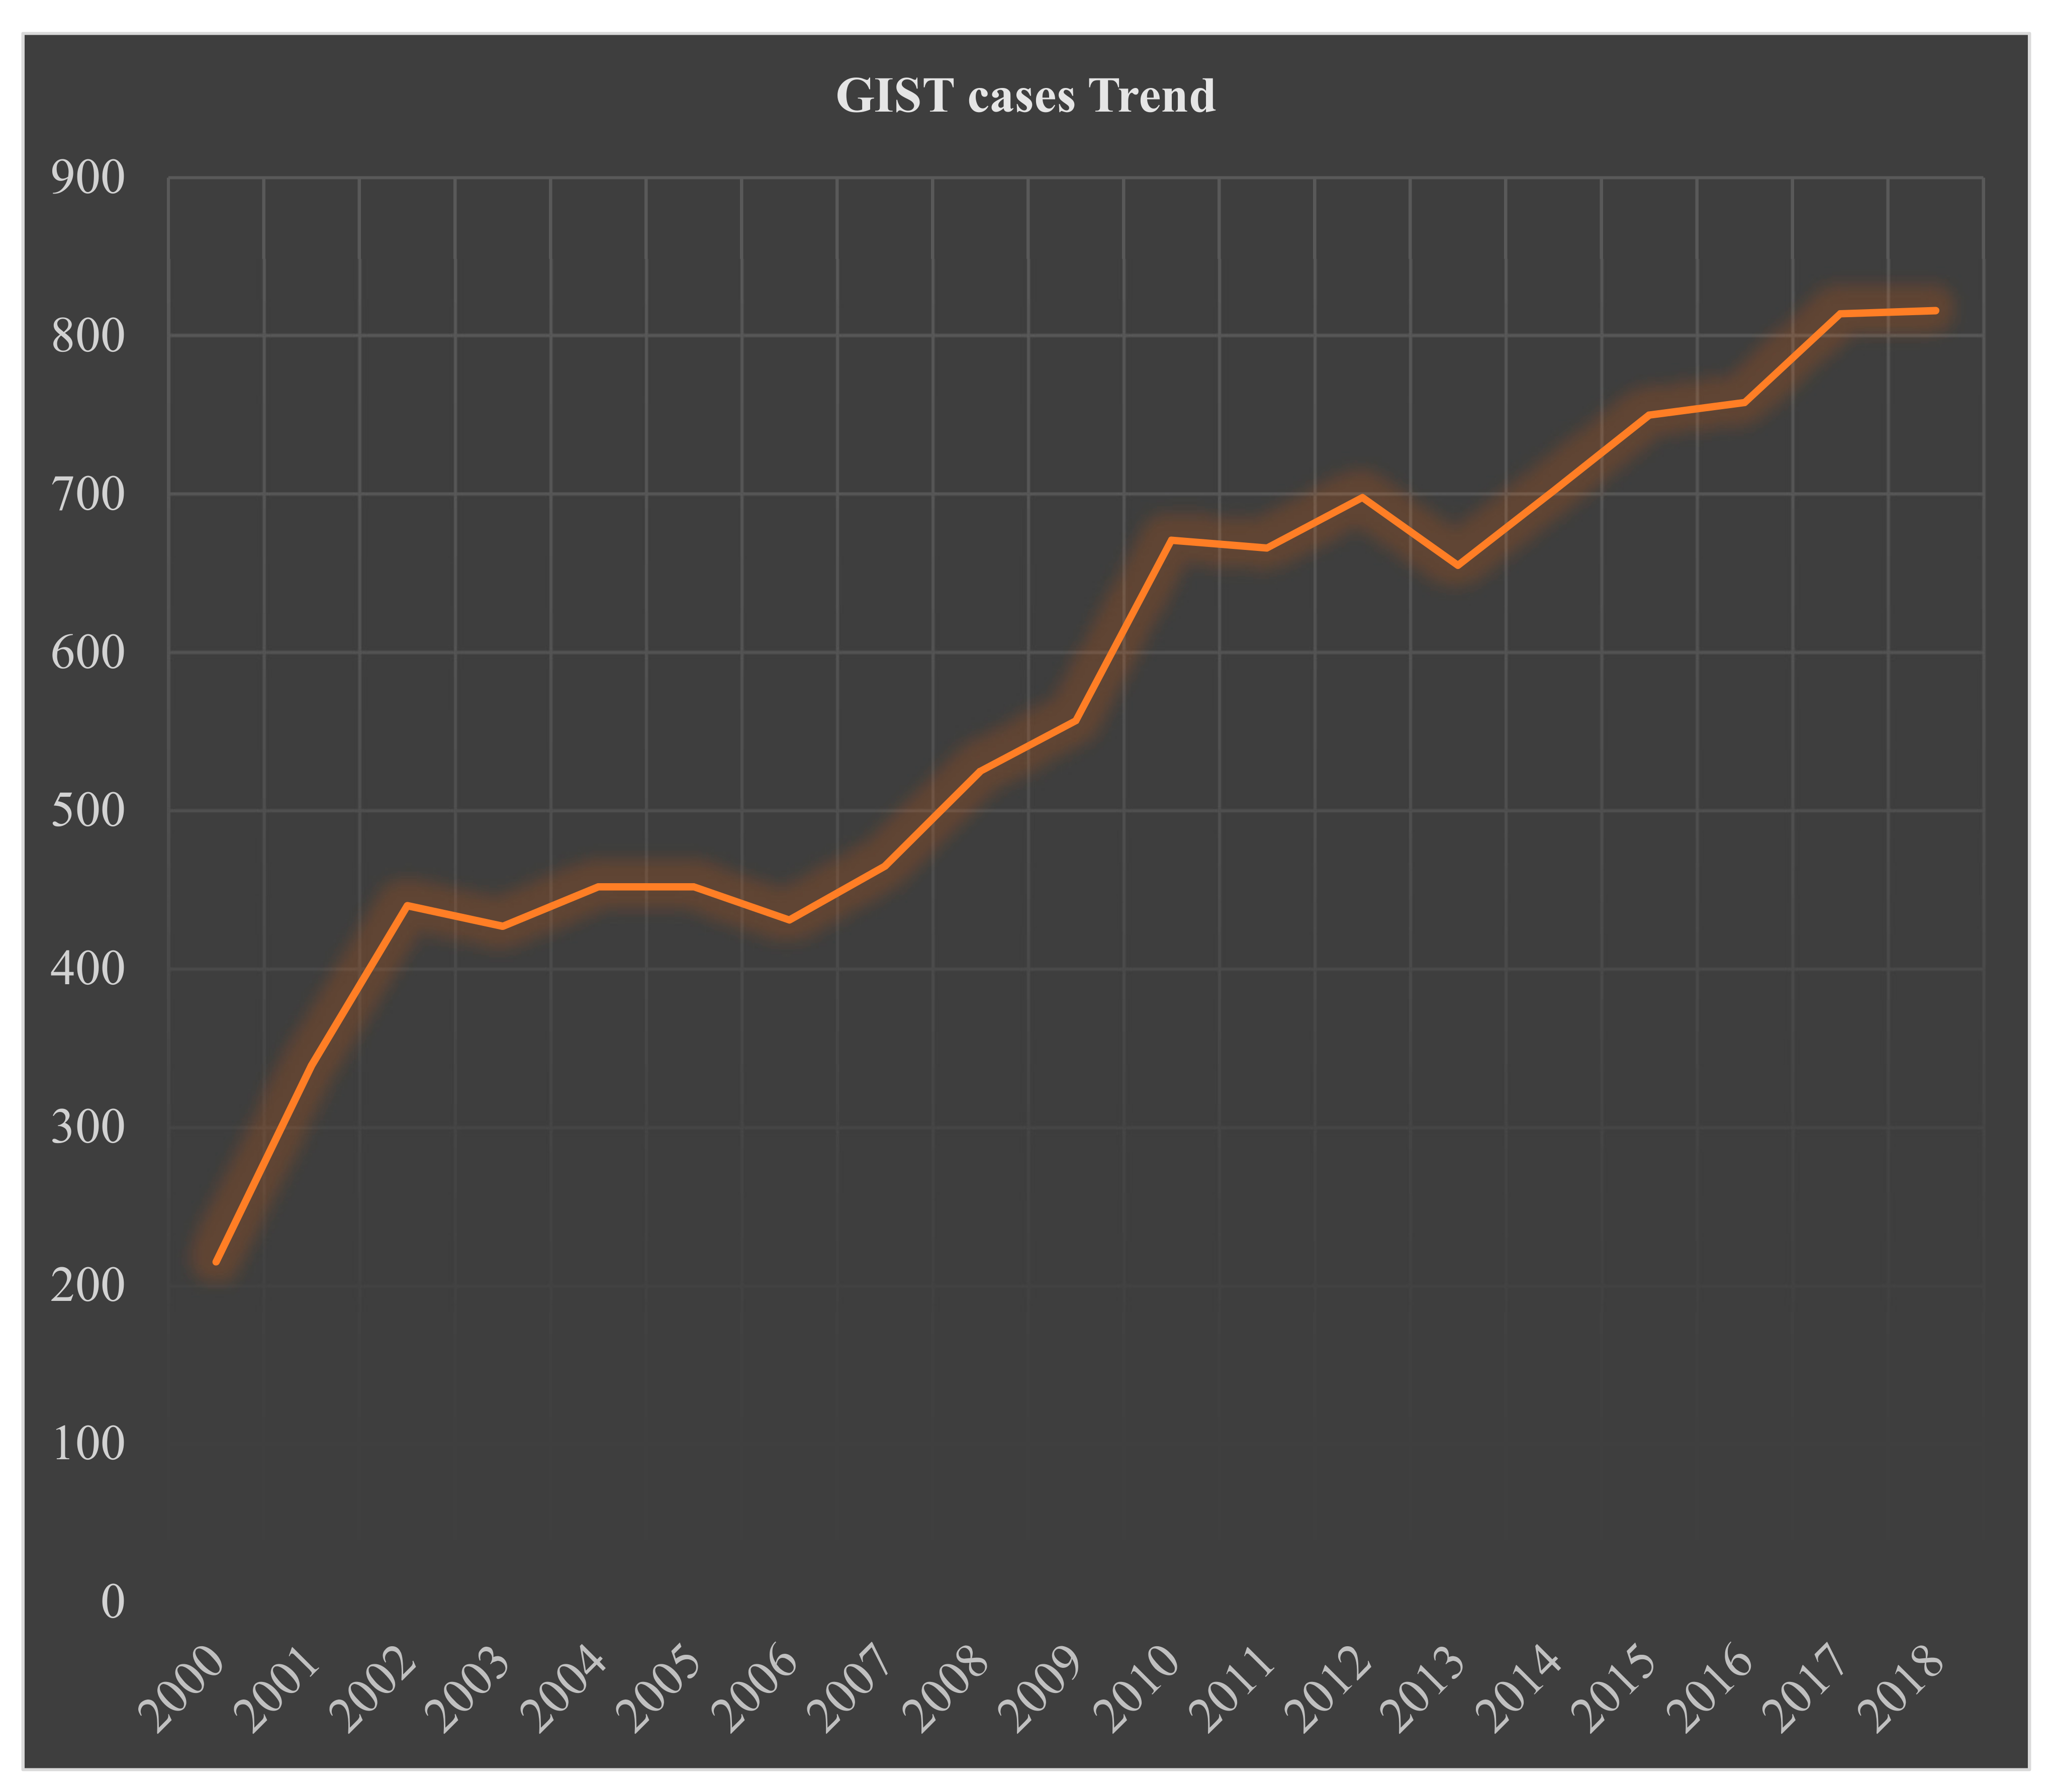
| Year 2000–2018 | Trend | Count | |
| % change | 279.5 | 10,833 | |
| Annual % change (APC) | 5.3 * | p < 0.05 | |
| Variable | Frequency Total = 10,833 (n, %) | |
|---|---|---|
| Primary Site | Stomach | 6868 (63.4) |
| Small Intestine | 3283 (30.3) | |
| Rectum | 307 (2.8) | |
| Esophagus | 71 (0.7) | |
| Large intestine (any site) | 251 (2.3) | |
| Sigmoid colon | 61 (0.6) | |
| Cecum | 46 (0.4) | |
| Descending Colon | 36 (0.3) | |
| Ascending Colon | 36 (0.3) | |
| Large Intestine, NOS | 32 (0.3) | |
| Transverse Colon | 29 (0.3) | |
| Rectosigmoid Junction | 19 (0.2) | |
| Hepatic Flexure | 17 (0.2) | |
| Splenic Flexure | 4 (0.03) | |
| Appendix | 13 (0.1) | |
| Anus, anal canal, and anoderm | 11 (0.1) | |
| Stage * | Unknown | 1523 (14) |
| Known | 9310 (86) | |
| Localized | 6129 (65.8) | |
| Distant | 1774 (19.1) | |
| Regional | 1407 (15.1) | |
| Tumor Size | Unknown | 2833 (26.2) |
| Known tumor size | 8000 (73.8) | |
| <2cm | 592 (7.4) | |
| 2–5 cm | 2306 (28.8) | |
| 6–10 cm | 2865 (35.8) | |
| >10 cm | 2237 (28) | |
| Tumor Grade | Unknown | 6142 (56.7) |
| Known | 4691 (43.3) | |
| Well-differentiated | 1768 (37.7) | |
| Moderately differentiated | 1502 (32) | |
| Undifferentiated | 867 (18.5) | |
| Poorly differentiated | 554 (11.8) | |
| Known Location | Treatment When Known (n, %) | |||
|---|---|---|---|---|
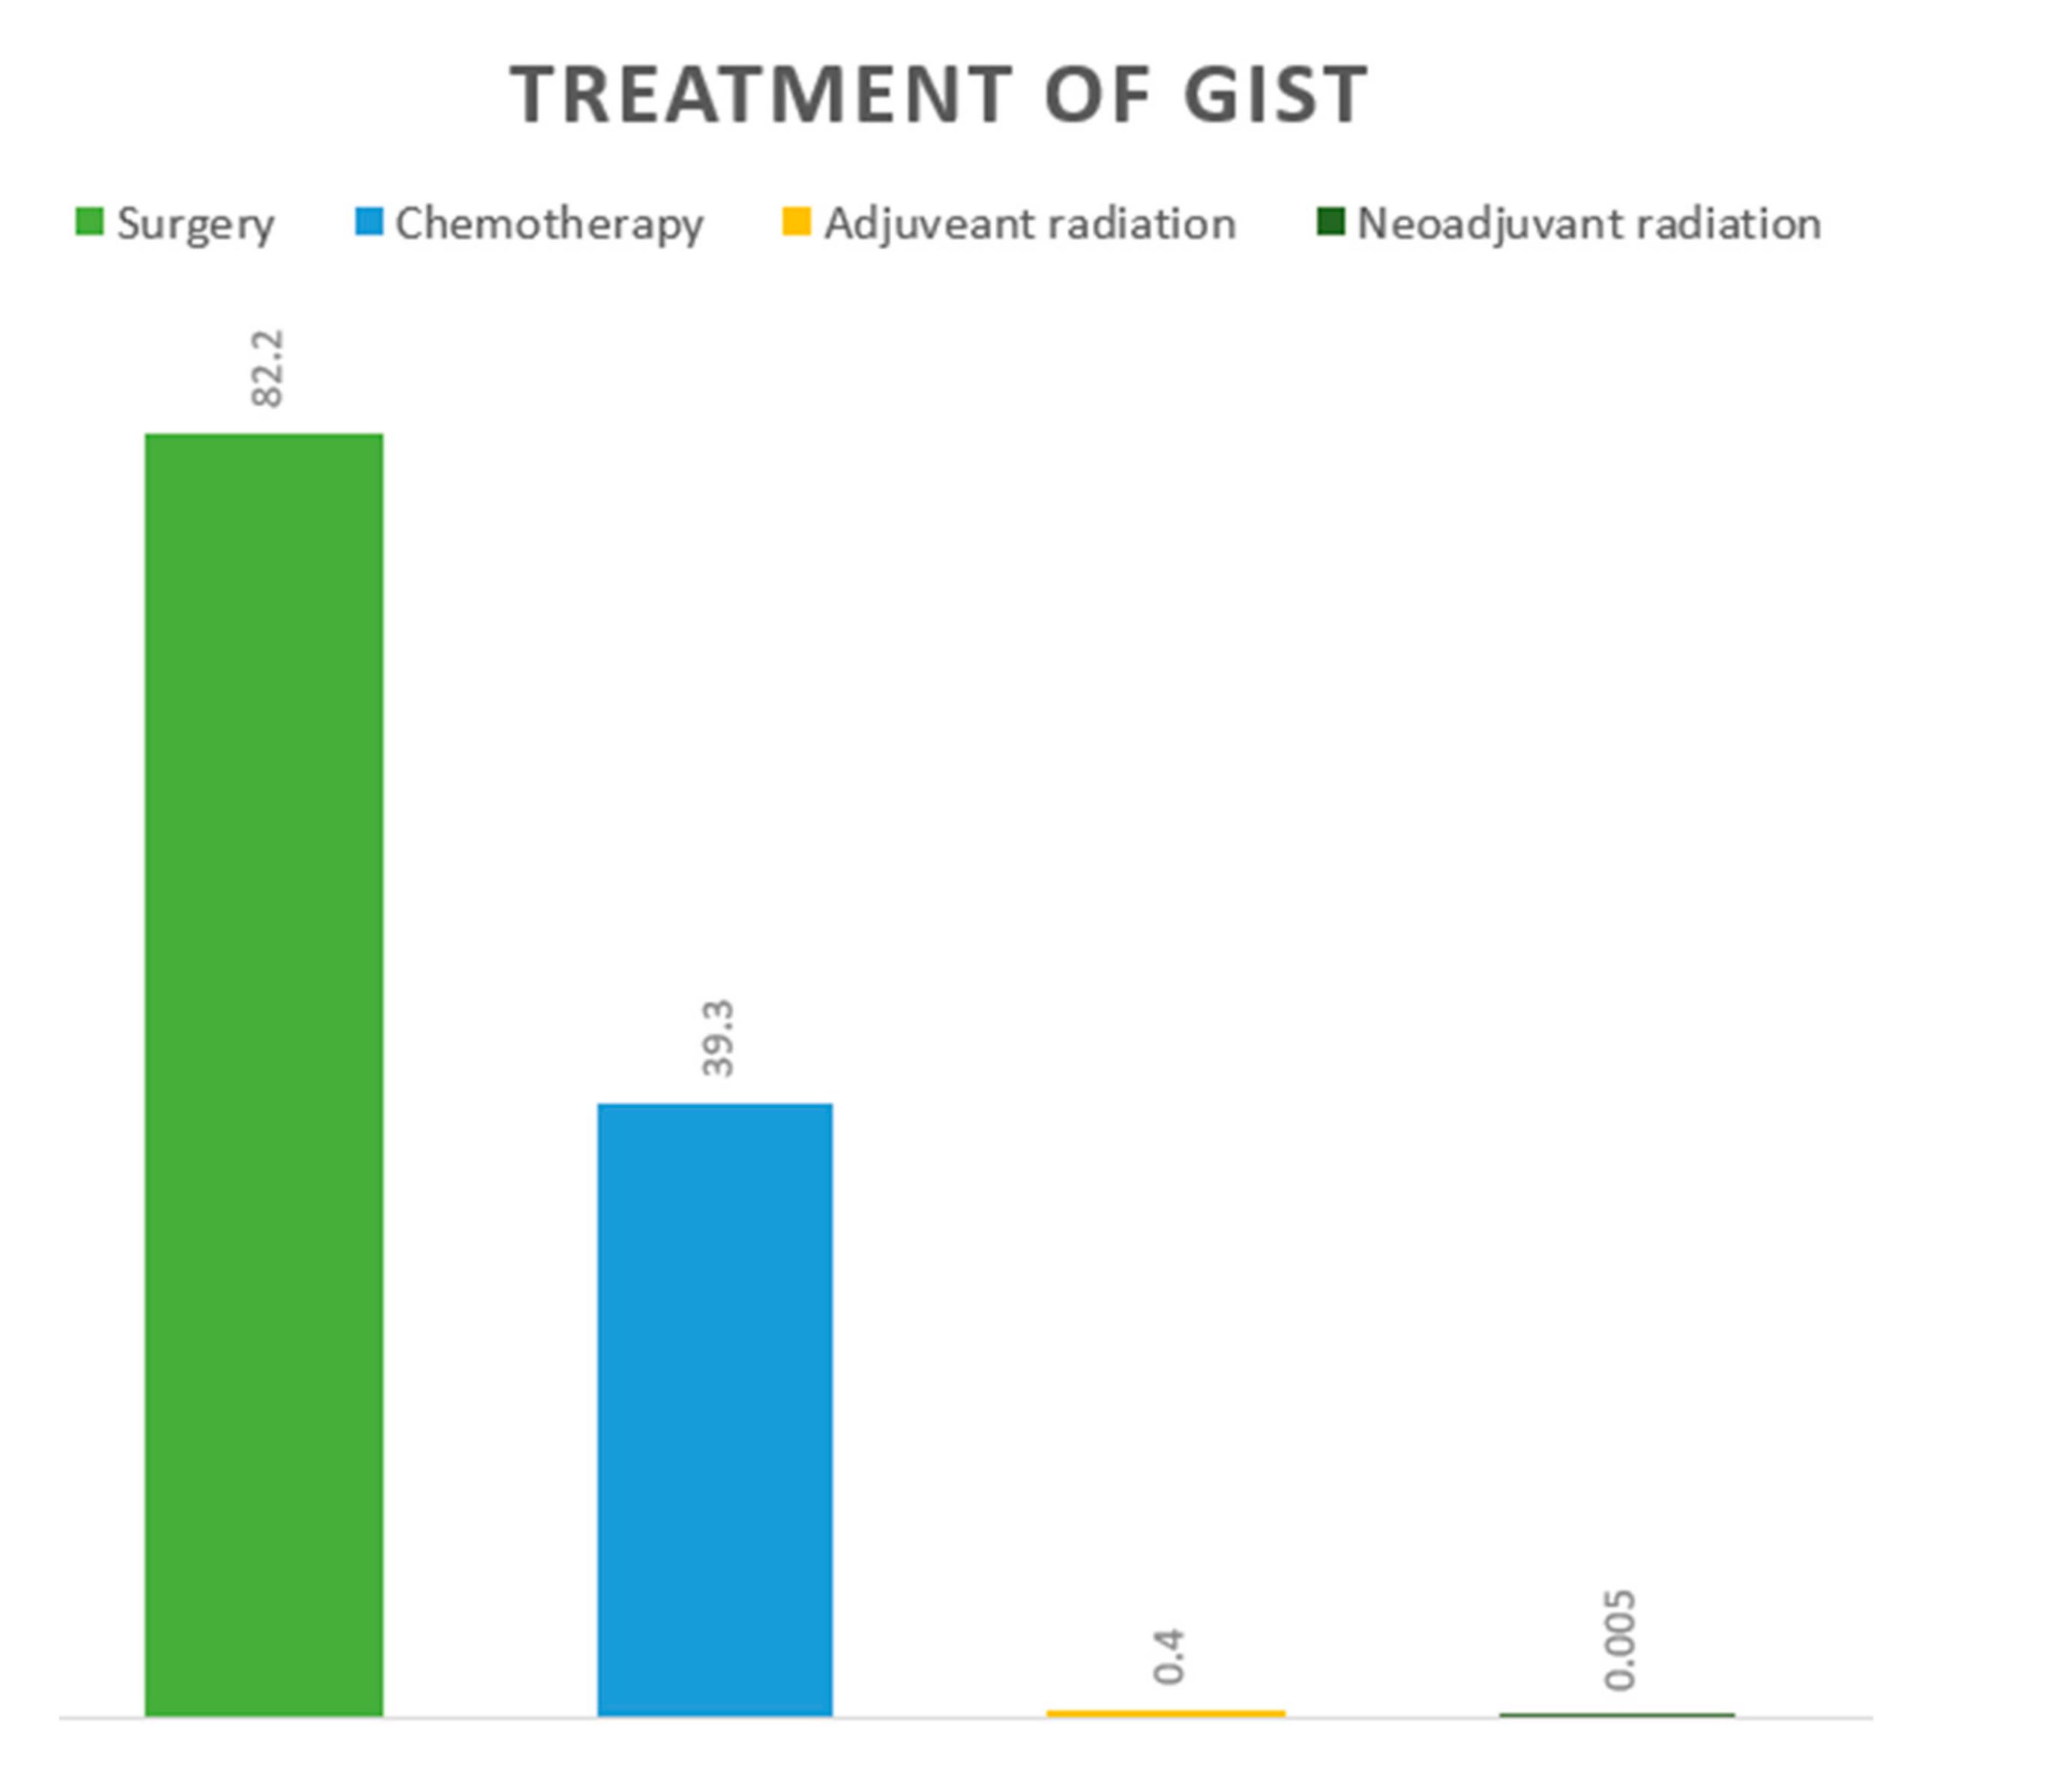
| Surgery | Chemotherapy ± Surgery | Adjuvant Radiation | Neoadjuvant Radiation | |
| Esophagus # | 40 (56.3) | 31 (42.3) | 1 (1.4) | 0 |
| Stomach | 5446 (68.3) | 2502 (31.4) | 16 (0.2) | 5 (0.1) |
| Small Intestine | 2946 (66.8) | 1455 (33) | 9 (0.2) | 0 |
| Cecum # | 38 (73.1) | 13 (25) | 1 (1.9) | 0 |
| Appendix # | 12 (92.3) | 1 (7.7) | 0 | 0 |
| Ascending Colon # | 31 (77.5) | 9 (22.5) | 0 | 0 |
| Hepatic Flexure # | 14 (77.8) | 4 (22.2) | 0 | 0 |
| Transverse Colon # | 24 (70.6) | 10 (29.4) | 0 | 0 |
| Splenic Flexure # | 3 (75) | 1 (25) | 0 | 0 |
| Descending Colon # | 34 (70.8) | 13 (27.1) | 1 (2.1) | 0 |
| Sigmoid Colon # | 54 (75) | 17 (26.6) | 1 (1.4) | 0 |
| Large Intestine, NOS # | 19 (65.5) | 10 (35.5) | 0 | 0 |
| Rectosigmoid junction | 14 (53.8) | 11 (42.3) | 1 (3.8) | 0 |
| Rectum # | 216 (52.9) | 174 (42.6) | 17 (4.2) | 1 (0.2) |
| Anus, Anal Canal, AD # | 10 (66.7) | 5 (33.3) | 0 | 0 |
| Tumor Size (n, %) | ||||
| Treatment | <2 cm | 2–5 cm | 6–10 cm | >10 cm |
| Surgery | 533 (90) | 1796 (77.9) | 1818 (63.4) | 1283 (57.3) |
| Chemotherapy ± surgery | 58 (9.8) | 506 (21.9) | 1042 (36.4) | 947 (42.3) |
| Adjuvant radiation | 1 (0.2) | 4 (0.2) | 4 (0.1) | 6 (0.3) |
| Neoadjuvant radiation | 0 | 0 | 1 (0.03) | 1 (0.04) |
| Tumor Grade (n, %) | ||||
| Treatment | Well differentiated | Moderately differentiated | Undifferentiated/ anaplastic | Poorly Differentiated |
| Surgery | 1417 (80.1) | 1062 (70.7) | 523 (60.3) | 338 (61) |
| Chemotherapy ± surgery | 349 (19.7) | 426 (28.4) | 330 (38.1) | 208 (37.5) |
| Adjuvant radiation | 1 (0.05) | 7 (0.5) | 7 (0.7) | 4 (0.7) |
| Neoadjuvant radiation | 1 (0.05) | 7 (0.5) | 7 (0.7) | 4 (0.7) |
| Tumor Stage (n, %) | ||||
| Treatment | Localized | Distant | Regional | |
| Surgery | 4895 (73.6) | 1005 (44.9) | 1245 (63.8) | |
| Chemotherapy ± surgery | 1735 (26.1) | 1222 (54.6) | 690 (35.4) | |
| Adjuvant radiation | 19 (0.3) | 10 (0.4) | 12 (0.6) | |
| Neoadjuvant radiation | 1 (0.01) | 1 (0.04) | 4 (0.2) | |
| Overall Cumulative Survival (%, 95% Confidence Interval) | |
| 1-year | 92.7 (92.2–93.3) |
| 2-year | 88.1 (87.4–88.8) |
| 3-year | 82.9 (82–83.7) |
| 4-year | 78.3 (77.3–79.2) |
| 5-year | 73.7 (72.6–74.7) |
| Disease-specific survival | |
| 1-year | 94.9 (94.4–95.3) |
| 2-year | 91.7 (91–92.2) |
| 3-year | 87.9 (87.2–88.7) |
| 4-year | 85 (84.1–85.8) |
| 5-year | 81.6 (80.7–82.6) |
| 5-year disease-specific survival by treatment | |
| Surgery | 86.4 (85.4–87.3) |
| Chemotherapy | 77.4 (75.7–78.9) |
| Adjuvant Radiation | 66.5 (47.5–80) |
| Location | Observed Survival, % (95 Confidence Interval) | ||||
|---|---|---|---|---|---|
| 1-Year | 2-Year | 3-Year | 4-Year | 5-Year | |
| Esophagus # | 79.4 (65.1–88.3) | 79.4 (65.1–88.3) | 74.6 (59.6–84.8) | 74.6 (59.6–84.8) | 63 (46.4–75.8) |
| Stomach | 92.5 (91.7–93.1) | 87.7 (86.8–88.6) | 82.3 (81.2–83.4) | 77.7 (76.4–78.8) | 73.2 (71.9–74.5) |
| Small Intestine | 94.2 (93.2–95) | 89.8 (88.6–90.9) | 84.6 (83.1–86) | 79.8 (78.1–81.4) | 75.2 (73.3–76.9) |
| Cecum # | 83.8 (65.2–92.9) | 76.8 (57.3–88.2) | 72.8 (52.6–85.4) | 72.8 (52.6–85.4) | 72.8 (52.6–85.4) |
| Appendix # | + | + | 80 (20.4–96.9) | 60 (12.6–88.2)) | 40 (5.2–75.3)) |
| Ascending Colon # | 69 (48.8–82.5) | 56.4 (35.9–72.7) | 51.7 (31.2–68.9) | 51.7 (31.2–68.9) | 41.4 (21.6–60.2) |
| Hepatic Flexure # | 84.4 (50.4–95.9) | 67.5 (34.6–86.5) | 67.5 (34.6–86.5) | 67.5 (34.6–86.5) | 54 (20.3–78.9) |
| Transverse Colon # | 89.5 (641–97.3) | 89.5 (641–97.3) | 76.7 (48.8–90.6) | 76.7 (48.8–90.6) | 76.7 (48.8–90.6) |
| Splenic Flexure # | + | 66.7 (5.4–94.5) | 66.7 (5.4–94.5) | 66.7 (5.4–94.5) | 66.7 (5.4–94.5) |
| Descending Colon # | 86.3 (67.5–94.6) | 78.6 (58.2–89.8) | 74.2 (53.1–86.9) | 69.6 (47.8–83.7) | 64.6 (42.3–80.1) |
| Sigmoid Colon # | 91 (77.8–96.5) | 79 (63.5–88.5) | 73.8 (57.6–84.6) | 70.9 (54.2–82.4) | 67.9 (51–80.1) |
| Large Intestine, NOS # | 78.9 (58.9–89.9) | 78.9 (58.9–89.9) | 71 (50.2–84.4) | 62.7 (41.4–78) | 50.1 (29.7–67.5) |
| Rectosigmoid Junction # | 78.6 (47.2–92.5) | 78.6 (47.2–92.5) | 78.6 (47.2–92.5) | 78.6 (47.2–92.5) | 69.8 (37.8–87.6) |
| Rectum # | 93.3 (89.4–95.8) | 89.8 (85.3–93) | 87.5 (82.6–91.1) | 84.5 (79.2–88.6) | 78.7 (72.6–83.6) |
| Anus, Anal Canal, AD # | + | 88.9 (43.3–98.4) & | 88.9 (43.3–98.4) & | 88.9 (43.3–98.4) & | 88.9 (43.3–98.4) & |
| Location | 5-Year Disease-Specific Survival, (%, 95 Confidence Interval) | ||
|---|---|---|---|
| Surgery | Chemotherapy ± Surgery | Adjuvant Radiation | |
| Esophagus # | 79.6 (57.4–91.1) | 62.1 (33–81.5) | + |
| Stomach | 88.4 (87.2–89.5) | 74.4 (72.1–76.5) | 70.7 (33.7–89.5) |
| Small Intestine | 83.7 (81.9–85.3) | 81.7 (79–84) | 57.1 (17.2–83.7) |
| Cecum # | 79.5 (57.4–90.9) | 64.8 (25.3–87.2) | + |
| Appendix # | + | + | + |
| Ascending Colon # | 43.9 (21.7–64.2) | 33.3 (5.3–66.4) | + |
| Hepatic Flexure # | 48.5 (14.4–76.3) | + | + |
| Transverse Colon # | 92.3 (56.6–98.9) & | 83.3 (27.3–97.5) | + |
| Splenic Flexure # | + | + | + |
| Descending Colon # | 73.6 (49.5–87.5) | 51.1 (13.8–79.7) | + |
| Sigmoid Colon # | 77.1 (59.1–87.9) | 80 (40.9–94.6) | + |
| Large Intestine, NOS # | 67.6 (38.6–85.1) | 60 (79–85.5) | + |
| Rectosigmoid Junction # | 78.8 (38.1–94.3) & | 85.7 (33.4–97.9) | + |
| Rectum # | 90.3 (84.3–94) | 88.5 (80.5–93.4) | 66.6 (33.1–86.1) |
| Anus, Anal Canal, AD # | 88.9 (43.3–98.4) & | + | + |
| 5-Year Disease-Specific Survival, % (Confidence Interval) | ||||
|---|---|---|---|---|
| Year | Overall Disease-Specific Survival | Surgery | Chemotherapy ± Surgery | Adjuvant Radiation |
| 2000 | 75.4 (68.1–81.2) | 78 (70.5–83.7) | 50.9 (28.9–69.2) | 71.4 (25.8–92) |
| 2001 | 70.8 (64.9–75.8) | 75.7 (69.7–80.7) | 63.3 (50.1–73.9) | 77.8 (36.5–93.9) |
| 2002 | 74.3 (69.3–78.6) | 79.3 (74.3–83.5) | 69.3 (58.7–77.7) | 66.7 (5.4–94.5) |
| 2003 | 76.3 (71.3–80.6) | 80.9 (75.8–85) | 67.4 (57.4–75.5) | 50 (11.1–80.4) |
| 2004 | 78.8 (74.1–82.7) | 82.9 (78.1–86.7) | 74.8 (64.7–82.3) | 50 (0.6–91) |
| 2005 | 80.4 (75.8–84.2) | 84.7 (80–88.3) | 71.8 (62.1–79.3) | NA |
| 2006 | 78.1 (73.2–82.2) | 83.5 (78.5–87.4) | 70.4 (60.6–78.1) | NA |
| 2007 | 78.3 (73.7–82.2) | 86.2 (81.8–89.7) | 74.2 (67–80.2) | NA |
| 2008 | 80.7 (76.5–84.3) | 85.5 (81.3–88.8) | 79.9 (73.7–84.8) | NA |
| 2009 | 82.9 (79–86.1) | 87.4 (83.5–90.4) | 77.2 (70.6–82.4) | NA |
| 2010 | 86 (82.6–90.8) | 90.4 (87.2–92.8) | 83 (77.7–87.1) | NA |
| 2011 | 83 (79.4–86) | 88.5 (85–91.3) | 78 (72–82.8) | NA |
| 2012 | 87.4 (84.2–90) | 92.8 (89.9–94.9) | 82.5 (76.9–86.9) | NA |
| 2013 | 85.3 (81.8–88.1) | 88.9 (85.5–91.5) | 80.5 (74.7–85.1) | NA |
| 2014–18 | NA | NA | NA | NA |
| Variables | Univariate | Multivariate Analysis | ||
|---|---|---|---|---|
| p-Value | Hazard Ratio (95% Confidence Interval) | p-Value | ||
| Age > 60 Years | <0.001 | 3.45 (1.81–6.61) | <0.001 | |
| Gender | Male | 0.767 | ||
| Female | ||||
| Location | Esophagus | 0.004 | 1.82 (1.25–2.72) | 0.004 |
| Stomach | 0.129 | |||
| Small Intestine | 0.847 | |||
| Cecum | 0.052 | |||
| Appendix | 0.316 | |||
| Ascending Colon | 0.003 | 2.53 (2.35–3.21) | 0.003 | |
| Hepatic Flexure | 0.651 | |||
| Transverse Colon | 0.542 | |||
| Splenic Flexure | 0.212 | |||
| Descending Colon | 0.231 | |||
| Sigmoid Colon | 0.004 | 1.74 (1.28–2.34) | 0.004 | |
| Large intestine, NOS | 0.855 | |||
| Rectosigmoid Junction | 0.658 | |||
| Rectum | 0.645 | |||
| Anus, Anal Region, Anoderm | 0.669 | |||
| Size | <2 cm in size | 0.997 | ||
| 2–5 cm in size | 0.757 | |||
| >5 cm in size | 0.01 | 7.30 (1.11–47.87) | 0.003 | |
| Stage | Localized | 0.733 | ||
| Regional | 0.512 | |||
| Distant | 0.003 | 3.17 (1.26–7.24) | 0.001 | |
| Grade | Well-Differentiated | 0.679 | ||
| Moderately Differentiated | 0.13 | |||
| Poorly Differentiated | 0.003 | 5.35 (2.92–12.1) | <0.001 | |
| Undifferentiated | 0.003 | 5.35 (2.92–12.1) | <0.001 | |
| Trial Number (Name) | Study Title | Study Type | Study Arms | Primary Outcome | Status (on 12 Feb 2022) |
|---|---|---|---|---|---|
| NCT04409223 | Efficacy and safety of famitinib vs. sunitinib for advanced GIST after failure of imatinib | Phase 3, randomized | Famitinib vs. sunitinib | PFS | Recruiting |
| NCT00756509 | Treatment of patients with metastatic or unresectable GIST in first line with nilotinib | Phase 4, single-arm | Nilotinib | Rates of stable SD, PR, and CR | Active, not recruiting |
| NCT05208047 (Peak) | A phase 3 randomized trial of CGT9486 + sunitinib vs. sunitinib in subjects with GIST | Phase 1a and phase 3, randomized | CGT9486 + sunitinib vs. sunitinib | Pharmacokinetics (Cmax, AUC, Tmax, T1/2, CLss/F) and PFS | Recruiting |
| NCT03673501 (Intrigue) | A study of DCC-2618 vs sunitinib in advanced GIST after treatment with imatinib | Phase 3, randomized | DCC-1618 (ripretinib) vs. sunitinib | PFS | Active, not recruiting |
| NCT03353753 (INVICTUS) * | Phase 3 study of DCC-2618 vs. placebo in advanced GIST treated with prior anticancer therapies | Phase 3, randomized | DCC-1618 (ripretinib) vs. placebo | PFS | Active, not recruiting |
| NCT04825574 | Study for patients previously treated in avapritinib clinical trials | Phase 4 | Avapritinib | Safety | Active, not recruiting |
| NCT02260505 (ImadGist) | Efficacy of imatinib maintenance or interruption after 3 years of adjuvant treatment in patients with GIST | Phase 3, randomized | Maintenance imatinib | DFS | Recruiting |
| NCT02847429 | Randomized trial of crenolanib in subjects with D842V mutated GIST | Phase 3, randomized | Crenolanib vs. placebo | PFS | Active, not recruiting |
| NCT02413736 | 3 vs. 5 years of adjuvant Imatinib in patients with operable GIST with a high risk for recurrence: A randomized phase III study | Phase 3, randomized | Experimental: Imatinib at 400 mg/day for 24 months | RFS | Recruiting |
| Gene | Alteration | Clinical Features | Recommended Targeted Therapy (Potential Superior Therapy) |
|---|---|---|---|
| KIT | Exon 11 W557_558del | Classic GISTs (V559 and V560) W557 more aggressive in the stomach Half W557 non-gastric, avg. 8 cm | Imatinib standard dose |
| Exon 9 A502_Y503dup | Locally aggressive, spindle cell Non-gastric, younger, >5 cm | Potential adjuvant therapy Imatinib high dose Sunitinib | |
| Exons 13, 14, and 17 | Secondary mutations resistant to imatinib/sunitinib | Sunitinib and ponatinib | |
| PDGFR | Exon 18 D842V | PDGFRA alteration, mostly gastric Favorable outcomes Resistance to imatinib and sunitinib | Avapritinib No adjuvant therapy recommended Neoadjuvant avapritinib may be considered |
| Exons 13–15 Codons 596–719 | Resistance to avapritinib | Imatinib standard dose (Trametinib) | |
| Exon 12 Codons 555–589 | Primary non-gastric GISTs, rare | Imatinib standard dose | |
| SDHA-D | Hypermethylation, truncation, frameshift, Splice site alterations | Carney triad syndrome (often SDHC) Multifocal gastric GISTs, pulmonary chondroma paraganglioma Younger with female > male Carney–Stratakis syndrome Germline, gastric GISTs, and paraganglioma Paternal inheritance (SDHD) Potential lymph node metastasis | Avoid TKIs Personalized treatment |
| BRAF | V600E | Resistant to standard GIST guideline TKIs | Off-label indication of BRAF and BRAF–MEK inhibitors |
| NF1 | Truncation Frameshift | Germline Most GIST in small bowel | Avoid adjuvant therapy Personalized treatment |
| NTRK1,2,3 | Fusions | Resistant to standard GIST guideline TKIs | NTRK inhibitors (Larotrectinib and entrectinib) |
Publisher’s Note: MDPI stays neutral with regard to jurisdictional claims in published maps and institutional affiliations. |
© 2022 by the authors. Licensee MDPI, Basel, Switzerland. This article is an open access article distributed under the terms and conditions of the Creative Commons Attribution (CC BY) license (https://creativecommons.org/licenses/by/4.0/).
Share and Cite
Khan, J.; Ullah, A.; Waheed, A.; Karki, N.R.; Adhikari, N.; Vemavarapu, L.; Belakhlef, S.; Bendjemil, S.M.; Mehdizadeh Seraj, S.; Sidhwa, F.; et al. Gastrointestinal Stromal Tumors (GIST): A Population-Based Study Using the SEER Database, including Management and Recent Advances in Targeted Therapy. Cancers 2022, 14, 3689. https://doi.org/10.3390/cancers14153689
Khan J, Ullah A, Waheed A, Karki NR, Adhikari N, Vemavarapu L, Belakhlef S, Bendjemil SM, Mehdizadeh Seraj S, Sidhwa F, et al. Gastrointestinal Stromal Tumors (GIST): A Population-Based Study Using the SEER Database, including Management and Recent Advances in Targeted Therapy. Cancers. 2022; 14(15):3689. https://doi.org/10.3390/cancers14153689
Chicago/Turabian StyleKhan, Jaffar, Asad Ullah, Abdul Waheed, Nabin Raj Karki, Nawaraj Adhikari, Lakshmi Vemavarapu, Sami Belakhlef, Samy Malik Bendjemil, Siamak Mehdizadeh Seraj, Feroze Sidhwa, and et al. 2022. "Gastrointestinal Stromal Tumors (GIST): A Population-Based Study Using the SEER Database, including Management and Recent Advances in Targeted Therapy" Cancers 14, no. 15: 3689. https://doi.org/10.3390/cancers14153689
APA StyleKhan, J., Ullah, A., Waheed, A., Karki, N. R., Adhikari, N., Vemavarapu, L., Belakhlef, S., Bendjemil, S. M., Mehdizadeh Seraj, S., Sidhwa, F., Ghleilib, I., Foroutan, S., Blakely, A. M., Del Rivero, J., Karim, N. A., Vail, E., Heneidi, S., & Mesa, H. (2022). Gastrointestinal Stromal Tumors (GIST): A Population-Based Study Using the SEER Database, including Management and Recent Advances in Targeted Therapy. Cancers, 14(15), 3689. https://doi.org/10.3390/cancers14153689