
The Prognostic Value of Whole-Blood PSMB5, CXCR4, POMP, and RPL5 mRNA Expression in Patients with Multiple Myeloma Treated with Bortezomib

 , ,
, ,  ,
, 
Abstract
Simple Summary
Abstract
1. Introduction
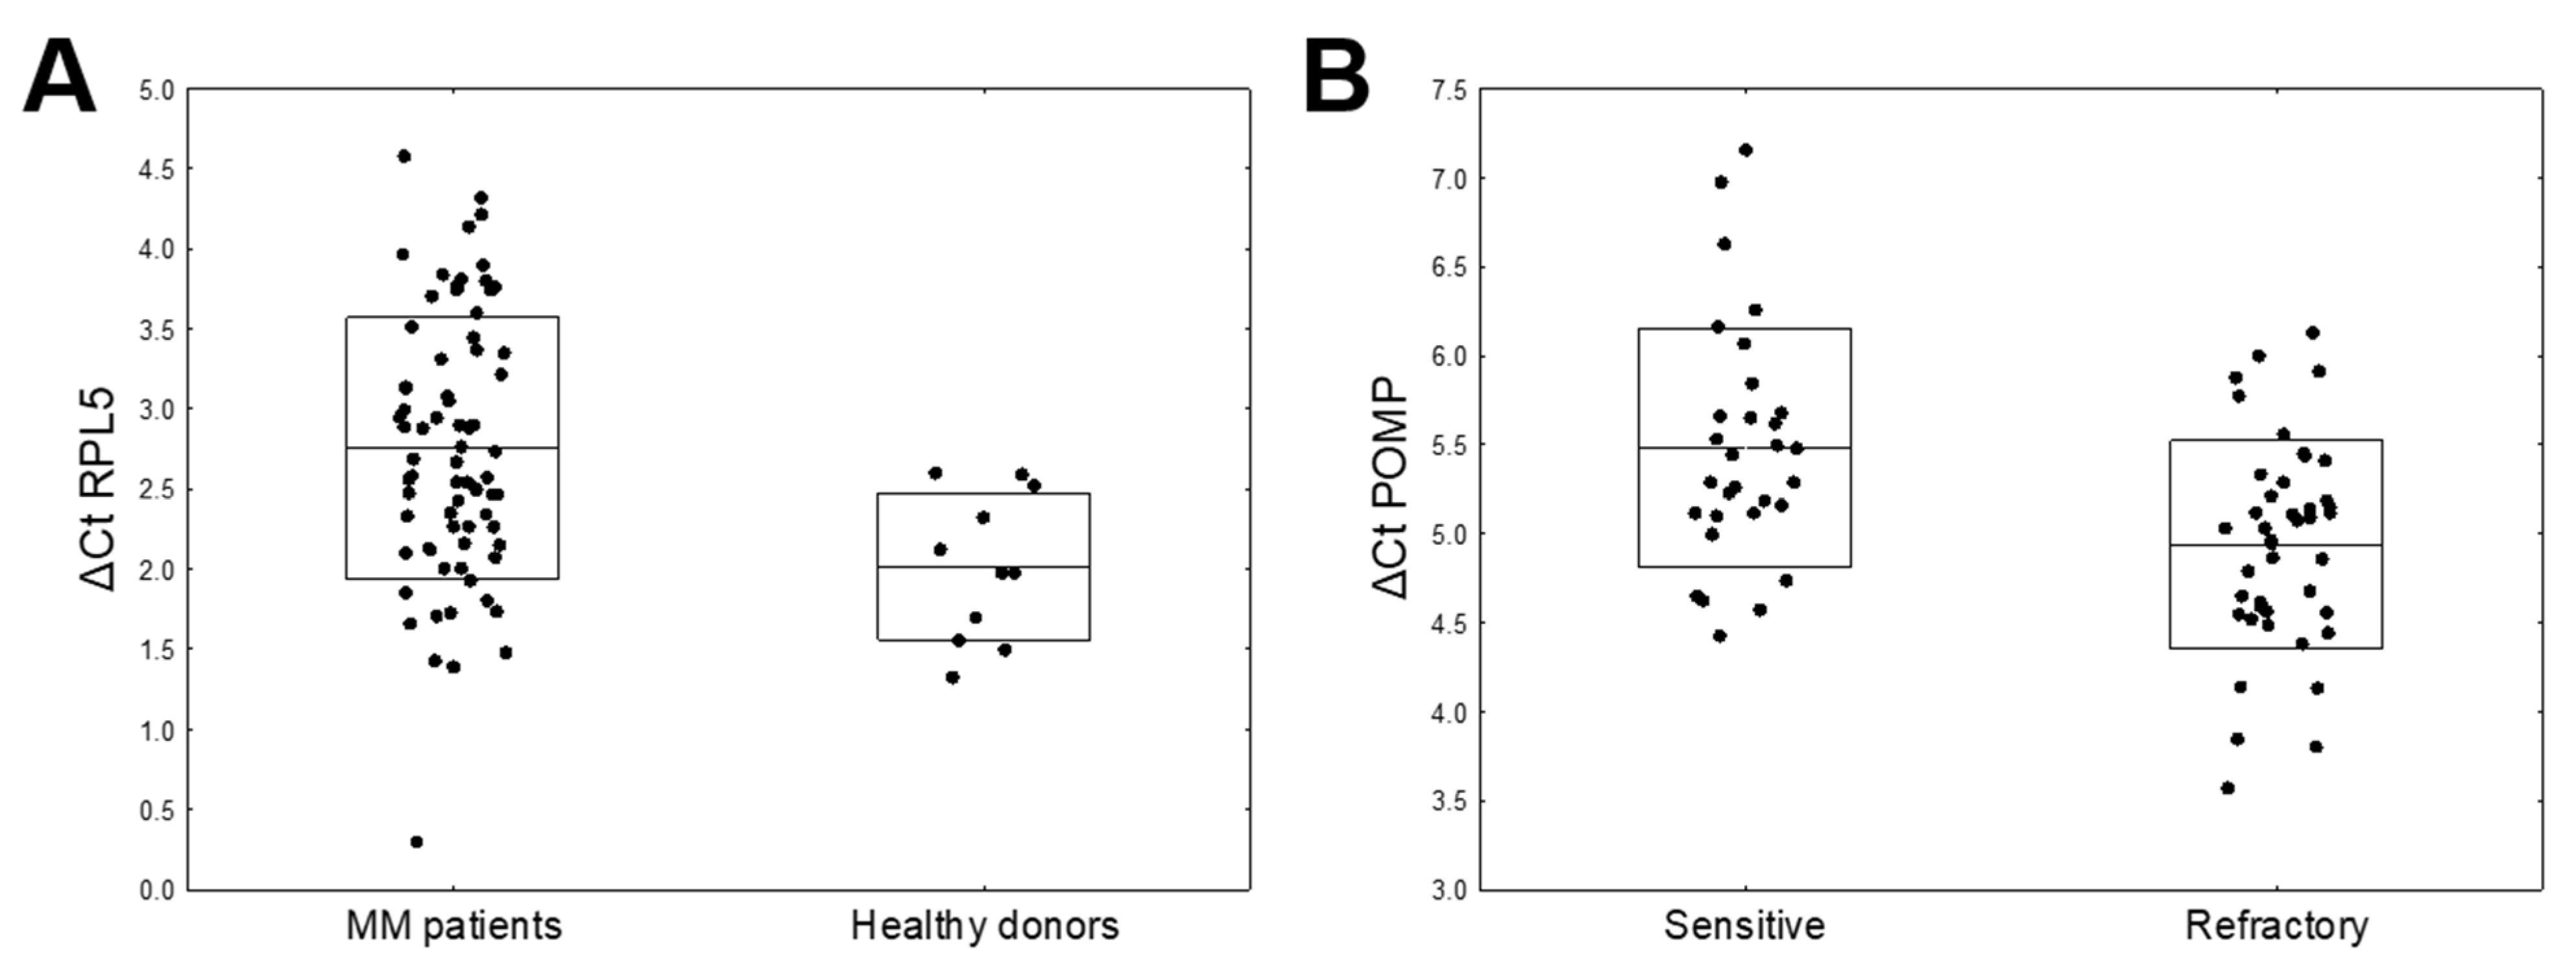
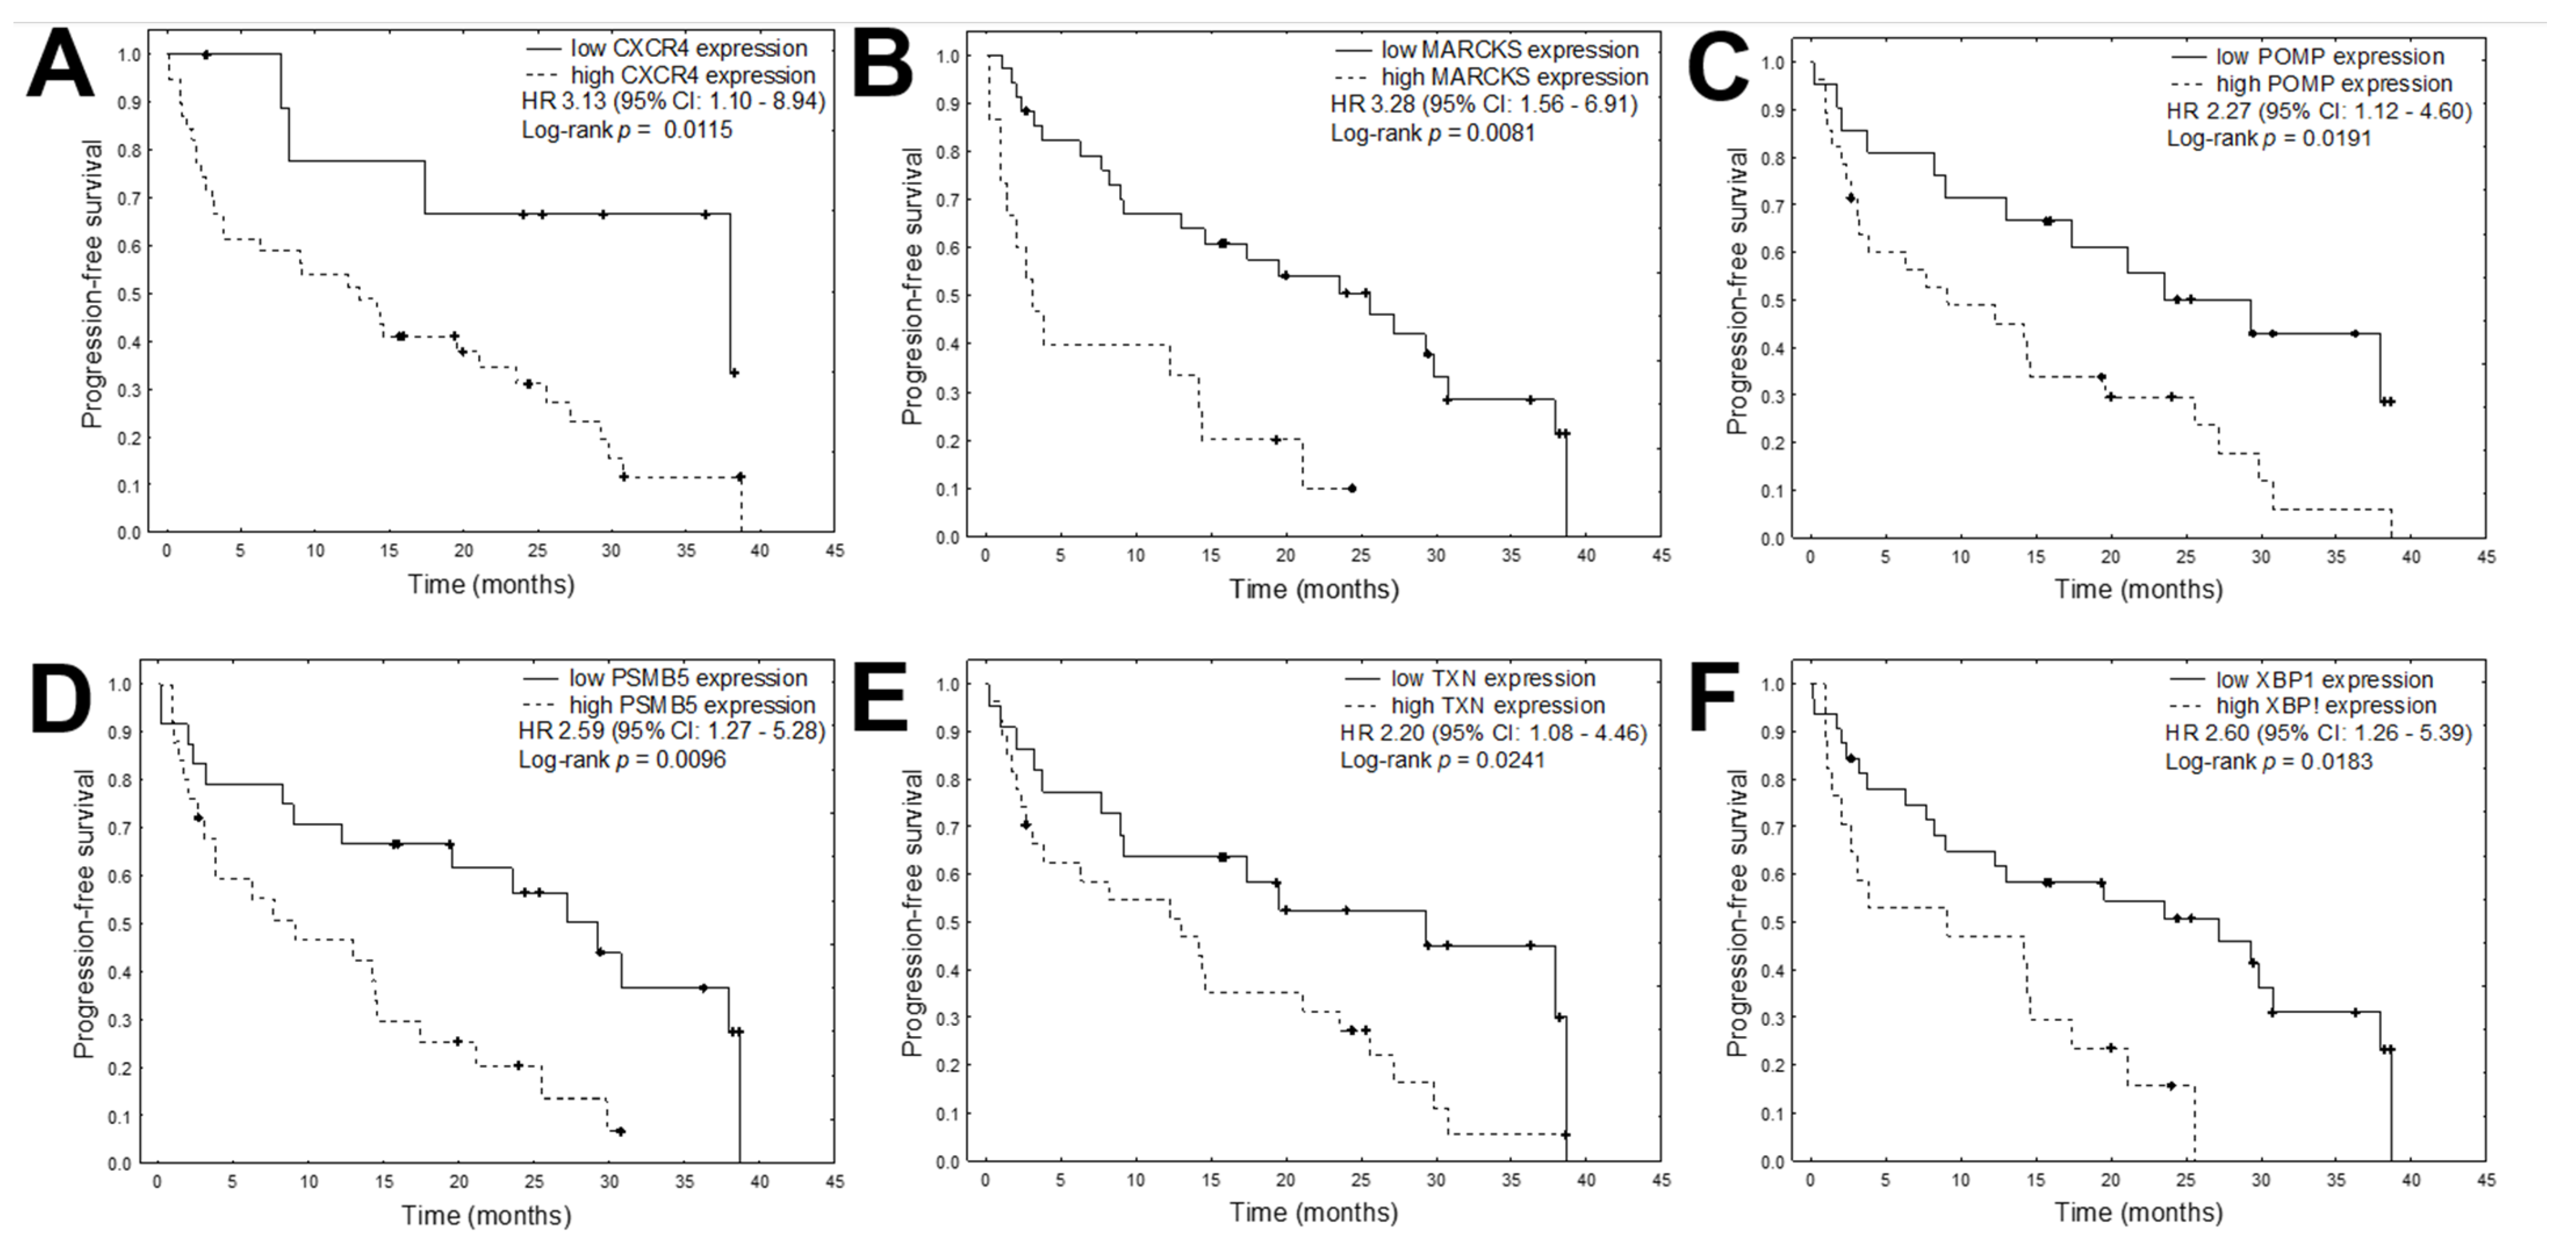
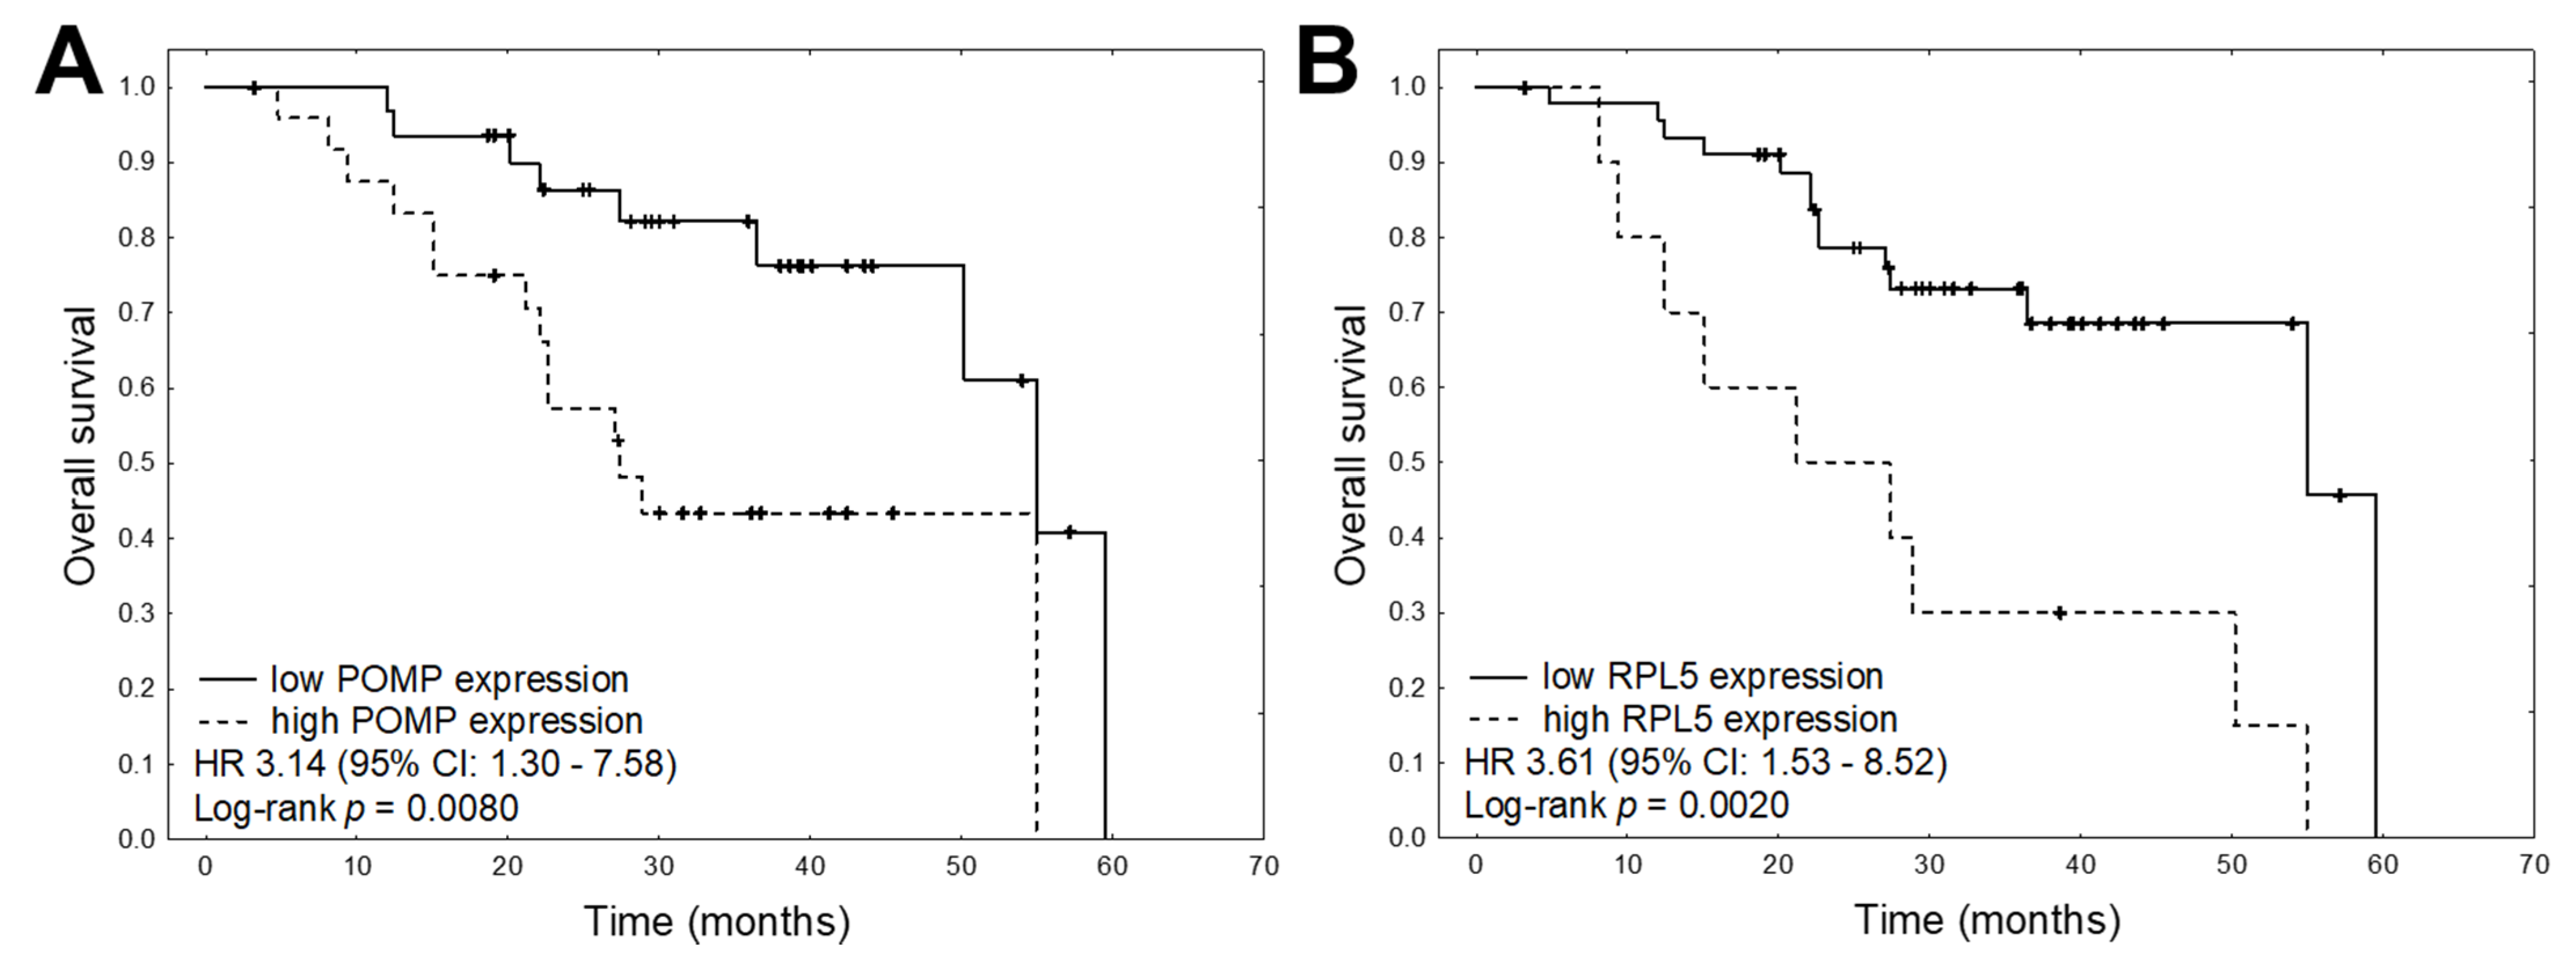
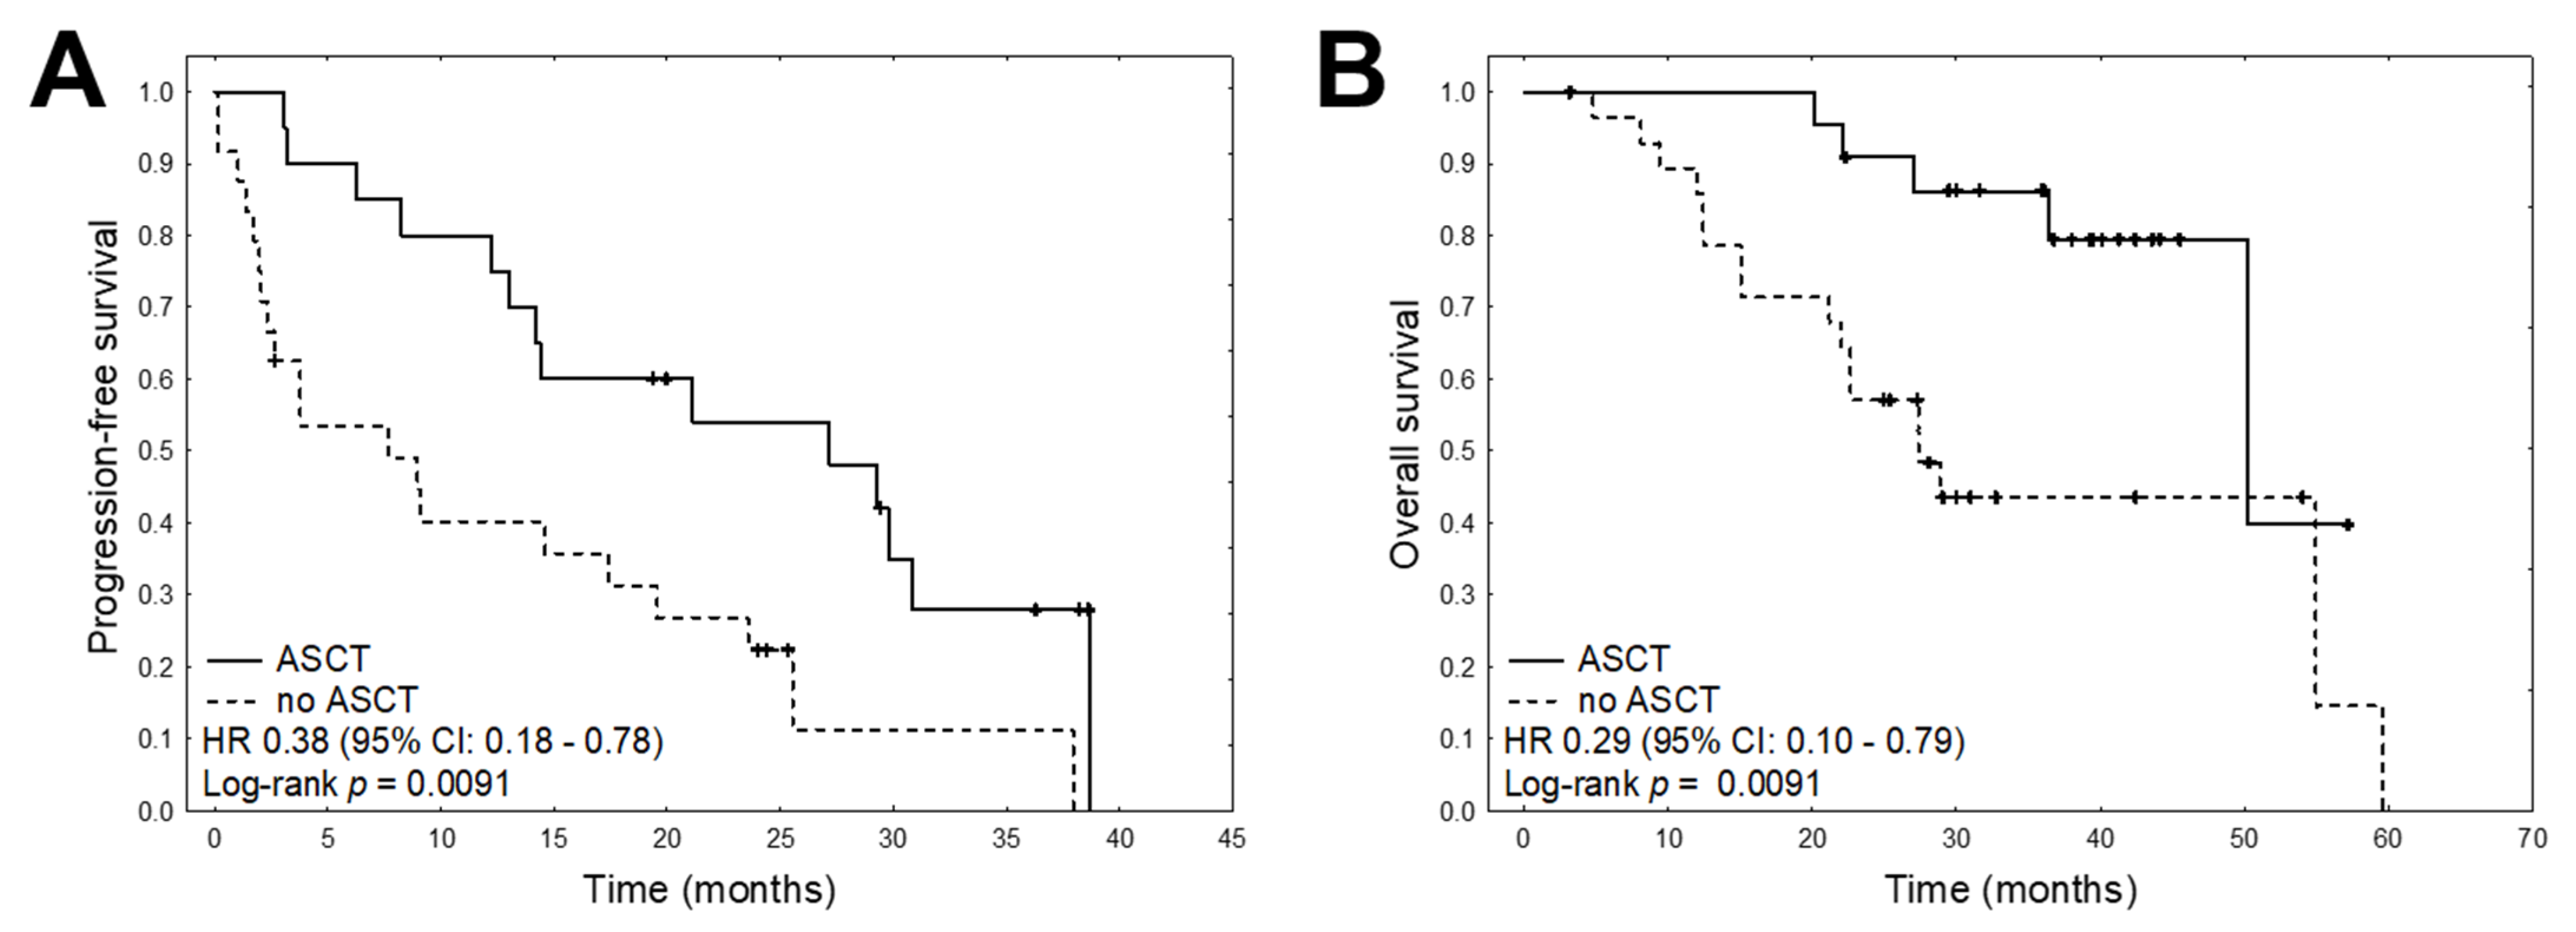
2. Results
3. Discussion
4. Materials and Methods
4.1. Patients
4.2. Blood Collection
4.3. The Analysis of Gene Expression Using Real-Time PCR
4.3.1. Isolation of Total RNA
4.3.2. Reverse Transcription Reaction
4.3.3. Selection of Reference Genes
4.3.4. Real-Time PCR
4.4. Statistical Analysis
4.4.1. Data Preparation
4.4.2. Analysis
5. Conclusions
Supplementary Materials
Author Contributions
Funding
Institutional Review Board Statement
Informed Consent Statement
Data Availability Statement
Acknowledgments
Conflicts of Interest
Abbreviations
| ABCB1 | Adenosine-triphosphate-binding cassette sub-family B member 1 |
| ACTB | beta-actin gene |
| ASCT | autologous stem cell transplantation |
| BM | bone marrow |
| CXCR-4 | C-X-C chemokine receptor type 4 |
| DLBCL | diffuse large B-cell lymphoma |
| ECM | extracellular matrix |
| FWER | family-wise error rate |
| IPO8 | Importin 8 gene |
| IsaRVD | isatuximab, lenalidomide, bortezomib, dexamethasone |
| MAF | musculoaponeurotic fibrosarcoma |
| MARCKS | myristoylated alanine-rich C-kinase substrate |
| MM | multiple myeloma |
| MT-ATP6 | mitochondrially Encoded ATP Synthase Membrane Subunit 6 gene |
| NRF2 | nuclear factor erythroid 2-related factor 2 |
| NF-κB | nuclear factor kappa B |
| OS | overall survival |
| PC | plasma cells |
| POMP | proteasome maturation protein |
| PFS | progression free survival |
| PI | proteasome inhibitor |
| PSMB5 | proteasome subunit β type 5 |
| RPLP0 | Ribosomal Protein Lateral Stalk Subunit P0 gene |
| RPL5 | ribosomal protein L5 |
| UPR | unfolded protein response |
| TXN | thioredoxin |
| VCD | bortezomib, cyclophosphamide, dexamethasone |
| VD | bortezomib and dexamethasone |
| VMP | bortezomib, melphalan and prednisone. |
| VTD | bortezomib, thalidomide, dexamethasone |
| TXN | thioredoxin |
| XBP1 | X-box binding protein 1 |
References
- International Myeloma Working Group. Criteria for the classification of monoclonal gammopathies, multiple myeloma and related disorders: A report of the International Myeloma Working Group. Br. J. Haematol. 2003, 121, 749–757. [Google Scholar] [CrossRef]
- Palumbo, A.; Anderson, K. Multiple Myeloma. N. Engl. J. Med. 2011, 364, 1046–1060. [Google Scholar] [CrossRef]
- Siegel, R.L.; Miller, K.D.; Jemal, A. Cancer statistics, 2020. CA Cancer J. Clin. 2020, 70, 7–30. [Google Scholar] [CrossRef]
- Gandolfi, S.; Laubach, J.P.; Hideshima, T.; Chauhan, D.; Anderson, K.C.; Richardson, P.G. The proteasome and proteasome inhibitors in multiple myeloma. Cancer Metastasis Rev. 2017, 36, 561–584. [Google Scholar] [CrossRef]
- Robak, P.; Robak, T. Bortezomib for the treatment of hematologic malignancies: 15 years later. Drugs R D 2019, 19, 73–92. [Google Scholar] [CrossRef] [PubMed]
- Mofers, A.; Selvaraju, K.; Gubat, J.; D’Arcy, P.; Linder, S. Identification of proteasome inhibitors using analysis of gene expression profiles. Eur. J. Pharmacol. 2020, 889, 173709. [Google Scholar] [CrossRef] [PubMed]
- Okazuka, K.; Ishida, T. Proteasome inhibitors for multiple myeloma. Jpn. J. Clin. Oncol. 2018, 48, 785–793. [Google Scholar] [CrossRef] [PubMed]
- Robak, P.; Drozdz, I.; Szemraj, J.; Robak, T. Drug resistance in multiple myeloma. Cancer Treat. Rev. 2018, 70, 199–208. [Google Scholar] [CrossRef]
- San Miguel, J.F.; Schlag, R.; Khuageva, N.K.; Dimopoulos, M.A.; Shpilberg, O.; Kropff, M.; Spicka, I.; Petrucci, M.T.; Palumbo, A.; Samoilova, O.S.; et al. Bortezomib plus melphalan and prednisone for initial treatment of multiple myeloma. N. Engl. J. Med. 2008, 359, 906–917. [Google Scholar] [CrossRef]
- Niewert, D.; Jansen, G.; Assaraf, Y.G.; Zweegman, S.; Kaspers, G.J.; Cloos, J. Molecular basis of resistance to proteasome inhibitors in hematological malignancies. Drug Resist Updat. 2015, 18, 18–35. [Google Scholar] [CrossRef] [PubMed]
- Lu, S.; Yang, J.; Song, X.; Gong, S.; Zhou, H.; Guo, L.; Song, N.; Bao, X.; Chen, P.; Wang, J. Point mutation of the proteasome beta5 subunit gene is an important mechanism of bortezomib resistance in bortezomib-selected variants of Jurkat T cell lymphoblastic lymphoma/leukemia line. J. Pharmacol. Exp. Ther. 2008, 326, 423–431. [Google Scholar] [CrossRef]
- Robak, P.; Dróżdż, I.; Jarych, D.; Mikulski, D.; Węgłowska, E.; Siemieniuk-Ryś, M.; Misiewicz, M.; Stawiski, K.; Fendler, W.; Szemraj, J.; et al. The value of serum microRNA expression signature in predicting refractoriness to bortezomib-based therapy in multiple myeloma patients. Cancers 2020, 12, 2569. [Google Scholar] [CrossRef] [PubMed]
- Lü, S.; Yang, J.; Chen, Z.; Gong, S.; Zhou, H.; Xu, X.; Wang, J. Different mutants of PSMB5 confer varying bortezomib resistance in T lymphoblastic lymphoma/leukemia cells derived from the Jurkat cell line. Exp. Hematol. 2009, 37, 831–837. [Google Scholar] [CrossRef]
- Brünnert, D.; Kraus, M.; Stühmer, T.; Kirner, S.; Heiden, R.; Goyal, P.; Driessen, C.; Bargou, R.C.; Chatterjee, M. Novel cell line models to study mechanisms and overcoming strategies of proteasome inhibitor resistance in multiple myeloma. Biochim. Biophys. Acta Mol. Basis Dis. 2019, 1865, 1666–1676. [Google Scholar] [CrossRef]
- Ikeda, H.; Ishiguro, K.; Igarashi, T.; Aoki, Y.; Hayashi, T.; Ishida, T.; Sasaki, Y.; Tokino, T.; Shinomura, Y. Molecular diagnostics of a single drug-resistant multiple myeloma case using targeted next-generation sequencing. Onco Targets Ther. 2015, 8, 2805–2815. [Google Scholar] [CrossRef][Green Version]
- Murray, M.Y.; Auger, M.J.; Bowles, K.M. Overcoming bortezomib resistance in multiple myeloma. Biochem. Soc. Trans. 2014, 42, 804–808. [Google Scholar] [CrossRef] [PubMed]
- Besse, A.; Stolze, S.C.; Rasche, L.; Weinhold, N.; Morgan, G.J.; Kraus, M.; Bader, J.; Overkleeft, H.S.; Besse, L.; Driessen, C. Carfilzomib resistance due to ABCB1/MDR1 overexpression is overcome by nelfinavir and lopinavir in multiple myeloma. Leukemia 2018, 32, 391–401. [Google Scholar] [CrossRef]
- Mulligan, G.; Mitsiades, C.; Bryant, B.; Zhan, F.; Chng, W.J.; Roels, S.; Koenig, E.; Fergus, A.; Huang, Y.; Richardson, P.; et al. Gene expression profiling and correlation with outcome in clinical trials of the proteasomeinhibitor bortezomib. Blood 2007, 109, 3177–3188. [Google Scholar] [CrossRef]
- Nian, F.; Zhu, J.; Chang, H. Long non-coding RNA ANGPTL1-3 promotes multiple myeloma bortezomib resistance by sponging miR-30a-3p to activate c-Maf expression. Biochem. Biophys. Res. Commun. 2019, 514, 1140–1146. [Google Scholar] [CrossRef]
- Oerlemans, R.; Franke, N.E.; Assaraf, Y.G.; Cloos, J.; Van Zantwijk, I.; Berkers, C.R.; Scheffer, G.L.; Debipersad, K.; Vojtekova, K.; Lemos, C.; et al. Molecular basis of bortezomib resistance: Proteasome subunit beta5 (PSMB5) gene mutation and overexpression of PSMB5 protein. Blood 2008, 112, 2489–2499. [Google Scholar] [CrossRef]
- Barrio, S.; Stühmer, T.; Da-Viá, M.; Barrio-Garcia, C.; Lehners, N.; Besse, A.; Cuenca, I.; Garitano-Trojaola, A.; Fink, S.; Leich, E.; et al. Spectrum and functional validation of PSMB5 mutations in multiple myeloma. Leukemia 2019, 33, 447–456. [Google Scholar] [CrossRef]
- Tang, H.; Xu, L.; Cen, X.; Yang, L.; Feng, J.; Li, G.; Zhu, H.; Gao, S.; Yu, Y.; Zhao, Y.; et al. CDK5 inhibition in vitro and in vivo induces cell death in myeloma and overcomes the obstacle of bortezomib resistance. Int. J. Mol. Med. 2020, 45, 1661–1672. [Google Scholar] [CrossRef] [PubMed]
- Xu, D.; Hu, J.; De Bruyne, E.; Menu, E.; Schots, R.; Vanderkerken, K.; Van Valckenborgh, E. Dll1/Notch activation contributes to bortezomib resistance by upregulating CYP1A1 in multiple myeloma. Biochem. Biophys. Res. Commun. 2012, 428, 518–524. [Google Scholar] [CrossRef] [PubMed]
- Kumar, S.K.; Therneau, T.M.; Gertz, M.A.; Lacy, M.Q.; Dispenzieri, A.; Rajkumar, S.V.; Fonseca, R.; Witzig, T.E.; Lust, J.A.; Larson, D.R.; et al. Clinical course of patients with relapsed multiple myeloma. Mayo Clin. Proc. 2004, 79, 867–874. [Google Scholar] [CrossRef] [PubMed]
- Hawley, T.S.; Riz, I.; Yang, W.; Wakabayashi, Y.; Depalma, L.; Chang, Y.T.; Peng, W.; Zhu, J.; Hawley, R.G. Identification of an ABCB1 (P-glycoprotein)-positive carfilzomib-resistant myeloma subpopula-tion by the pluripotent stem cell fluorescent dye CDy1. Am. J. Hematol. 2013, 88, 265–272. [Google Scholar] [CrossRef] [PubMed]
- Watanabe, T.; Mitsuhashi, M.; Sagawa, M.; Ri, M.; Suzuki, K.; Abe, M.; Ohmachi, K.; Nakagawa, Y.; Nakamura, S.; Chosa, M.; et al. Lipopolysaccharide-Induced CXCL10 mRNA Level and Six Stimulant-mRNA Combinations in Whole Blood: Novel Biomarkers for Bortezomib Responses Obtained from a Prospective Multicenter Trial for Patients with Multiple Myeloma. PLoS ONE 2015, 10, e0128662. [Google Scholar] [CrossRef]
- Lohr, J.G.; Stojanov, P.; Carter, S.L.; Cruz-Gordillo, P.; Lawrence, M.S.; Auclair, D.; Sougnez, C.; Knoechel, B.; Gould, J.; Saksena, G.; et al. Widespread Genetic Heterogeneity in Multiple Myeloma: Implications for targeted therapy. Cancer Cell 2014, 25, 91–101. [Google Scholar] [CrossRef]
- Hofman, I.J.F.; Patchett, S.; Van Duin, M.; Geerdens, E.; Verbeeck, J.; Michaux, L.; Delforge, M.; Sonneveld, P.; Johnson, A.W.; De Keersmaecker, K. Low frequency mutations in ribosomal proteins RPL10 and RPL5 in multiple myeloma. Haematologica 2017, 102, e317–e320. [Google Scholar] [CrossRef]
- Li, B.; Wang, H.; Orlowski, R.Z. Proteasome maturation protein POMP is associated with proteasome inhibitor resistance in myeloma, and its suppression enhances the activity of bortezomib and carfilzomib. American Society of Hematology Annual Meeting Abstracts. Blood 2013, 122 (Suppl. 1), 280. [Google Scholar] [CrossRef]
- Li, B.; Fu, J.; Chen, P.; Ge, X.; Li, Y.; Kuiatse, I.; Wang, H.; Wang, H.; Zhang, X.; Orlowski, R.Z. The nuclear factor (Erythroid-derived 2)-like 2 and proteasome maturation protein axis mediate bortezomib resistance in multiple myeloma. J. Biol. Chem. 2015, 290, 29854–29868. [Google Scholar] [CrossRef] [PubMed]
- Unno, M.; Mizushima, T.; Morimoto, Y.; Tomisugi, Y.; Tanaka, K.; Yasuoka, N.; Tsukihara, T. The structure of the mammalian 20S proteasome at 2.75 A resolution. Structure 2002, 10, 609–618. [Google Scholar] [CrossRef]
- Balsas, P.; Galan-Malo, P.; Marzo, I.; Naval, J. Bortezomib resistance in a myeloma cell line is associated to PSM _5 overexpression and polyploidy. Leuk. Res. 2012, 36, 212–218. [Google Scholar] [CrossRef]
- Kuhn, D.J.; Berkova, Z.; Jones, R.J.; Woessner, R.; Bjorklund, C.C.; Ma, W.; Davis, R.E.; Lin, P.; Wang, H.; Madden, T.L.; et al. Targeting the insulin-like growth factor-1 receptor to overcome bortezomib resistance in preclinical models of multiple myeloma. Blood 2012, 120, 3260–3270. [Google Scholar] [CrossRef] [PubMed]
- Verbrugge, S.E.; Assaraf, Y.G.; Dijkmans, B.A.; Scheffer, G.L.; Al, M.; Den Uyl, D.; Oerlemans, R.; Chan, E.T.; Kirk, C.J.; Peters, G.J.; et al. Inactivating PSMB5 mutations and P-glycoprotein (multidrug resistance-associated protein/ATP-binding cassette B1) mediate resistance to proteasome inhibitors: Ex vivo efficacy of (immuno)proteasome inhibitors in mononuclear blood cells from patients with rheumatoid arthritis. J. Pharmacol. Exp. Ther. 2012, 341, 174–182. [Google Scholar]
- Allmeroth, K.; Horn, M.; Kroef, V.; Miethe, S.; Müller, R.U.; Denzel, M.S. Bortezomib resistance mutations in PSMB5 determine response to second-generation proteasome inhibitors in multiple myeloma. Leukemia 2020. [Google Scholar] [CrossRef] [PubMed]
- Shi, C.X.; Zhu, Y.X.; Bruins, L.A.; Bonolo de Campos, C.; Stewart, W.; Braggio, E.; Stewart, A.K. Proteasome subunits differentially control myeloma cell viability and proteasome inhibitor sensitivity. Mol. Cancer Res. 2020, 18, 1453–1464. [Google Scholar] [CrossRef] [PubMed]
- Ullah, T.R. The role of CXCR4 in multiple myeloma: Cells’ journey from bone marrow to beyond. J. Bone Oncol. 2019, 17, 100253. [Google Scholar] [CrossRef]
- Stessman, H.A.; Mansoor, A.; Zhan, F.; Janz, S.; Linden, M.A.; Baughn, L.B.; Van Ness, B. Reduced CXCR4 expression is associated with extramedullary disease in a mouse model of myeloma and predicts poor survival in multiple myeloma patients treated with bortezomib. Leukemia 2013, 27, 2075–2077. [Google Scholar] [CrossRef]
- Shaughnessy, J.D., Jr.; Qu, P.; Usmani, S.; Heuck, C.J.; Zhang, Q.; Zhou, Y.; Tian, E.; Hanamura, I.; van Rhee, F.; Anaissie, E.; et al. Pharmacogenomics of bortezomib test-dosing identifies hyperexpression ofproteasome genes, especially PSMD4, as novel high-risk feature in myelomatreated with total therapy. Blood 2011, 118, 3512–3524. [Google Scholar] [CrossRef] [PubMed]
- Finlayson, A.E.; Freeman, K.W. A cell motility screen reveals role for MARCKS-related protein in adherens junction formation and tumorigenesis. PLoS ONE 2009, 4, e7833. [Google Scholar] [CrossRef] [PubMed]
- Li, T.; Li, D.; Sha, J.; Sun, P.; Huang, Y. MicroRNA-21 directly targets MARCKS and promotes apoptosis resistance and invasion in prostate cancer cells. Biochem. Biophys. Res. Commun. 2009, 383, 280–285. [Google Scholar] [CrossRef]
- Niewerth, D.; Jansen, G.; Riethoff, L.F.; Van Meerloo, J.; Kale, A.J.; Moore, B.S.; Assaraf, Y.G.; Anderl, J.L.; Zweegman, S.; Kaspers, G.J.; et al. Antileukemic activity and mechanism of drug resistance to the marine Salinispora tropica proteasome inhibitor salinosporamide (Marizomib). Mol. Pharmacol. 2014, 86, 12–19. [Google Scholar] [CrossRef]
- Micallef, J.; Taccone, M.; Mukherjee, J.; Croul, S.; Busby, J.; Moran, M.F.; Guha, A. Epidermal growth factor receptor variant III-induced glioma invasion is mediated through myristoylated alanine-rich protein kinase C substrate over-expression. Cancer Res. 2009, 69, 7548–7556. [Google Scholar] [CrossRef]
- Wang, J.; Hendrix, A.; Hernot, S.; Lemaire, M.; De Bruyne, E.; Van Valckenborgh, E.; Lahoutte, T.; De Wever, O.; Vanderkerken, K.; Menu, E. Bone marrow stromal cell-derived exosomes as communicators in drug resistance in multiple myeloma cells. Blood 2014, 124, 555–566. [Google Scholar] [CrossRef] [PubMed]
- Yang, Y.; Chen, Y.; Saha, M.N.; Chen, J.; Evans, K.; Qiu, L.; Reece, D.; Chen, G.A.; Chang, H. Targeting phospho-MARCKS overcomes drug resistance and induces antitumor activity in preclinical models of multiple myeloma. Leukemia 2015, 29, 715–726. [Google Scholar] [CrossRef]
- Dytfeld, D.; Luczak, M.; Wrobel, T.; Usnarska-Zubkiewicz, L.; Brzezniakiewicz, K.; Jamroziak, K.; Giannopoulos, K.; Przybylowicz-Chalecka, A.; Ratajczak, B.; Czerwinska-Rybak, J. Comparative proteomic profiling of refractory/relapsed multiple myeloma reveals biomarkers involved in resistance to bortezomib-based therapy. Oncotarget 2016, 7, 56726–56736. [Google Scholar] [CrossRef]
- Zheng, Z.; Fan, S.; Zheng, J.; Huang, W.; Gasparetto, C.; Chao, N.J.; Hu, J.; Kang, Y. Inhibition of thioredoxin activates mitophagy and overcomes adaptive bortezomib resistance in multiple myeloma. J. Hematol. Oncol. 2018, 11, 1–15. [Google Scholar] [CrossRef]
- Raninga, P.V.; Di Trapani, G.; Vuckovic, S.; Bhatia, M.; Tonissen, K.F. Inhibition of thioredoxin 1 leads to apoptosis in drug-resistant multiple myeloma. Oncotarget 2015, 6, 15410–15424. [Google Scholar] [CrossRef] [PubMed]
- Leung-Hagesteijn, C.; Erdmann, N.; Cheung, G.; Keats, J.J.; Stewart, A.K.; Reece, D.E.; Chung, K.C.; Tiedemann, R.E. Xbp1s-negative tumor B cells and pre-plasmablasts mediate therapeutic proteasome inhibitor resistance in multiple myeloma. Cancer Cell 2013, 24, 289–304. [Google Scholar] [CrossRef]
- Liu, N.; Liu, C.; Li, X.; Liao, S.; Song, W.; Yang, C.; Zhao, C.; Huang, H.; Guan, L.; Zhang, P.; et al. A novel proteasome inhibitor suppresses tumor growth via targeting both 19S proteasome deubiquitinases and 20S proteolytic peptidases. Sci. Rep. 2014, 4, 5240. [Google Scholar] [CrossRef] [PubMed]
- Hong, S.Y.; Hagen, T. Multiple myeloma Leu167Ile (c.499C>A) mutation prevents XBP1 mRNA splicing. Br. J. Haematol. 2013, 161, 898–901. [Google Scholar] [CrossRef]
- Nikesitch, N.; Silvia, C.; Ling, W. Molecular mechanisms in multiple myeloma drug resistance. J. Clin. Pathol. 2016, 69, 97–101. [Google Scholar] [CrossRef]
- Rajkumar, S.V.; Dimopoulos, M.A.; Palumbo, A.; Blade, J.; Merlini, G.; Mateos, M.V.; Kumar, S.; Hillengass, J.; Kastritis, E.; Richardson, P.; et al. International Myeloma Working Group updated criteria for the diagnosis of multiple myeloma. Lancet Oncol. 2014, 15, e538–e548. [Google Scholar] [CrossRef]
- Robak, P.; Węgłowska, E.; Dróżdż, I.; Mikulski, D.; Jarych, D.; Ferlińska, M.; Wawrzyniak, E.; Misiewicz, M.; Smolewski, P.; Fendler, W.; et al. Cytokine and chemokine profile in patients with multiple myeloma treated with bortezomib. Mediat. Inflamm. 2020, 2020, 1835836. [Google Scholar] [CrossRef] [PubMed]
- Durie, B.G.; Harousseau, J.L.; Miguel, J.S.; Bladé, J.; Barlogie, B.; Anderson, K.; Gertz, M.; Dimopoulos, M.; Westin, J.; Sonneveld, P.; et al. International uniform response criteria for multiple myeloma. Leukemia 2006, 20, 1467–1473. [Google Scholar] [CrossRef]
- Kyle, R.A.; Rajkumar, S.V. Criteria for diagnosis, staging, risk stratification and response assessment of multiple myeloma. Leukemia 2009, 23, 3–9. [Google Scholar] [CrossRef]
- Anderson, K.C.; Kyle, R.A.; Rajkumar, S.V.; Stewart, A.K.; Weber, D.; Richardson, P. ASH/FDA Panel on Clinical Endpoints in Multiple Myeloma. Clinically relevant end points and new drug approvals for myeloma. Leukemia 2008, 22, 231–239. [Google Scholar] [CrossRef] [PubMed][Green Version]
- Laubach, J.P.; Mitsiades, C.S.; Mahindra, A.; Luskin, M.R.; Rosenblatt, J.; Ghobrial, I.M.; Schlossman, R.L.; Avigan, D.; Raje, N.; Munshi, N.C.; et al. Management of relapsed and relapsed/refractory multiple myeloma. J. Natl. Compr. Cancer Netw. 2011, 9, 1209–1216. [Google Scholar] [CrossRef]
- Grabia, S.; Smyczynska, U.; Pagacz, K.; Fendler, W. NormiRazor: Tool applying GPU-accelerated computing for determination of internal references in microRNA transcription studies. BMC Bioinform. 2020, 21, 425. [Google Scholar] [CrossRef]
- Budczies, J.; Klauschen, F.; Sinn, B.V.; Győrffy, B.; Schmitt, W.D.; Darb-Esfahani, S.; Denkert, C. Cutoff Finder: A comprehensive and straightforward Web application enabling rapid biomarker cutoff optimization. PLoS ONE 2012, 7, e51862. [Google Scholar] [CrossRef] [PubMed]


| Variable | MM Total | Refractory | Sensitive | Healthy Donors | p |
|---|---|---|---|---|---|
| Number of patients | 73 | 43 | 30 | 11 | - |
| Gender (%) N (%) | M: 43 (58.9) F: 30 (41.1) | M: 25 (58.1) F: 18 (41.9) | M: 18(60.0) F: 12(40.0) | M: 5 (45.5) F: 6 (54.5) | 0.69 |
| Age + SD (range) | 61.9 ± 10.8 (38.2–83.7) | 62.2 ± 11.5 (38.2–83.7) | 61.3 ± 9.7 (39.8–81.6) | 63.0 ± 6.2 (52.6–74.4) | 0.73 |
| Bortezomib regimen: | - | - | - | - | 0.18 |
| VCD | 58 (79.5) | 32 (74.4) | 26 (86.7) | - | |
| VMP | 6 (8.2) | 5 (11.6) | 1 (3.3) | - | |
| VTD | 4 (5.5) | 2 (4.7) | 2 (6.7) | - | |
| VD | 4 (5.5) | 4 (9.3) | 0 | - | |
| IsaVRD | 1 (1.4) | 0 | 1 (6.7) | - | |
| Paraprotein–N (%) | - | - | - | - | 0.02 |
| IgG | 41 (56.2) | 28 (65.1) | 13 (43.3) | ||
| IgA | 17 (23.3) | 11 (25.6) | 6 (20.0) | - | |
| LCD | 15 (20.5) | 4 (9.3) | 11 (36.7) | - | |
| Prior treatment | 12 (16.4) | 11 (25.6) | 1 (3.3) | - | 0.01 |
| Bone involvement at diagnosis | 40 (54.8) | 23 (53.5) | 17 (56.6) | - | 0.96 |
| Calcium > 2.75 mmol/L at diagnosis | 12 (16.4) | 7 (16.3) | 5 (16.7) | - | 0.89 |
| HB < 10g/dL at diagnosis | 26 (35.6) | 14 (32.6) | 12 (40.0) | - | 0.73 |
| Creatinine > 2 mg/dL at diagnosis | 10 (13.7) | 4 (9.3) | 6 (20.0) | - | 0.31 |
| International Staging System (ISS) at diagnosis | I: 22 (30.1) II: 17 (23.3) III:32(43.8) | I: 14 (32.6) II: 10 (23.3) III: 18(41.9) | I: 8 (26.7) II: 7 (23.3) III: 14(46.7) | - | 0.86 |
| CRP > 5 mg/L | 33 (45.2) | 16 (37.2) | 17 (56.7) | - | 0.06 |
| Beta2-microglobuline increased (>3mg/L) | 51 (69.9) | 31 (72.1) | 20 (66.7) | - | 0.36 |
| LDH > 240U/L | 9 (12.3) | 5 (11.6) | 4 (13.3) | - | 0.85 |
| Cytogenetics (%) | N = 41 | N = 24 | N = 17 | - | |
| t(4;14) | 9 (22.0) | 7 (29.2) | 2 (11.8) | 0.26 | |
| t(14;16) | 0 | 0 | 0 | - | |
| t(14;20) | 0 | 0 | 0 | - | |
| del(17p) | 6 (14.6) | 4 (16.7) | 2 (11.8) | 1.00 | |
| amp(1q) | 22 (53.7) | 12 (50.0) | 10 (58.8) | 0.75 | |
| del(13q) | 8 (19.5) | 2 (8.3) | 6 (35.3) | 0.61 | |
| t(11; 14) | 1 (2.4) | 1 (4.2) | 0 | ||
| del(1p) | 2 (4.9) | 1 (4.2) | 1 (5.9) | 1.00 | |
| IGH rearrangements | 19 (46.3) | 12 (50.0) | 7 (41.2) | 0.71 |
| mRNA | ΔCt MM (N = 73) mean ± SD | Δ Ct Healthy Donors (N = 11) Mean ±SD | FC | p-Value | FWER |
|---|---|---|---|---|---|
| ABCB1 | 7.55 ± 0.99 | 7.12 ± 0.74 | 0.74 | 0.1075 | 0.6451 |
| CXCR4 | 3.83 ± 0.82 | 3.56 ± 0.21 | 0.82 | 0.0209 | 0.1669 |
| MAF | 7.75 ± 1.08 | 7.20 ± 0.85 | 0.68 | 0.0737 | 0.5159 |
| MARCKS | 5.99 ± 0.83 | 5.63 ± 0.90 | 0.78 | 0.2346 | 1.0000 |
| POMP | 5.17 ± 0.67 | 5.12 ± 0.39 | 0.97 | 0.7541 | 1.0000 |
| PSMB5 | 6.96 ± 0.78 | 6.80 ± 0.59 | 0.90 | 0.4341 | 1.0000 |
| RPL5 | 2.73 ± 0.81 | 2.02 ± 0.46 | 0.61 | 0.0004 | 0.0033 |
| TXN | 3.43 ± 0.74 | 3.69 ± 0.66 | 1.20 | 0.2508 | 1.0000 |
| XBP1 | 3.26 ± 0.92 | 3.21 ± 0.66 | 0.96 | 0.8036 | 1.0000 |
| mRNA | ΔCt Refractory (N = 43) Mean ± SD | ΔCt Sensitive (N = 30) Mean ± SD | FC | p-Value | FWER |
|---|---|---|---|---|---|
| ABCB1 | 7.58 ± 1.02 | 7.50 ± 0.98 | 0.95 | 0.7384 | 1.0000 |
| CXCR4 | 3.75 ± 0.70 | 3.95 ± 0.96 | 1.15 | 0.3438 | 1.0000 |
| MAF | 7.70 ± 1.12 | 7.82 ± 1.03 | 1.09 | 0.6516 | 1.0000 |
| MARCKS | 5.79 ± 0.70 | 6.27 ± 0.92 | 1.40 | 0.0190 | 0.1522 |
| POMP | 4.94 ± 0.57 | 5.48 ± 0.67 | 1.45 | 0.0007 | 0.0062 |
| PSMB5 | 6.84 ± 0.70 | 7.12 ± 0.87 | 1.22 | 0.1421 | 0.8523 |
| RPL5 | 2.69 ± 0.87 | 2.78 ± 0.75 | 1.06 | 0.6622 | 1.0000 |
| TXN | 3.35 ± 0.72 | 3.55 ± 0.77 | 1.15 | 0.2676 | 1.0000 |
| XBP1 | 3.08 ± 0.84 | 3.51 ± 0.97 | 1.35 | 0.0537 | 0.3759 |
| Variables | PFS | OS | ||||||||
|---|---|---|---|---|---|---|---|---|---|---|
| Coefficient | p-Value | HR | 95% CI | Coefficient | p-Value | HR | 95% CI | |||
| Lower | Upper | Lower | Upper | |||||||
| ABCB1 expression (high vs. low) | −0.248 | 0.2716 | 0.609 | 0.252 | 1.474 | −0.226 | 0.2950 | 0.637 | 0.273 | 1.482 |
| CXCR4 expression (high vs. low) | 0.571 | 0.0327 | 3.134 | 1.099 | 8.940 | 0.272 | 0.2865 | 1.722 | 0.634 | 4.679 |
| MAF expression (high vs. low) | 0.261 | 0.1348 | 1.685 | 0.850 | 3.336 | 0.390 | 0.2968 | 2.183 | 0.504 | 9.464 |
| MARCKS expression (high vs. low) | 0.594 | 0.0018 | 3.281 | 1.559 | 6.907 | −0.343 | 0.1115 | 0.504 | 0.217 | 1.172 |
| POMP expression (high vs. low) | 0.409 | 0.0236 | 2.266 | 1.116 | 4.601 | 0.573 | 0.0108 | 3.144 | 1.303 | 7.585 |
| PSMB5 expression (high vs. low) | 0.476 | 0.0088 | 2.591 | 1.271 | 5.280 | 0.348 | 0.1497 | 2.004 | 0.778 | 5.158 |
| RPL5 expression (high vs. low) | −0.137 | 0.4206 | 0.760 | 0.389 | 1.483 | 0.641 | 0.0035 | 3.607 | 1.526 | 8.524 |
| TXN expression (high vs. low) | 0.394 | 0.0290 | 2.198 | 1.084 | 4.456 | 0.298 | 0.1683 | 1.813 | 0.778 | 4.228 |
| XBP1 expression (high vs. low) | 0.479 | 0.0099 | 2.605 | 1.259 | 5.389 | 0.270 | 0.2091 | 1.715 | 0.739 | 3.981 |
| Age | 0.006 | 0.7070 | 1.006 | 0.975 | 1.038 | 0.037 | 0.1281 | 1.038 | 0.989 | 1.089 |
| ASCT | ||||||||||
| No | Reference | Reference | ||||||||
| Yes | −0.487 | 0.0089 | 0.378 | 0.182 | 0.783 | −0.624 | 0.0157 | 0.287 | 0.104 | 0.790 |
| Bone involvement at diagnosis | ||||||||||
| No | Reference | Reference | ||||||||
| Yes | 0.303 | 0.1043 | 1.832 | 0.882 | 3.805 | 0.309 | 0.1932 | 1.856 | 0.731 | 4.709 |
| Calcium > 2.75 mmol/L at diagnosis | ||||||||||
| No | Reference | Reference | ||||||||
| Yes | 0.374 | 0.0929 | 2.112 | 0.883 | 5.052 | −0.089 | 0.7501 | 0.837 | 0.281 | 2.495 |
| CRP >5 mg/L | ||||||||||
| No | Reference | Reference | ||||||||
| Yes | 0.101 | 0.6100 | 1.224 | 0.563 | 2.663 | −0.461 | 0.0637 | 0.398 | 0.150 | 1.054 |
| HB < 10 g/dL at diagnosis | ||||||||||
| No | Reference | Reference | ||||||||
| Yes | 0.092 | 0.6243 | 1.202 | 0.576 | 2.505 | 0.009 | 0.9698 | 1.018 | 0.409 | 2.530 |
| ISS I | Reference | Reference | ||||||||
| ISS II | −0.682 | 0.0590 | 0.375 | 0.124 | 1.134 | 0.030 | 0.9389 | 1.828 | 0.460 | 7.267 |
| ISS III | 0.383 | 0.1594 | 1.089 | 0.509 | 2.326 | 0.544 | 0.0684 | 3.056 | 1.035 | 9.021 |
| Creatinine > 2 mg/dL at diagnosis | ||||||||||
| No | Reference | Reference | ||||||||
| Yes | −0.396 | 0.1952 | 0.453 | 0.136 | 1.502 | −0.253 | 0.4984 | 0.603 | 0.140 | 2.606 |
| LDH >240U/L | ||||||||||
| No | Reference | Reference | ||||||||
| Yes | 0.188 | 0.4221 | 1.457 | 0.581 | 3.651 | 0.411 | 0.1526 | 2.277 | 0.737 | 7.032 |
| Gender | ||||||||||
| F | Reference | 0.1008 | 0.564 | 0.284 | 1.118 | Reference | ||||
| M | −0.287 | 0.352 | 0.1583 | 2.022 | 0.760 | 5.376 | ||||
| Variables | PFS | ||||
|---|---|---|---|---|---|
| Coefficient | p-Value | HR | 95% CI | ||
| Lower | Upper | ||||
| PSMB5 expression (high vs. low) | 0.386 | 0.0451 | 2.164 | 1.017 | 4.603 |
| CXCR expression (high vs. low) | 0.748 | 0.0073 | 4.465 | 1.496 | 13.320 |
| ASCT | |||||
| No | Reference | ||||
| Yes | −0.612 | 0.0024 | 0.294 | 0.133 | 0.649 |
| Variables | OS | ||||
| POMP expression (high vs. low) | 0.523 | 0.0258 | 2.849 | 1.135 | 7.148 |
| RPL5 expression (high vs. low) | 0.664 | 0.0026 | 3.777 | 1.591 | 8.963 |
Publisher’s Note: MDPI stays neutral with regard to jurisdictional claims in published maps and institutional affiliations. |
© 2021 by the authors. Licensee MDPI, Basel, Switzerland. This article is an open access article distributed under the terms and conditions of the Creative Commons Attribution (CC BY) license (http://creativecommons.org/licenses/by/4.0/).
Share and Cite
Robak, P.; Jarych, D.; Mikulski, D.; Dróżdż, I.; Węgłowska, E.; Kotkowska, A.; Misiewicz, M.; Smolewski, P.; Stawiski, K.; Fendler, W.; et al. The Prognostic Value of Whole-Blood PSMB5, CXCR4, POMP, and RPL5 mRNA Expression in Patients with Multiple Myeloma Treated with Bortezomib. Cancers 2021, 13, 951. https://doi.org/10.3390/cancers13050951
Robak P, Jarych D, Mikulski D, Dróżdż I, Węgłowska E, Kotkowska A, Misiewicz M, Smolewski P, Stawiski K, Fendler W, et al. The Prognostic Value of Whole-Blood PSMB5, CXCR4, POMP, and RPL5 mRNA Expression in Patients with Multiple Myeloma Treated with Bortezomib. Cancers. 2021; 13(5):951. https://doi.org/10.3390/cancers13050951
Chicago/Turabian StyleRobak, Pawel, Dariusz Jarych, Damian Mikulski, Izabela Dróżdż, Edyta Węgłowska, Aleksandra Kotkowska, Małgorzata Misiewicz, Piotr Smolewski, Konrad Stawiski, Wojciech Fendler, and et al. 2021. "The Prognostic Value of Whole-Blood PSMB5, CXCR4, POMP, and RPL5 mRNA Expression in Patients with Multiple Myeloma Treated with Bortezomib" Cancers 13, no. 5: 951. https://doi.org/10.3390/cancers13050951
APA StyleRobak, P., Jarych, D., Mikulski, D., Dróżdż, I., Węgłowska, E., Kotkowska, A., Misiewicz, M., Smolewski, P., Stawiski, K., Fendler, W., Szemraj, J., & Robak, T. (2021). The Prognostic Value of Whole-Blood PSMB5, CXCR4, POMP, and RPL5 mRNA Expression in Patients with Multiple Myeloma Treated with Bortezomib. Cancers, 13(5), 951. https://doi.org/10.3390/cancers13050951