
Molecular Analysis of Colorectal Cancers Suggests a High Frequency of Lynch Syndrome in Indonesia

 , ,
, ,
Abstract
Simple Summary
Abstract
1. Introduction
2. Method
2.1. CRC Clinical Samples
2.2. DNA Extraction
2.3. Bisulphite Conversion
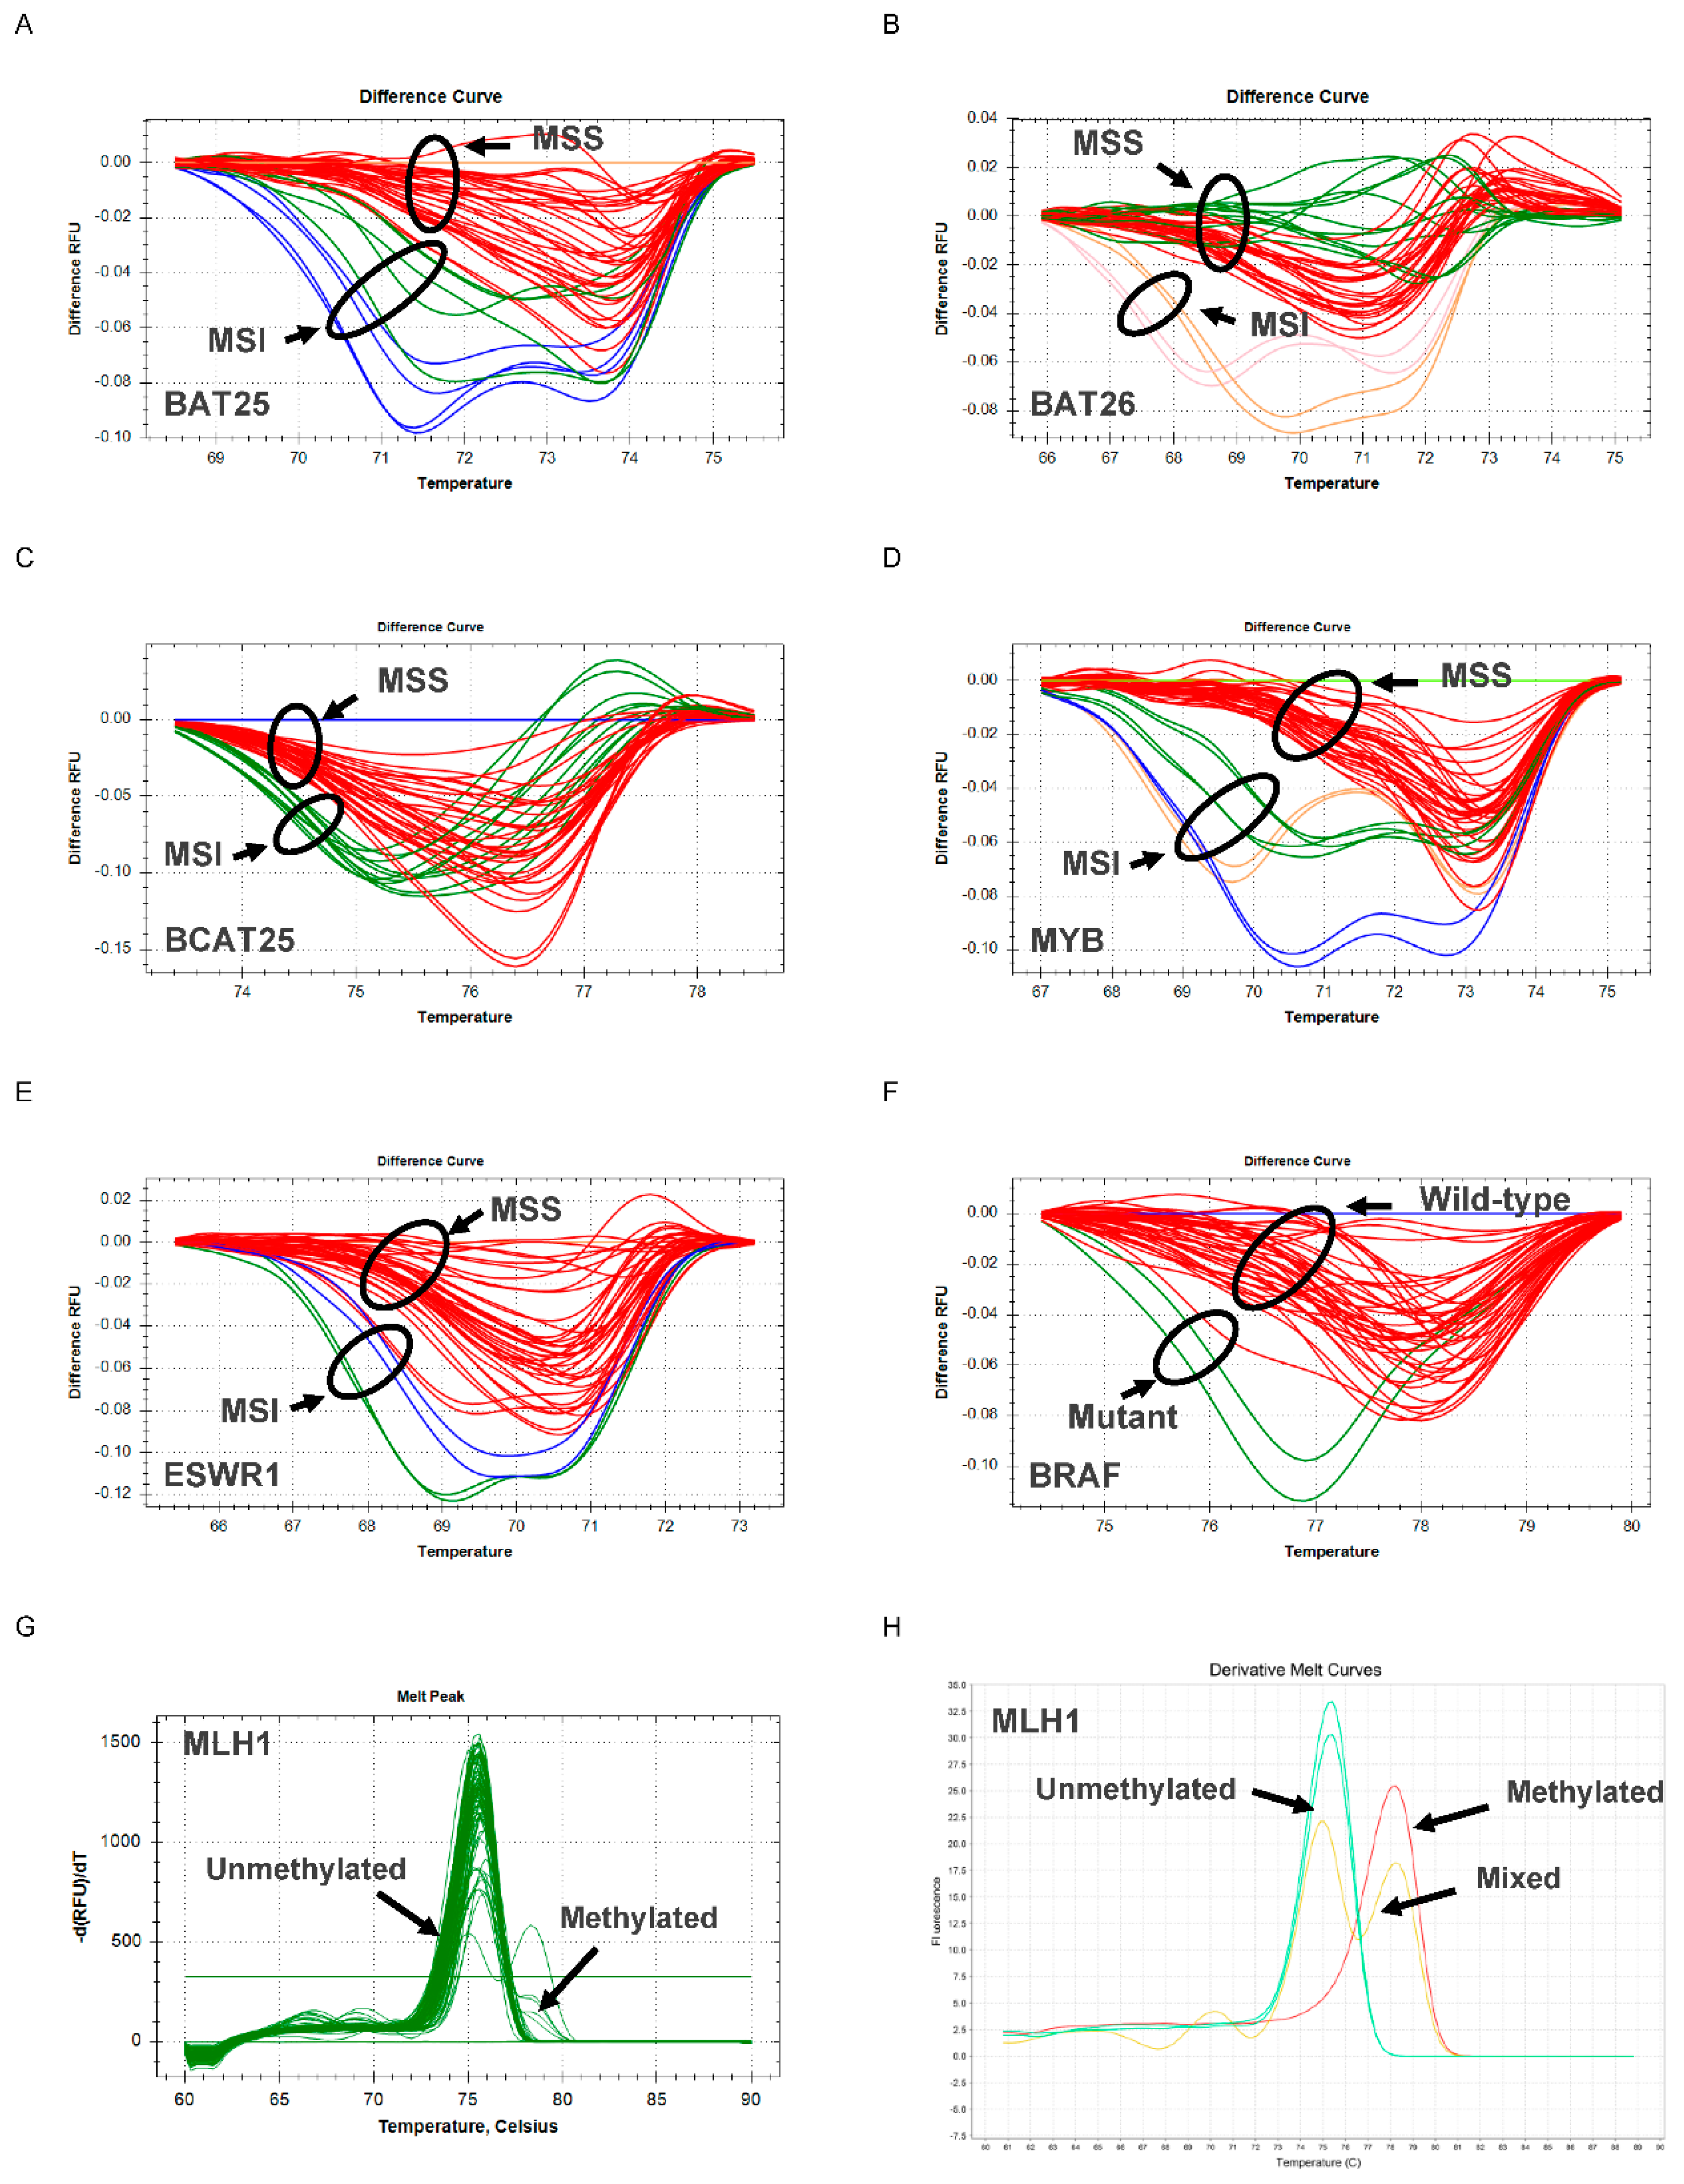
2.4. MSI, BRAF and MLH1 Analysis Using N_LyST Panel
2.5. Statistical Analysis
3. Results
3.1. Patient Clinicopathology Characteristics
3.2. Lynch Syndrome Screening Using N_Lyst
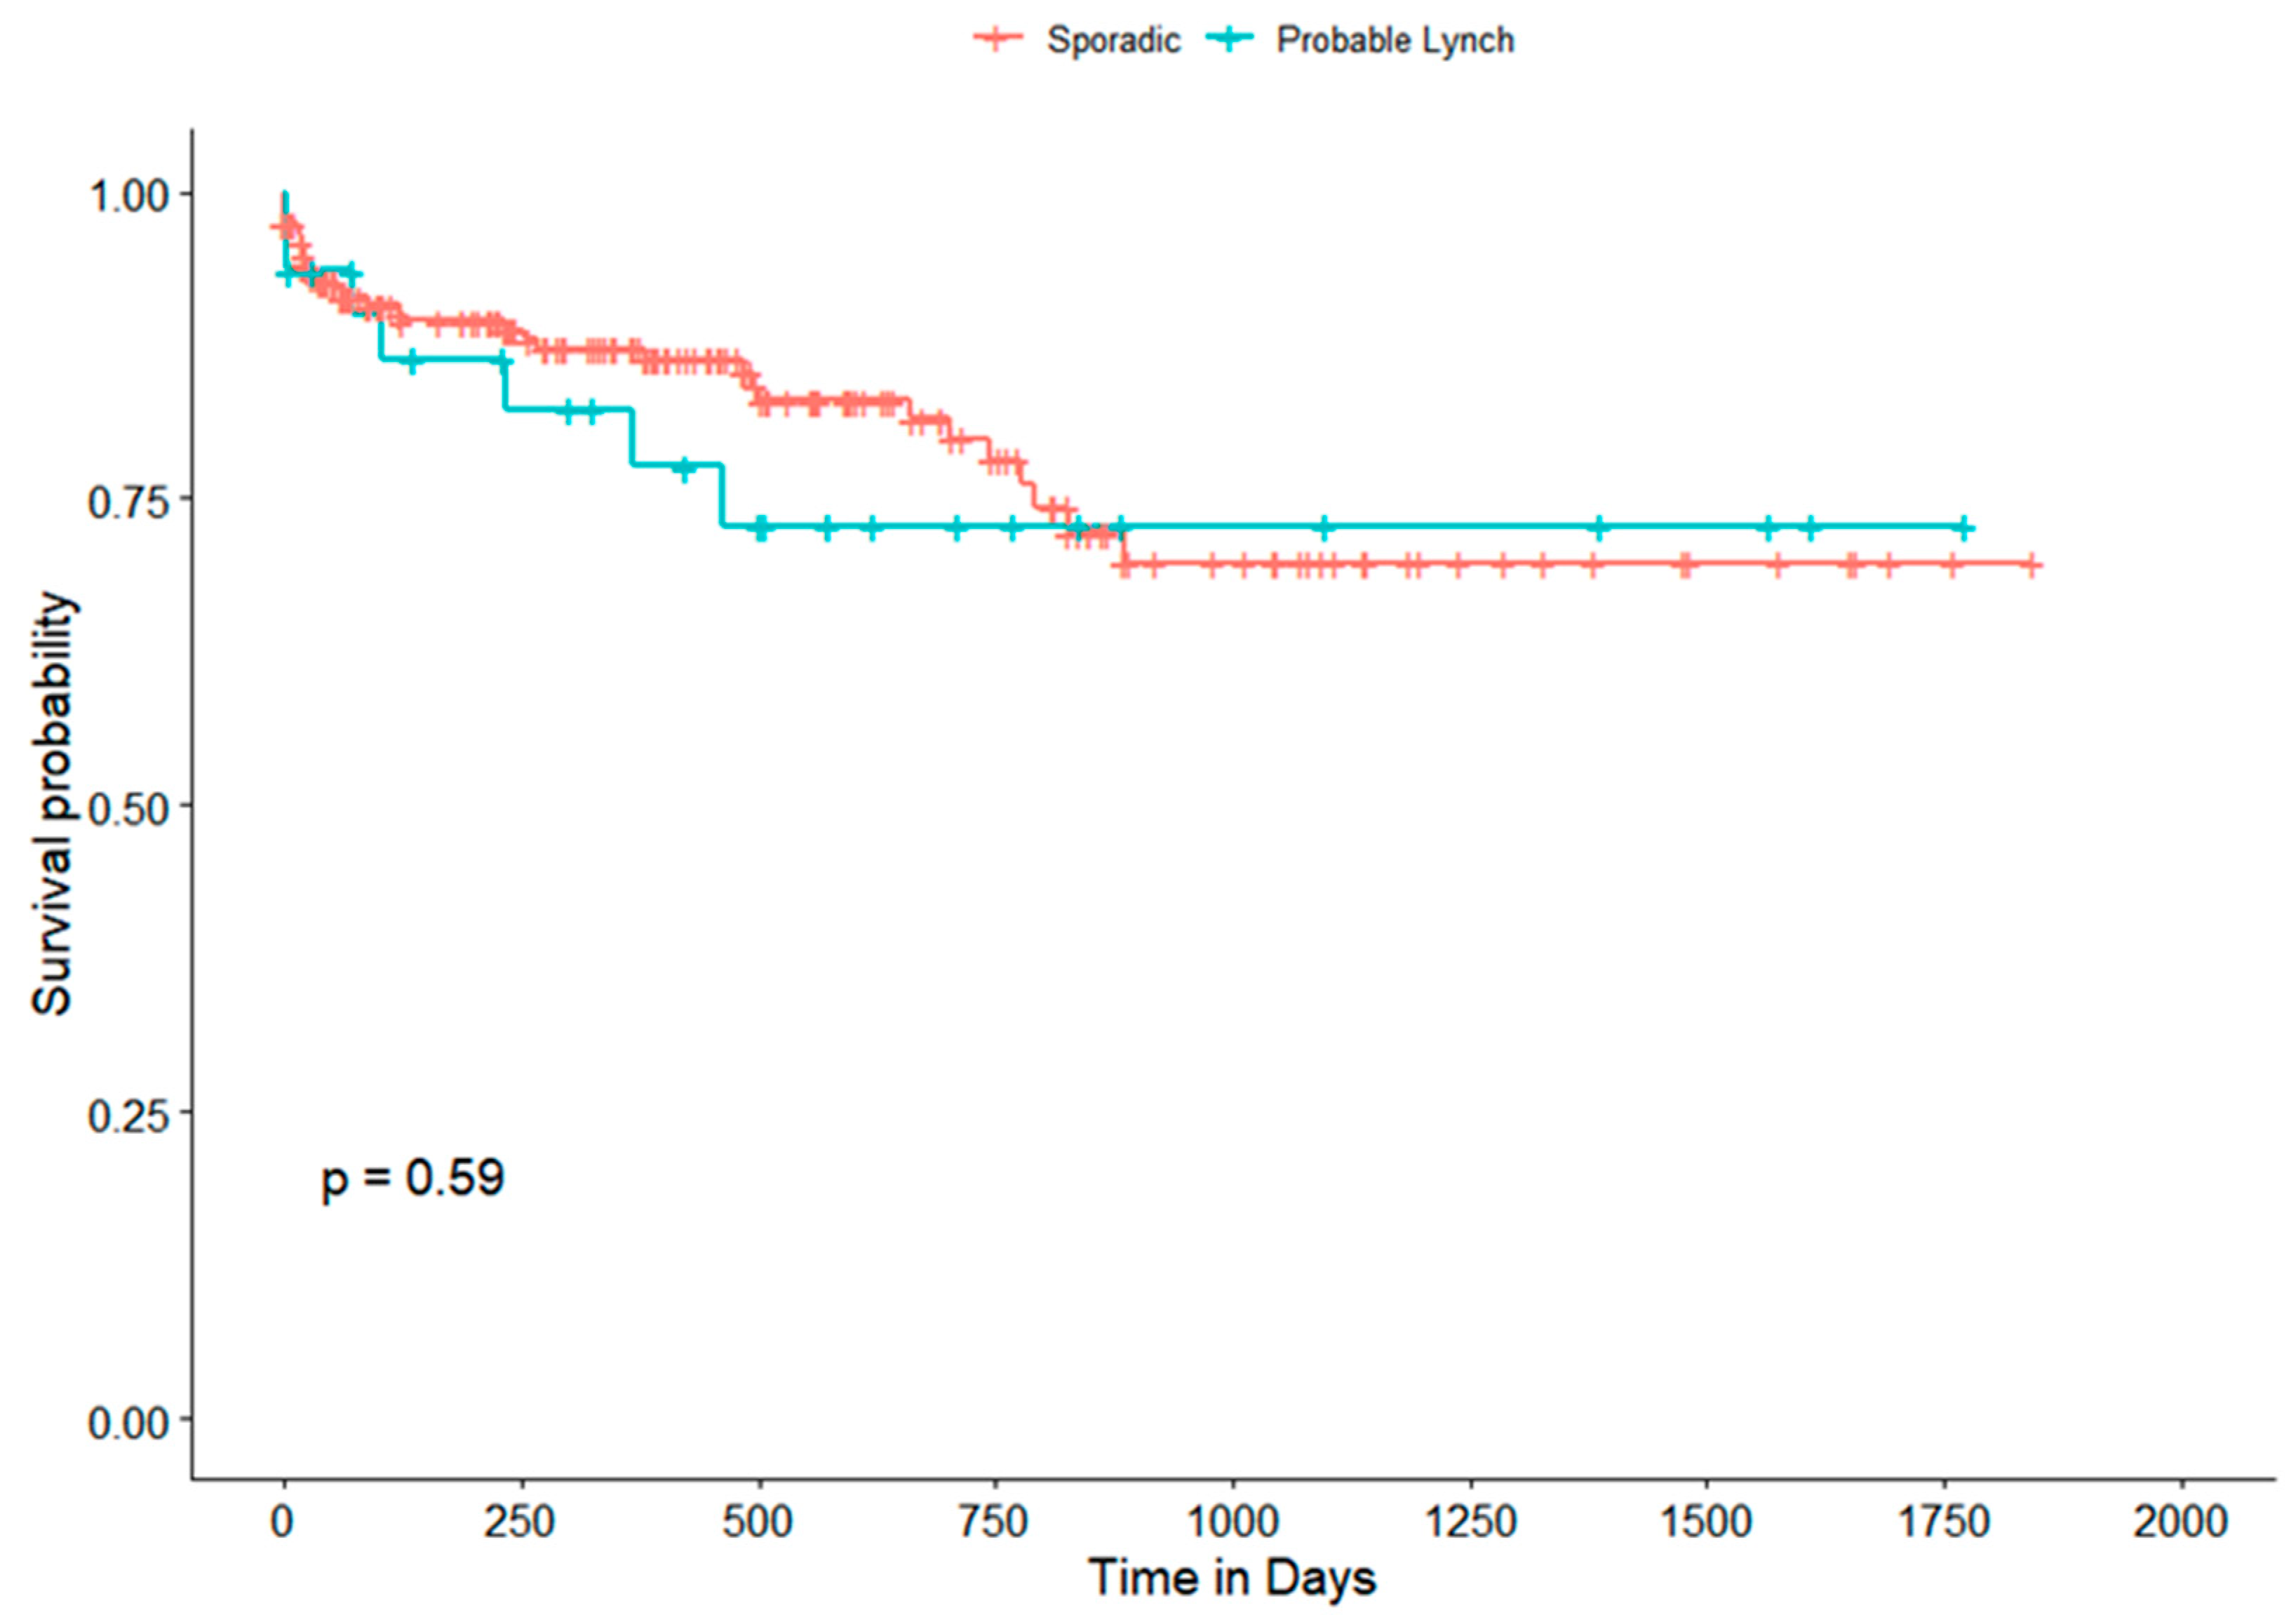
3.3. Clinicopathology-Molecular Characteristic Association and Survival
4. Discussion
5. Conclusions
Supplementary Materials
Author Contributions
Funding
Institutional Review Board Statement
Informed Consent Statement
Acknowledgments
Conflicts of Interest
References
- Bray, F.; Ferlay, J.; Soerjomataram, I.; Siegel, R.L.; Torre, L.A.; Jemal, A. Global cancer statistics 2018: GLOBOCAN estimates of incidence and mortality worldwide for 36 cancers in 185 countries. CA Cancer J. Clin. 2018, 68, 394–424. [Google Scholar] [CrossRef]
- Ferlay, J.; Ervik, M.; Lam, F.; Colombet, M.; Mery, L.; Piñeros, M.; Znaor, A.; Soerjomataram, I.; Bray, F. Global Cancer Observatory: Cancer Today; International Agency for Research on Cancer: Lyon, France, 2020.
- Sung, H.; Ferlay, J.; Siegel, R.L.; Laversanne, M.; Soerjomataram, I.; Jemal, A.; Bray, F. Global Cancer Statistics 2020: GLOBOCAN Estimates of Incidence and Mortality Worldwide for 36 Cancers in 185 Countries. CA Cancer J. Clin. 2021, 71, 209–249. [Google Scholar] [CrossRef]
- You, Y.N.; Xing, Y.; Feig, B.W.; Chang, G.J.; Cormier, J.N. Young-Onset Colorectal Cancer: Is It Time to Pay Attention? Arch. Intern. Med. 2012, 172, 287–289. [Google Scholar] [CrossRef] [PubMed]
- Murphy, C.C.; Lund, J.L.; Sandler, R.S. Young-Onset Colorectal Cancer: Earlier Diagnoses or Increasing Disease Burden? Gastroenterology 2017, 152, 1809–1812.e3. [Google Scholar] [CrossRef]
- Siegel, R.L.; Torre, L.A.; Soerjomataram, I.; Hayes, R.B.; Bray, F.; Weber, T.K.; Jemal, A. Global patterns and trends in colorectal cancer incidence in young adults. Gut 2019, 68, 2179–2185. [Google Scholar] [CrossRef] [PubMed]
- O’Connell, J.B.; Maggard, M.A.; Livingston, E.H.; Yo, C.K. Colorectal cancer in the young. Am. J. Surg. 2004, 187, 343–348. [Google Scholar] [CrossRef] [PubMed]
- Limburg, P.J.; Harmsen, W.S.; Chen, H.H.; Gallinger, S.; Haile, R.W.; Baron, J.A.; Casey, G.; Woods, M.O.; Thibodeau, S.N.; Lindor, N.M. Prevalence of Alterations in DNA Mismatch Repair Genes in Patients With Young-Onset Colorectal Cancer. Clin. Gastroenterol. Hepatol. 2011, 9, 497–502. [Google Scholar] [CrossRef] [PubMed]
- Stoffel, E.M.; Koeppe, E.; Everett, J.; Ulintz, P.; Kiel, M.; Osborne, J.; Williams, L.; Hanson, K.; Gruber, S.B.; Rozek, L.S. Germline Genetic Features of Young Individuals with Colorectal Cancer. Gastroenterology 2018, 154, 897–905.e1. [Google Scholar] [CrossRef] [PubMed]
- Anthonysamy, M.A.; Maker, L.P.; Lin, I.; Gotra, I.M.; Saputra, H. Prevalence of colorectal carcinoma based on microscopic type, sex, age and anatomical location in Sanglah General Hospital. Intisari Sains Medis 2020, 11, 272–276. [Google Scholar] [CrossRef]
- Sudoyo, A.W.; Hernowo, B.; Krisnuhoni, E.; Reksodiputro, A.H.; Hardjodisastro, D. Colorectal cancer among young native Indonesians: A clinicopathological and molecular assessment on microsatellite instability. Med. J. Indones. 2010, 19, 245–251. [Google Scholar] [CrossRef][Green Version]
- Vuik, F.E.; Nieuwenburg, S.A.; Bardou, M.; Lansdorp-Vogelaar, I.; Dinis-Ribeiro, M.; Bento, M.J.; Zadnik, V.; Pellisé, M.; Esteban, L.; Kaminski, M.F.; et al. Increasing incidence of colorectal cancer in young adults in Europe over the last 25 years. Gut 2019, 68, 1820–1826. [Google Scholar] [CrossRef] [PubMed]
- Siegel, R.L.; Jakubowski, C.D.; Fedewa, S.A.; Davis, A.; Azad, N.S. Colorectal Cancer in the Young: Epidemiology, Prevention, Management. Am. Soc. Clin. Oncol. Educ. B 2020, 40, e75–e88. [Google Scholar] [CrossRef]
- Wei, J.; Ge, X.; Tang, Y.; Qian, Y.; Lu, W.; Jiang, K.; Fang, Y.; Hwang, M.; Fu, D.; Xiao, Q.; et al. An Autophagy-Related Long Noncoding RNA Signature Contributes to Poor Prognosis in Colorectal Cancer. J. Oncol. 2020, 2020, 4728947. [Google Scholar] [CrossRef] [PubMed]
- Lynch, H.T.; de la Chapelle, A. Genetic susceptibility to non-polyposis colorectal cancer. J. Med. Genet. 1999, 36, 801–818. [Google Scholar]
- Marzouk, O.; Schofield, J. Review of histopathological and molecular prognostic features in colorectal cancer. Cancers 2011, 3, 2767–2810. [Google Scholar] [CrossRef]
- Boland, C.R.; Goel, A. Microsatellite instability in colorectal cancer. Gastroenterology 2010, 138, 2073–2087.e3. [Google Scholar] [CrossRef]
- Peltomäki, P. Role of DNA Mismatch Repair Defects in the Pathogenesis of Human Cancer. J. Clin. Oncol. 2003, 21, 1174–1179. [Google Scholar] [CrossRef]
- Veigl, M.L.; Kasturi, L.; Olechnowicz, J.; Ma, A.; Lutterbaugh, J.D.; Periyasamy, S.; Li, G.-M.; Drummond, J.; Modrich, P.L.; Sedwick, W.D.; et al. Biallelic inactivation of hMLH1 by epigenetic gene silencing, a novel mechanism causing human MSI cancers. Proc. Natl. Acad. Sci. USA 1998, 95, 8698–8702. [Google Scholar] [CrossRef] [PubMed]
- Herman, J.G.; Umar, A.; Polyak, K.; Graff, J.R.; Ahuja, N.; Issa, J.P.; Markowitz, S.; Willson, J.K.; Hamilton, S.R.; Kinzler, K.W.; et al. Incidence and functional consequences of hMLH1 promoter hypermethylation in colorectal carcinoma. Proc. Natl. Acad. Sci. USA 1998, 95, 6870–6875. [Google Scholar] [CrossRef]
- Cunningham, J.M.; Christensen, E.R.; Tester, D.J.; Kim, C.-Y.; Roche, P.C.; Burgart, L.J.; Thibodeau, S.N. Hypermethylation of the hMLH1 Promoter in Colon Cancer with Microsatellite Instability. Cancer Res. 1998, 58, 3455 LP–3460. [Google Scholar] [PubMed]
- Deng, G.; Bell, I.; Crawley, S.; Gum, J.; Terdiman, J.P.; Allen, B.A.; Truta, B.; Sleisenger, M.H.; Kim, Y.S. BRAF Mutation Is Frequently Present in Sporadic Colorectal Cancer with Methylated hMLH1, But Not in Hereditary Nonpolyposis Colorectal Cancer. Clin. Cancer Res. 2004, 10, 191 LP–195. [Google Scholar] [CrossRef] [PubMed]
- Bouzourene, H.; Hutter, P.; Losi, L.; Martin, P.; Benhattar, J. Selection of patients with germline MLH1 mutated Lynch syndrome by determination of MLH1 methylation and BRAF mutation. Fam. Cancer 2010, 9, 167–172. [Google Scholar] [CrossRef] [PubMed]
- Thiel, A.; Heinonen, M.; Kantonen, J.; Gylling, A.; Lahtinen, L.; Korhonen, M.; Kytölä, S.; Mecklin, J.-P.; Orpana, A.; Peltomäki, P.; et al. BRAF mutation in sporadic colorectal cancer and Lynch syndrome. Virchows Arch. 2013, 463, 613–621. [Google Scholar] [CrossRef]
- National Comprehensive Cancer Network. Genetic/Familial High-Risk Assessment: Colorectal (Version 3.2017). 2017. Available online: https://www.nccn.org/professionals/physician_gls/pdf/genetics_colon.pdf (accessed on 20 June 2021).
- National Institute of Clinical and Healthcare Excellence. Molecular Testing Strategies for Lynch Syndrome in People with Colorectal Cancer (NICE Diagnostics Guidance No. DG27). 2017. Available online: https://www.nice.org.uk/guidance/dg27 (accessed on 20 June 2021).
- Leenen, C.H.M.; Goverde, A.; de Bekker-Grob, E.W.; Wagner, A.; van Lier, M.G.F.; Spaander, M.C.W.; Bruno, M.J.; Tops, C.M.; van den Ouweland, A.M.W.; Dubbink, H.J.; et al. Cost-effectiveness of routine screening for Lynch syndrome in colorectal cancer patients up to 70 years of age. Genet. Med. 2016, 18, 966–973. [Google Scholar] [CrossRef] [PubMed]
- Kang, Y.-J.; Killen, J.; Caruana, M.; Simms, K.; Taylor, N.; Frayling, I.M.; Snowsill, T.; Huxley, N.; Coupe, V.M.H.; Hughes, S.; et al. The predicted impact and cost-effectiveness of systematic testing of people with incident colorectal cancer for Lynch syndrome. Med. J. Aust. 2020, 212, 72–81. [Google Scholar] [CrossRef]
- Susanti, S.; Fadhil, W.; Ebili, H.O.; Asiri, A.; Nestarenkaite, A.; Hadjimichael, E.; Ham-Karim, H.A.; Field, J.; Stafford, K.; Matharoo-Ball, B.; et al. N-LyST: A simple and rapid screening test for Lynch syndrome. J. Clin. Pathol. 2018, 71, 713–720. [Google Scholar] [CrossRef] [PubMed]
- Hutajulu, S.H.; Putra, Y.R.; Susanti, S.; Heriyanto, D.S.; Yoshuantari, N.; Handaya, A.Y.; Utomo, B.P.; Dwidanarti, S.R.; Gusnanto, A.; Kurnianda, J.; et al. Early-onset versus late-onset colorectal cancer in Indonesia: A tertiary care center assessment. Manuscr. Submitt. Publ. 2021. in review. [Google Scholar]
- Vilar, E.; Gruber, S.B. Microsatellite instability in colorectal cancer-the stable evidence. Nat. Rev. Clin. Oncol. 2010, 7, 153–162. [Google Scholar] [CrossRef] [PubMed]
- Ashktorab, H.; Ahuja, S.; Kannan, L.; Llor, X.; Ellis, N.A.; Xicola, R.M.; Laiyemo, A.O.; Carethers, J.M.; Brim, H.; Nouraie, M. A meta-analysis of MSI frequency and race in colorectal cancer. Oncotarget 2016, 7, 34546–34557. [Google Scholar] [CrossRef]
- Seppälä, T.T.; Böhm, J.P.; Friman, M.; Lahtinen, L.; Väyrynen, V.M.J.; Liipo, T.K.E.; Ristimäki, A.P.; Kairaluoma, M.V.J.; Kellokumpu, I.H.; Kuopio, T.H.I.; et al. Combination of microsatellite instability and BRAF mutation status for subtyping colorectal cancer. Br. J. Cancer 2015, 112, 1966–1975. [Google Scholar] [CrossRef] [PubMed]
- Seligmann, J.F.; Fisher, D.; Smith, C.G.; Richman, S.D.; Elliott, F.; Brown, S.; Adams, R.; Maughan, T.; Quirke, P.; Cheadle, J.; et al. Investigating the poor outcomes of BRAF-mutant advanced colorectal cancer: Analysis from 2530 patients in randomised clinical trials. Ann. Oncol. 2017, 28, 562–568. [Google Scholar] [CrossRef] [PubMed]
- Chiu, V.K.; Osman, D.; Belmonte, J.; Routh, J.K.; Soares, H.P.; Martin, D.R.; Hanson, J.A.; Gallupalli, R.R.; Kinney, A.; Vasef, M.; et al. Actionable genomic biomarkers in a low socioeconomic status (SES) population with gastrointestinal (GI) cancers. J. Clin. Oncol. 2018, 36, e24310. [Google Scholar] [CrossRef]
- Zhang, X.; Wu, J.; Wang, L.; Zhao, H.; Li, H.; Duan, Y.; Li, Y.; Xu, P.; Ran, W.; Xing, X. HER2 and BRAF mutation in colorectal cancer patients: A retrospective study in Eastern China. PeerJ 2020, 8, e8602. [Google Scholar] [CrossRef] [PubMed]
- Yang, Y.; Wang, D.; Jin, L.; Wu, G.; Bai, Z.; Wang, J.; Yao, H.; Zhang, Z. Prognostic value of the combination of microsatellite instability and BRAF mutation in colorectal cancer. Cancer Manag. Res. 2018, 10, 3911–3929. [Google Scholar] [CrossRef]
- Roth, A.D.; Tejpar, S.; Delorenzi, M.; Yan, P.; Fiocca, R.; Klingbiel, D.; Dietrich, D.; Biesmans, B.; Bodoky, G.; Barone, C.; et al. Prognostic Role of KRAS and BRAF in Stage II and III Resected Colon Cancer: Results of the Translational Study on the PETACC-3, EORTC 40993, SAKK 60-00 Trial. J. Clin. Oncol. 2009, 28, 466–474. [Google Scholar] [CrossRef] [PubMed]
- Lochhead, P.; Kuchiba, A.; Imamura, Y.; Liao, X.; Yamauchi, M.; Nishihara, R.; Qian, Z.R.; Morikawa, T.; Shen, J.; Meyerhardt, J.A.; et al. Microsatellite instability and BRAF mutation testing in colorectal cancer prognostication. J. Natl. Cancer Inst. 2013, 105, 1151–1156. [Google Scholar] [CrossRef]
- Fanelli, G.N.; Dal Pozzo, C.A.; Depetris, I.; Schirripa, M.; Brignola, S.; Biason, P.; Balistreri, M.; Dal Santo, L.; Lonardi, S.; Munari, G.; et al. The heterogeneous clinical and pathological landscapes of metastatic Braf-mutated colorectal cancer. Cancer Cell Int. 2020, 20, 30. [Google Scholar] [CrossRef] [PubMed]
- Rozek, L.S.; Herron, C.M.; Greenson, J.K.; Moreno, V.; Capella, G.; Rennert, G.; Gruber, S.B. Smoking, Gender, and Ethnicity Predict Somatic BRAF Mutations in Colorectal Cancer. Cancer Epidemiol. Biomarkers Prev. 2010, 19, 838–843. [Google Scholar] [CrossRef] [PubMed]
- Hanna, M.C.; Go, C.; Roden, C.; Jones, R.T.; Pochanard, P.; Javed, A.Y.; Javed, A.; Mondal, C.; Palescandolo, E.; Van Hummelen, P.; et al. Colorectal Cancers from Distinct Ancestral Populations Show Variations in BRAF Mutation Frequency. PLoS ONE 2013, 8, e74950. [Google Scholar]
- Yanus, G.A.; Belyaeva, A.V.; Ivantsov, A.O.; Kuligina, E.S.; Suspitsin, E.N.; Mitiushkina, N.V.; Aleksakhina, S.N.; Iyevleva, A.G.; Zaitseva, O.A.; Yatsuk, O.S.; et al. Pattern of clinically relevant mutations in consecutive series of Russian colorectal cancer patients. Med. Oncol. 2013, 30, 686. [Google Scholar] [CrossRef] [PubMed]
- Qiu, T.; Lu, H.; Guo, L.; Huang, W.; Ling, Y.; Shan, L.; Li, W.; Ying, J.; Lv, N. Detection of BRAF mutation in Chinese tumor patients using a highly sensitive antibody immunohistochemistry assay. Sci. Rep. 2015, 5, 9211. [Google Scholar] [CrossRef]
- Ye, J.-X. KRAS and BRAF gene mutations and DNA mismatch repair status in Chinese colorectal carcinoma patients. World J. Gastroenterol. 2015, 21, 1595. [Google Scholar] [CrossRef]
- Natsume, S.; Yamaguchi, T.; Takao, M.; Iijima, T.; Wakaume, R.; Takahashi, K.; Matsumoto, H.; Nakano, D.; Horiguchi, S.-I.; Koizumi, K.; et al. Clinicopathological and molecular differences between right-sided and left-sided colorectal cancer in Japanese patients. Jpn. J. Clin. Oncol. 2018, 48, 609–618. [Google Scholar] [CrossRef] [PubMed]
- Wang, W.; Ying, J.; Shi, S.; Ye, Q.; Zou, S.; Dong, L.; Lyu, N. A modified screening strategy for Lynch syndrome among MLH1-deficient CRCs: Analysis from consecutive Chinese patients in a single center. Transl. Oncol. 2021, 14, 101049. [Google Scholar] [CrossRef] [PubMed]
- Gay, L.J.; Arends, M.J.; Mitrou, P.N.; Bowman, R.; Ibrahim, A.E.; Happerfield, L.; Luben, R.; McTaggart, A.; Ball, R.Y.; Rodwell, S.A. MLH1 Promoter Methylation, Diet, and Lifestyle Factors in Mismatch Repair Deficient Colorectal Cancer Patients From EPIC-Norfolk. Nutr. Cancer 2011, 63, 1000–1010. [Google Scholar] [CrossRef] [PubMed]
- Li, X.; Yao, X.; Wang, Y.; Hu, F.; Wang, F.; Jiang, L.; Liu, Y.; Wang, D.; Sun, G.; Zhao, Y. MLH1 Promoter Methylation Frequency in Colorectal Cancer Patients and Related Clinicopathological and Molecular Features. PLoS ONE 2013, 8, e59064. [Google Scholar] [CrossRef]
- Ogino, S.; Nosho, K.; Kirkner, G.J.; Kawasaki, T.; Meyerhardt, J.A.; Loda, M.; Giovannucci, E.L.; Fuchs, C.S. CpG island methylator phenotype, microsatellite instability, BRAF mutation and clinical outcome in colon cancer. Gut 2009, 58, 90–96. [Google Scholar] [CrossRef]
- Haraldsdottir, S.; Hampel, H.; Wu, C.; Weng, D.Y.; Shields, P.G.; Frankel, W.L.; Pan, X.; de la Chapelle, A.; Goldberg, R.M.; Bekaii-Saab, T. Patients with colorectal cancer associated with Lynch syndrome and MLH1 promoter hypermethylation have similar prognoses. Genet. Med. 2016, 18, 863–868. [Google Scholar] [CrossRef]
- Crucianelli, F.; Tricarico, R.; Turchetti, D.; Gorelli, G.; Gensini, F.; Sestini, R.; Giunti, L.; Pedroni, M.; Ponz de Leon, M.; Civitelli, S.; et al. MLH1 constitutional and somatic methylation in patients with MLH1 negative tumors fulfilling the revised Bethesda criteria. Epigenetics 2014, 9, 1431–1438. [Google Scholar] [CrossRef]
- de la Chapelle, A. The Incidence of Lynch Syndrome. Fam. Cancer 2005, 4, 233–237. [Google Scholar] [CrossRef]
- Hampel, H.; Frankel, W.L.; Martin, E.; Arnold, M.; Khanduja, K.; Kuebler, P.; Nakagawa, H.; Sotamaa, K.; Prior, T.W.; Westman, J.; et al. Screening for the Lynch Syndrome (Hereditary Nonpolyposis Colorectal Cancer). N. Engl. J. Med. 2005, 352, 1851–1860. [Google Scholar] [CrossRef] [PubMed]
- Moreira, L.; Balaguer, F.; Lindor, N.; de la Chapelle, A.; Hampel, H.; Aaltonen, L.A.; Hopper, J.L.; Le Marchand, L.; Gallinger, S.; Newcomb, P.A.; et al. Identification of Lynch syndrome among patients with colorectal cancer. JAMA 2012, 308, 1555–1565. [Google Scholar] [CrossRef]
- Parsons, M.T.; Buchanan, D.D.; Thompson, B.; Young, J.P.; Spurdle, A.B. Correlation of tumour BRAF mutations and MLH1 methylation with germline mismatch repair (MMR) gene mutation status: A literature review assessing utility of tumour features for MMR variant classification. J. Med. Genet. 2012, 49, 151–157. [Google Scholar] [CrossRef]
- Lee, J.; Xiao, Y.-Y.; Sun, Y.Y.; Balderacchi, J.; Clark, B.; Desani, J.; Kumar, V.; Saverimuthu, A.; Win, K.T.; Huang, Y.; et al. Prevalence and characteristics of hereditary non-polyposis colorectal cancer (HNPCC) syndrome in immigrant Asian colorectal cancer patients. BMC Cancer 2017, 17, 843. [Google Scholar] [CrossRef] [PubMed]
- Chang, D.T.; Pai, R.K.; Rybicki, L.A.; Dimaio, M.A.; Limaye, M.; Jayachandran, P.; Koong, A.C.; Kunz, P.A.; Fisher, G.A.; Ford, J.M.; et al. Clinicopathologic and molecular features of sporadic early-onset colorectal adenocarcinoma: An adenocarcinoma with frequent signet ring cell differentiation, rectal and sigmoid involvement, and adverse morphologic features. Mod. Pathol. 2012, 25, 1128–1139. [Google Scholar] [CrossRef] [PubMed]
- Cercek, A.; Chatila, W.K.; Yaeger, R.; Walch, H.; Fernandes, G.D.S.; Krishnan, A.; Palmaira, L.; Maio, A.; Kemel, Y.; Srinivasan, P.; et al. A Comprehensive Comparison of Early-Onset and Average-Onset Colorectal Cancers. JNCI J. Natl. Cancer Inst. 2021, 113, 1683–1692. [Google Scholar] [CrossRef] [PubMed]
- Mork, M.E.; You, Y.N.; Ying, J.; Bannon, S.A.; Lynch, P.M.; Rodriguez-Bigas, M.A.; Vilar, E. High Prevalence of Hereditary Cancer Syndromes in Adolescents and Young Adults With Colorectal Cancer. J. Clin. Oncol. 2015, 33, 3544–3549. [Google Scholar] [CrossRef] [PubMed]
- Abdelsattar, Z.M.; Wong, S.L.; Regenbogen, S.E.; Jomaa, D.M.; Hardiman, K.M.; Hendren, S. Colorectal cancer outcomes and treatment patterns in patients too young for average-risk screening. Cancer 2016, 122, 929–934. [Google Scholar] [CrossRef]
- Yeo, H.; Betel, D.; Abelson, J.S.; Zheng, X.E.; Yantiss, R.; Shah, M.A. Early-onset Colorectal Cancer is Distinct From Traditional Colorectal Cancer. Clin. Colorectal Cancer 2017, 16, 293–299.e6. [Google Scholar] [CrossRef] [PubMed]
- Qiu, Y.; Cai, G.; Su, M.; Chen, T.; Liu, Y.; Xu, Y.; Ni, Y.; Zhao, A.; Cai, S.; Xu, L.X.; et al. Urinary Metabonomic Study on Colorectal Cancer. J. Proteome Res. 2010, 9, 1627–1634. [Google Scholar] [CrossRef] [PubMed]
- Stigliano, V.; Assisi, D.; Cosimelli, M.; Palmirotta, R.; Giannarelli, D.; Mottolese, M.; Mete, L.S.; Mancini, R.; Casale, V. Survival of hereditary non-polyposis colorectal cancer patients compared with sporadic colorectal cancer patients. J. Exp. Clin. Cancer Res. 2008, 27, 39. [Google Scholar] [CrossRef][Green Version]
- de Matos, M.B.; Barbosa, L.E.; Teixeira, J.P. Narrative review comparing the epidemiology, characteristics, and survival in sporadic colorectal carcinoma/Lynch syndrome. J. Coloproctol. 2020, 40, 73–78. [Google Scholar] [CrossRef]
- Xu, Y.; Feng, Q.; Chen, Y.; Mao, Y.; Zhang, Z.; Lv, Y.; Zheng, P.; Yu, S.; He, G.; Xu, J. Significance of Surgery in the Treatment of Colorectal Cancer Ovarian Metastases: A Retrospective Case Matching Study. Cancer Manag. Res. 2021, 13, 1087–1097. [Google Scholar] [CrossRef]
- Wardhani, Y.; Hutajulu, S.H.; Ferianti, V.W.; Fitriani, Z.; Taroeno-Hariadi, K.W.; Kurnianda, J. Effects of oxaliplatin-containing adjuvant chemotherapy on short-term survival of patients with colon cancer in Dr. Sardjito Hospital, Yogyakarta, Indonesia. J. Gastrointest. Oncol. 2019, 10, 226–234. [Google Scholar] [CrossRef] [PubMed]
- Burn, J.; Sheth, H.; Elliott, F.; Reed, L.; Macrae, F.; Mecklin, J.-P.; Möslein, G.; McRonald, F.E.; Bertario, L.; Evans, D.G.; et al. Cancer prevention with aspirin in hereditary colorectal cancer (Lynch syndrome), 10-year follow-up and registry-based 20-year data in the CAPP2 study: A double-blind, randomised, placebo-controlled trial. Lancet 2020, 395, 1855–1863. [Google Scholar] [CrossRef]
- Klingbiel, D.; Saridaki, Z.; Roth, A.D.; Bosman, F.T.; Delorenzi, M.; Tejpar, S. Prognosis of stage II and III colon cancer treated with adjuvant 5-fluorouracil or FOLFIRI in relation to microsatellite status: Results of the PETACC-3 trial. Ann. Oncol. 2015, 26, 126–132. [Google Scholar] [CrossRef]
- Jin, Z.; Sinicrope, F.A. Prognostic and Predictive Values of Mismatch Repair Deficiency in Non-Metastatic Colorectal Cancer. Cancers 2021, 13, 300. [Google Scholar] [CrossRef] [PubMed]
- André, T.; Shiu, K.-K.; Kim, T.W.; Jensen, B.V.; Jensen, L.H.; Punt, C.; Smith, D.; Garcia-Carbonero, R.; Benavides, M.; Gibbs, P.; et al. Pembrolizumab in Microsatellite-Instability–High Advanced Colorectal Cancer. N. Engl. J. Med. 2020, 383, 2207–2218. [Google Scholar] [CrossRef] [PubMed]


| Characteristic | n = 231 |
|---|---|
| Age | |
| <50 | 50 (21.65%) |
| ≥50 | 181 (78.35%) |
| Sex | |
| Female | 119 (51.52%) |
| Male | 112 (48.48%) |
| Tumor Site | |
| Left | 180 (77.92%) |
| Right | 50 (21.65%) |
| Unknown | 1 (0.43%) |
| Stage | |
| I | 11 (4.76%) |
| II | 66 (28.57%) |
| III | 56 (24.24%) |
| IV | 92 (39.83%) |
| Unknown | 6 (2.60%) |
| T Status | |
| 1 | 2 (0.87%) |
| 2 | 25 (10.82%) |
| 3 | 150 (64.94%) |
| 4 | 53 (22.94%) |
| x | 1 (0.43%) |
| N Status | |
| 0 | 115 (49.78%) |
| 1 | 80 (34.63%) |
| 2 | 30 (12.99%) |
| x | 6 (2.60%) |
| Metastatic Status | |
| 0 | 134 (58.01%) |
| 1 | 91 (39.39%) |
| x | 6 (2.60%) |
| Histological Grading | |
| 1 | 103 (44.59%) |
| 2 | 91 (39.39%) |
| 3 | 32 (13.85%) |
| 4 | 2 (0.87%) |
| Unknown | 3 (1.30%) |
| Lymphovascular Status | |
| 0 | 51 (22.08%) |
| 1 | 58 (25.11%) |
| Unknown | 122 (52.81%) |
| Pathological Morphology | |
| Adenocarcinoma | 226 (97.84%) |
| Mucinous Carcinoma | 5 (2.16%) |
| TILs | |
| Low | 42 (18.18%) |
| Medium | 74 (32.03%) |
| High | 76 (32.90%) |
| Unknown | 39 (16.88%) |
| Hemoglobin level (g/dL) | |
| <10 | 27 (11.69%) |
| ≥10 | 196 (84.85%) |
| Unknown | 8 (3.46%) |
| Serum albumin (g/dL) | |
| <3.5 | 98 (42.42%) |
| >3.5 | 64 (27.71%) |
| Unknown | 69 (29.87%) |
| ECOG | |
| ECOG 0–1 | 147 (63.64%) |
| ECOG 2 | 36 (15.58%) |
| ECOG 3–4 | 19 (8.23%) |
| Unknown | 29 (12.55%) |
| BMI (kg/m2) | |
| <18.5 | 71 (30.74%) |
| 18.5–22.9 | 90 (38.96%) |
| 23–24.9 | 31 (13.42%) |
| ≥25 | 30 (12.99%) |
| Unknown | 9 (3.90%) |
| MSI Status | Number of Unstable MSI Markers | |||||
|---|---|---|---|---|---|---|
| 0 | 1 | 2 | 3 | 4 | 5 | |
| MSI | (0%) | (0%) | 3 (6.82%) | 1 (2.27%) | 7 (15.91%) | 33 (75%) |
| MSS | 166 (88.77%) | 21 (11.23%) | (0%) | (0%) | (0%) | (0%) |
| Characteristic | Microsatellite Instability | ||
|---|---|---|---|
| MSI, N = 44 | MSS, N = 187 | p-Value 1 | |
| BRAF Exon 15 | 0.031 * | ||
| Mutant | 9 (20.45%) | 16 (8.56%) | |
| Wild-type | 35 (79.55%) | 171 (91.44%) | |
| MLH1 Methylation | 0.001 ** | ||
| Methylated | 5 (11.36%) | 1 (0.53%) | |
| Unmethylated | 39 (88.64%) | 186 (99.47%) | |
| BRAF Exon 15 | |||
| Mutant, N = 25 | Wild-type, N = 206 | p-Value | |
| MLH1 Methylation | 0.13 | ||
| Methylated | 2 (8.00%) | 4 (1.94%) | |
| Unmethylated | 23 (92.00%) | 202 (98.06%) | |
| Characteristic | Total | Age Group | ||
|---|---|---|---|---|
| N = 231 | <50, N = 50 1 | ≥50, N = 181 | p-Value 1 | |
| Microsatellite Instability Status | 0.040 * | |||
| MSI | 44 (19.05%) | 15 (30.00%) | 29 (16.02%) | |
| MSS | 187 (80.95%) | 35 (70.00%) | 152 (83.98%) | |
| BRAF Exon 15 | 0.6 | |||
| Mutant | 25 (10.82%) | 4 (8.00%) | 21 (11.60%) | |
| Wild-type | 206 (89.18%) | 46 (92.00%) | 160 (88.40%) | |
| MLH1 Methylation | >0.9 | |||
| Methylated | 6 (2.60%) | 1 (2.00%) | 5 (2.76%) | |
| Unmethylated | 225 (97.40%) | 49 (98.00%) | 176 (97.24%) | |
| Probable Lynch | 0.035 * | |||
| No | 199 (86.15%) | 38 (76.00%) | 161 (88.95%) | |
| Yes | 32 (13.85%) | 12 (24.00%) | 20 (11.05%) | |
| Characteristic | Microsatellite Instability Status | BRAF Exon 15 | MLH1 Promoter | Probable Lynch | ||||||||
|---|---|---|---|---|---|---|---|---|---|---|---|---|
| MSI N = 44 | MSS N = 187 | p-Value 1 | Mutant N = 25 | Wild-Type N = 206 | p-Value 1 | Methylated N = 6 | Unmethylated N = 225 | p-Value 1 | No N = 199 | Yes N = 32 | p-Value 1 | |
| Sex | 0.4 | 0.7 | 0.7 | 0.13 | ||||||||
| Female | 20 (45.45%) | 99 (52.94%) | 14 (56.00%) | 105 (50.97%) | 4 (66.67%) | 115 (51.11%) | 107 (53.77%) | 12 (37.50%) | ||||
| Male | 24 (54.55%) | 88 (47.06%) | 11 (44.00%) | 101 (49.03%) | 2 (33.33%) | 110 (48.89%) | 92 (46.23%) | 20 (62.50%) | ||||
| Tumor Site | <0.001 *** | 0.14 | 0.047 * | 0.003 ** | ||||||||
| Left | 23 (52.27%) | 157 (83.96%) | 19 (76.00%) | 161 (78.16%) | 2 (33.33%) | 178 (79.11%) | 162 (81.41%) | 18 (56.25%) | ||||
| Right | 20 (45.45%) | 30 (16.04%) | 5 (20.00%) | 45 (21.84%) | 4 (66.67%) | 46 (20.44%) | 36 (18.09%) | 14 (43.75%) | ||||
| Unknown | 1 (2.27%) | 0 (0.00%) | 1 (4.00%) | 0 (0.00%) | 0 (0.00%) | 1 (0.44%) | 1 (0.50%) | 0 (0.00%) | ||||
| Stage | 0.4 | 0.7 | 0.7 | 0.6 | ||||||||
| I | 3 (6.82%) | 8 (4.28%) | 0 (0.00%) | 11 (5.34%) | 0 (0.00%) | 11 (4.89%) | 8 (4.02%) | 3 (9.38%) | ||||
| II | 10 (22.73%) | 56 (29.95%) | 6 (24.00%) | 60 (29.13%) | 1 (16.67%) | 65 (28.89%) | 58 (29.15%) | 8 (25.00%) | ||||
| III | 14 (31.82%) | 42 (22.46%) | 6 (24.00%) | 50 (24.27%) | 3 (50.00%) | 53 (23.56%) | 48 (24.12%) | 8 (25.00%) | ||||
| IV | 15 (34.09%) | 77 (41.18%) | 12 (48.00%) | 80 (38.83%) | 2 (33.33%) | 90 (40.00%) | 80 (40.20%) | 12 (37.50%) | ||||
| Unknown | 2 (4.55%) | 4 (2.14%) | 1 (4.00%) | 5 (2.43%) | 0 (0.00%) | 6 (2.67%) | 5 (2.51%) | 1 (3.12%) | ||||
| T Status | 0.7 | >0.9 | 0.4 | 0.6 | ||||||||
| 1 | 1 (2.27%) | 1 (0.53%) | 0 (0.00%) | 2 (0.97%) | 0 (0.00%) | 2 (0.89%) | 1 (0.50%) | 1 (3.12%) | ||||
| 2 | 4 (9.09%) | 21 (11.23%) | 3 (12.00%) | 22 (10.68%) | 0 (0.00%) | 25 (11.11%) | 22 (11.06%) | 3 (9.38%) | ||||
| 3 | 30 (68.18%) | 120 (64.17%) | 16 (64.00%) | 134 (65.05%) | 6 (100.00%) | 144 (64.00%) | 130 (65.33%) | 20 (62.50%) | ||||
| 4 | 9 (20.45%) | 44 (23.53%) | 6 (24.00%) | 47 (22.82%) | 0 (0.00%) | 53 (23.56%) | 45 (22.61%) | 8 (25.00%) | ||||
| x | 0 (0.00%) | 1 (0.53%) | 0 (0.00%) | 1 (0.49%) | 0 (0.00%) | 1 (0.44%) | 1 (0.50%) | 0 (0.00%) | ||||
| N Status | 0.8 | 0.7 | 0.3 | 0.8 | ||||||||
| 0 | 21 (47.73%) | 94 (50.27%) | 11 (44.00%) | 104 (50.49%) | 1 (16.67%) | 114 (50.67%) | 97 (48.74%) | 18 (56.25%) | ||||
| 1 | 15 (34.09%) | 65 (34.76%) | 10 (40.00%) | 70 (33.98%) | 4 (66.67%) | 76 (33.78%) | 70 (35.18%) | 10 (31.25%) | ||||
| 2 | 6 (13.64%) | 24 (12.83%) | 3 (12.00%) | 27 (13.11%) | 1 (16.67%) | 29 (12.89%) | 27 (13.57%) | 3 (9.38%) | ||||
| x | 2 (4.55%) | 4 (2.14%) | 1 (4.00%) | 5 (2.43%) | 0 (0.00%) | 6 (2.67%) | 5 (2.51%) | 1 (3.12%) | ||||
| Metastatic Status | 0.4 | 0.4 | >0.9 | >0.9 | ||||||||
| 0 | 27 (61.36%) | 107 (57.22%) | 12 (48.00%) | 122 (59.22%) | 4 (66.67%) | 130 (57.78%) | 115 (57.79%) | 19 (59.38%) | ||||
| 1 | 15 (34.09%) | 76 (40.64%) | 12 (48.00%) | 79 (38.35%) | 2 (33.33%) | 89 (39.56%) | 79 (39.70%) | 12 (37.50%) | ||||
| x | 2 (4.55%) | 4 (2.14%) | 1 (4.00%) | 5 (2.43%) | 0 (0.00%) | 6 (2.67%) | 5 (2.51%) | 1 (3.12%) | ||||
| Histological Grading | 0.003 ** | 0.8 | 0.004 ** | 0.14 | ||||||||
| 1 | 12 (27.27%) | 91 (48.66%) | 10 (40.00%) | 93 (45.15%) | 2 (33.33%) | 101 (44.89%) | 94 (47.24%) | 9 (28.12%) | ||||
| 2 | 18 (40.91%) | 73 (39.04%) | 10 (40.00%) | 81 (39.32%) | 0 (0.00%) | 91 (40.44%) | 76 (38.19%) | 15 (46.88%) | ||||
| 3 | 14 (31.82%) | 18 (9.63%) | 5 (20.00%) | 27 (13.11%) | 3 (50.00%) | 29 (12.89%) | 24 (12.06%) | 8 (25.00%) | ||||
| 4 | 0 (0.00%) | 2 (1.07%) | 0 (0.00%) | 2 (0.97%) | 1 (16.67%) | 1 (0.44%) | 2 (1.01%) | 0 (0.00%) | ||||
| Unknown | 0 (0.00%) | 3 (1.60%) | 0 (0.00%) | 3 (1.46%) | 0 (0.00%) | 3 (1.33%) | 3 (1.51%) | 0 (0.00%) | ||||
| Lymphovascular Status | 0.3 | 0.8 | 0.7 | 0.3 | ||||||||
| 0 | 11 (25.00%) | 40 (21.39%) | 4 (16.00%) | 47 (22.82%) | 2 (33.33%) | 49 (21.78%) | 42 (21.11%) | 9 (28.12%) | ||||
| 1 | 14 (31.82%) | 44 (23.53%) | 6 (24.00%) | 52 (25.24%) | 1 (16.67%) | 57 (25.33%) | 48 (24.12%) | 10 (31.25%) | ||||
| Unknown | 19 (43.18%) | 103 (55.08%) | 15 (60.00%) | 107 (51.94%) | 3 (50.00%) | 119 (52.89%) | 109 (54.77%) | 13 (40.62%) | ||||
| Pathological Morphology | 0.049 * | >0.9 | >0.9 | 0.020 * | ||||||||
| Adenocarcinoma | 41 (93.18%) | 185 (98.93%) | 25 (100.00%) | 201 (97.57%) | 6 (100.00%) | 220 (97.78%) | 197 (98.99%) | 29 (90.62%) | ||||
| Mucinous Carcinoma | 3 (6.82%) | 2 (1.07%) | 0 (0.00%) | 5 (2.43%) | 0 (0.00%) | 5 (2.22%) | 2 (1.01%) | 3 (9.38%) | ||||
| TILs | 0.4 | 0.7 | 0.14 | 0.12 | ||||||||
| Low | 10 (22.73%) | 32 (17.11%) | 3 (12.00%) | 39 (18.93%) | 2 (33.33%) | 40 (17.78%) | 34 (17.09%) | 8 (25.00%) | ||||
| Medium | 15 (34.09%) | 59 (31.55%) | 7 (28.00%) | 67 (32.52%) | 0 (0.00%) | 74 (32.89%) | 61 (30.65%) | 13 (40.62%) | ||||
| High | 10 (22.73%) | 66 (35.29%) | 11 (44.00%) | 65 (31.55%) | 2 (33.33%) | 74 (32.89%) | 71 (35.68%) | 5 (15.62%) | ||||
| Unknown | 9 (20.45%) | 30 (16.04%) | 4 (16.00%) | 35 (16.99%) | 2 (33.33%) | 37 (16.44%) | 33 (16.58%) | 6 (18.75%) | ||||
| Hemoglobin level (g/dL) | 0.044 * | 0.8 | 0.12 | 0.010 ** | ||||||||
| <10 | 10 (22.73%) | 17 (9.09%) | 2 (8.00%) | 25 (12.14%) | 1 (16.67%) | 26 (11.56%) | 18 (9.05%) | 9 (28.12%) | ||||
| ≥10 | 33 (75.00%) | 163 (87.17%) | 22 (88.00%) | 174 (84.47%) | 4 (66.67%) | 192 (85.33%) | 173 (86.93%) | 23 (71.88%) | ||||
| Unknown | 1 (2.27%) | 7 (3.74%) | 1 (4.00%) | 7 (3.40%) | 1 (16.67%) | 7 (3.11%) | 8 (4.02%) | 0 (0.00%) | ||||
| Serum albumin (g/dL) | 0.4 | 0.9 | 0.3 | 0.9 | ||||||||
| <3.5 | 16 (36.36%) | 82 (43.85%) | 10 (40.00%) | 88 (42.72%) | 3 (50.00%) | 95 (42.22%) | 85 (42.71%) | 13 (40.62%) | ||||
| >3.5 | 11 (25.00%) | 53 (28.34%) | 8 (32.00%) | 56 (27.18%) | 0 (0.00%) | 64 (28.44%) | 56 (28.14%) | 8 (25.00%) | ||||
| Unknown | 17 (38.64%) | 52 (27.81%) | 7 (28.00%) | 62 (30.10%) | 3 (50.00%) | 66 (29.33%) | 58 (29.15%) | 11 (34.38%) | ||||
| ECOG | 0.043 * | 0.2 | 0.5 | 0.010 ** | ||||||||
| ECOG 0–1 | 24 (54.55%) | 123 (65.78%) | 18 (72.00%) | 129 (62.62%) | 4 (66.67%) | 143 (63.56%) | 130 (65.33%) | 17 (53.12%) | ||||
| ECOG 2 | 12 (27.27%) | 24 (12.83%) | 1 (4.00%) | 35 (16.99%) | 0 (0.00%) | 36 (16.00%) | 25 (12.56%) | 11 (34.38%) | ||||
| ECOG 3–4 | 1 (2.27%) | 18 (9.63%) | 1 (4.00%) | 18 (8.74%) | 1 (16.67%) | 18 (8.00%) | 19 (9.55%) | 0 (0.00%) | ||||
| Unknown | 7 (15.91%) | 22 (11.76%) | 5 (20.00%) | 24 (11.65%) | 1 (16.67%) | 28 (12.44%) | 25 (12.56%) | 4 (12.50%) | ||||
| BMI (kg/m2) | 0.2 | 0.4 | 0.4 | 0.2 | ||||||||
| <18.5 | 19 (43.18%) | 52 (27.81%) | 6 (24.00%) | 65 (31.55%) | 4 (66.67%) | 67 (29.78%) | 57 (28.64%) | 14 (43.75%) | ||||
| 18.5–22.9 | 16 (36.36%) | 74 (39.57%) | 14 (56.00%) | 76 (36.89%) | 1 (16.67%) | 89 (39.56%) | 79 (39.70%) | 11 (34.38%) | ||||
| 23–24.9 | 6 (13.64%) | 25 (13.37%) | 3 (12.00%) | 28 (13.59%) | 0 (0.00%) | 31 (13.78%) | 26 (13.07%) | 5 (15.62%) | ||||
| ≥25 | 2 (4.55%) | 28 (14.97%) | 1 (4.00%) | 29 (14.08%) | 1 (16.67%) | 29 (12.89%) | 29 (14.57%) | 1 (3.12%) | ||||
| Unknown | 1 (2.27%) | 8 (4.28%) | 1 (4.00%) | 8 (3.88%) | 0 (0.00%) | 9 (4.00%) | 8 (4.02%) | 1 (3.12%) | ||||
| Characteristic | Univariate | Multivariate | |||||||
|---|---|---|---|---|---|---|---|---|---|
| N | Event N | HR 1 | 95% CI 1 | p-Value | Event N | HR 1 | 95% CI 1 | p-Value | |
| Age | 227 | 40 | |||||||
| <50 | — | — | |||||||
| ≥50 | 0.85 | 0.42, 1.74 | 0.7 | ||||||
| Sex | 227 | 40 | |||||||
| Female | — | — | |||||||
| Male | 0.90 | 0.48, 1.69 | 0.7 | ||||||
| Tumor Site | 226 | 40 | |||||||
| Left | — | — | |||||||
| Right | 1.01 | 0.48, 2.12 | >0.9 | ||||||
| Stage | 223 | 40 | 30 | ||||||
| I–II | — | — | — | — | |||||
| III–IV | 2.18 | 1.03, 4.60 | 0.040 * | 1.82 | 0.58, 5.73 | 0.3 | |||
| T Status | 227 | 40 | |||||||
| 1–2 | — | — | |||||||
| 3–4 | 3.21 | 0.77, 13.3 | 0.11 | ||||||
| x | † | ||||||||
| Node Status | 227 | 40 | 30 | ||||||
| 0 | — | — | — | — | |||||
| 1 | 1.29 | 0.64, 2.61 | 0.5 | 0.79 | 0.27, 2.37 | 0.7 | |||
| 2 | 3.35 | 1.45, 7.72 | 0.005 ** | 1.97 | 0.62, 6.30 | 0.3 | |||
| x | † | ||||||||
| Metastatic Status | 227 | 40 | |||||||
| 0 | — | — | |||||||
| 1 | 1.86 | 1.00, 3.48 | 0.051 | ||||||
| x | † | ||||||||
| Histological Grading | 225 | 38 | 30 | ||||||
| 1–2 | — | — | — | — | |||||
| 3–4 | 2.23 | 1.05, 4.71 | 0.036 * | 1.27 | 0.51, 3.16 | 0.6 | |||
| Lymphovascular Status | 109 | 22 | |||||||
| 0 | — | — | |||||||
| 1 | 0.70 | 0.30, 1.65 | 0.4 | ||||||
| Pathological Morphology | 227 | 40 | |||||||
| Adenocarcinoma | — | — | |||||||
| Mucinous Carcinoma | 1.66 | 0.23, 12.1 | 0.6 | ||||||
| TILs | 189 | 33 | |||||||
| High | — | — | |||||||
| Medium | 0.85 | 0.38, 1.93 | 0.7 | ||||||
| Low | 2.29 | 0.95, 5.51 | 0.065 | ||||||
| Hemoglobin level (g/dL) | 220 | 40 | |||||||
| <10 | — | — | |||||||
| ≥10 | 0.62 | 0.22, 1.79 | 0.4 | ||||||
| Serum albumin (g/dL) | 160 | 35 | |||||||
| <3.5 | — | — | |||||||
| >3.5 | 0.62 | 0.31, 1.25 | 0.2 | ||||||
| ECOG | 198 | 32 | 30 | ||||||
| ECOG 0–1 | — | — | — | — | |||||
| ECOG 2 | 2.18 | 0.90, 5.27 | 0.083 | 1.70 | 0.64, 4.50 | 0.3 | |||
| ECOG 3–4 | 4.60 | 1.98, 10.7 | <0.001 *** | 4.38 | 1.72, 11.2 | 0.002 ** | |||
| BMI (kg/m2) | 219 | 38 | |||||||
| <18.5 | — | — | |||||||
| 18.5–22.9 | 0.87 | 0.41, 1.84 | 0.7 | ||||||
| 23–24.9 | 0.81 | 0.28, 2.29 | 0.7 | ||||||
| ≥25 | 0.73 | 0.26, 2.07 | 0.6 | ||||||
| Microsatellite Instability Status | 227 | 40 | |||||||
| MSI | — | — | |||||||
| MSS | 0.82 | 0.39, 1.73 | 0.6 | ||||||
| BRAF Exon 15 | 227 | 40 | |||||||
| Mutant | — | — | |||||||
| Wild-type | 0.89 | 0.35, 2.28 | 0.8 | ||||||
| MLH1 Methylation | 227 | 40 | |||||||
| Methylated | — | — | |||||||
| Unmethylated | 0.96 | 0.13, 6.96 | >0.9 | ||||||
| Probable Lynch | 227 | 40 | |||||||
| No | — | — | |||||||
| Yes | 1.25 | 0.55, 2.83 | 0.6 | ||||||
Publisher’s Note: MDPI stays neutral with regard to jurisdictional claims in published maps and institutional affiliations. |
© 2021 by the authors. Licensee MDPI, Basel, Switzerland. This article is an open access article distributed under the terms and conditions of the Creative Commons Attribution (CC BY) license (https://creativecommons.org/licenses/by/4.0/).
Share and Cite
Susanti, S.; Wibowo, S.; Akbariani, G.; Yoshuantari, N.; Heriyanto, D.S.; Ridwanuloh, A.M.; Hariyatun, H.; Handaya, A.Y.; Kurnianda, J.; Hutajulu, S.H.; et al. Molecular Analysis of Colorectal Cancers Suggests a High Frequency of Lynch Syndrome in Indonesia. Cancers 2021, 13, 6245. https://doi.org/10.3390/cancers13246245
Susanti S, Wibowo S, Akbariani G, Yoshuantari N, Heriyanto DS, Ridwanuloh AM, Hariyatun H, Handaya AY, Kurnianda J, Hutajulu SH, et al. Molecular Analysis of Colorectal Cancers Suggests a High Frequency of Lynch Syndrome in Indonesia. Cancers. 2021; 13(24):6245. https://doi.org/10.3390/cancers13246245
Chicago/Turabian StyleSusanti, Susanti, Satrio Wibowo, Gilang Akbariani, Naomi Yoshuantari, Didik Setyo Heriyanto, Asep Muhamad Ridwanuloh, Hariyatun Hariyatun, Adeodatus Yuda Handaya, Johan Kurnianda, Susanna Hilda Hutajulu, and et al. 2021. "Molecular Analysis of Colorectal Cancers Suggests a High Frequency of Lynch Syndrome in Indonesia" Cancers 13, no. 24: 6245. https://doi.org/10.3390/cancers13246245
APA StyleSusanti, S., Wibowo, S., Akbariani, G., Yoshuantari, N., Heriyanto, D. S., Ridwanuloh, A. M., Hariyatun, H., Handaya, A. Y., Kurnianda, J., Hutajulu, S. H., & Ilyas, M. (2021). Molecular Analysis of Colorectal Cancers Suggests a High Frequency of Lynch Syndrome in Indonesia. Cancers, 13(24), 6245. https://doi.org/10.3390/cancers13246245