
Single Snapshot Imaging of Optical Properties (SSOP) for Perfusion Assessment during Gastric Conduit Creation for Esophagectomy: An Experimental Study on Pigs

 ,
,  , , ,
, , ,  ,
, 
Abstract
:Simple Summary
Abstract
1. Introduction
2. Materials and Methods
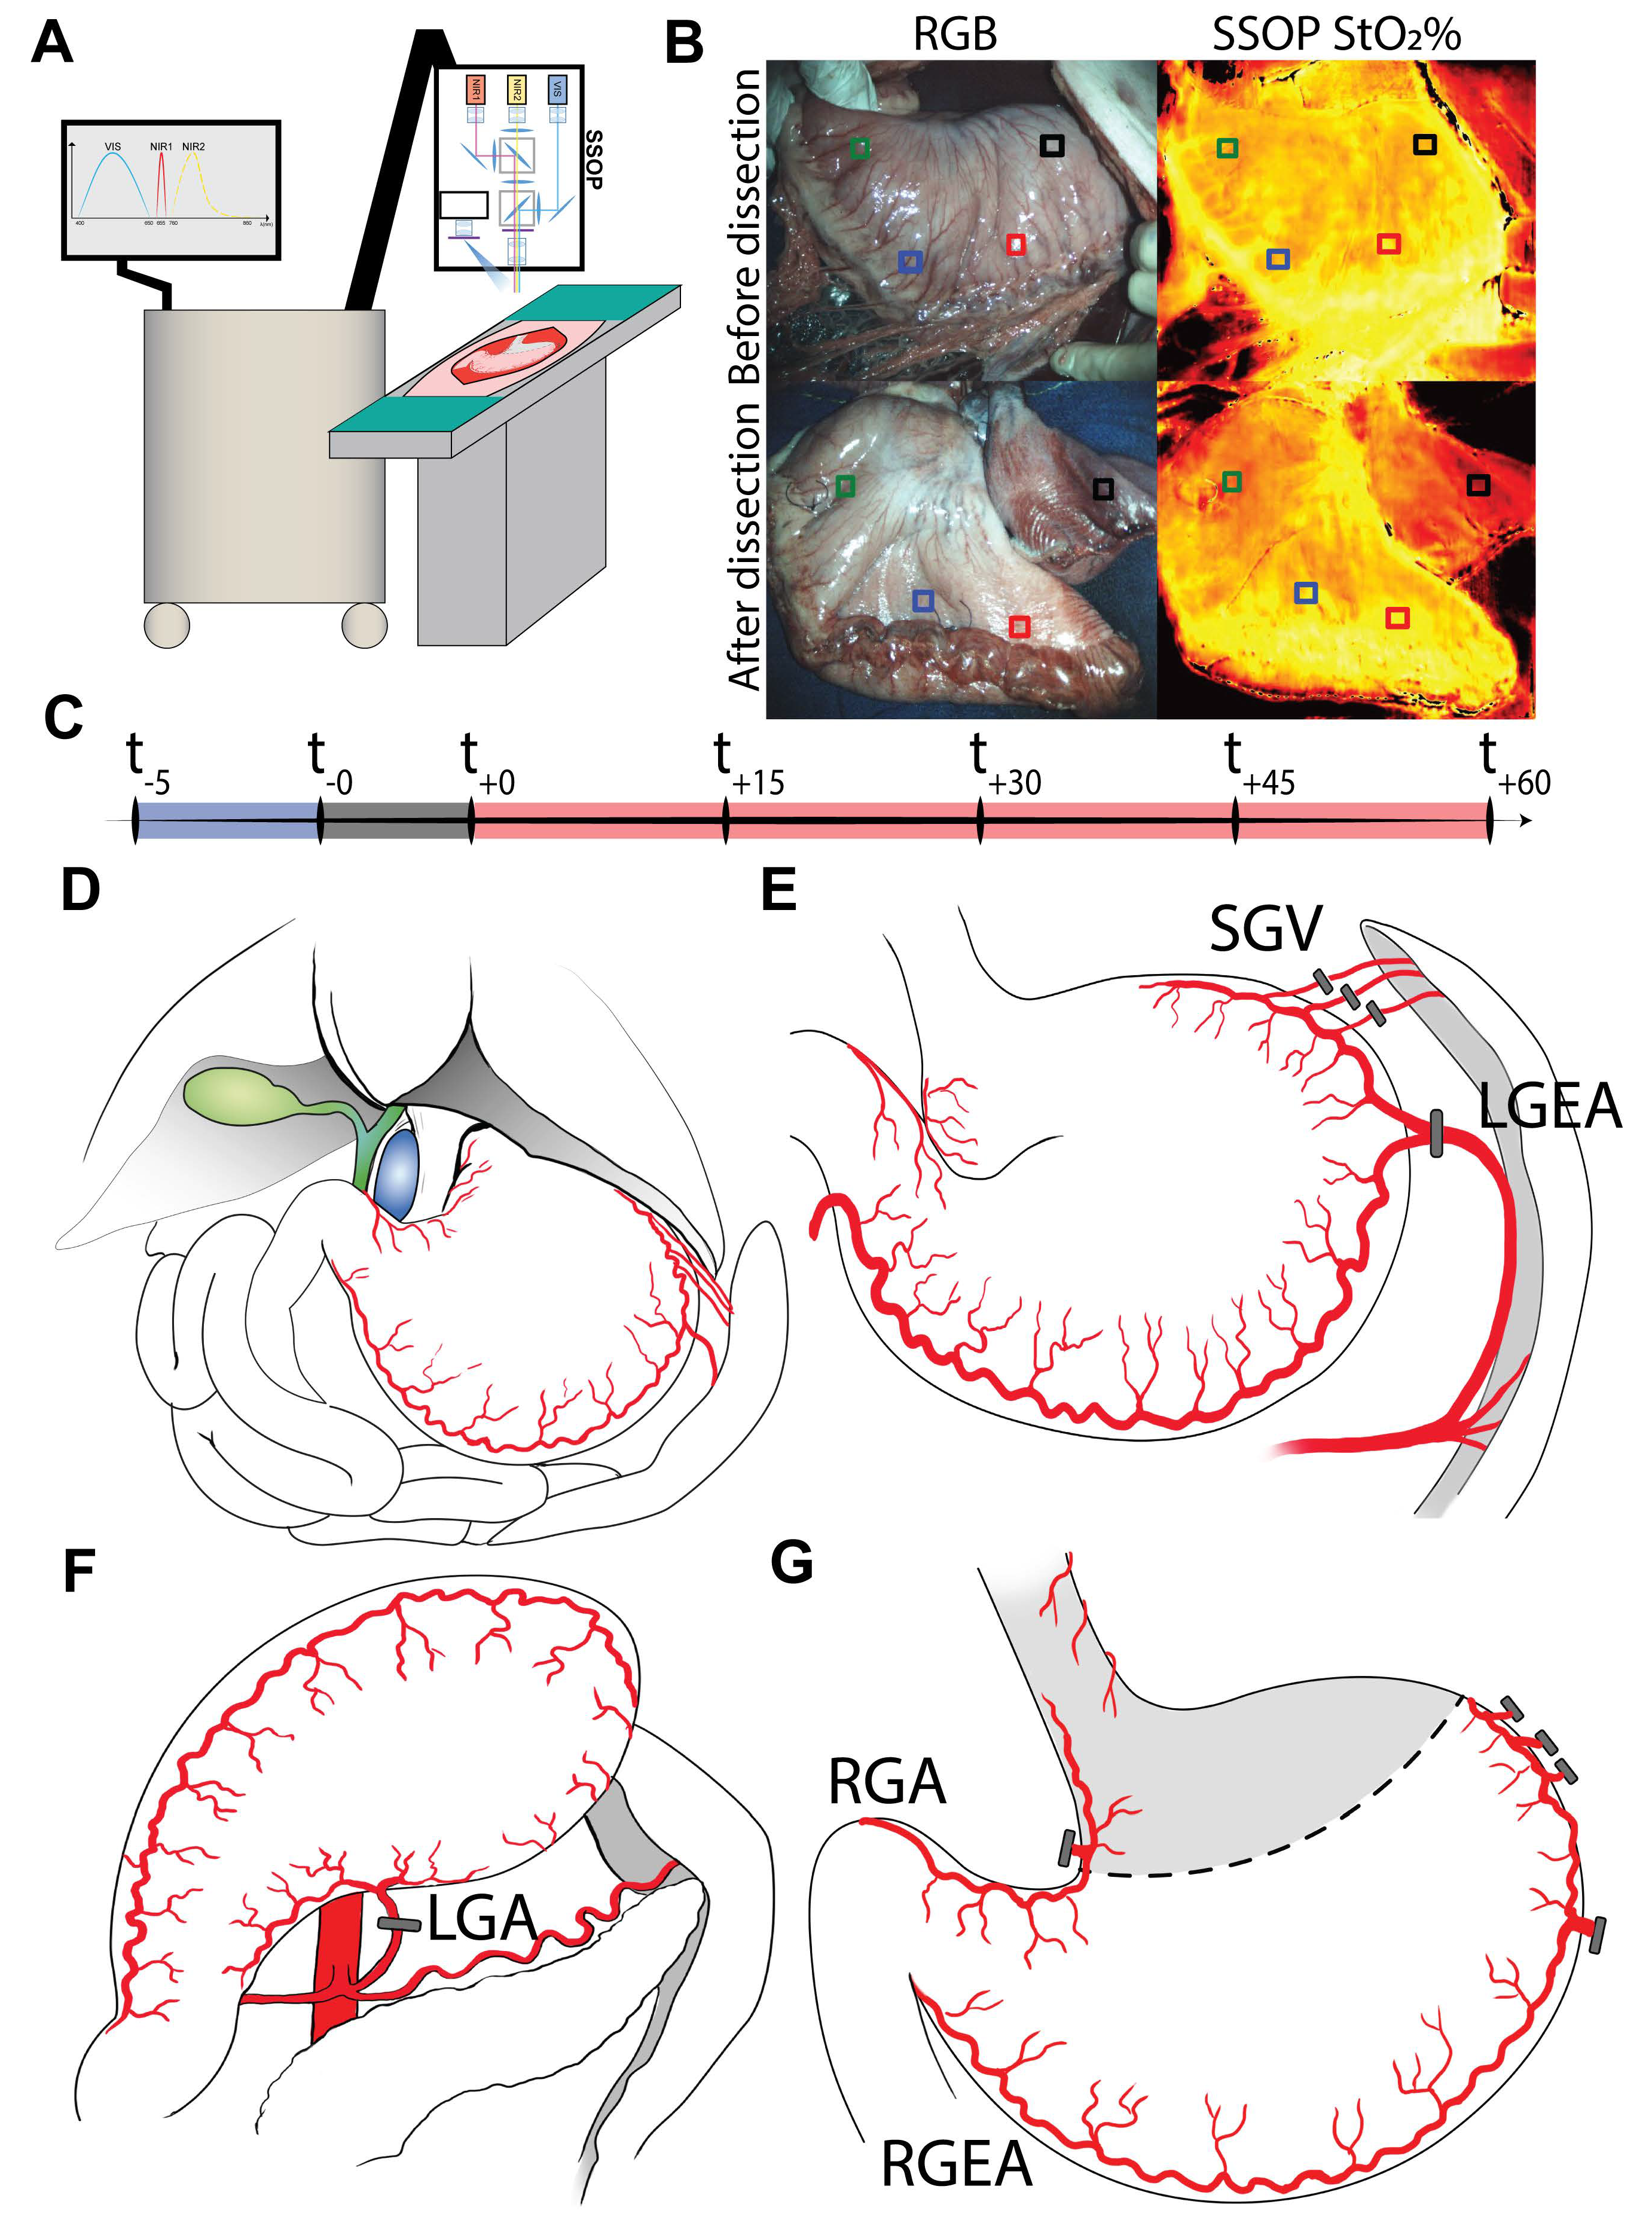
2.1. Experimental Workflow
2.2. Sample Size Calculation
2.3. Animals
2.4. Surgical Procedure
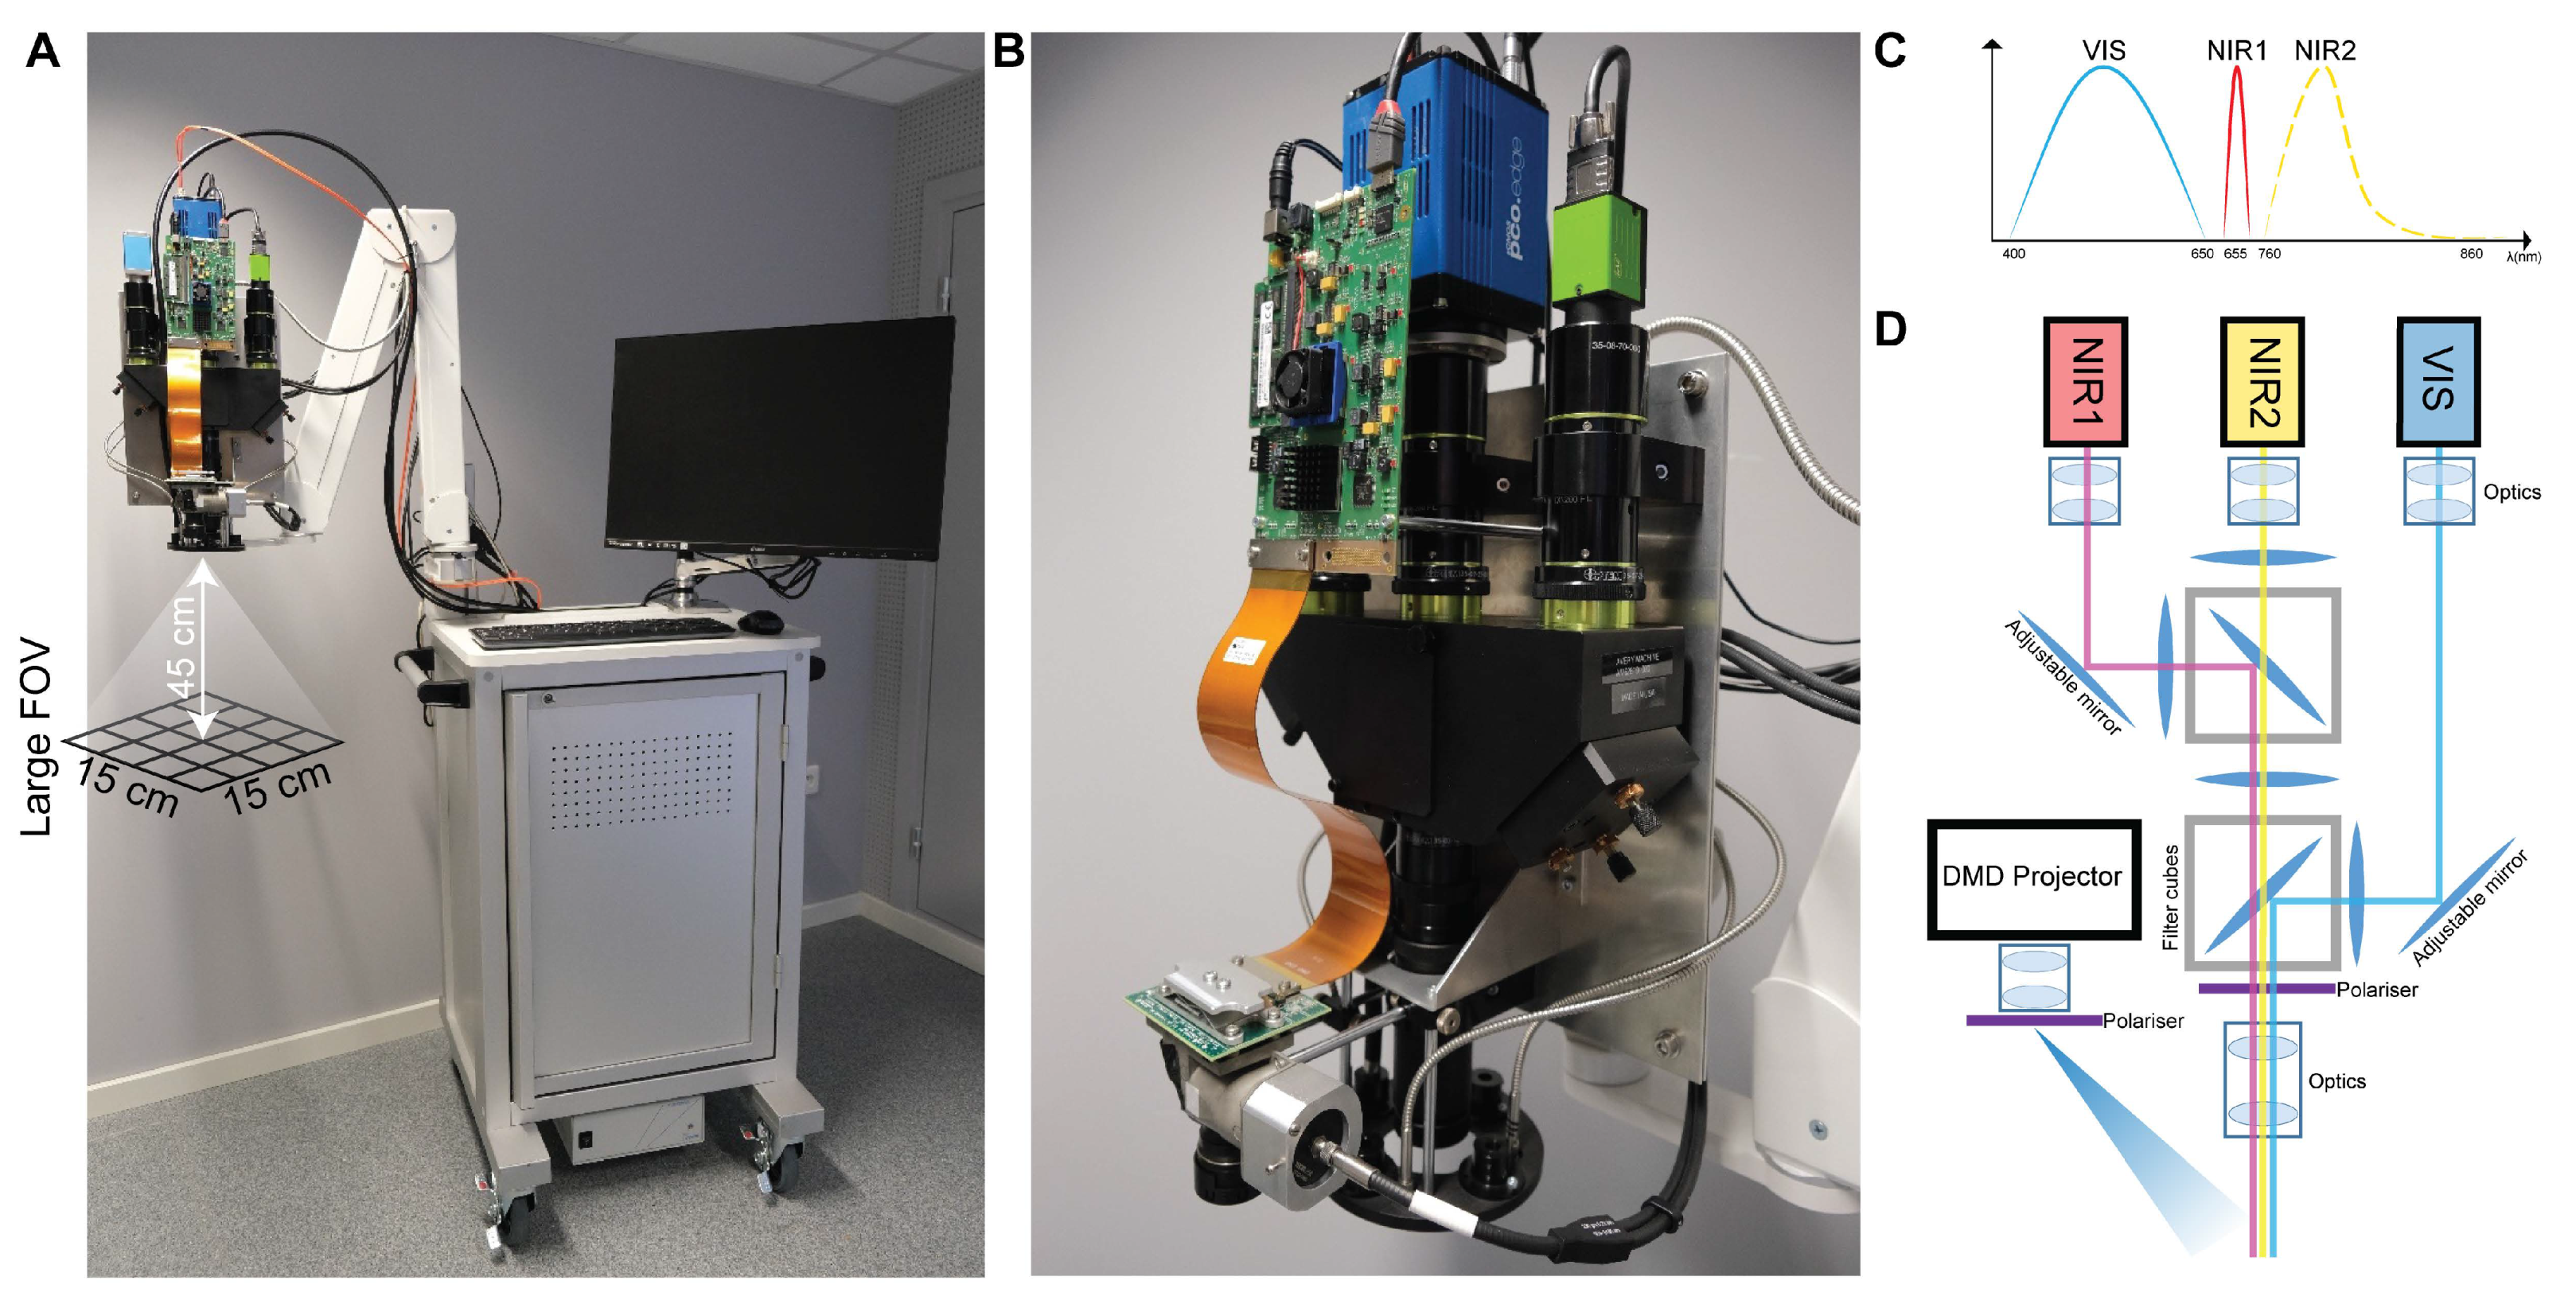
2.5. SSOP Imaging
2.6. Deep Learning Method for SSOP
2.7. Instrumentation
2.8. Blood Analysis
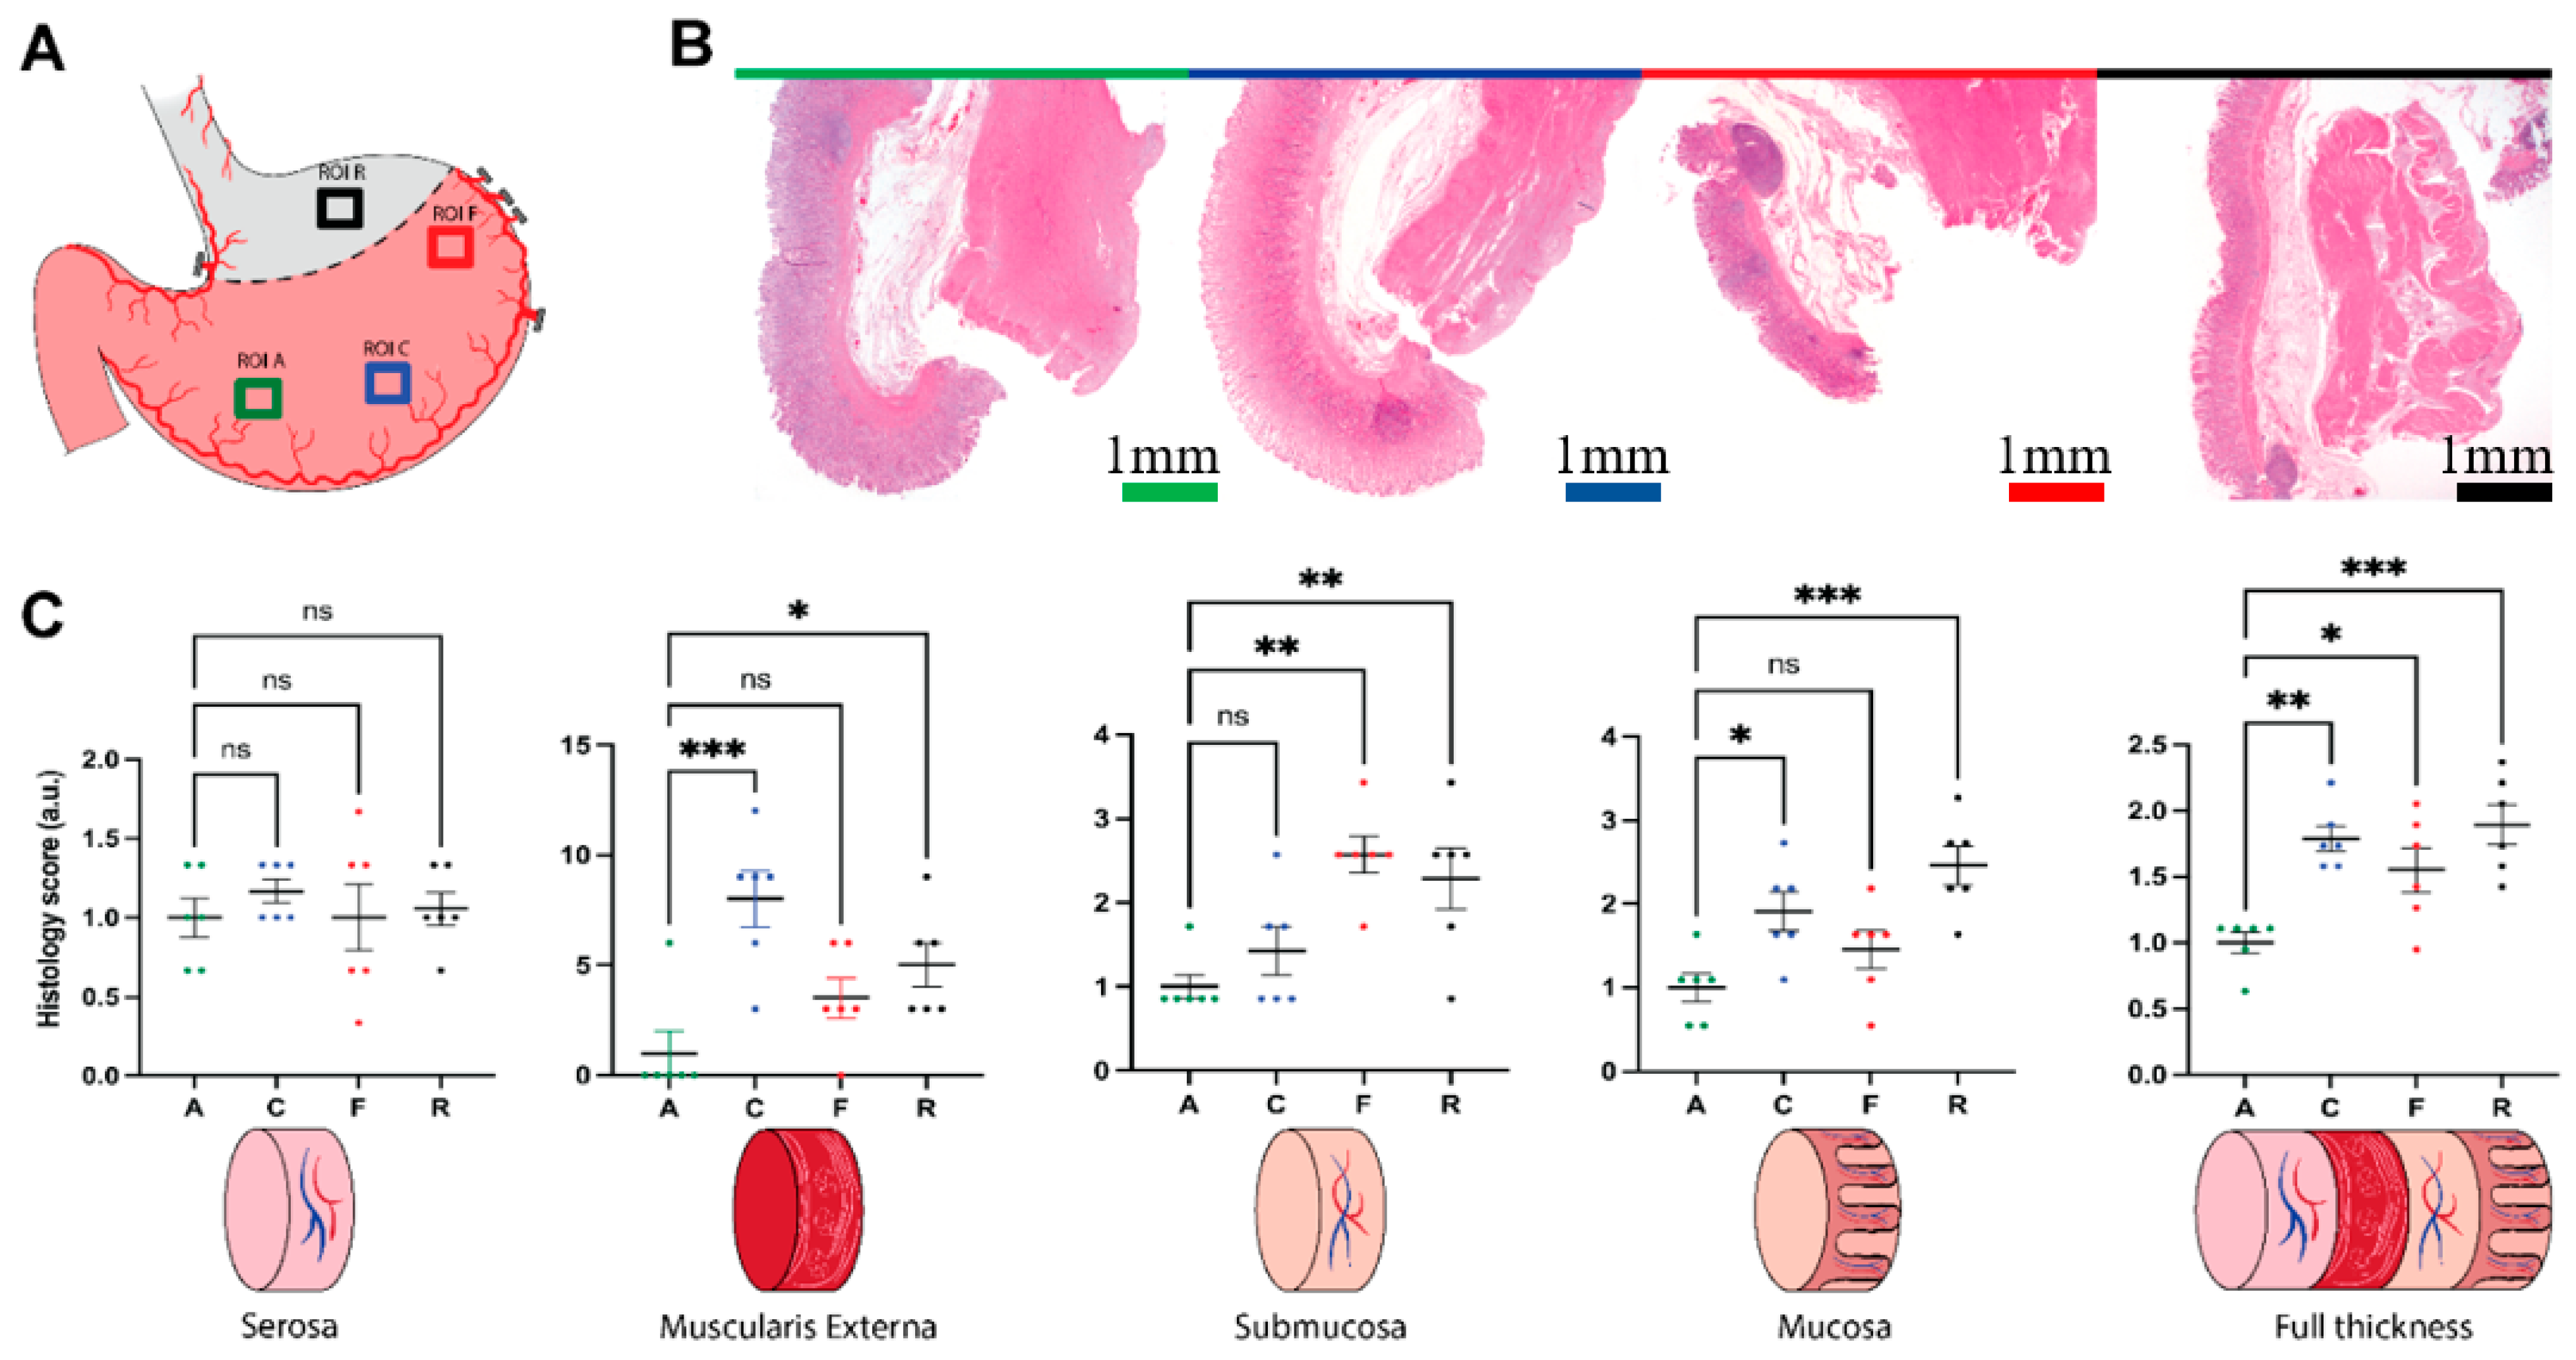
2.9. Histology
2.10. Statistical Analysis
3. Results
3.1. Blood Gas Analysis
3.2. Histologic Analysis
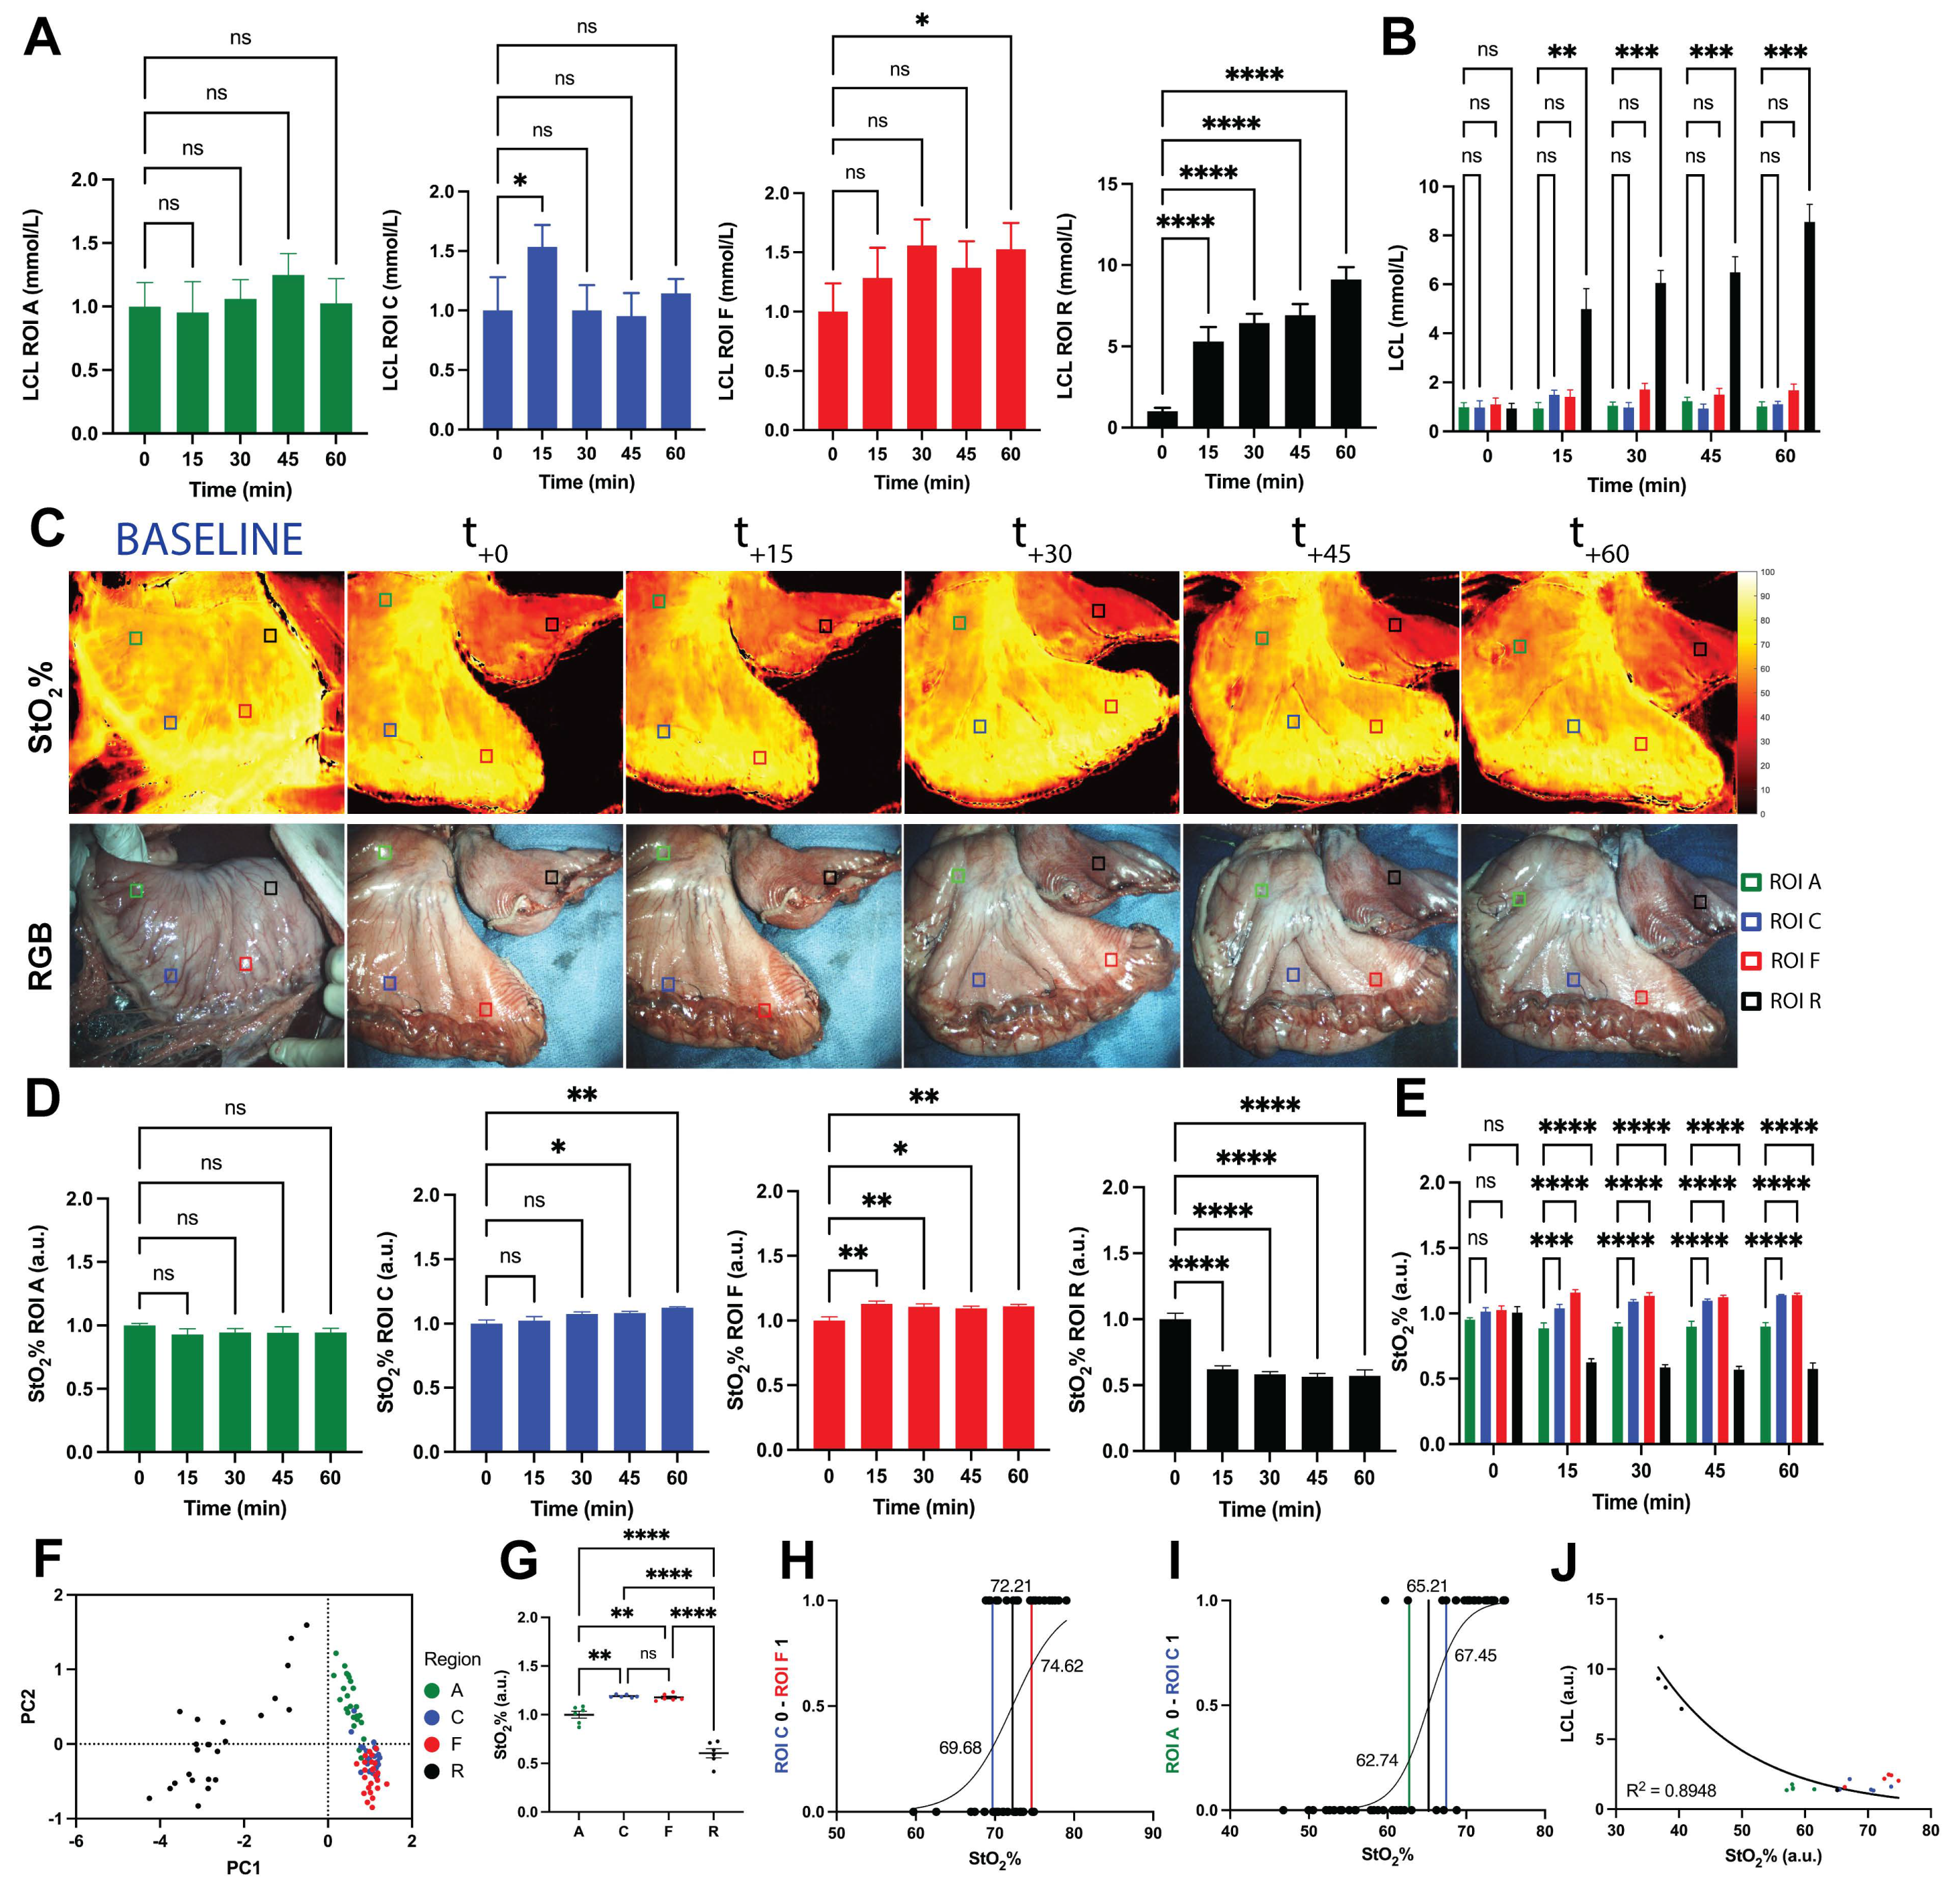
3.3. Local Capillary Lactates Quantification
3.4. SSOP-Based StO2% Quantification
3.5. Correlation between StO2% Values and LCLs
4. Discussion
5. Conclusions
Supplementary Materials
Author Contributions
Funding
Institutional Review Board Statement
Informed Consent Statement
Data Availability Statement
Acknowledgments
Conflicts of Interest
References
- Sung, H.; Ferlay, J.; Siegel, R.L.; Laversanne, M.; Soerjomataram, I.; Jemal, A.; Bray, F. Global cancer statistics 2020: GLOBOCAN estimates of incidence and mortality worldwide for 36 cancers in 185 countries. CA Cancer J. Clin. 2021, 71, 209–249. [Google Scholar] [CrossRef]
- van Hagen, P.; Hulshof, M.C.; van Lanschot, J.J.; Steyerberg, E.W.; van Berge Henegouwen, M.I.; Wijnhoven, B.P.; Richel, D.J.; Nieuwenhuijzen, G.A.; Hospers, G.A.; Bonenkamp, J.J.; et al. Preoperative chemoradiotherapy for esophageal or junctional cancer. N. Engl. J. Med. 2012, 366, 2074–2084. [Google Scholar] [CrossRef] [PubMed] [Green Version]
- Cancer.Net. Esophageal Cancer. Cancer.Net. 2019. Available online: https://www.cancer.net/cancer-types/esophageal-cancer/ (accessed on 11 June 2021).
- Lewis, I. The surgical treatment of carcinoma of the oesophagus; with special reference to a new operation for growths of the middle third. Br. J. Surg. 1946, 34, 18–31. [Google Scholar] [CrossRef] [PubMed]
- Huang, L.; Onaitis, M. Minimally invasive and robotic Ivor Lewis esophagectomy. J. Thorac. Dis. 2014, 6 (Suppl. S3), S314–S321. [Google Scholar] [CrossRef]
- Liesenfeld, L.F.; Sauer, P.; Diener, M.K.; Hinz, U.; Schmidt, T.; Müller-Stich, B.P.; Hackert, T.; Büchler, M.W.; Schaible, A. Prognostic value of inflammatory markers for detecting anastomotic leakage after esophageal resection. BMC Surg. 2020, 20, 324. [Google Scholar] [CrossRef]
- Schaible, A.; Brenner, T.; Hinz, U.; Schmidt, T.; Weigand, M.; Sauer, P.; Büchler, M.W.; Ulrich, A. Significant decrease of mortality due to anastomotic leaks following esophageal resection: Management makes the difference. Langenbeck’s Arch. Surg. 2017, 402, 1167–1173. [Google Scholar] [CrossRef]
- Low, D.E. Diagnosis and management of anastomotic leaks after esophagectomy. J. Gastrointest. Surg. Off. J. Soc. Surg. Aliment. Tract 2011, 15, 1319–1322. [Google Scholar] [CrossRef]
- Jessen, M.; Nerstrøm, M.; Wilbek, T.E.; Roepstorff, S.; Rasmussen, M.S.; Krarup, P.M. Risk factors for clinical anastomotic leakage after right hemicolectomy. Int. J. Colorectal Dis. 2016, 31, 1619–1624. [Google Scholar] [CrossRef]
- Kofoed, S.C.; Calatayud, D.; Jensen, L.S.; Jensen, M.V.; Svendsen, L.B. Intrathoracic anastomotic leakage after gastroesophageal cancer resection is associated with reduced long-term survival. World J. Surg. 2014, 38, 114–119. [Google Scholar] [CrossRef] [PubMed]
- Chadi, S.A.; Fingerhut, A.; Berho, M.; DeMeester, S.R.; Fleshman, J.W.; Hyman, N.H.; Margolin, D.A.; Martz, J.E.; McLemore, E.C.; Molena, D.; et al. Emerging Trends in the Etiology, Prevention, and Treatment of Gastrointestinal Anastomotic Leakage. J. Gastrointest. Surg. Off. J. Soc. Surg. Aliment. Tract 2016, 20, 2035–2051. [Google Scholar] [CrossRef]
- Booka, E.; Takeuchi, H.; Suda, K.; Fukuda, K.; Nakamura, R.; Wada, N.; Kawakubo, H.; Kitagawa, Y. Meta-analysis of the impact of postoperative complications on survival after oesophagectomy for cancer. BJS Open 2018, 2, 276–284. [Google Scholar] [CrossRef] [PubMed]
- Trencheva, K.; Morrissey, K.P.; Wells, M.; Mancuso, C.A.; Lee, S.W.; Sonoda, T.; Michelassi, F.; Charlson, M.E.; Milsom, J.W. Identifying important predictors for anastomotic leak after colon and rectal resection: Prospective study on 616 patients. Ann. Surg. 2013, 257, 108–113. [Google Scholar] [CrossRef] [Green Version]
- Chioreso, C.; Del Vecchio, N.; Schweizer, M.L.; Schlichting, J.; Gribovskaja-Rupp, I.; Charlton, M.E. Association Between Hospital and Surgeon Volume and Rectal Cancer Surgery Outcomes in Patients with Rectal Cancer Treated Since 2000: Systematic Literature Review and Meta-analysis. Dis. Colon Rectum 2018, 61, 1320–1332. [Google Scholar] [CrossRef] [PubMed]
- Mitchell, J.D. Anastomotic leak after esophagectomy. Thorac. Surg. Clin. 2006, 16, 1–9. [Google Scholar] [CrossRef] [PubMed]
- Ryan, C.E.; Paniccia, A.; Meguid, R.A.; McCarter, M.D. Transthoracic Anastomotic Leak After Esophagectomy: Current Trends. Ann. Surg. Oncol. 2017, 24, 281–290. [Google Scholar] [CrossRef]
- Karliczek, A.; Harlaar, N.J.; Zeebregts, C.J.; Wiggers, T.; Baas, P.C.; van Dam, G.M. Surgeons lack predictive accuracy for anastomotic leakage in gastrointestinal surgery. Int. J. Colorectal Dis. 2009, 24, 569–576. [Google Scholar] [CrossRef] [PubMed] [Green Version]
- Jansen, S.M.; de Bruin, D.M.; van Berge Henegouwen, M.I.; Strackee, S.D.; Veelo, D.P.; van Leeuwen, T.G.; Gisbertz, S.S. Optical techniques for perfusion monitoring of the gastric tube after esophagectomy: A review of technologies and thresholds. Dis. Esophagus Off. J. Int. Soc. Dis. Esophagus 2018, 31, dox161. [Google Scholar] [CrossRef] [PubMed]
- Urbanavičius, L.; Pattyn, P.; de Putte, D.V.; Venskutonis, D. How to assess intestinal viability during surgery: A review of techniques. World J. Gastrointest. Surg. 2011, 3, 59–69. [Google Scholar] [CrossRef]
- Clancy, N.T.; Jones, G.; Maier-Hein, L.; Elson, D.S.; Stoyanov, D. Surgical spectral imaging. Med. Image Anal. 2020, 63, 101699. [Google Scholar] [CrossRef]
- Barberio, M.; Felli, E.; Pop, R.; Pizzicannella, M.; Geny, B.; Lindner, V.; Baiocchini, A.; Jansen-Winkeln, B.; Moulla, Y.; Agnus, V.; et al. A Novel Technique to Improve Anastomotic Perfusion Prior to Esophageal Surgery: Hybrid Ischemic Preconditioning of the Stomach. Preclinical Efficacy Proof in a Porcine Survival Model. Cancers 2020, 12, 2977. [Google Scholar] [CrossRef] [PubMed]
- Jansen-Winkeln, B.; Germann, I.; Köhler, H.; Mehdorn, M.; Maktabi, M.; Sucher, R.; Barberio, M.; Chalopin, C.; Diana, M.; Moulla, Y.; et al. Comparison of hyperspectral imaging and fluorescence angiography for the determination of the transection margin in colorectal resections-a comparative study. Int. J. Colorectal Dis. 2021, 36, 283–291. [Google Scholar] [CrossRef]
- Barberio, M.; Felli, E.; Seyller, E.; Longo, F.; Chand, M.; Gockel, I.; Geny, B.; Swanström, L.; Marescaux, J.; Agnus, V.; et al. Quantitative fluorescence angiography versus hyperspectral imaging to assess bowel ischemia: A comparative study in enhanced reality. Surgery 2020, 168, 178–184. [Google Scholar] [CrossRef] [PubMed]
- Barberio, M.; Longo, F.; Fiorillo, C.; Seeliger, B.; Mascagni, P.; Agnus, V.; Lindner, V.; Geny, B.; Charles, A.L.; Gockel, I.; et al. HYPerspectral Enhanced Reality (HYPER): A physiology-based surgical guidance tool. Surg. Endosc. 2020, 34, 1736–1744. [Google Scholar] [CrossRef]
- Cuccia, D.J.; Bevilacqua, F.; Durkin, A.J.; Ayers, F.R.; Tromberg, B.J. Quantitation and mapping of tissue optical properties using modulated imaging. J. Biomed. Opt. 2009, 14, 024012. [Google Scholar] [CrossRef] [PubMed]
- Gioux, S.; Mazhar, A.; Cuccia, D.J. Spatial frequency domain imaging in 2019: Principles, applications, and perspectives. J. Biomed. Opt. 2019, 24, 071613. [Google Scholar] [CrossRef] [Green Version]
- Ponticorvo, A.; Burmeister, D.M.; Yang, B.; Choi, B.; Christy, R.J.; Durkin, A.J. Quantitative assessment of graded burn wounds in a porcine model using spatial frequency domain imaging (SFDI) and laser speckle imaging (LSI). Biomed. Opt. Express 2014, 5, 3467–3481. [Google Scholar] [CrossRef] [Green Version]
- Pharaon, M.R.; Scholz, T.; Bogdanoff, S.; Cuccia, D.; Durkin, A.J.; Hoyt, D.B.; Evans, G.R.D. Early detection of complete vascular occlusion in a pedicle flap model using quantitative [corrected] spectral imaging. Plast. Reconstr. Surg. 2010, 126, 1924–1935. [Google Scholar] [CrossRef] [Green Version]
- Gioux, S.; Mazhar, A.; Lee, B.T.; Lin, S.J.; Tobias, A.M.; Cuccia, D.J.; Stockdale, A.; Oketokoun, R.; Ashitate, Y.; Kelly, E.; et al. First-in-human pilot study of a spatial frequency domain oxygenation imaging system. J. Biomed. Opt. 2011, 16, 086015. [Google Scholar] [CrossRef] [Green Version]
- Yafi, A.; Muakkassa, F.K.; Pasupneti, T.; Fulton, J.; Cuccia, D.J.; Mazhar, A.; Blasiole, K.N.; Mostow, E.N. Quantitative skin assessment using spatial frequency domain imaging (SFDI) in patients with or at high risk for pressure ulcers. Lasers Surg. Med. 2017, 49, 827–834. [Google Scholar] [CrossRef] [PubMed]
- Rohrbach, D.J.; Muffoletto, D.; Huihui, J.; Saager, R.; Keymel, K.; Paquette, A.; Morgan, J.; Zeitouni, N.; Sunar, U. Preoperative mapping of nonmelanoma skin cancer using spatial frequency domain and ultrasound imaging. Acad. Radiol. 2014, 21, 263–270. [Google Scholar] [CrossRef] [Green Version]
- Vervandier, J.; Gioux, S. Single snapshot imaging of optical properties. Biomed. Opt. Express 2013, 4, 2938–2944. [Google Scholar] [CrossRef] [Green Version]
- van de Giessen, M.; Angelo, J.P.; Gioux, S. Real-time, profile-corrected single snapshot imaging of optical properties. Biomed. Opt. Express 2015, 6, 4051–4062. [Google Scholar] [CrossRef] [Green Version]
- Schmidt, M.; Aguénounon, E.; Nahas, A.; Torregrossa, M.; Tromberg, B.J.; Uhring, W.; Gioux, S. Real-time, wide-field, and quantitative oxygenation imaging using spatiotemporal modulation of light. J. Biomed. Opt. 2019, 24, 1–7. [Google Scholar] [CrossRef] [Green Version]
- Aguénounon, E.; Smith, J.T.; Al-Taher, M.; Diana, M.; Intes, X.; Gioux, S. Real-time, wide-field and high-quality single snapshot imaging of optical properties with profile correction using deep learning. Biomed. Opt. Express 2020, 11, 5701–5716. [Google Scholar] [CrossRef]
- Kilkenny, C.; Browne, W.; Cuthill, I.C.; Emerson, M.; Altman, D.G.; NC3Rs Reporting Guidelines Working Group. Animal research: Reporting in vivo experiments: The ARRIVE guidelines. Br. J. Pharmacol. 2010, 160, 1577–1579. [Google Scholar] [CrossRef]
- Angelo, J.; Vargas, C.R.; Lee, B.T.; Bigio, I.J.; Gioux, S. Ultrafast optical property map generation using lookup tables. J. Biomed. Opt. 2016, 21, 110501. [Google Scholar] [CrossRef] [PubMed]
- Aguénounon, E.; Dadouche, F.; Uhring, W.; Gioux, S. Single snapshot of optical properties image quality improvement using anisotropic two-dimensional windows filtering. J. Biomed. Opt. 2019, 24, 071611. [Google Scholar] [CrossRef] [PubMed] [Green Version]
- Mazhar, A.; Dell, S.; Cuccia, D.J.; Gioux, S.; Durkin, A.J.; Frangioni, J.V.; Tromberg, B.J. Wavelength optimization for rapid chromophore mapping using spatial frequency domain imaging. J. Biomed. Opt. 2010, 15, 061716. [Google Scholar] [CrossRef] [PubMed]
- Akiyama, H.; Hiyama, M.; Hashimoto, C. Resection and reconstruction for carcinoma of the thoracic oesophagus. Br. J. Surg. 1976, 63, 206–209. [Google Scholar] [CrossRef]
- Mittal, M.; Siddiqui, M.R.; Tran, K.; Reddy, S.P.; Malik, A.B. Reactive oxygen species in inflammation and tissue injury. Antioxid. Redox Signal. 2014, 20, 1126–1167. [Google Scholar] [CrossRef] [PubMed] [Green Version]
- Raziyeva, K.; Kim, Y.; Zharkinbekov, Z.; Kassymbek, K.; Jimi, S.; Saparov, A. Immunology of Acute and Chronic Wound Healing. Biomolecules 2021, 11, 700. [Google Scholar] [CrossRef]
- Barberio, M.; Felli, E.; Pizzicannella, M.; Agnus, V.; Al-Taher, M.; Seyller, E.; Moulla, Y.; Jansen-Winkeln, B.; Gockel, I.; Marescaux, J.; et al. Quantitative serosal and mucosal optical imaging perfusion assessment in gastric conduits for esophageal surgery: An experimental study in enhanced reality. Surg. Endosc. 2020, 35, 5827–5835. [Google Scholar] [CrossRef] [PubMed]
- Urade, T.; Felli, E.; Barberio, M.; Al-Taher, M.; Felli, E.; Goffin, L.; Agnus, V.; Ettorre, G.M.; Marescaux, J.; Mutter, D.; et al. Hyperspectral enhanced reality (HYPER) for anatomical liver resection. Surg. Endosc. 2021, 35, 1844–1850. [Google Scholar] [CrossRef]
- Kawada, K.; Hasegawa, S.; Wada, T.; Takahashi, R.; Hisamori, S.; Hida, K.; Sakai, Y. Evaluation of intestinal perfusion by ICG fluorescence imaging in laparoscopic colorectal surgery with DST anastomosis. Surg. Endosc. 2017, 31, 1061–1069. [Google Scholar] [CrossRef] [PubMed]
- Blanco-Colino, R.; Espin-Basany, E. Intraoperative use of ICG fluorescence imaging to reduce the risk of anastomotic leakage in colorectal surgery: A systematic review and meta-analysis. Tech. Coloproctol. 2018, 22, 15–23. [Google Scholar] [CrossRef] [PubMed]
- Hope-Ross, M.; Yannuzzi, L.A.; Gragoudas, E.S.; Guyer, D.R.; Slakter, J.S.; Sorenson, J.A.; Krupsky, S.; Orlock, D.A.; Puliafito, C.A. Adverse reactions due to indocyanine green. Ophthalmology 1994, 101, 529–533. [Google Scholar] [CrossRef]
Publisher’s Note: MDPI stays neutral with regard to jurisdictional claims in published maps and institutional affiliations. |
© 2021 by the authors. Licensee MDPI, Basel, Switzerland. This article is an open access article distributed under the terms and conditions of the Creative Commons Attribution (CC BY) license (https://creativecommons.org/licenses/by/4.0/).
Share and Cite
Cinelli, L.; Felli, E.; Baratelli, L.; Ségaud, S.; Baiocchini, A.; Okamoto, N.; Rodríguez-Luna, M.R.; Elmore, U.; Rosati, R.; Partelli, S.; et al. Single Snapshot Imaging of Optical Properties (SSOP) for Perfusion Assessment during Gastric Conduit Creation for Esophagectomy: An Experimental Study on Pigs. Cancers 2021, 13, 6079. https://doi.org/10.3390/cancers13236079
Cinelli L, Felli E, Baratelli L, Ségaud S, Baiocchini A, Okamoto N, Rodríguez-Luna MR, Elmore U, Rosati R, Partelli S, et al. Single Snapshot Imaging of Optical Properties (SSOP) for Perfusion Assessment during Gastric Conduit Creation for Esophagectomy: An Experimental Study on Pigs. Cancers. 2021; 13(23):6079. https://doi.org/10.3390/cancers13236079
Chicago/Turabian StyleCinelli, Lorenzo, Eric Felli, Luca Baratelli, Silvère Ségaud, Andrea Baiocchini, Nariaki Okamoto, María Rita Rodríguez-Luna, Ugo Elmore, Riccardo Rosati, Stefano Partelli, and et al. 2021. "Single Snapshot Imaging of Optical Properties (SSOP) for Perfusion Assessment during Gastric Conduit Creation for Esophagectomy: An Experimental Study on Pigs" Cancers 13, no. 23: 6079. https://doi.org/10.3390/cancers13236079
APA StyleCinelli, L., Felli, E., Baratelli, L., Ségaud, S., Baiocchini, A., Okamoto, N., Rodríguez-Luna, M. R., Elmore, U., Rosati, R., Partelli, S., Marescaux, J., Gioux, S., & Diana, M. (2021). Single Snapshot Imaging of Optical Properties (SSOP) for Perfusion Assessment during Gastric Conduit Creation for Esophagectomy: An Experimental Study on Pigs. Cancers, 13(23), 6079. https://doi.org/10.3390/cancers13236079