
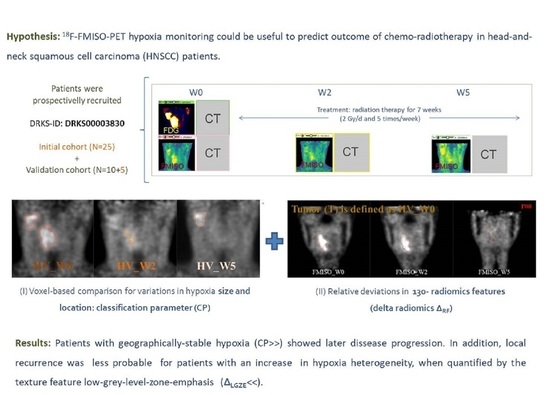
18F-FMISO-PET Hypoxia Monitoring for Head-and-Neck Cancer Patients: Radiomics Analyses Predict the Outcome of Chemo-Radiotherapy

 , , ,
, , , 
 , , and
Abstract
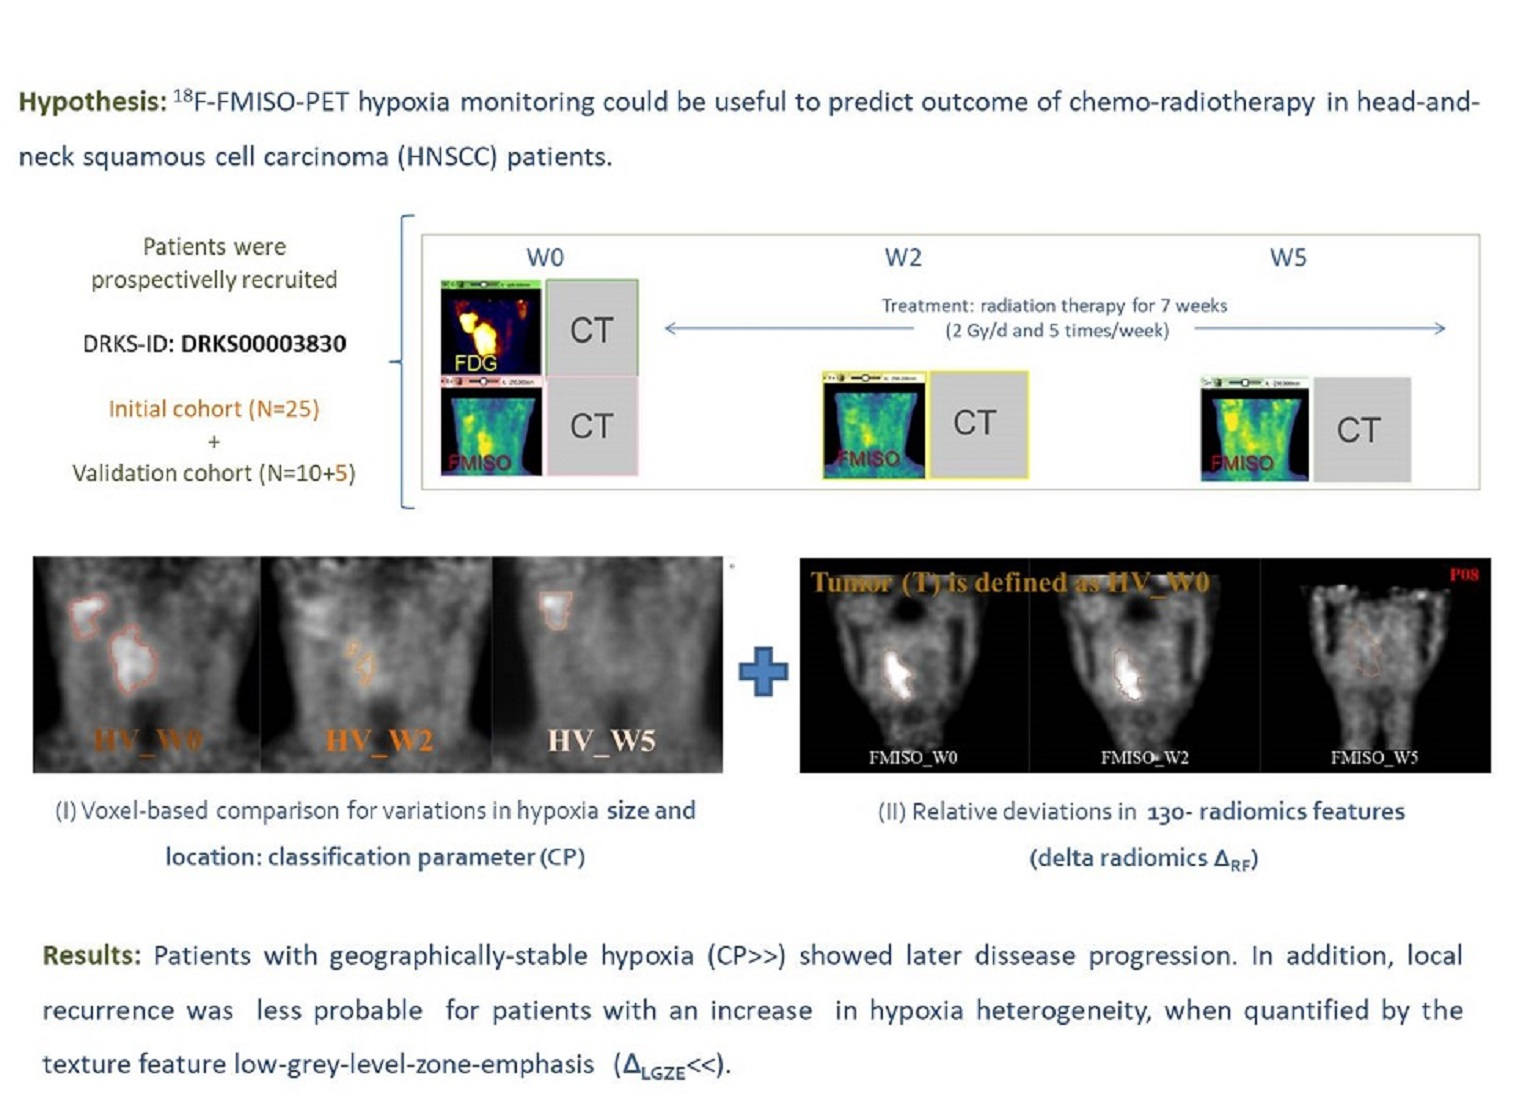
:Simple Summary
Abstract
1. Introduction
2. Materials and Methods
2.1. Patients
2.2. 18F-FMISO-PET Imaging
2.3. Segmentation
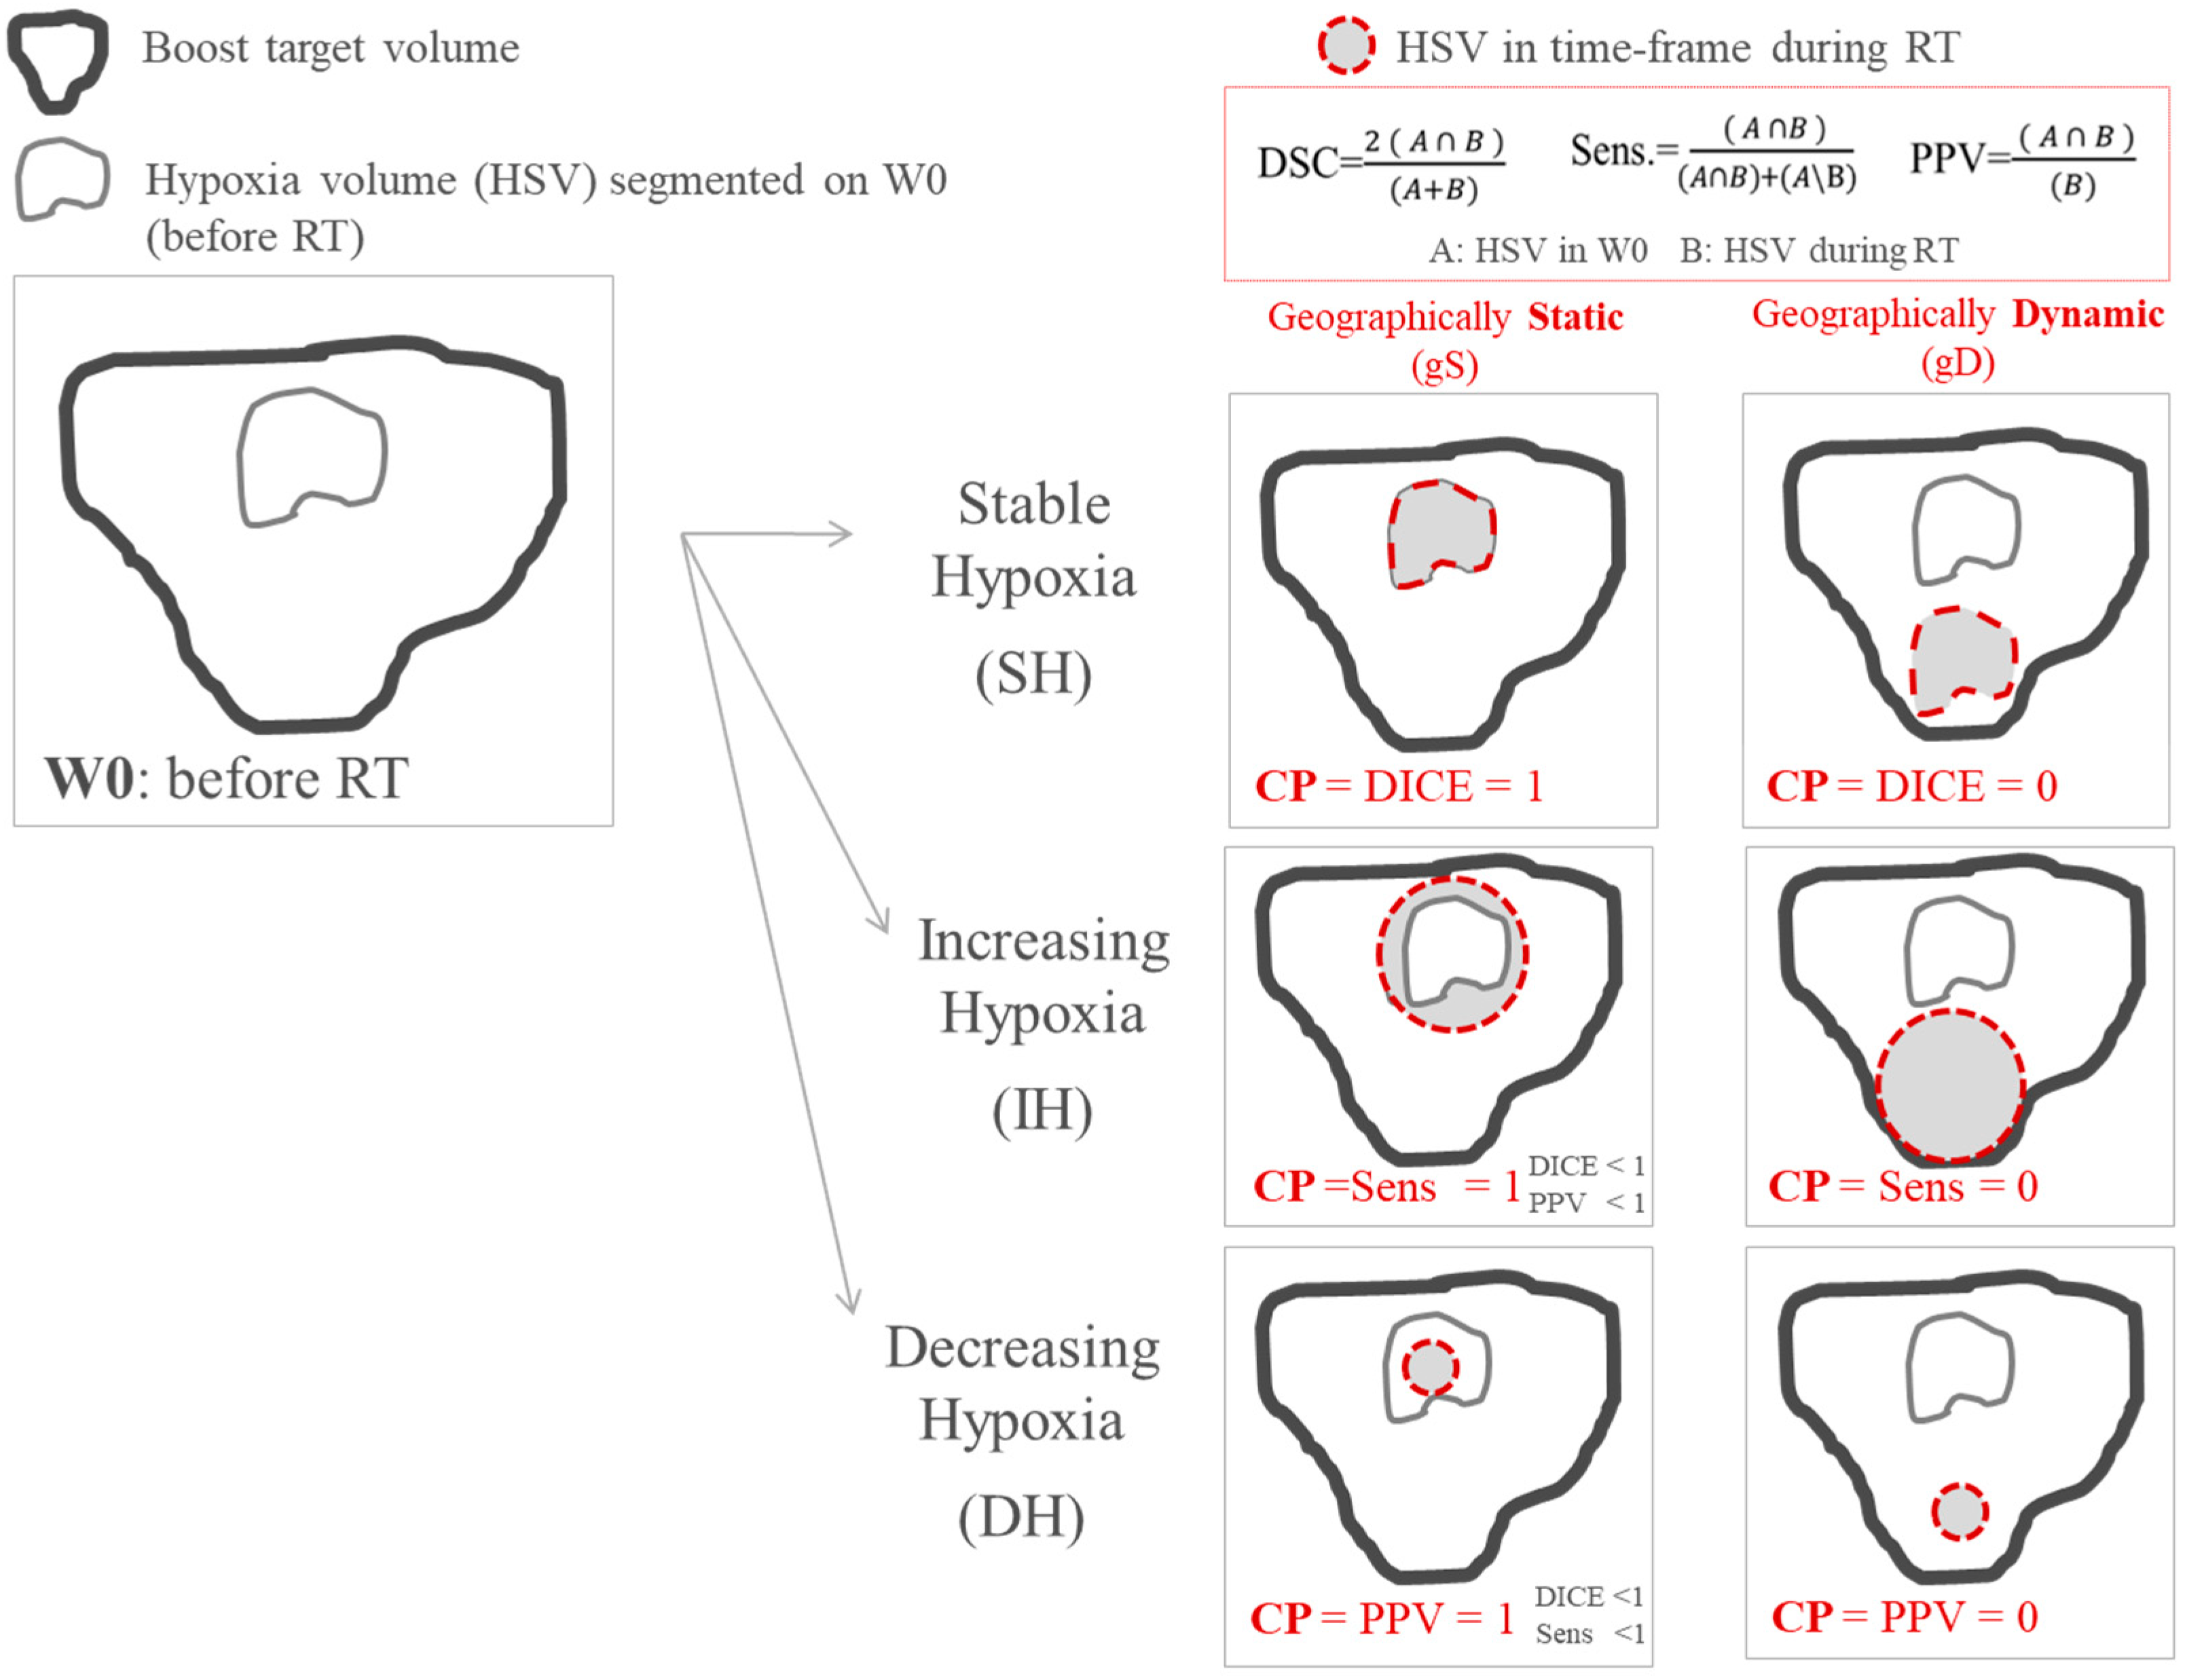
2.4. Parameters for the Quantification of Variations in Size and Localization of Hypoxia Volumes
2.5. Radiomics Features Extraction
2.6. Statistical Analysis
3. Results
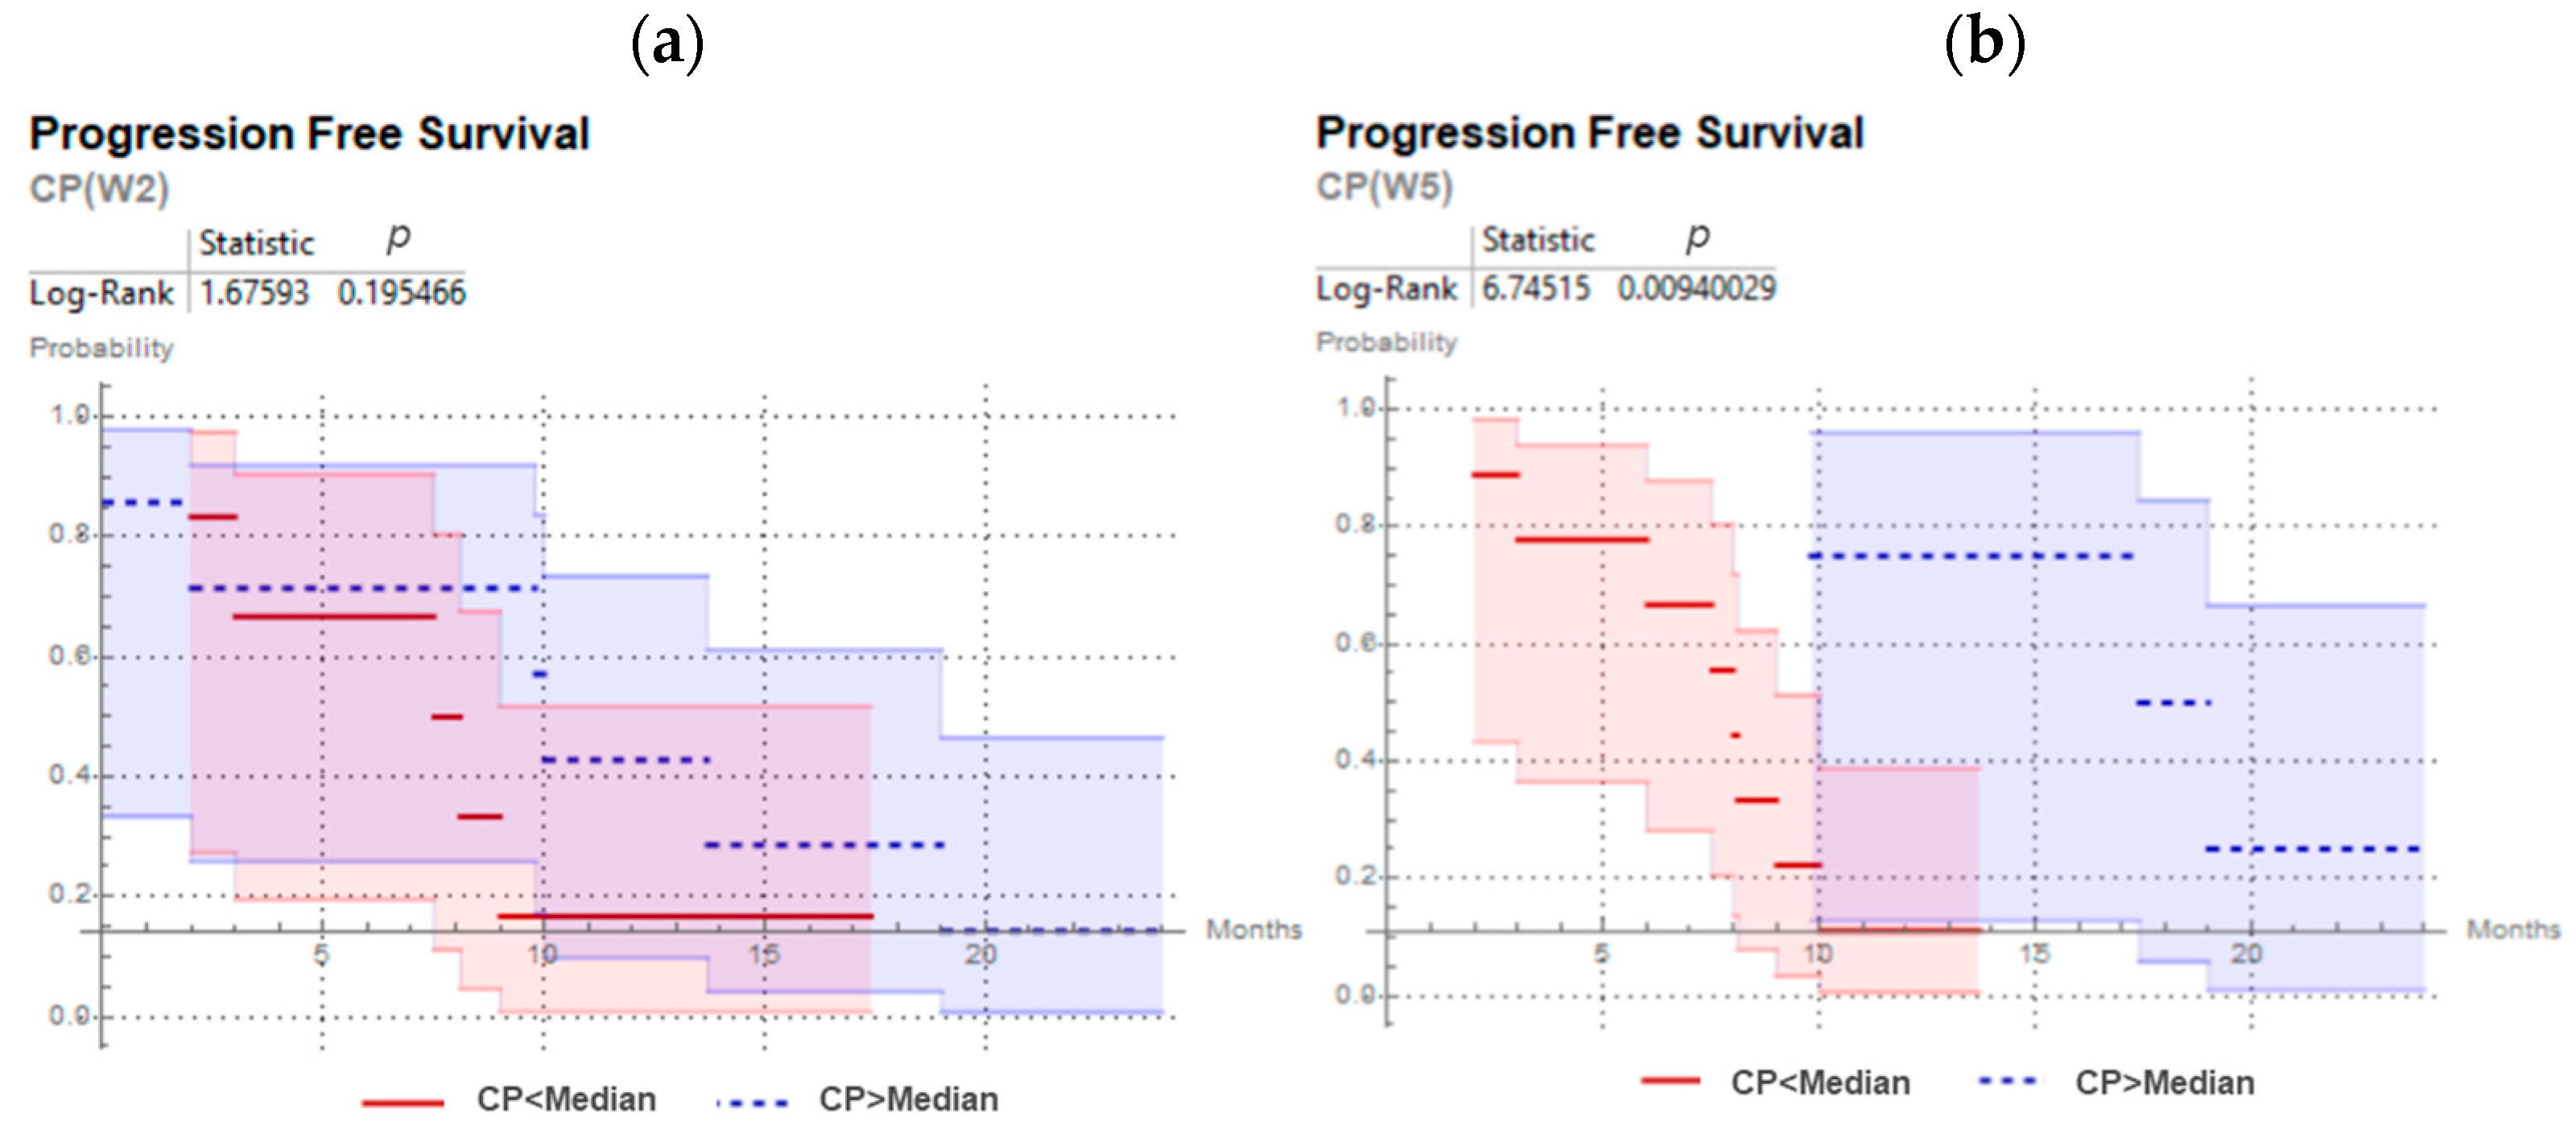
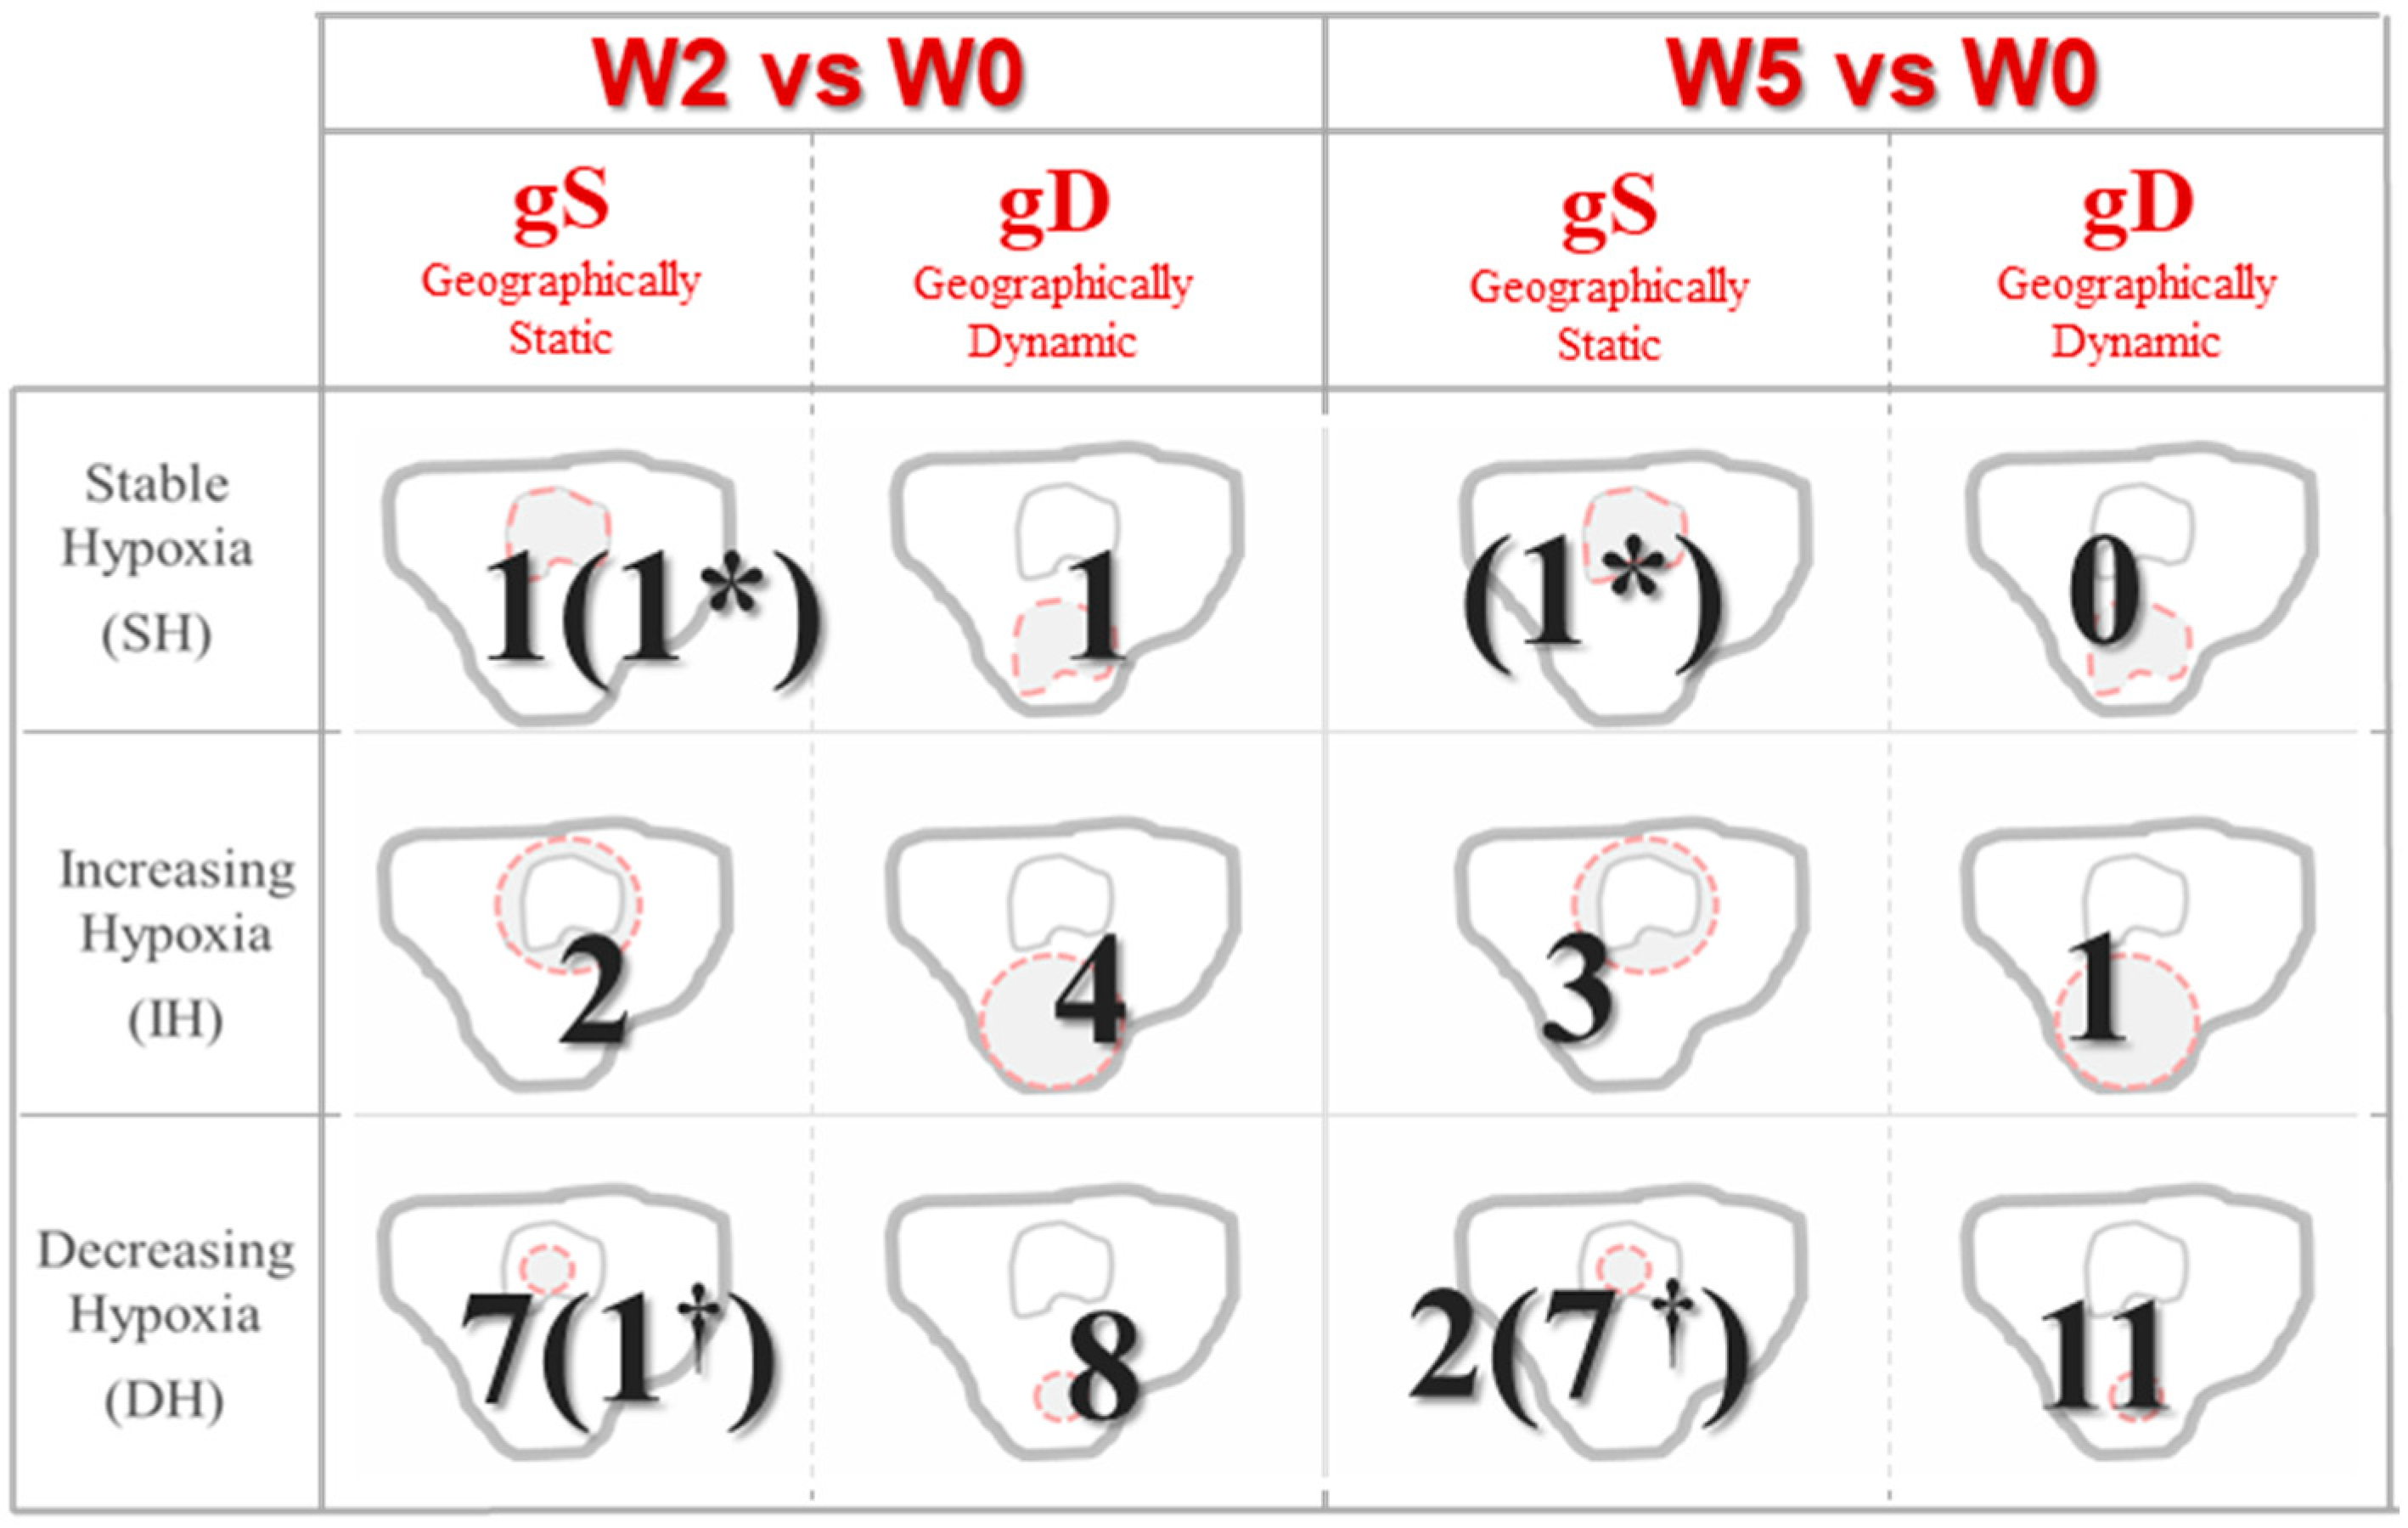
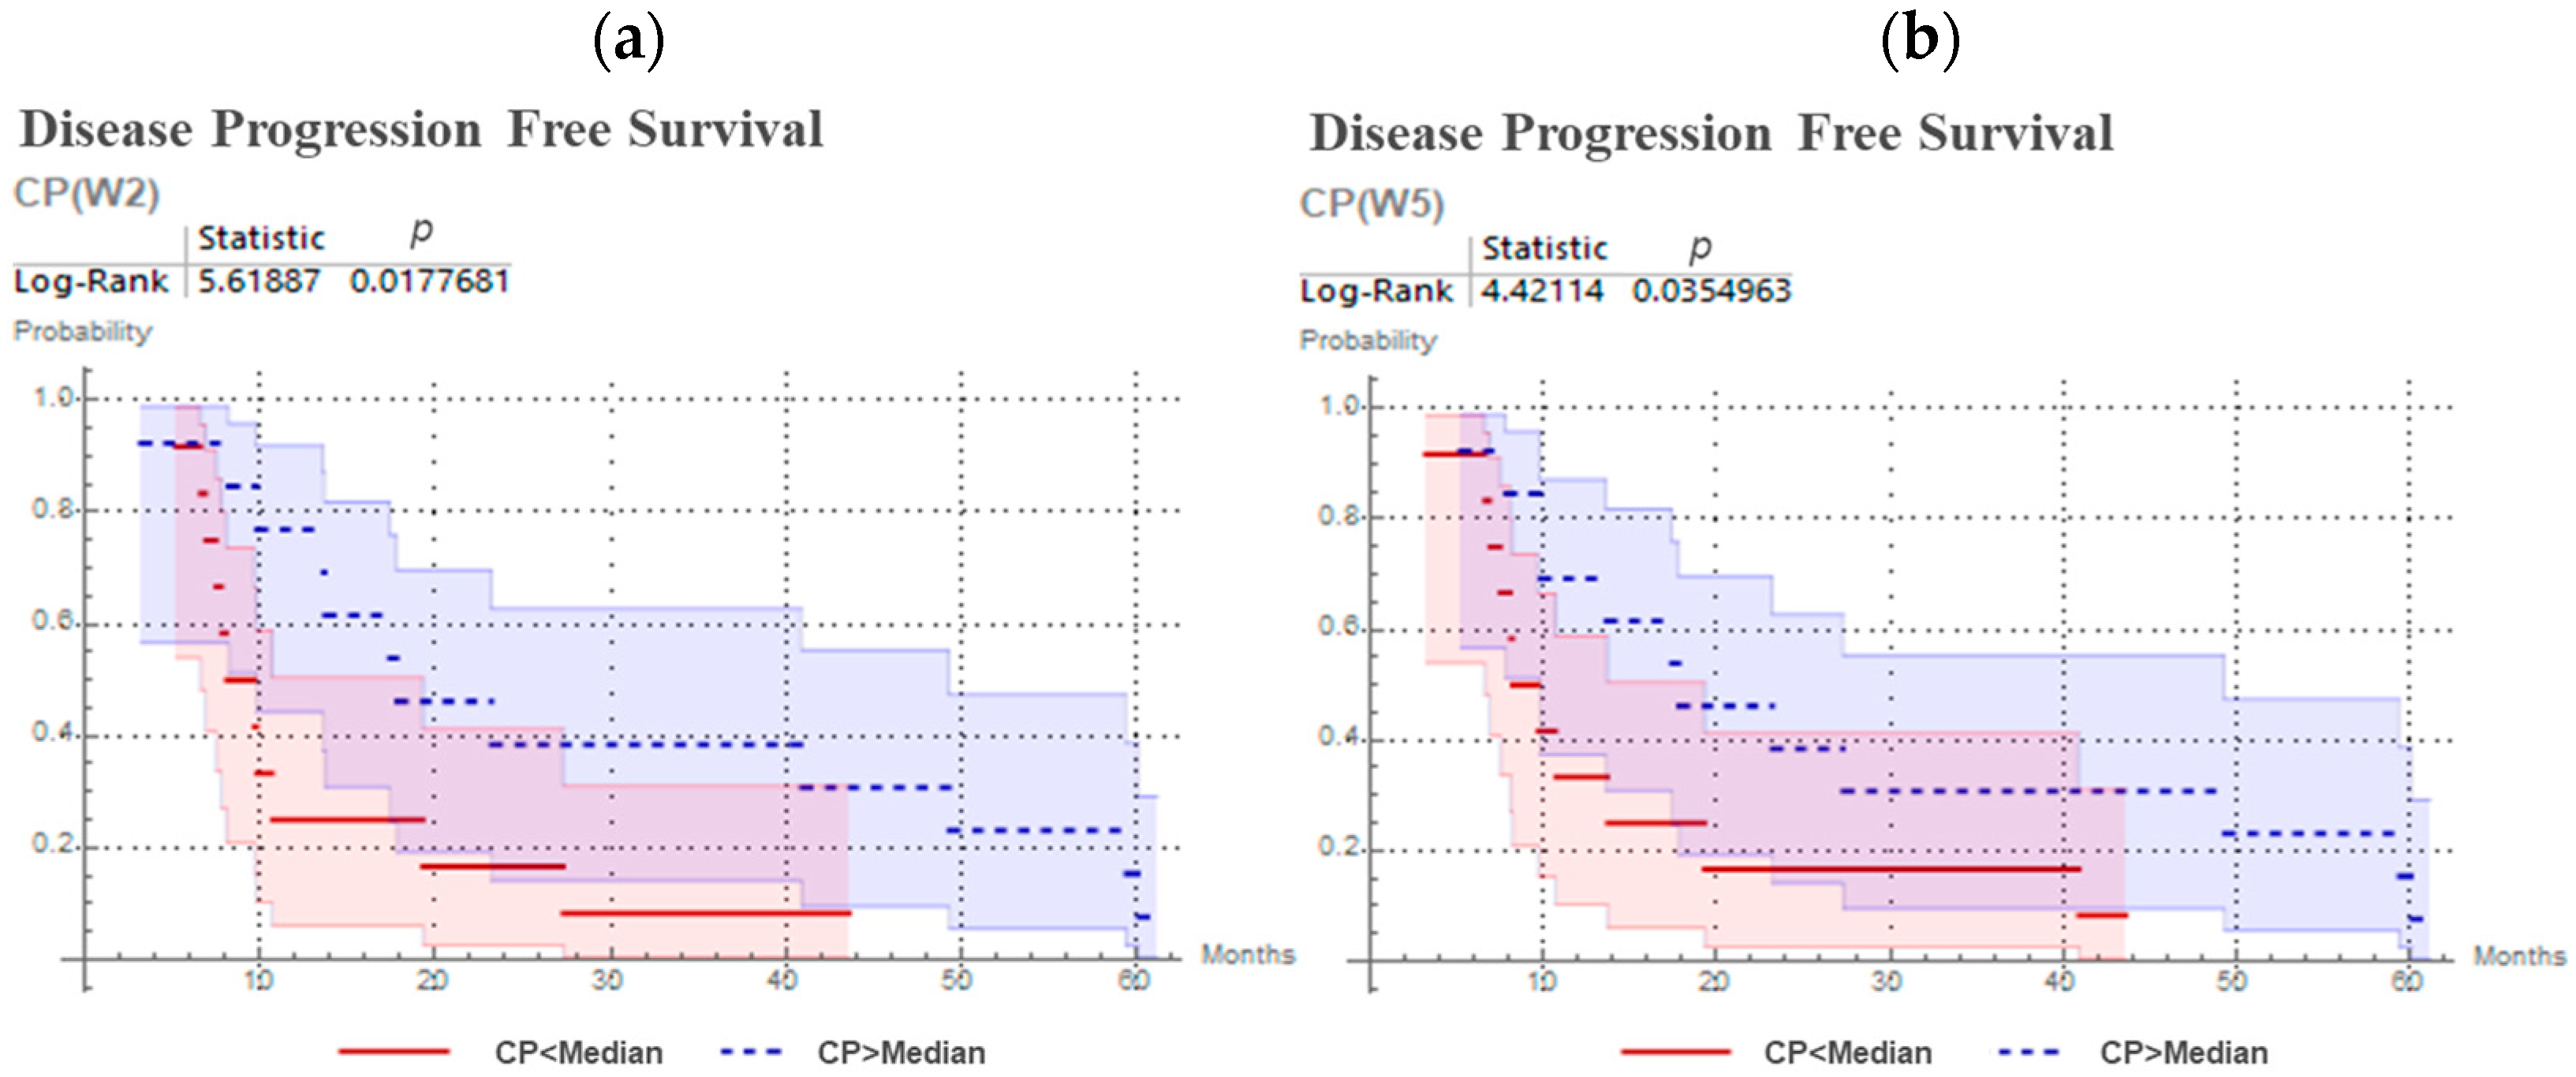
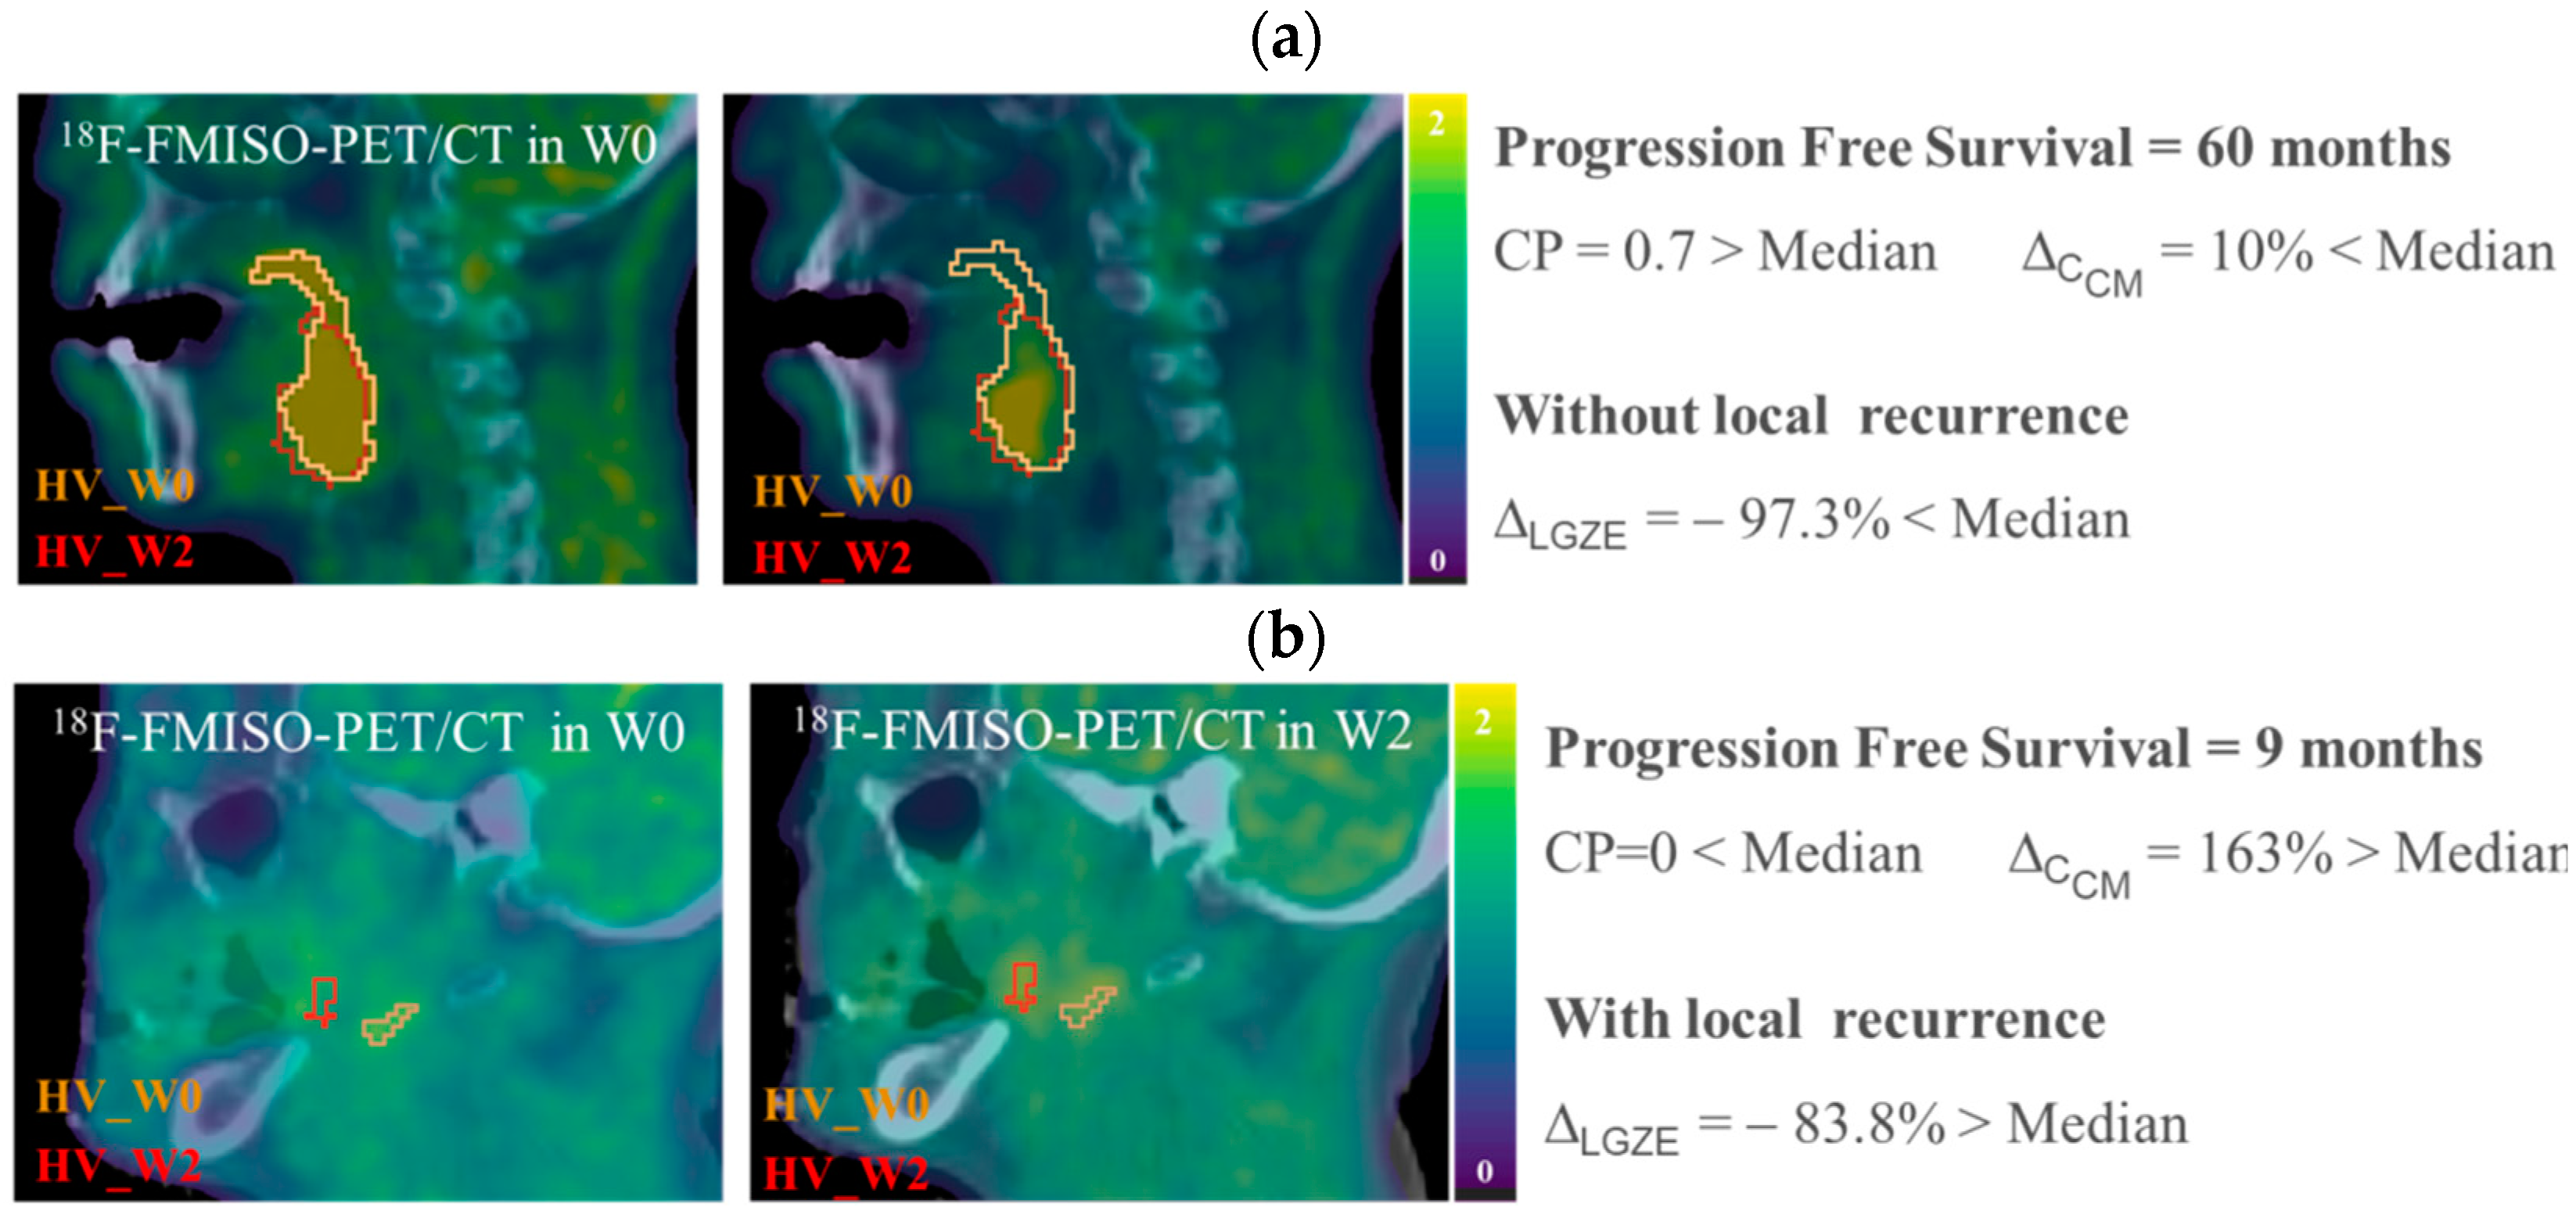
3.1. Variations in Size and Localization of Hypoxia Volumes: CP Predicts Progression Free Survival
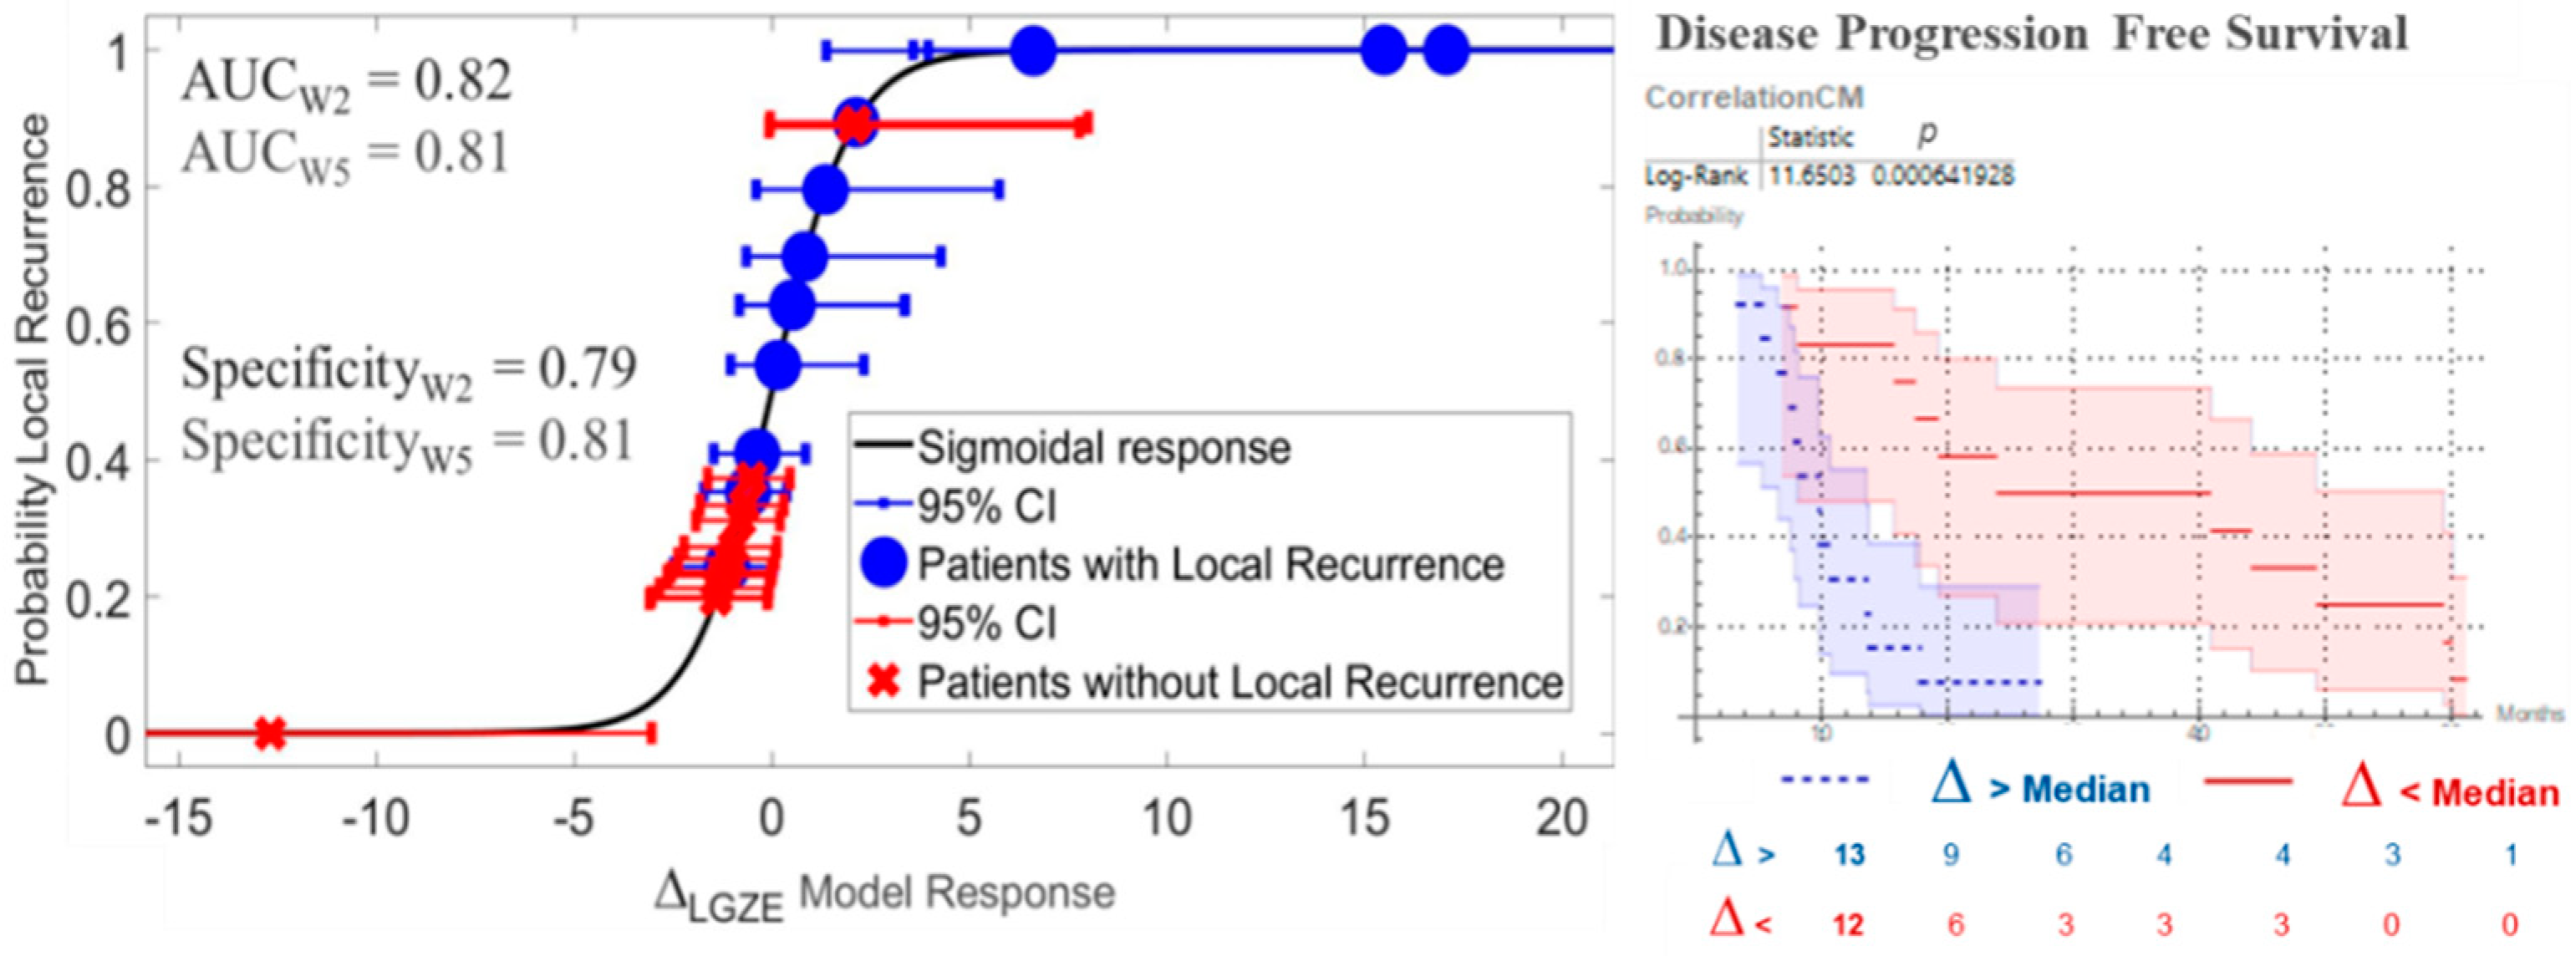
3.2. Variations in Radiomic Features: Prediction of Local Recurrence and Progression Free Survival
3.3. Confirmation of the Abbility to Predict Treatment Outcome by CP and ∆LGZE in the Validation Cohort
4. Discussion
5. Conclusions
Supplementary Materials
Author Contributions
Funding
Institutional Review Board Statement
Informed Consent Statement
Data Availability Statement
Conflicts of Interest
Appendix A. Automatic FMISO Segmentation Using the Parotid Contour from Radiotherapy Planning
- Firstly, CT from radiotherapy planning is co-registered with FMISO-image by the corresponding CT and contralateral parotid contour (Vparotid) is transferred to all FMISOs.
- Then, for each voxel of Vparotid the intensities derived from the tree FMISOs (W0, W2 and W5) were multiplied and voxels that resulted in zero were removed from the contour. This step took into account the possibility of having part of the Vparotid out of the FMISO image.
- Finally, the background (Bgparotid) was defined selecting the voxels with highest uptake until filling a volume of 6 mL. By focusing on higher uptake voxels, we could minimized the partial volume effect (PVE) given in voxels in the peripheral zone of the body and the co-registration error. Additionally, a volume of 6 mL permitted to minimize the PVE in the computation of SUVmean.

Appendix B. Parameters Accounting for Spatial Overlapping
- Dice Similarity Coefficient (DSC) which represents the size of the union of two volumes [52]:(0: no spatial overlap, 1: complete overlap)
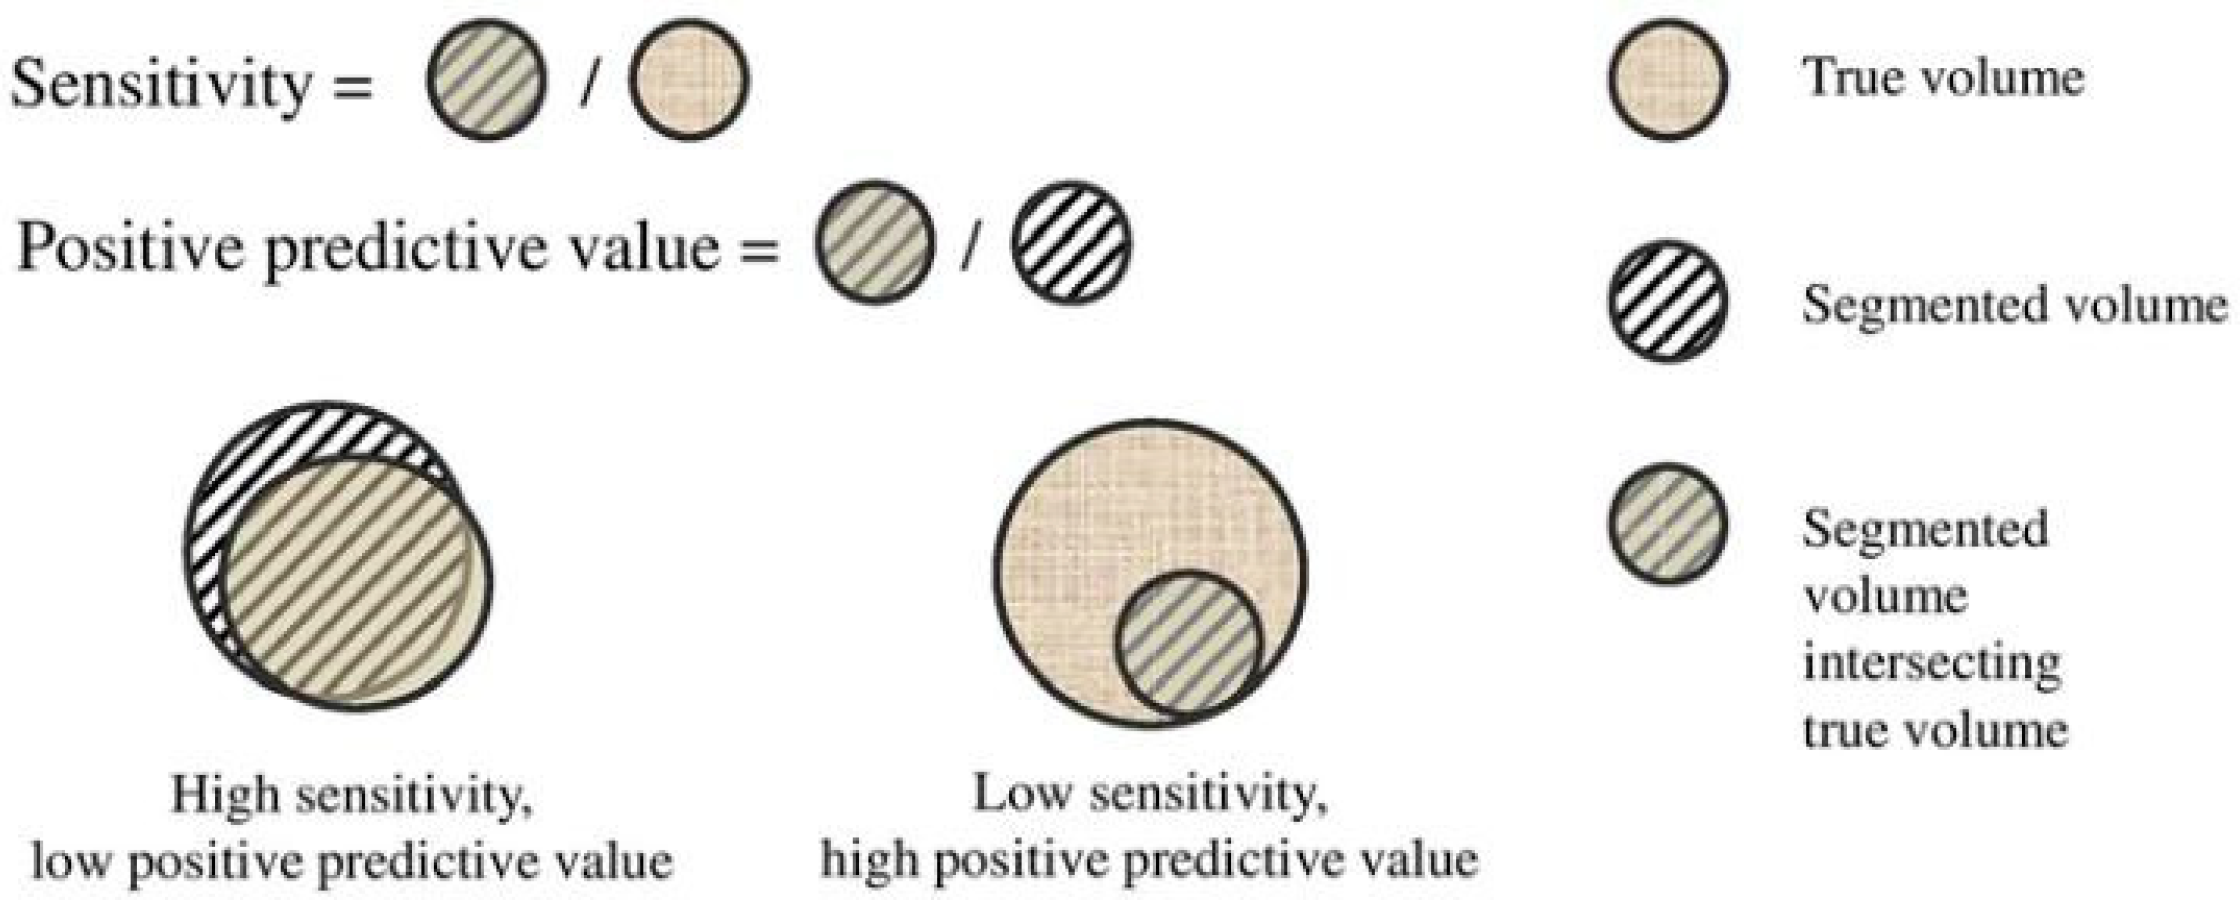
- Sensitivity (Sen.) and Positive Predictive Value (PPV). To take into account the false positives (FP: Error Type I) and false negatives (FN: Error Type II), Sen. and PPV are employed, Figure A2:where TP means true positives.
Appendix C. Radiomic Features with Predictive Value Independentl of the Time-Point during Treatment
References
- Nicolay, N.H.; Rühle, A.; Wiedenmann, N.; Niedermann, G.; Mix, M.; Weber, W.A.; Baltas, D.; Werner, M.; Kayser, G.; Grosu, A.-L. Lymphocyte Infiltration Determines the Hypoxia-Dependent Response to Definitive Chemoradiation in Head-and-Neck Cancer: Results from a Prospective Imaging Trial. J. Nucl. Med. 2021, 62, 471–478. [Google Scholar] [CrossRef]
- Narita, T.; Aoyama, H.; Hirata, K.; Onodera, S.; Shiga, T.; Kobayashi, H.; Murata, J.; Terasaka, S.; Tanaka, S.; Houkin, K. Reoxygenation of glioblastoma multiforme treated with fractionated radiotherapy concomitant with temozolomide: Changes defined by 18F-fluoromisonidazole positron emission tomography: Two case reports. Jpn. J. Clin. Oncol. 2012, 42, 120–123. [Google Scholar] [CrossRef] [PubMed] [Green Version]
- Spence, A.M.; Muzi, M.; Swanson, K.; O’Sullivan, F.; Rockhill, J.K.; Rajendran, J.G.; Adamsen, T.C.; Link, J.M.; Swanson, P.E.; Yagle, K.J.; et al. Regional Hypoxia in Glioblastoma Multiforme Quantified with [18F]Fluoromisonidazole Positron Emission Tomography before Radiotherapy: Correlation with Time to Progression and Survival. Clin. Cancer Res. 2008, 14, 2623–2630. [Google Scholar] [CrossRef] [Green Version]
- Chang, J.H.; Wada, M.; Anderson, N.J.; Lim Joon, D.; Lee, S.T.; Gong, S.J.; Gunawardana, D.H.; Sachinidis, J.; O’Keefe, G.; Gan, H.K.; et al. Hypoxia-targeted radiotherapy dose painting for head and neck cancer using 18F-FMISO PET: A biological modeling study. Acta Oncol. 2013, 52, 1723–1729. [Google Scholar] [CrossRef] [Green Version]
- Dirix, P.; Vandecaveye, V.; De Keyzer, F.; Stroobants, S.; Hermans, R.; Nuyts, S. Dose painting in radiotherapy for head and neck squamous cell carcinoma: Value of repeated functional imaging with 18F-FDG PET, 18F-fluoromisonidazole PET, diffusion-weighted MRI, and dynamic contrast-enhanced MRI. J. Nucl. Med. 2009, 50, 1020–1027. [Google Scholar] [CrossRef] [Green Version]
- Löck, S.; Perrin, R.; Seidlitz, A.; Bandurska-Luque, A.; Zschaeck, S.; Zöphel, K.; Krause, M.; Steinbach, J.; Kotzerke, J.; Zips, D.; et al. Residual tumour hypoxia in head-and-neck cancer patients undergoing primary radiochemotherapy, final results of a prospective trial on repeat FMISO-PET imaging. Radiother. Oncol. 2017, 124, 533–540. [Google Scholar] [CrossRef]
- Grkovski, M.; Lee, N.Y.; Schöder, H.; Carlin, S.D.; Beattie, B.J.; Riaz, N.; Leeman, J.E.; O’Donoghue, J.A.; Humm, J.L. Monitoring early response to chemoradiotherapy with 18F-FMISO dynamic PET in head and neck cancer. Eur. J. Nucl. Med. Mol. Imaging 2017, 44, 1682–1691. [Google Scholar] [CrossRef]
- Kumar, V.; Gu, Y.; Basu, S.; Berglund, A.; Eschrich, S.A.; Schabath, M.B.; Forster, K.; Aerts, H.J.W.L.; Dekker, A.; Fenstermacher, D.; et al. Radiomics: The process and the challenges. Magn. Reson. Imaging 2012, 30, 1234–1248. [Google Scholar] [CrossRef] [Green Version]
- Reuzé, S.; Schernberg, A.; Orlhac, F.; Sun, R.; Chargari, C.; Dercle, L.; Deutsch, E.; Buvat, I.; Robert, C. Radiomics in Nuclear Medicine Applied to Radiation Therapy: Methods, Pitfalls, and Challenges. Int. J. Radiat. Oncol. 2018, 102, 1117–1142. [Google Scholar] [CrossRef]
- Zwanenburg, A. Radiomics in nuclear medicine: Robustness, reproducibility, standardization, and how to avoid data analysis traps and replication crisis. Eur. J. Nucl. Med. Mol. Imaging 2019, 46, 2638–2655. [Google Scholar] [CrossRef]
- Scrivener, M.; de Jong, E.E.; van Timmeren, J.E.; Pieters, T.; Ghaye, B.; Geets, X. Radiomics applied to lung cancer: A review. Transl. Cancer Res. 2016, 5, 398–409. [Google Scholar] [CrossRef]
- Carles, M.; Fechter, T.; Radicioni, G.; Schimek-Jasch, T.; Adebahr, S.; Zamboglou, C.; Nicolay, N.; Martí-Bonmatí, L.; Nestle, U.; Grosu, A.; et al. FDG-PET Radiomics for Response Monitoring in Non-Small-Cell Lung Cancer Treated with Radiation Therapy. Cancers 2021, 13, 814. [Google Scholar] [CrossRef]
- Narang, S.; Lehrer, M.; Yang, D.; Lee, J.; Rao, A. Radiomics in glioblastoma: Current status, challenges and potential opportunities. Transl. Cancer Res. 2016, 5, 383–398. [Google Scholar] [CrossRef]
- Carles, M.; Popp, I.; Starke, M.M.; Mix, M.; Urbach, H.; Schimek-Jasch, T.; Eckert, F.; Niyazi, M.; Baltas, D.; Grosu, A.L. FET-PET radiomics in recurrent glioblastoma: Prognostic value for outcome after re-irradiation? Radiat. Oncol. 2021, 16, 1–10. [Google Scholar] [CrossRef]
- Koliogiannis, D.; Werner, J.; Hartwig, W. Pushing the limits in pancreatic cancer therapy. Transl. Cancer Res. 2016, 3, 1–3. [Google Scholar] [CrossRef]
- Zamboglou, C.; Carles, M.; Fechter, T.; Kiefer, S.; Reichel, K.; Fassbender, T.F.; Bronsert, P.; Koeber, G.; Schilling, O.; Ruf, J.; et al. Radiomic features from PSMA PET for non-invasive intraprostatic tumor discrimination and characterization in patients with intermediate-and high-risk prostate cancer—A comparison study with histology reference. Theranostics 2019, 9, 2595–2605. [Google Scholar] [CrossRef]
- Bittner, M.-I.; Grosu, A.-L. Hypoxia in Head and Neck Tumors: Characteristics and Development during Therapy. Front. Oncol. 2013, 3, 223. [Google Scholar] [CrossRef] [Green Version]
- Wiedenmann, N.; Bunea, H.; Rischke, H.C.; Bunea, A.; Majerus, L.; Bielak, L.; Protopopov, A.; Ludwig, U.; Büchert, M.; Stoykow, C.; et al. Effect of radiochemotherapy on T2* MRI in HNSCC and its relation to FMISO PET derived hypoxia and FDG PET. Radiat. Oncol. 2018, 13, 159. [Google Scholar] [CrossRef]
- Zips, D.; Zöphel, K.; Abolmaali, N.; Perrin, R.; Abramyuk, A.; Haase, R.; Appold, S.; Steinbach, J.; Kotzerke, J.; Baumann, M. Exploratory prospective trial of hypoxia-specific PET imaging during radiochemotherapy in patients with locally advanced head-andneck cancer. Radiother. Oncol. 2012, 105, 21–28. [Google Scholar] [CrossRef] [Green Version]
- Bittner, M.-I.; Wiedenmann, N.; Bucher, S.; Hentschel, M.; Mix, M.; Weber, W.A.; Grosu, A.-L. Exploratory geographical analysis of hypoxic subvolumes using 18F-MISO-PET imaging in patients with head and neck cancer in the course of primary chemoradiotherapy. Radiother. Oncol. 2013, 108, 511–516. [Google Scholar] [CrossRef]
- Orlhac, F.; Soussan, M.; Maisonobe, J.-A.; Garcia, C.A.; Vanderlinden, B.; Buvat, I. Tumor Texture Analysis in 18F-FDG PET: Relationships Between Texture Parameters, Histogram Indices, Standardized Uptake Values, Metabolic Volumes, and Total Lesion Glycolysis. J. Nucl. Med. 2014, 55, 414–422. [Google Scholar] [CrossRef] [PubMed] [Green Version]
- Carles, M.; Bach, T.; Torres-Espallardo, I.; Baltas, D.; Nestle, U.; Marti-Bonmati, L. Significance of the impact of motion compensation on the variability of PET image features. Phys. Med. Biol. 2018, 63, 065013. [Google Scholar] [CrossRef]
- Vallières, M.; Freeman, C.R.; Skamene, S.R.; El Naqa, I. A radiomics model from joint FDG-PET and MRI texture features for the prediction of lung metastases in soft-tissue sarcomas of the extremities. Phys. Med. Biol. 2015, 60, 5471–5496. [Google Scholar] [CrossRef]
- Leijenaar, R.T.; Nalbantov, G.; Carvalho, S.; Van Elmpt, W.J.; Troost, E.G.; Boellaard, R.; Aerts, H.J.; Gillies, R.J.; Lambin, P. The effect of SUV discretization in quantitative FDG-PET Radiomics: The need for standardized methodology in tumor texture analysis. Sci. Rep. 2015, 5, 11075. [Google Scholar] [CrossRef]
- Benjamini, Y.; Hochberg, Y. Controlling the False Discovery Rate—A Practical and Powerful Approach to Multiple Testing. J. R. Stat. Soc. Ser. B Methodol. 1995, 57, 289–300. [Google Scholar] [CrossRef]
- Lee, N.; Nehmeh, S.; Schöder, H.; Fury, M.; Chan, K.; Ling, C.C.; Humm, J. Prospective Trial Incorporating Pre-/Mid-Treatment [18F]-Misonidazole Positron Emission Tomography for Head-and-Neck Cancer Patients Undergoing Concurrent Chemoradiotherapy. Int. J. Radiat. Oncol. 2009, 75, 101–108. [Google Scholar] [CrossRef] [Green Version]
- Lambin, P.; Rios-Velazquez, E.; Leijenaar, R.; Carvalho, S.; van Stiphout, R.G.; Granton, P.; Zegers, C.M.; Gillies, R.; Boellard, R.; Dekker, A.; et al. Radiomics: Extracting more information from medical images using advanced feature analysis. Eur. J. Cancer 2012, 48, 441–446. [Google Scholar] [CrossRef] [Green Version]
- Rischin, D. Trans-Tasman Radiation Oncology Group Study 98.02. Prognostic significance of [18F]-misonidazole posi-tron emission tomography-detected tumor hypoxia in patients with advanced head and neck cancer randomly assigned to chemoradiation with or without tirapazamine: A substudy of Trans-Tasman Radiation Oncology Group Study 98.02. J. Clin. Oncol. 2006, 24, 2098–2104. [Google Scholar]
- Semenza, G.L. Hypoxia-Inducible Factors in Physiology and Medicine. Cell 2012, 148, 399–408. [Google Scholar] [CrossRef] [PubMed] [Green Version]
- Brizel, D.M.; Sibley, G.S.; Prosnitz, L.R.; Scher, R.L.; Dewhirst, M.W. Tumor hypoxia adversely affects the prognosis of carcinoma of the head and neck. Int. J. Radiat. Oncol. 1997, 38, 285–289. [Google Scholar] [CrossRef]
- Nordsmark, M.; Overgaard, J. A confirmatory prognostic study on oxygenation status and loco-regional control in advanced head and neck squamous cell carcinoma treated by radiation therapy. Radiother. Oncol. 2000, 57, 39–43. [Google Scholar] [CrossRef]
- Eschmann, S.-M.; Paulsen, F.; Reimold, M.; Dittmann, H.; Welz, S.; Reischl, G.; Machulla, H.-J.; Bares, R. Prognostic impact of hypoxia imaging with 18F-misonidazole PET in non-small cell lung cancer and head and neck cancer before radiotherapy. J. Nucl. Med. 2005, 46, 253–260. [Google Scholar]
- Rajendran, J.G.; Schwartz, D.L.; O’Sullivan, J.; Peterson, L.M.; Ng, P.; Scharnhorst, J.; Grierson, J.R.; Krohn, K.A. Tumor Hypoxia Imaging with [F-18] Fluoromisonidazole Positron Emission Tomography in Head and Neck Cancer. Clin. Cancer Res. 2006, 12, 5435–5441. [Google Scholar] [CrossRef] [PubMed] [Green Version]
- Kikuchi, M.; Yamane, T.; Shinohara, S.; Fujiwara, K.; Hori, S.; Tona, Y.; Yamazaki, H.; Naito, Y.; Senda, M. 18F-fluoromisonidazole positron emission tomography before treatment is a predictor of radiotherapy outcome and survival prognosis in patients with head and neck squamous cell carcinoma. Ann. Nucl. Med. 2011, 25, 625–633. [Google Scholar] [CrossRef]
- Carles, M.; Baltas, D.; Mix, M. PET Image features for their use in Radiomics: Selection criteria based on intrinsic complementarity with respect to volume and robustness with respect to system, metal artefacts and voxel size in image reconstruction. Nuklearmedizin 2019, 58, 76. [Google Scholar] [CrossRef]
- Carles, M.; Torres-Espallardo, I.; Alberich-Bayarri, A.; Olivas, C.; Bello, P.; Nestle, U.; Martí-Bonmatí, L. Evaluation of PET texture features with heterogeneous phantoms: Complementarity and effect of motion and segmentation method. Phys. Med. Biol. 2016, 62, 652. [Google Scholar] [CrossRef]
- Lin, Z.; Mechalakos, J.; Nehmeh, S.; Schoder, H.; Lee, N.; Humm, J.; Ling, C.C. The influence of changes in tumor hypoxia on dose-painting treatment plans based on18F-FMISO positron emission tomography. Int. J. Radiat. Oncol. Biol. Phys. 2008, 70, 1219–1228. [Google Scholar] [CrossRef] [Green Version]
- Nehmeh, S.A.; Lee, N.Y.; Schröder, H.; Squire, O.; Zanzonico, P.B.; Erdi, Y.; Greco, C.; Mageras, G.; Pham, H.S.; Larson, S.M.; et al. Reproducibility of Intratumor Distribution of 18F-Fluoromisonidazole in Head and Neck Cancer. Int. J. Radiat. Oncol. 2008, 70, 235–242. [Google Scholar] [CrossRef] [Green Version]
- Okamoto, S.; Shiga, T.; Yasuda, K.; Ito, Y.M.; Magota, K.; Kasai, K.; Kuge, Y.; Shirato, H.; Tamaki, N. High reproducibility of tumor hypoxia evaluated by 18F-fluoromisonidazole PET for head and neck cancer. J. Nucl. Med. 2013, 54, 201–207. [Google Scholar] [CrossRef] [Green Version]
- Welz, S.; Mönnich, D.; Pfannenberg, C.; Nikolaou, K.; Reimold, M.; La Fougère, C.; Reischl, G.; Mauz, P.-S.; Paulsen, F.; Alber, M.; et al. Prognostic value of dynamic hypoxia PET in head and neck cancer: Results from a planned interim analysis of a randomized phase II hypoxia-image guided dose escalation trial. Radiother. Oncol. 2017, 124, 526–532. [Google Scholar] [CrossRef]
- Pigorsch, S.U.; Wilkens, J.J.; Kampfer, S.; Kehl, V.; Hapfelmeier, A.; Schläger, C.; Bier, H.; Schwaiger, M.; Combs, S.E. Do selective radiation dose escalation and tumour hypoxia status impact the loco-regional tumour control after radio-chemotherapy of head & neck tumours? The ESCALOX protocol. Radiat. Oncol. 2017, 12, 45. [Google Scholar] [CrossRef] [Green Version]
- Saksø, M.; Jensen, K.; Andersen, M.; Hansen, C.R.; Eriksen, J.G.; Overgaard, J. DAHANCA 28: A phase I/II feasibility study of hyperfractionated, accelerated radiotherapy with concomitant cisplatin and nimorazole (HART-CN) for patients with locally advanced, HPV/p16-negative squamous cell carcinoma of the oropharynx, hypopharynx, larynx and oral cavity. Radiother. Oncol. 2020, 148, 65–72. [Google Scholar]
- Carles, M.; Fechter, T.; Martí-Bonmatí, L.; Baltas, D.; Mix, M. Experimental phantom evaluation to identify robust positron emission tomography (PET) radiomic features. EJNMMI Phys. 2021, 8, 1–17. [Google Scholar] [CrossRef]
- Lan, M.; Huang, Y.; Chen, C.Y.; Han, F.; Wu, S.X.; Tian, L.; Zheng, L.; Lu, T.X. Prognostic value of cervical nodal necrosis in nasopharyngeal carcinoma: Analysis of 1800 patients with positive cervical nodal metastasis at MR imaging. Radiology 2015, 276, 536–544. [Google Scholar] [CrossRef] [Green Version]
- Baik, J.S.; Jung, J.-Y.; Jee, W.-H.; Chun, C.-W.; Kim, S.K.; Shin, S.H.; Chung, Y.G.; Jung, C.K.; Kannengiesser, S.; Sohn, Y. Differentiation of focal indeterminate marrow abnormalities with multiparametric MRI. J. Magn. Reson. Imaging 2017, 46, 49–60. [Google Scholar] [CrossRef]
- Rasey, J.S.; Krohn, K.A.; Grunbaum, Z.; Conroy, P.J.; Bauer, K.; Sutherland, R.M. Further characterization of 4-bromomisonidazole as a potential detector of hypoxic cells. Radiat. Res. 1985, 102, 76–85. [Google Scholar] [CrossRef] [PubMed]
- Franko, A.J.; Sutherland, R.M. Rate of death of hypoxic cells in multicell spheroids [Effects of hypoxia on survival and radiosensitivity of spheroids; hypoxic cells of which are models of cells within solid tumors]. Radiat. Res. 1978, 76, 3574805. [Google Scholar]
- Shimizu, S.; Eguchi, Y.; Kamiike, W.; Itoh, Y.; Hasegawa, J.I.; Yamabe, K.; Otsuki, Y.; Matsuda, H.; Tsujimoto, Y. Induction of apoptosis as well as necrosis by hypoxia and predominant prevention of apoptosis by Bcl-2 and Bcl-XL. Cancer Res. 1996, 56, 2161–2166. [Google Scholar]
- Warren, S.; Partridge, M.; Bolsi, A.; Lomax, A.J.; Hurt, C.; Crosby, T.; Hawkins, M.A. An Analysis of Plan Robustness for Esophageal Tumors: Comparing Volumetric Modulated Arc Therapy Plans and Spot Scanning Proton Planning. Int. J. Radiat. Oncol. 2016, 95, 199–207. [Google Scholar] [CrossRef] [Green Version]
- Royston, P.; Altman, D.G. External validation of a Cox prognostic model: Principles and methods. BMC Med. Res. Methodol. 2013, 13, 33. [Google Scholar] [CrossRef] [PubMed] [Green Version]
- Harrell, F.E.; Califf, R.M.; Pryor, D.B.; Lee, K.L.; Rosati, R.A. Evaluating the Yield of Medical Tests. JAMA 1982, 247, 2543–2546. [Google Scholar] [CrossRef]
- Zou, K.H.; Warfield, S.K.; Bharatha, A.; Tempany, C.M.; Kaus, M.R.; Haker, S.J.; Wells, W.M., III; Jolesz, F.A.; Kikinis, R. Statistical validation of image segmentation quality based on a spatial overlap index1: Scientific reports. Acad. Radiol. 2004, 11, 178–189. [Google Scholar] [CrossRef] [Green Version]


| Clinical Characteristics | Initial Cohort (n = 25) | Validation Cohort (n = 10) |
|---|---|---|
| Clinical Trial Register | DRKS00003830 | DRKS00003830 |
| Age (years, mean ± standard deviation, range) | (59 ± 8, 41–79) | (63 ± 9, 48–76) |
| Sex Female/Male | 2 (8%)/23 (92%) | 2 (20%)/8 (80%) |
| Smoker (yes) | 20 (80%) | 9 (90%) |
| HPV-Status (positive) | 6 (24%) | 4 (40%) |
| T-Stage (*) T2/T3/T4 | 1 (4%)/8 (32%)/16 (64%) | 1 (10%)/5 (50%)/4 (40%) |
| T-Site oral cavity/oropharynx/hypopharynx/larynx/ | 2 (8%)/9 (36%)/8 (32%)/1 (4%)/5 (20%) | 1 (10%)/6 (60%)/1 (10%)/0 (0%)/2 (20%) |
| N-Stage N0/N1/N2b/N2c/N3 | 2 (8%)/1 (4%)/5 (20%)/17 (68%)/0 (0%) | 0 (0%)/2 (20%)/2 (20%)/5 (50%)/1 (10%) |
| Local Recurrence (yes) * | 12 (48%) | 1 (10%) |
| Distant Metastasis (yes) | 6 (24%) | 3 (30%) |
| Progression Free Survival * (months, mean ± standard deviation, range) | (22 ± 19, 3–61) | (8 ± 7, 0–24) |
| Overall Survival * (months, mean ± standard deviation, range) | (32 ± 16, 5–61) | (11 ± 8, 0–24) |
| Parameters | Overall Survival W2/W5 | Progression Free Survival W2/W5 | Local Recurrence W2/W5 | Distant Metastasis W2/W5 |
|---|---|---|---|---|
| Relative volume difference (∆V) | n.s./n.s. | n.s./n.s. | n.s./0.026 | n.s./n.s. |
| Dice Similarity Coefficient (DICE) | 0.049/n.s. | 0.004/n.s. | 0.004/n.s. | 0.018/n.s. |
| Positive Predictive Value (PPV) | n.s./n.s. | n.s./0.046 | n.s./0.046 | n.s./n.s. |
| Sensitivity (Sens.) | n.s./n.s. | n.s./n.s. | n.s./n.s. | n.s./n.s. |
| Classification Parameter (CP) | n.s./n.s. | 0.018/0.035 | n.s./0.041 | n.s./0.043 |
| Time Point | Overall Survival | Local Recurrence | Distant Metastasis | Progression Free Survival |
|---|---|---|---|---|
| W2 | 6 | 17 | 2 | 10 |
| confirmed at W5 | 0 | 15 | 0 | 3 |
| Time-Point | CP | ∆CCM | ∆LGZE |
|---|---|---|---|
| W2 | p = 0.19 | p = 0.49 | AUC = 0.78 specificity = 0.89 |
| W5 | p = 0.009 | p = 0.29 | AUC = 0.79 specificity = 0.76 |
Publisher’s Note: MDPI stays neutral with regard to jurisdictional claims in published maps and institutional affiliations. |
© 2021 by the authors. Licensee MDPI, Basel, Switzerland. This article is an open access article distributed under the terms and conditions of the Creative Commons Attribution (CC BY) license (https://creativecommons.org/licenses/by/4.0/).
Share and Cite
Carles, M.; Fechter, T.; Grosu, A.L.; Sörensen, A.; Thomann, B.; Stoian, R.G.; Wiedenmann, N.; Rühle, A.; Zamboglou, C.; Ruf, J.; et al. 18F-FMISO-PET Hypoxia Monitoring for Head-and-Neck Cancer Patients: Radiomics Analyses Predict the Outcome of Chemo-Radiotherapy. Cancers 2021, 13, 3449. https://doi.org/10.3390/cancers13143449
Carles M, Fechter T, Grosu AL, Sörensen A, Thomann B, Stoian RG, Wiedenmann N, Rühle A, Zamboglou C, Ruf J, et al. 18F-FMISO-PET Hypoxia Monitoring for Head-and-Neck Cancer Patients: Radiomics Analyses Predict the Outcome of Chemo-Radiotherapy. Cancers. 2021; 13(14):3449. https://doi.org/10.3390/cancers13143449
Chicago/Turabian StyleCarles, Montserrat, Tobias Fechter, Anca L. Grosu, Arnd Sörensen, Benedikt Thomann, Raluca G. Stoian, Nicole Wiedenmann, Alexander Rühle, Constantinos Zamboglou, Juri Ruf, and et al. 2021. "18F-FMISO-PET Hypoxia Monitoring for Head-and-Neck Cancer Patients: Radiomics Analyses Predict the Outcome of Chemo-Radiotherapy" Cancers 13, no. 14: 3449. https://doi.org/10.3390/cancers13143449
APA StyleCarles, M., Fechter, T., Grosu, A. L., Sörensen, A., Thomann, B., Stoian, R. G., Wiedenmann, N., Rühle, A., Zamboglou, C., Ruf, J., Martí-Bonmatí, L., Baltas, D., Mix, M., & Nicolay, N. H. (2021). 18F-FMISO-PET Hypoxia Monitoring for Head-and-Neck Cancer Patients: Radiomics Analyses Predict the Outcome of Chemo-Radiotherapy. Cancers, 13(14), 3449. https://doi.org/10.3390/cancers13143449