Article

Is Hypoxia a Factor Influencing PSMA-Directed Radioligand Therapy?—An In Silico Study on the Role of Chronic Hypoxia in Prostate Cancer

1
Department of Nuclear Medicine, Inselspital, University of Bern, 3010 Bern, Switzerland
2
Department of Nuclear Medicine, Klinikum Rechts der Isar, School of Medicine, Technical University of Munich, 81675 München, Germany
3
Institute of Pathology, School of Medicine, Technical University of Munich, 81675 München, Germany
*
Author to whom correspondence should be addressed.
These authors contributed equally to this work.
Cancers 2021, 13(14), 3429; https://doi.org/10.3390/cancers13143429
Submission received: 6 May 2021 / Revised: 28 June 2021 / Accepted: 3 July 2021 / Published: 8 July 2021
(This article belongs to the Special Issue Novel Perspectives on Hypoxia in Cancer)

Abstract

:

Simple Summary

Tumor hypoxia is considered a critical factor associated with the resistance of conventional radiotherapy, where the X-ray-induced free radicals lead to DNA damage in a manner that is strongly dependent on the tissue oxygenation. The emerging PSMA-directed radioligand therapy (RLT) employs the α or β particles emitted by the radiopharmaceuticals to kill the tumor cells. In contrast to conventional therapy, the induced DNA damage is less dependent on the oxygenation status. Less attention has been paid to investigating whether tumor hypoxia will influence the efficacy of PSMA-directed RLT. We propose a histology-driven in silico model to quantitatively investigate the influence of tumor hypoxia on the treatment outcome for PSMA-directed RLT with 177 Lu and 225 Ac. Our finding suggests that hypoxia is a factor to be considered for the application of PSMA-directed RLT.

Abstract

Radioligand therapy (RLT) targeting prostate specific-membrane antigen (PSMA) is an emerging treatment for metastatic castration-resistant prostate cancer (mCRPC). It administrates 225 Ac- or 177 Lu-labeled ligands for the targeted killing of tumor cells. Differently from X- or γ -ray, for the emitted α or β particles the ionization of the DNA molecule is less dependent on the tissue oxygenation status. Furthermore, the diffusion range of electrons in a tumor is much larger than the volume typically spanned by hypoxic regions. Therefore, hypoxia is less investigated as an influential factor for PSMA-directed RLT, in particular with β emitters. This study proposes an in silico approach to theoretically investigate the influence of tumor hypoxia on the PSMA-directed RLT. Based on mice histology images, the distribution of the radiopharmaceuticals was simulated with an in silico PBPK-based convection–reaction–diffusion model. Three anti-CD31 immunohistochemistry slices were used to simulate the tumor microenvironment. Ten regions of interest with varying hypoxia severity were analyzed. A kernel-based method was developed for dose calculation. The cell survival probability was calculated according to the linear-quadratic model. The statistical analysis performed on all the regions of interest (ROIs) shows more heterogeneous dose distributions obtained with 225 Ac compared to 177 Lu. The higher homogeneity of 177 Lu-PSMA-ligand treatment is due to the larger range covered by the emitted β particles. The dose-to-tissue histogram (DTH) metric shows that in poorly vascularized ROIs only 10% of radiobiological hypoxic tissue receives the target dose using 177 Lu-PSMA-ligand treatment. This percentage drops down to 5% using 225 Ac. In highly vascularized ROIs, the percentage of hypoxic tissue receiving the target dose increases to more than 85% and 65% for the 177 Lu and 225 Ac-PSMA-ligands, respectively. The in silico study demonstrated that the reduced vascularization of the tumor strongly influences the dose delivered by PSMA-directed RLT, especially in hypoxic regions and consequently the treatment outcome.

1. Introduction

Hypoxia is an oxygen deprivation state within a region of a tissue or an organ that induces a complex systemic and cellular response [1]. In tumors, hypoxic regions arise from abnormal tumor vessel structure and function, limiting perfusion to the tissue [2]. Chronic hypoxia is a quasi-steady state condition principally due to the spatial disorganization of tumor vessels that can create large inter-capillary distances surpassing the oxygen diffusion range [3]. Tumor hypoxia is considered as one of the main resistance factors for radiotherapy [4].
Radiation therapy (RT) is among the most important and common techniques that are adopted for cancer treatment. The aim of radiotherapy consists in killing cancer cells with the use of ionizing radiations that are able to spare the healthy tissue surrounding the tumor volume. Ionizing radiation primarily affects the cell by breaking covalent bonds within the genomic DNA. Strand breaks can be subdivided into single-strand breaks (SSB) and double-strand breaks (DSB), where opposite strands are damaged in close proximity. DNA double-strand breaks are widely accepted as the key driver of radiobiological effects in cells. While the yield of DSBs is linear over a dose range spanning from 1 mGy to 100 Gy [5], another important role is played by the type of particles used for the treatment. Indeed, heavy charged particles such as protons or α particles deposit their energy in a dramatically lower range with respect to photons or electrons. The quantity that defines the amount of energy delivered in a space unit is the linear energy transfer (LET). To a higher LET corresponds a denser distribution of ionizations in DNA and thus a greater level of biological damages [6,7]. A substantial secondary effect is the generation of reactive oxygen species (ROS) that hinder normal cellular functions by oxidizing proteins, lipids, and DNA. Cumulatively, the two different mechanisms cause cell lethality and mitotic failure. In a hypoxic environment, there is a lack of substrate for ROS generation [8]. The enhancing effect of oxygen on radiation-induced damage can be quantified by the oxygen-enhancement ratio (OER). The oxygen-enhancement ratio is defined as the ratio of the doses needed to produce a given level of injury in the absence and presence of oxygen. OER is particle dependent and it is an important factor to consider for the tumor control probability [9].
The last decades have witnessed rapid acceleration in the impact of tumor-targeted radioligand therapy (RLT). Promising results have been obtained in the treatment of metastatic castration-resistant prostate cancer (mCRPC), known for its high morbidity and mortality [10]. Prostate carcinoma is characterized by the increased expression of the specific type II transmembrane glycoprotein named prostate-specific membrane antigen (PSMA) [11]. Several studies have demonstrated the efficacy and safety of RLT for the treatment of mCRPC performed with Lutetium-177 ( 177 Lu-PSMA-ligands) [12,13]. A recent meta-analysis shows biochemical and radiological responses in 46% and 37% of the patients, respectively [14]. Despite the early success, due to the relatively low linear energy transfer (LET) the β particle emitted by 177 Lu causes mostly single-strained DNA breaks leading to treatment resistance. A more potent alternative is represented by the α -emitter Actinium-225 ( 225 Ac-PSMA-ligands). The α particles emitted by 225 Ac, with LET (∼100 keV/ μ m ) 500 times higher compared to the β particle emitted by 177 Lu, induces with a higher probability a double-strand break of the DNA [15,16]. A recent meta-analysis on 225 Ac-PSMA-ligands therapy indicates a remarkable efficacy of this targeted approach, with a response rates that exceed those published for 177 Lu-PSMA RLT [17]. Coherently with other solid tumors, hypoxic regions exist in prostate cancer, with a degree comparable to other malignancies [18,19,20,21]. Furthermore, hypoxia in prostate cancer has been demonstrated to correlate with increased tumor invasiveness, metastasis, and resistance to chemotherapy and radiotherapy [21]. In addition to factors common for all radiation-based treatments, the efficacy of radioligand therapy also depends on the ability of the radiopharmaceutical to reach and bind its target. The irregular spatial distribution of the vessels within the tumor makes certain regions difficult for the therapeutic to reach the cancer cells. While not directly a consequence of hypoxia, the lack of oxygen in a region is highly correlated to the inability of other molecules to reach it and could be considered an indirect effect on the treatment outcome [3]. Due to above-mentioned effects of hypoxia, a treatment plan should ideally consider the hypoxia severity of the tumor and optimize the treatment accordingly. Indeed, the reduced range of α particles in human tissues, i.e., ∼50 μ m for α particles emitted by 225 Ac with respect to ∼ 1.6 mm for β particles emitted by 177 Lu, can strongly reduce the cross-fire effect in large tumors with poorly vascularized regions.
The complementary advantages of α and β -emitting RLTs lead to the concept of “cocktail treatment” to maximize the antitumoral effect. However, determining the local oxygen and drug distribution within a clinical setting is challenging and it remains unclear how such a cocktail treatment should be formulated and the potential treatment outcome. In the past decades, systems medicine has emerged as a tool to facilitate hypothesis generation, data integration, and patient-specific therapeutic development. Systems medicine has already been applied for the development of multi-modal imaging strategies [22]. Numerical investigations have been conducted to model the distribution of hypoxia in tumor microenvironment [23,24,25,26,27,28,29]. In these studies hypoxia is indirectly estimated by establishing the computational model on the microvascular distribution [23,24,25]. The results have been reported to be consistent with experimental measurements [26,27,28,29] and this strategy is often used in theoretical investigation of phenomena related to tumor hypoxia (e.g., imaging) [26,27,28,29]. However, the underlying assumption that hypoxia is induced by the limited oxygen diffusion in poorly vascularized tumor micro-areas constrains the microvasculature-based modeling mainly to chronic hypoxia [26,27,28,29]. In this work we propose an in silico modeling based on physiologically-based pharmaco-kinetic (PBPK) models to study the effect of chronic hypoxia on the treatment outcome in RLT for prostate cancer. The effect of chronic hypoxia is also examined in the context of radiobiological efficacy.

2. Materials and Methods

2.1. Animal Experiments

The PSMA-positive prostate carcinoma cell line LNCaP (purchased from the ATCC) was cultivated at 37 C in a humidified 5% CO 2 atmosphere using RPMI 1640 medium supplemented with 10% (v/v) FBS and Pen-Strep [30,31]. Animal experiments were conducted with permission from the District Government of Upper Bavaria (application No.: 55.2-1-54-2532-216-15) according to the guidelines for the welfare and use of animals in cancer research. Male CB17-SCID mice at an age of 6 weeks were purchased from Charles River Laboratories (Wilmington, MA, USA) and held under specific pathogen free (SPF) conditions. Tumor inoculation was performed by mixing a cell suspension containing 5 × 10 6 LNCaP cells 1:1 (v/v) with Matrigel (Corning, NY, USA) and subsequent subcutaneous injection above the shoulder. When tumors had reached ∼1 cm in size, the animals were sacrificed, xenograft tumors were excised and fixed in 10% (v/v) neutral-buffered formalin solution (Otto Fischar, Saarbrücken, Germany).

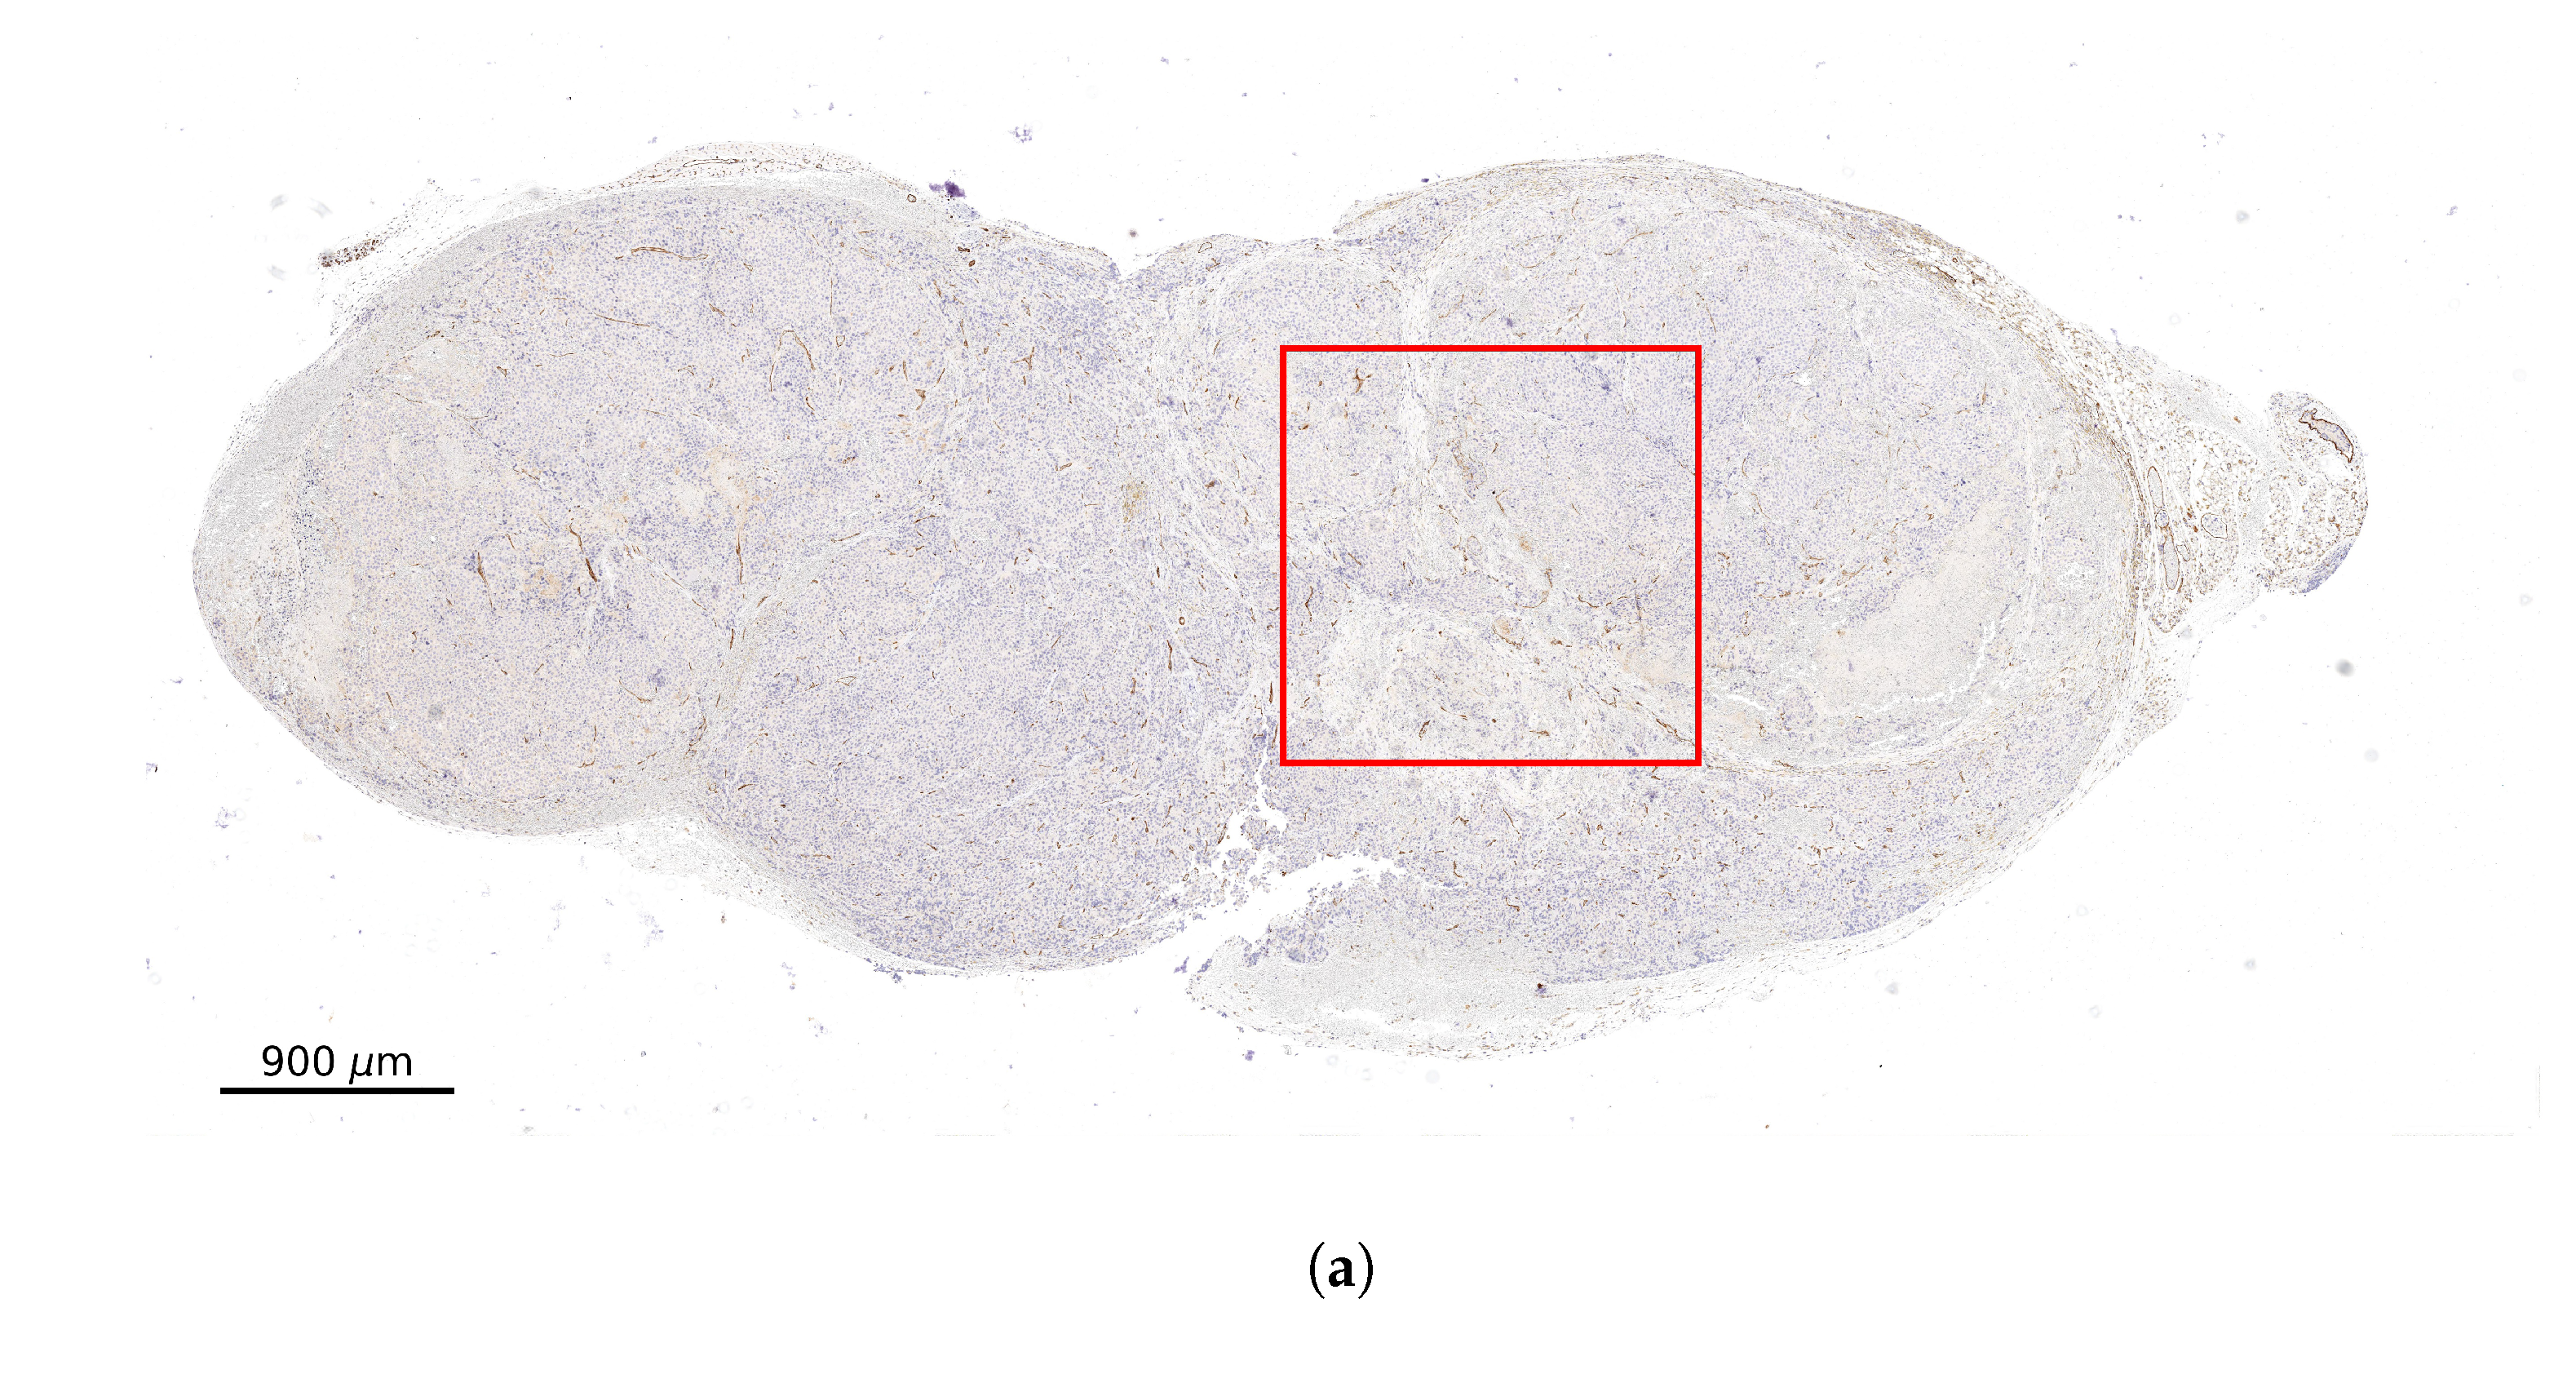
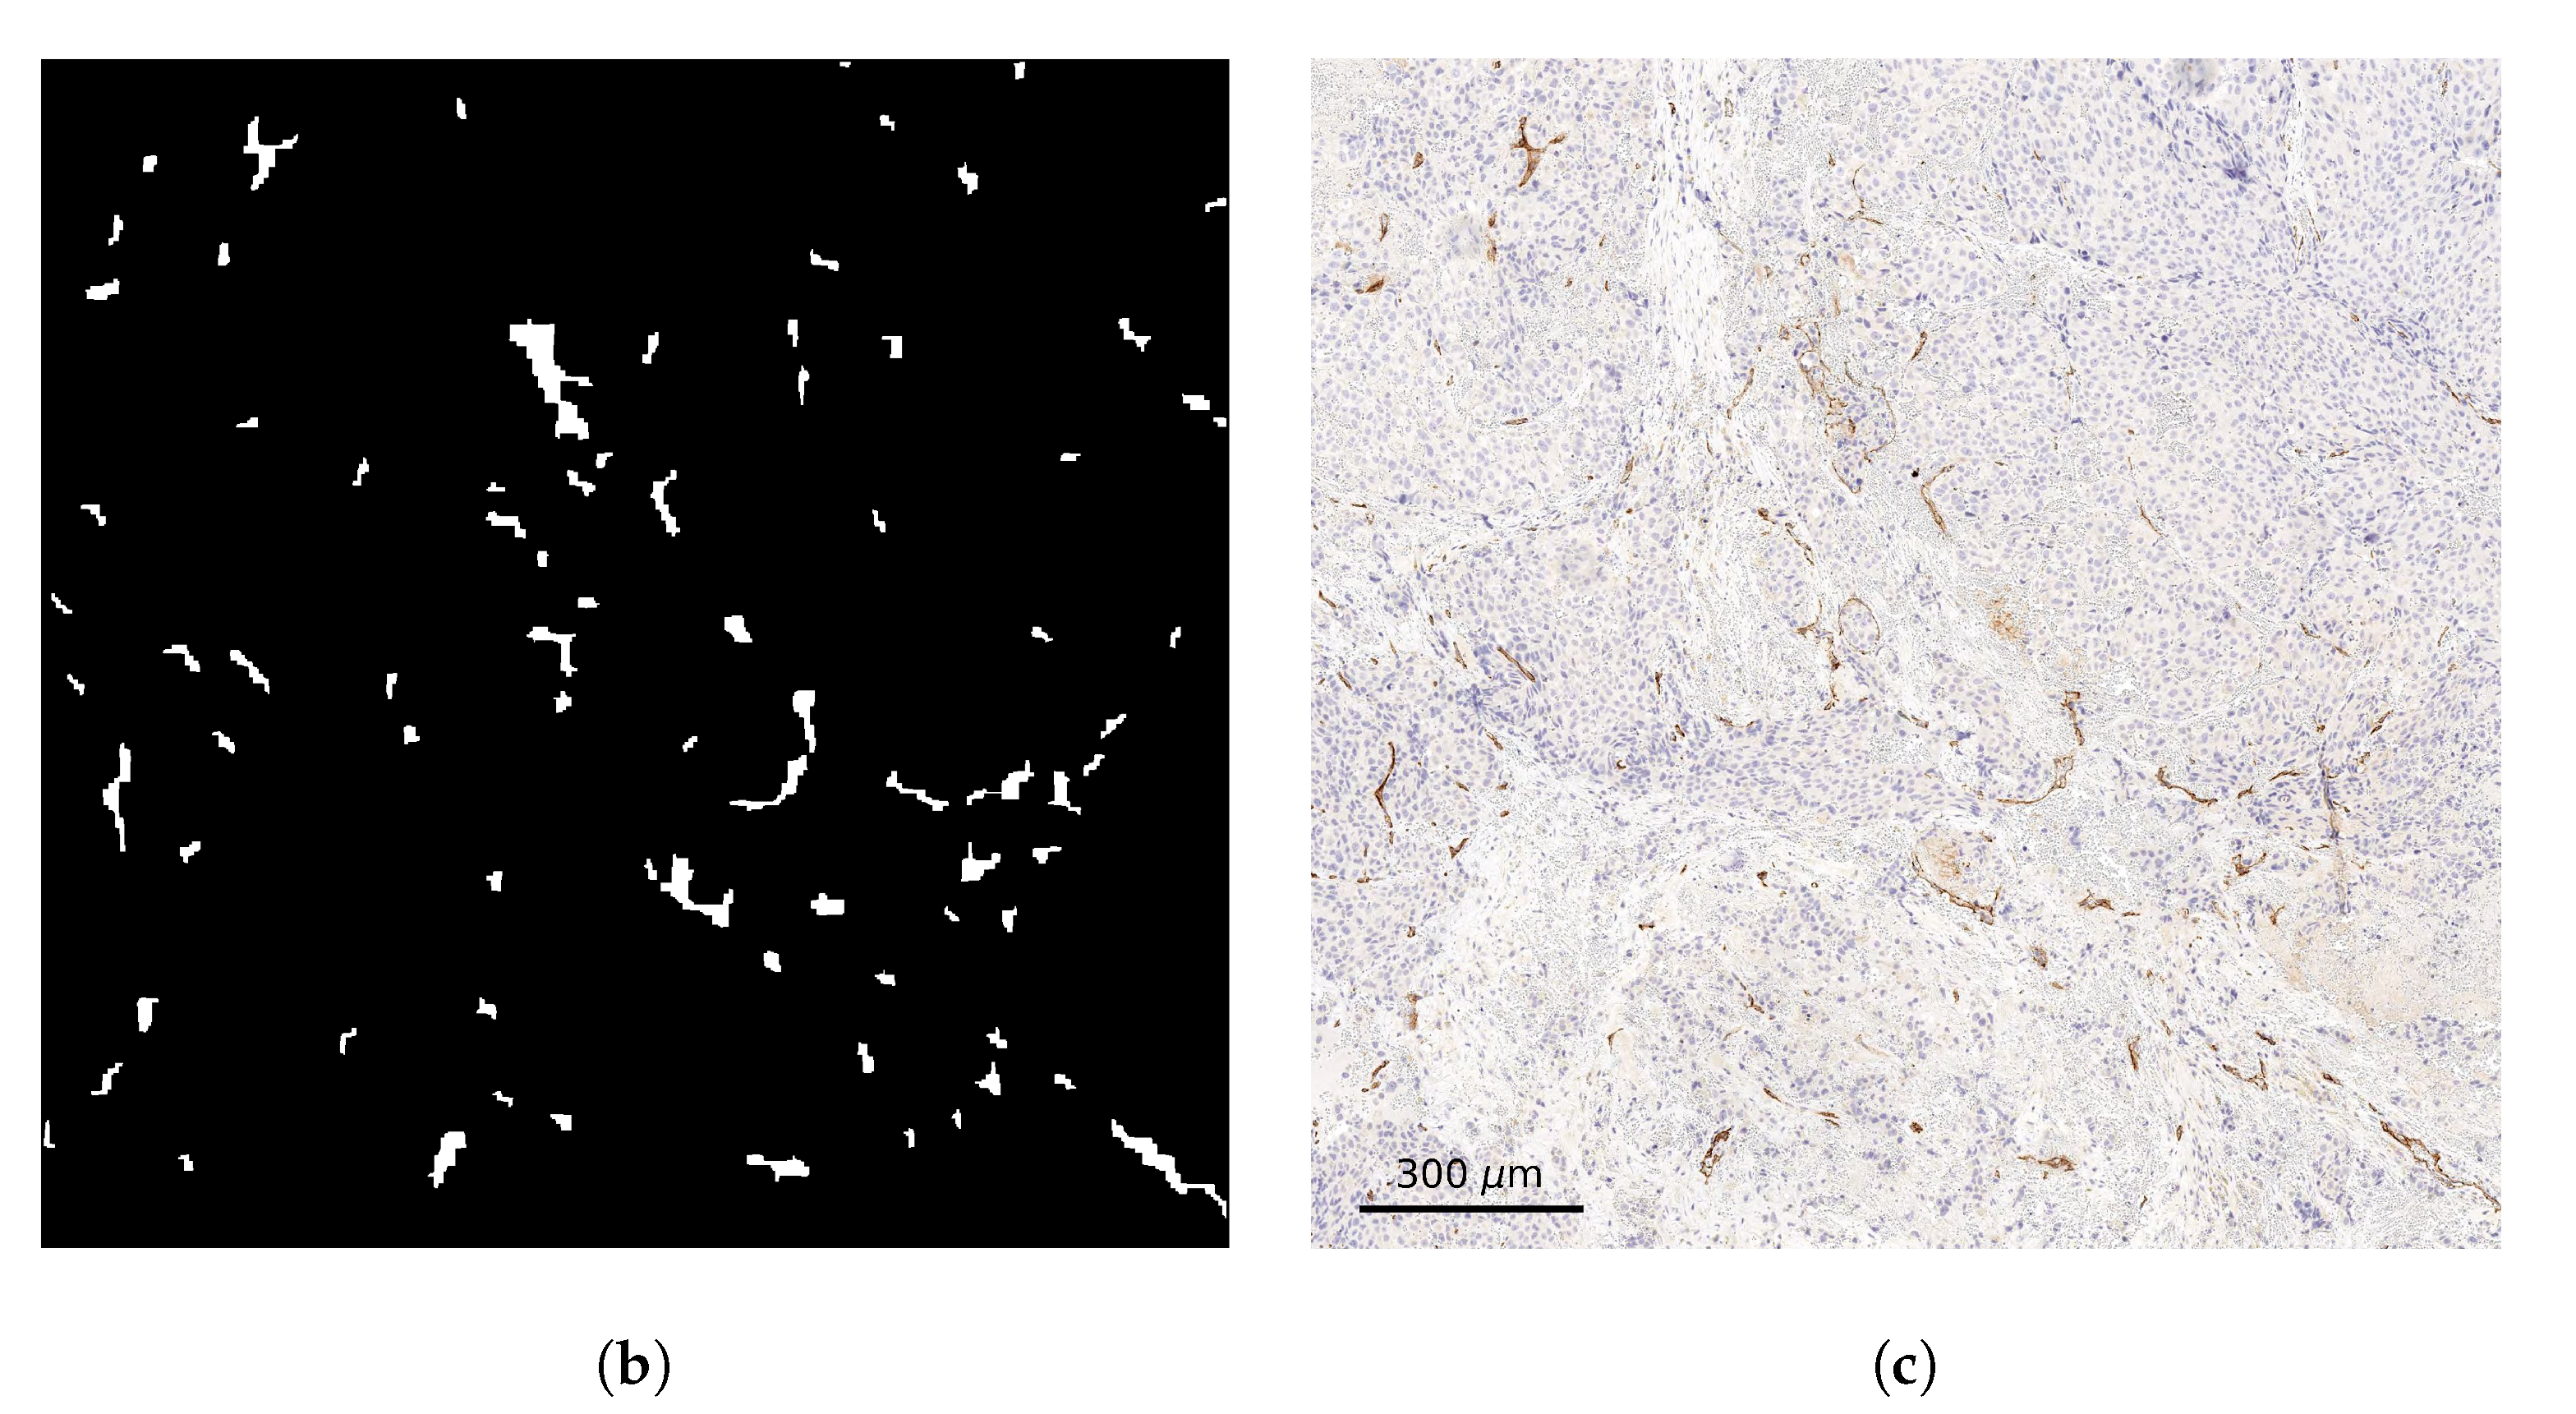
2.2. Stained Tumor Sections

The formalin-fixed, paraffin-embedded (FFPE) tissue was used to prepare consecutive 2 μ m sections using a microtome (Microm). The immunohistochemistry (IHC) for CD31 (vessel endothelium) was performed with a primary rabbit anti-CD31 antibody (Abcam ab28364, 1:50) processed and detected on a Bond RXm system (Leica) with a polymer detection kit (without post primary antibody). The tissue was deparaffinized, pretreated with hydrogen-peroxide, incubated with the primary antibody for 15 min at room temperature, and the detection was performed with an anti-rabbit HRP polymer and DAB. Counterstaining was performed with hematoxylin. The slides were then dehydrated and coverslipped. Positive staining occurred as a dark-brown precipitate.

2.3. Computational Domain and Vessel Map Generation

The computational domain is based on xenografts. The following steps were used for processing three different images of tissue slices that were immunohistochemically stained for vessel endothelium. As a first step, ten different regions of interest (ROIs) of 1.6 × 1.6 mm 2 have been identified on the stained histology slices (Figure 1a). The ROIs have been selected in order to simulate the radiopharmaceuticals distribution in domains with different degrees of vascularisation. The selected ROIs have been binarized with the use of the automated Huang threshold method implemented in ImageJ (V.2.1.0) [32]. The threshold parameters have been adjusted in order to obtain the best vessels to background ratio. As a second step a specifically coded Python program has been used to clean the residual noise keeping only the vessels contours. The Python script can be downloaded by the reader (https://www.dropbox.com/sh/fy5ud6f7vovh4ty/AABPbDhbONdqus4OAJEFNUmGa?dl=0, accessed date 13 June 2021). The resulting image shown in Figure 1b is used as the computational domain. For each ROI a visual comparison of the obtained vessel contours with respect to the original image has been performed in order to assure the robustness of the algorithm. The vascular fraction of the domains spans between 1.0% and 3.2% with a mean value of 2.1%. The vascular fraction in the ROIs are comparable with other published values [33,34].

2.4. Multi-Scale Spatial-Temporal Models of PSMA-Ligands Dynamics

As shown in Section 2.3, the computational domain consists of extravascular space interspersed by vessels, which constitute holes in the mesh. The tumor tissue, i.e., the extravascular space, is assumed to be homogeneously divided into two sub-compartments: The interstitial compartment where the labelled PSMA-ligands can move and bind to the cells surface and the cellular compartment. The radiopharmaceutical enters the tumour interstitium from the vasculature. It is then transported through the interstitial volume by diffusion down concentration gradients and convection from regions of high to low interstitial fluid pressure (IFP). Finally, it exits via cellular uptake and backflow into the vasculature. The flux density of PSMA-ligands across vessel walls, J v (nmol s 1 cm 2 ), is assumed to be proportional to the difference between the concentrations on the vascular C v (nmol ml 1 ) and the interstitium C i side:
J v = L v ( C v C i )
where L v (cm s 1 ) represents the vessel wall permeability to PSMA-ligands. The spatio-temporal evolution of the interstitial PSMA-ligands concentration can be described by a convection–reaction–diffusion (CRD) equation as:
t C i = · ( D PSMA C i ) · ( v R f C i ) k on C i ( R 0 C b ) + k off C b λ dec C i
where D PSMA is the diffusivity of PSMA-ligands, R f is the movement coefficient between the molecule and its carrier, the terms · ( D PSMA C i ) and · ( v R f C i ) describe changes in interstitial radiopharmaceutical concentration due to diffusion and convection, k on (cm 3 nmol 1 s 1 ) and k off (s 1 ) are, respectively, the association and dissociation rates, C b is the bounded radiopharmaceutical concentration (nmol ml 1 ), R 0 (nmol ml 1 ) is the PSMA binding sites density and λ dec (s 1 ) is the radionuclide decay constant. The labelled molecule has a high-binding affinity for PSMA expressed on the prostate cancer cell surface. Moreover, PSMA undergoes an internalisation process that allows the radionuclide to be concentrated within the cell [35]. Demanding mass conservation and assuming first-order kinetics, the rates of change of bounded and internalized PSMA-ligands concentrations, C int , can be written as
t C b = k on C i ( R 0 C b ) k off C b k int C b λ dec C b ,
t C int = k int C b F V i / F V c k rel C int λ dec C int ,
where k int (s 1 ) and k rel (s 1 ) are the internalization and the release rates, respectively, and F V i and F V c are the fractional volumes of tumour interstitium and cells within a voxel, respectively. The radiopharmaceutical flux across the vessel walls is modelled via Neumann boundary conditions imposed on the vessel boundaries as
n · ( D PSMA C i ) = J v
where n is the normal unit vector to the respective boundary segment. No-flux boundary conditions were applied to the edges of the vessel map. Table 1 lists the parameter estimates deduced from the literature [36,37,38]. The 177 Lu-PSMA-ligands and 225 Ac-PSMA-ligands distributions in tumor microenvironment have been calculated by numerically solving the model presented above with a finite element method (FEM) implemented in FreeFem++ [39].

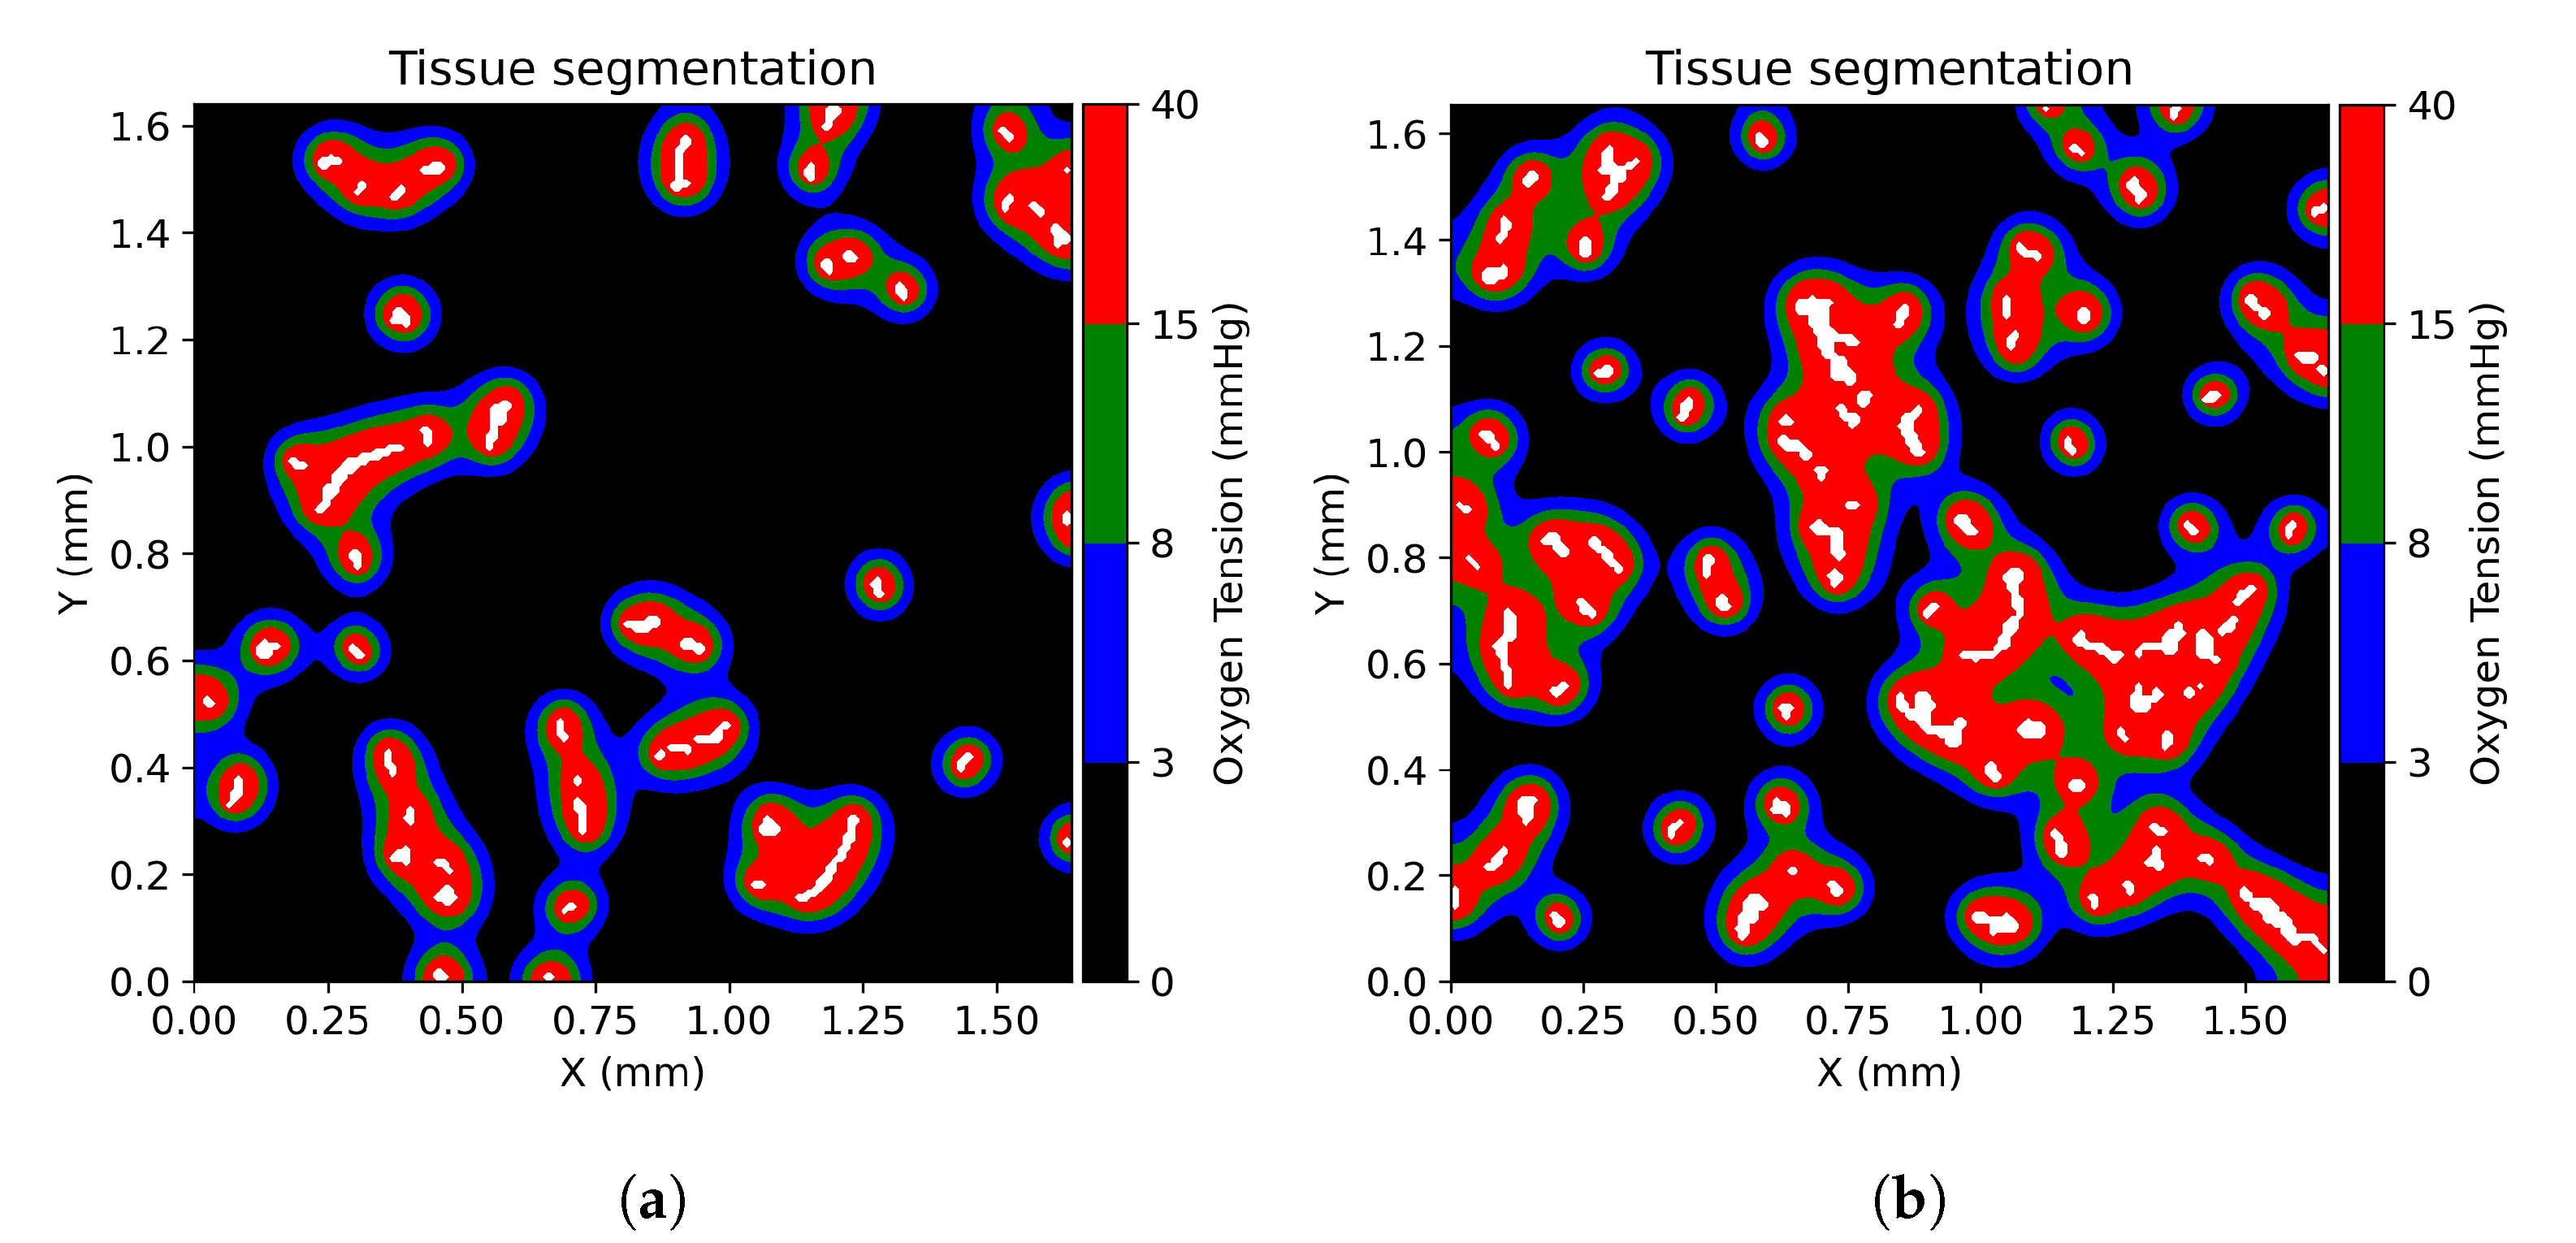
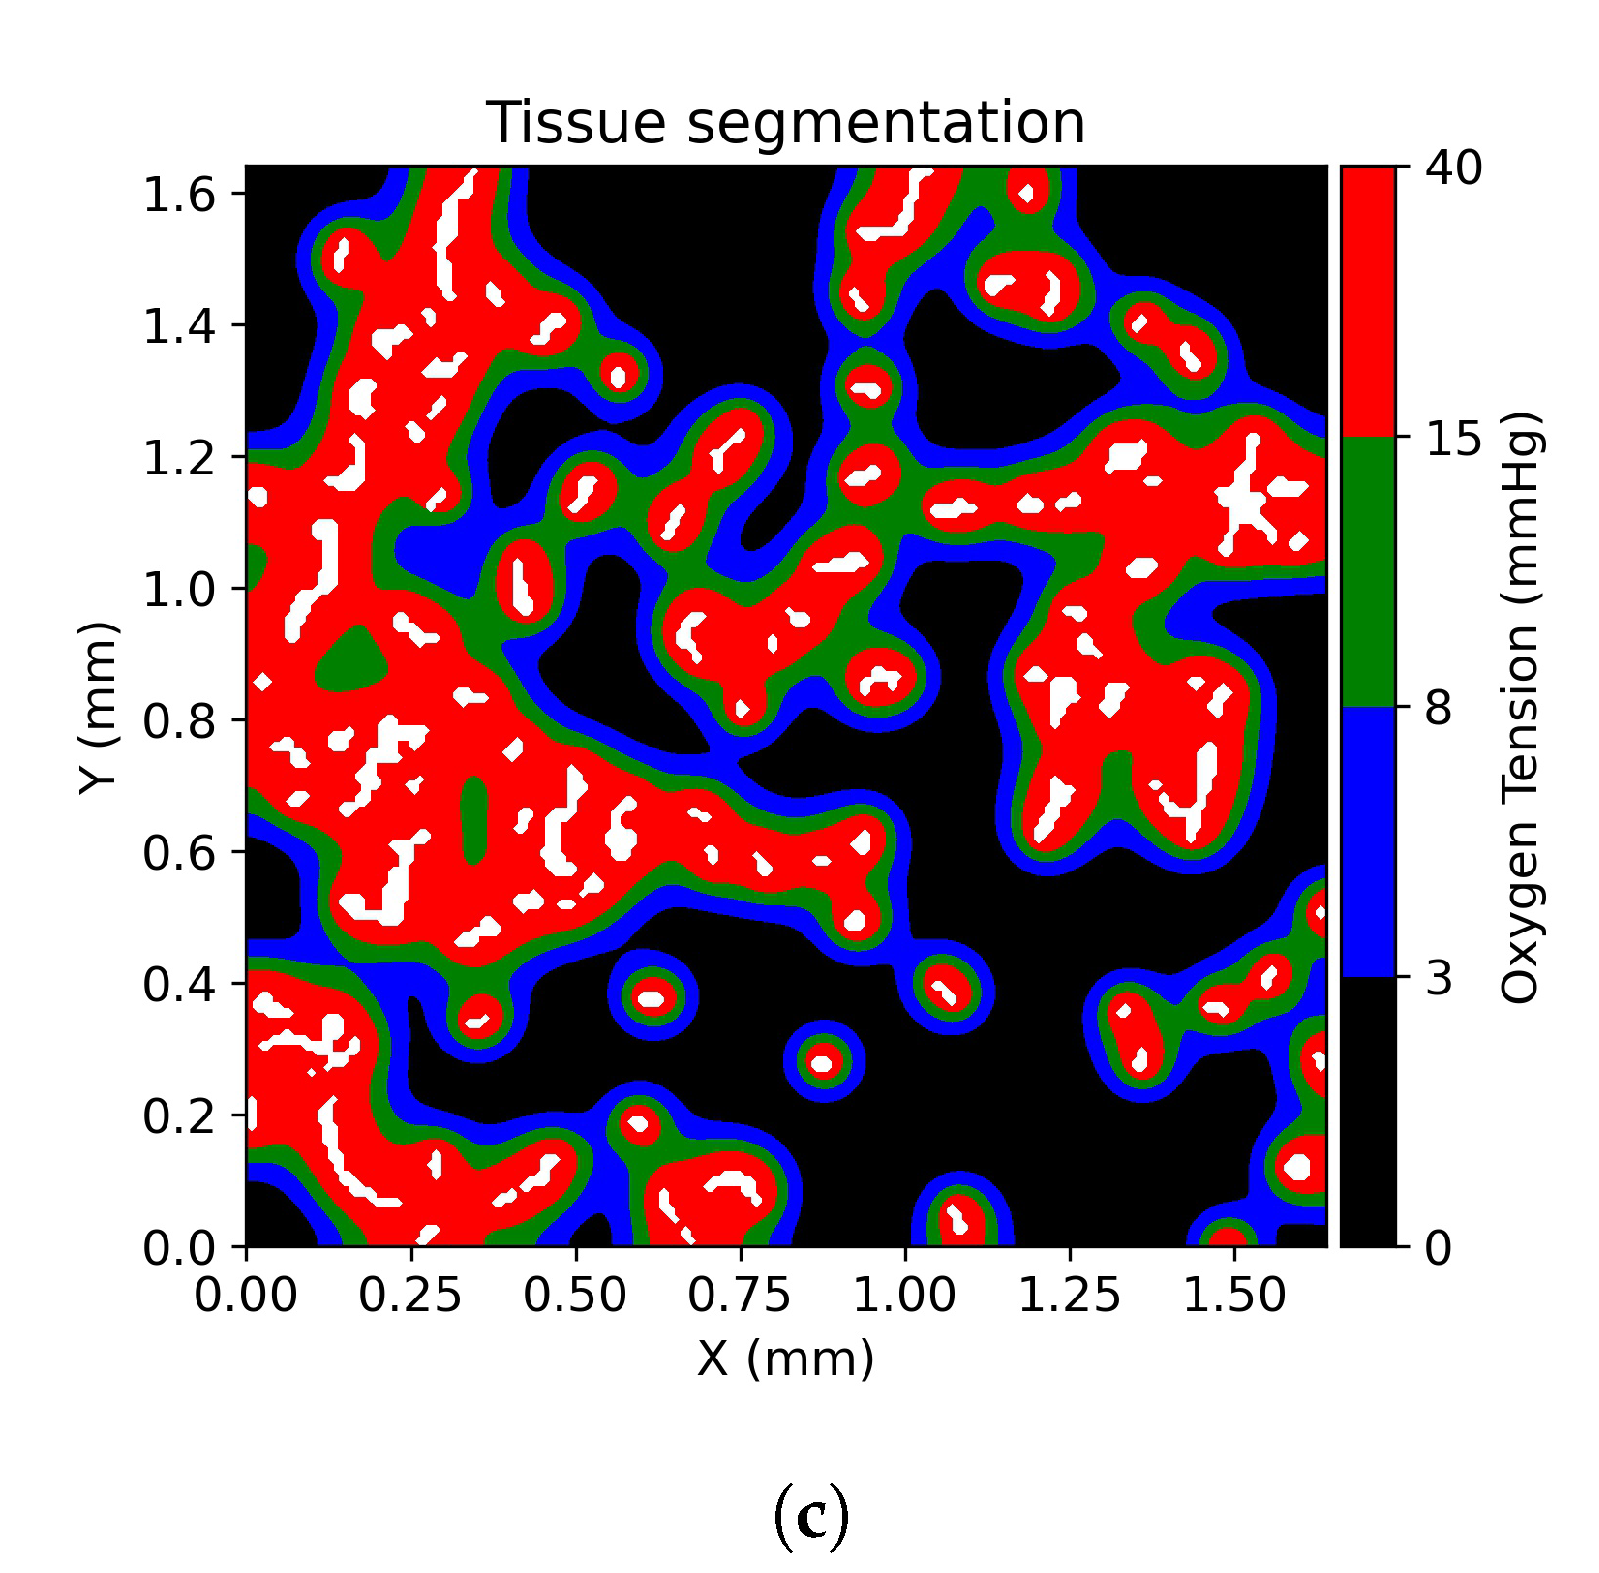
2.5. Tissue Oxygenation Models and Oxygen Dependent Tissue Segmentation

To study the effect of the presence of hypoxic tissue on the treatment outcome, we simulated the tissue oxygenation. Accordingly to the published literature, the oxygen transport is modelled as a purely diffusive process that is in equilibrium with cellular oxygen consumption [25,26,27,29]. The cellular oxygen consumption has been modelled considering Michaelis–Menten kinetics [25]. The reaction-diffusion equation for tissue oxygenation reads:
t P = · ( D O 2 P ) M 0 P P + P 0
where P (mmHg) is the oxygen tension, D O 2 (cm 2 s 1 ) is the diffusion constant, M 0 (mmHg s 1 ) is the consumption rate at maximum oxygen levels and P 0 (mmHg) is the Michaelis-Menten coefficient of oxygen consumption. Accordingly to Mönnich et al. [27], the oxygen flux density across the vessel walls is considered to be proportional to the difference between the oxygen tension in erythrocytes P ie (mmHg) and on the extravascular side of the wall P:
J O 2 = L O 2 ( P ie P ) .
Similarly the model presented in Section 2.4, the oxygen flux across the vessel walls is modelled via Neumann boundary conditions imposed on the vessel frontiers as
n · ( D O 2 P ) = J O 2 .
No-flux boundary conditions were applied to the edges of the vessel map. The parameters used in the oxygenation reaction-diffusion model have been derived by literature [27,29] and are listed in Table 2. The quasi-static oxygen distribution in the tumor microenvironment has been calculated by numerically solving Equation (6) with a FEM implemented in FreeFem++ [39]. The stationary approximation is reached by imposing a threshold of 0.1% (s 1 ) to the temporal variations of the solution.
According to Mckeown [40], we defined physoxia (the oxygen tension between 40 mmHg and 15 mmHg), physiological hypoxia (the oxygen tension between 15 mmHg and 8 mmHg), pathological hypoxia (the oxygen tension between 8 mmHg and 3 mmHg), and radiobiological hypoxia (the oxygen tension below 3 mmHg). The extravascular matrix has been segmented into the previously defined regions accordingly to the solution of Equation (6) as shown in Figure 2.

2.6. Physiologically Based Pharmacokinetic Model

Physiologically based pharmacokinetic (PBPK) models are compartment-based models used to simulate the absorption, distribution, metabolism, and excretion of the injected compound in the human body [41]. An existing and validated PBPK model [38] for RLT studies has been adopted to calculate the arterial input function (AIF), i.e., the time dependant vascular concentration of PSMA-ligands C v , used in our CRD model. The PBPK model for PSMA-ligands was adapted to be compatible with mouse physiology. Mouse physiological variables were either based on rescaling human parameters or derived from literature [42,43,44,45,46]. The tumor tissue was treated as a xenograft; therefore, parameters such as vascular and interstitial fraction, receptor density, PSMA-ligands binding constants, degradation and internalization rates were assumed to be the same as in humans [38]. The injected amount of radiopharmaceutical was chosen to obtain a mean deposited dose in the prostate tumor model of 10 Gy twenty days post-injection.

2.7. Absorbed Dose and Cell Survival Probability

The absorbed dose in each voxel of the domain has been calculated accordingly to the MIRD formalism [47]. The mean absorbed dose D ( r T , T D ) (Gy) to target voxel r T over a defined period T D is defined as
D ( r T , T D ) = r s A ˜ ( r S , T D ) S ( r T r S )
where A ˜ ( r S , T D ) (Bq) is the time-integrated activity in source voxel r S over the period T D and S ( r T r S ) is the radionuclide-specific quantity representing the mean absorbed dose to the target voxel r T per unit activity present in the source voxel r S . In this work the S values for each radionuclide are calculated with the use of MIRD-cell (V2.0) [48]. The probability that a cell survives is calculated accordingly to the linear quadratic model
P S = e α D β D 2
where α and β are the linear quadratic parameters that characterize the cellular response to the ionizing radiation and D (Gy) is the absorbed dose [49]. The linear quadratic parameters depend on the tissue oxygenation: The higher is the oxygenation, the more radiosensitive are the cells. In this work, the oxygen level within a pixel is used to fit the linear quadratic parameters. The cell survival curve for α particle radiation is log-linear at low as well as high absorbed doses. Equation (10) can be consequently simplified as
P S = e D / D 0
where D 0 is the absorbed dose required to yield a survival fraction of 37 % [50]. The parameters used to calculate the cells survival probability are resumed in Table 3.

3. Results

3.1. Tissue Oxygenation and Oxygen Dependent Tissue Segmentation

As a benchmark on the consistency of the oxygenation simulations with respect to the existing literature, for each ROI the median pO 2 has been calculated. The resulting pO 2 median calculated for each ROI spans in the range between 0.5 mmHg and 7.65 mmHg depending on the vascularization degree of the domain. These values are in agreement with the reported literature values for prostate tumors [40]. The main characteristic of the simulated oxygen distribution is the sharp gradient in the proximity of vessels and an asymptotic behavior approaching zero at large distances, which is consistent with previous investigations [25,27,29]. Consequently, the vascular fraction and the vessel distribution have a strong influence on the spatial distribution of each of the defined oxygen levels. Figure 2 shows the classification of the microenvironment tissue in three different ROIs, according to the definition given by Mckeown [40]. These ROIs have been selected as representative cases for a poorly vascularized tumor microenvironment (ROI A, vascular fraction of 1%), a vascularization degree comparable with published values for prostate cancers (ROI B, vascular fraction of 2.34%) and a highly vascularized prostate tumor microenvironment (ROI C, vascular fraction of 3.2%). The fraction of physoxia in the microenvironment goes from 8.9% in ROI A to 31.3% in ROI C showing a proportional behavior with respect to the vascular fraction. On the other hand, the fraction of tissue classified as radiobiological hypoxia is 36.3% in ROI C and increases up to 72.7% in ROI A, demonstrating an inverse correlation with the degree of vascularization. Regions of physiological hypoxia seem to be primarily dependent on the local vessel density, and inter-vessel distance.

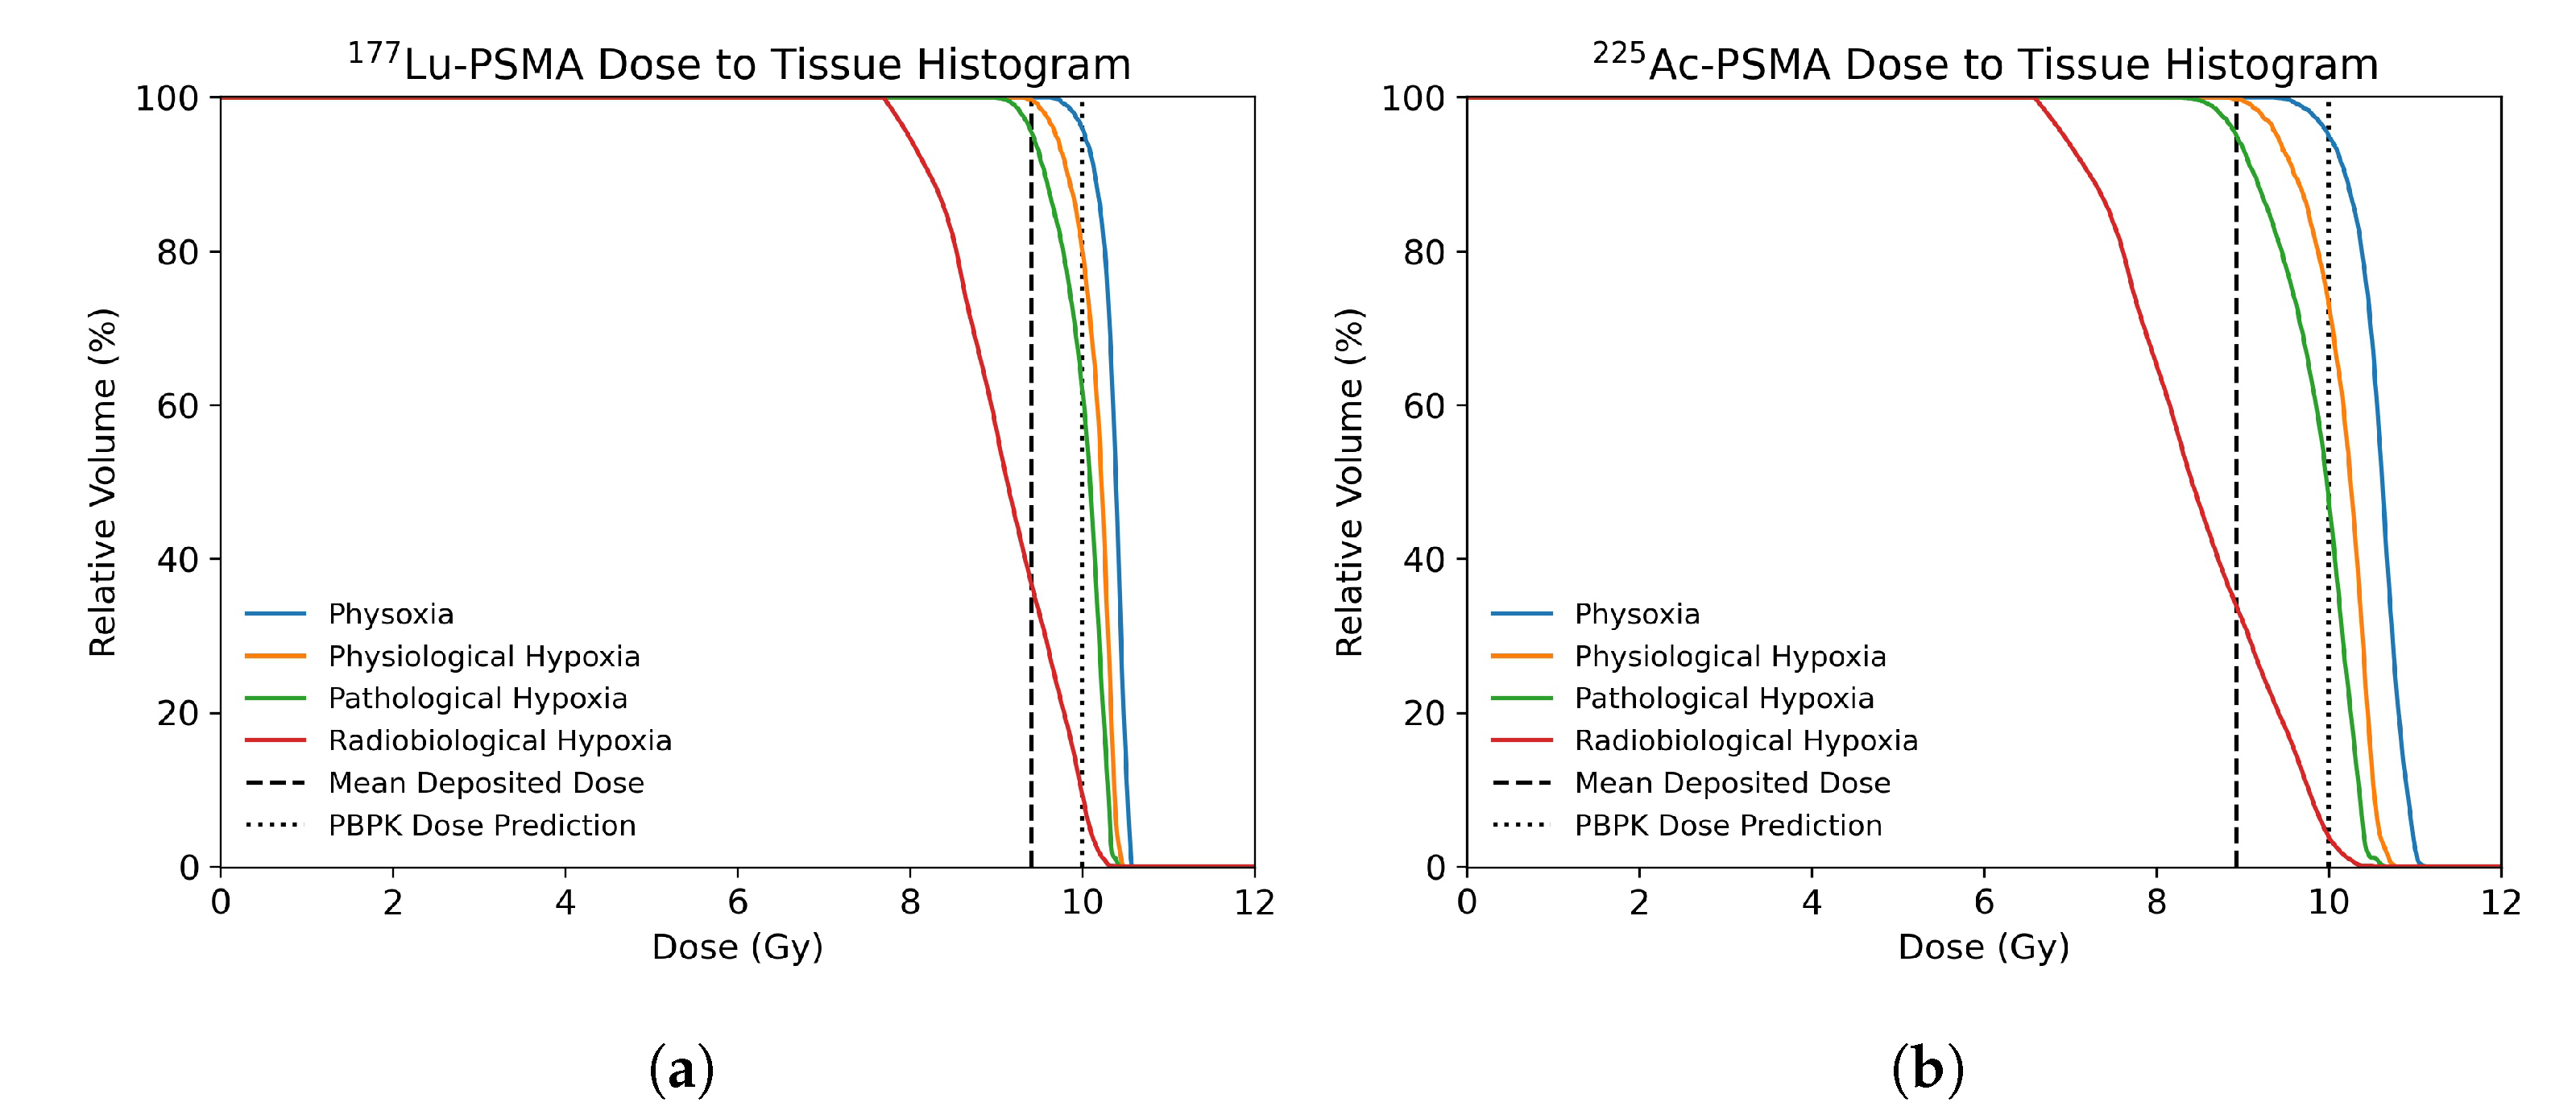
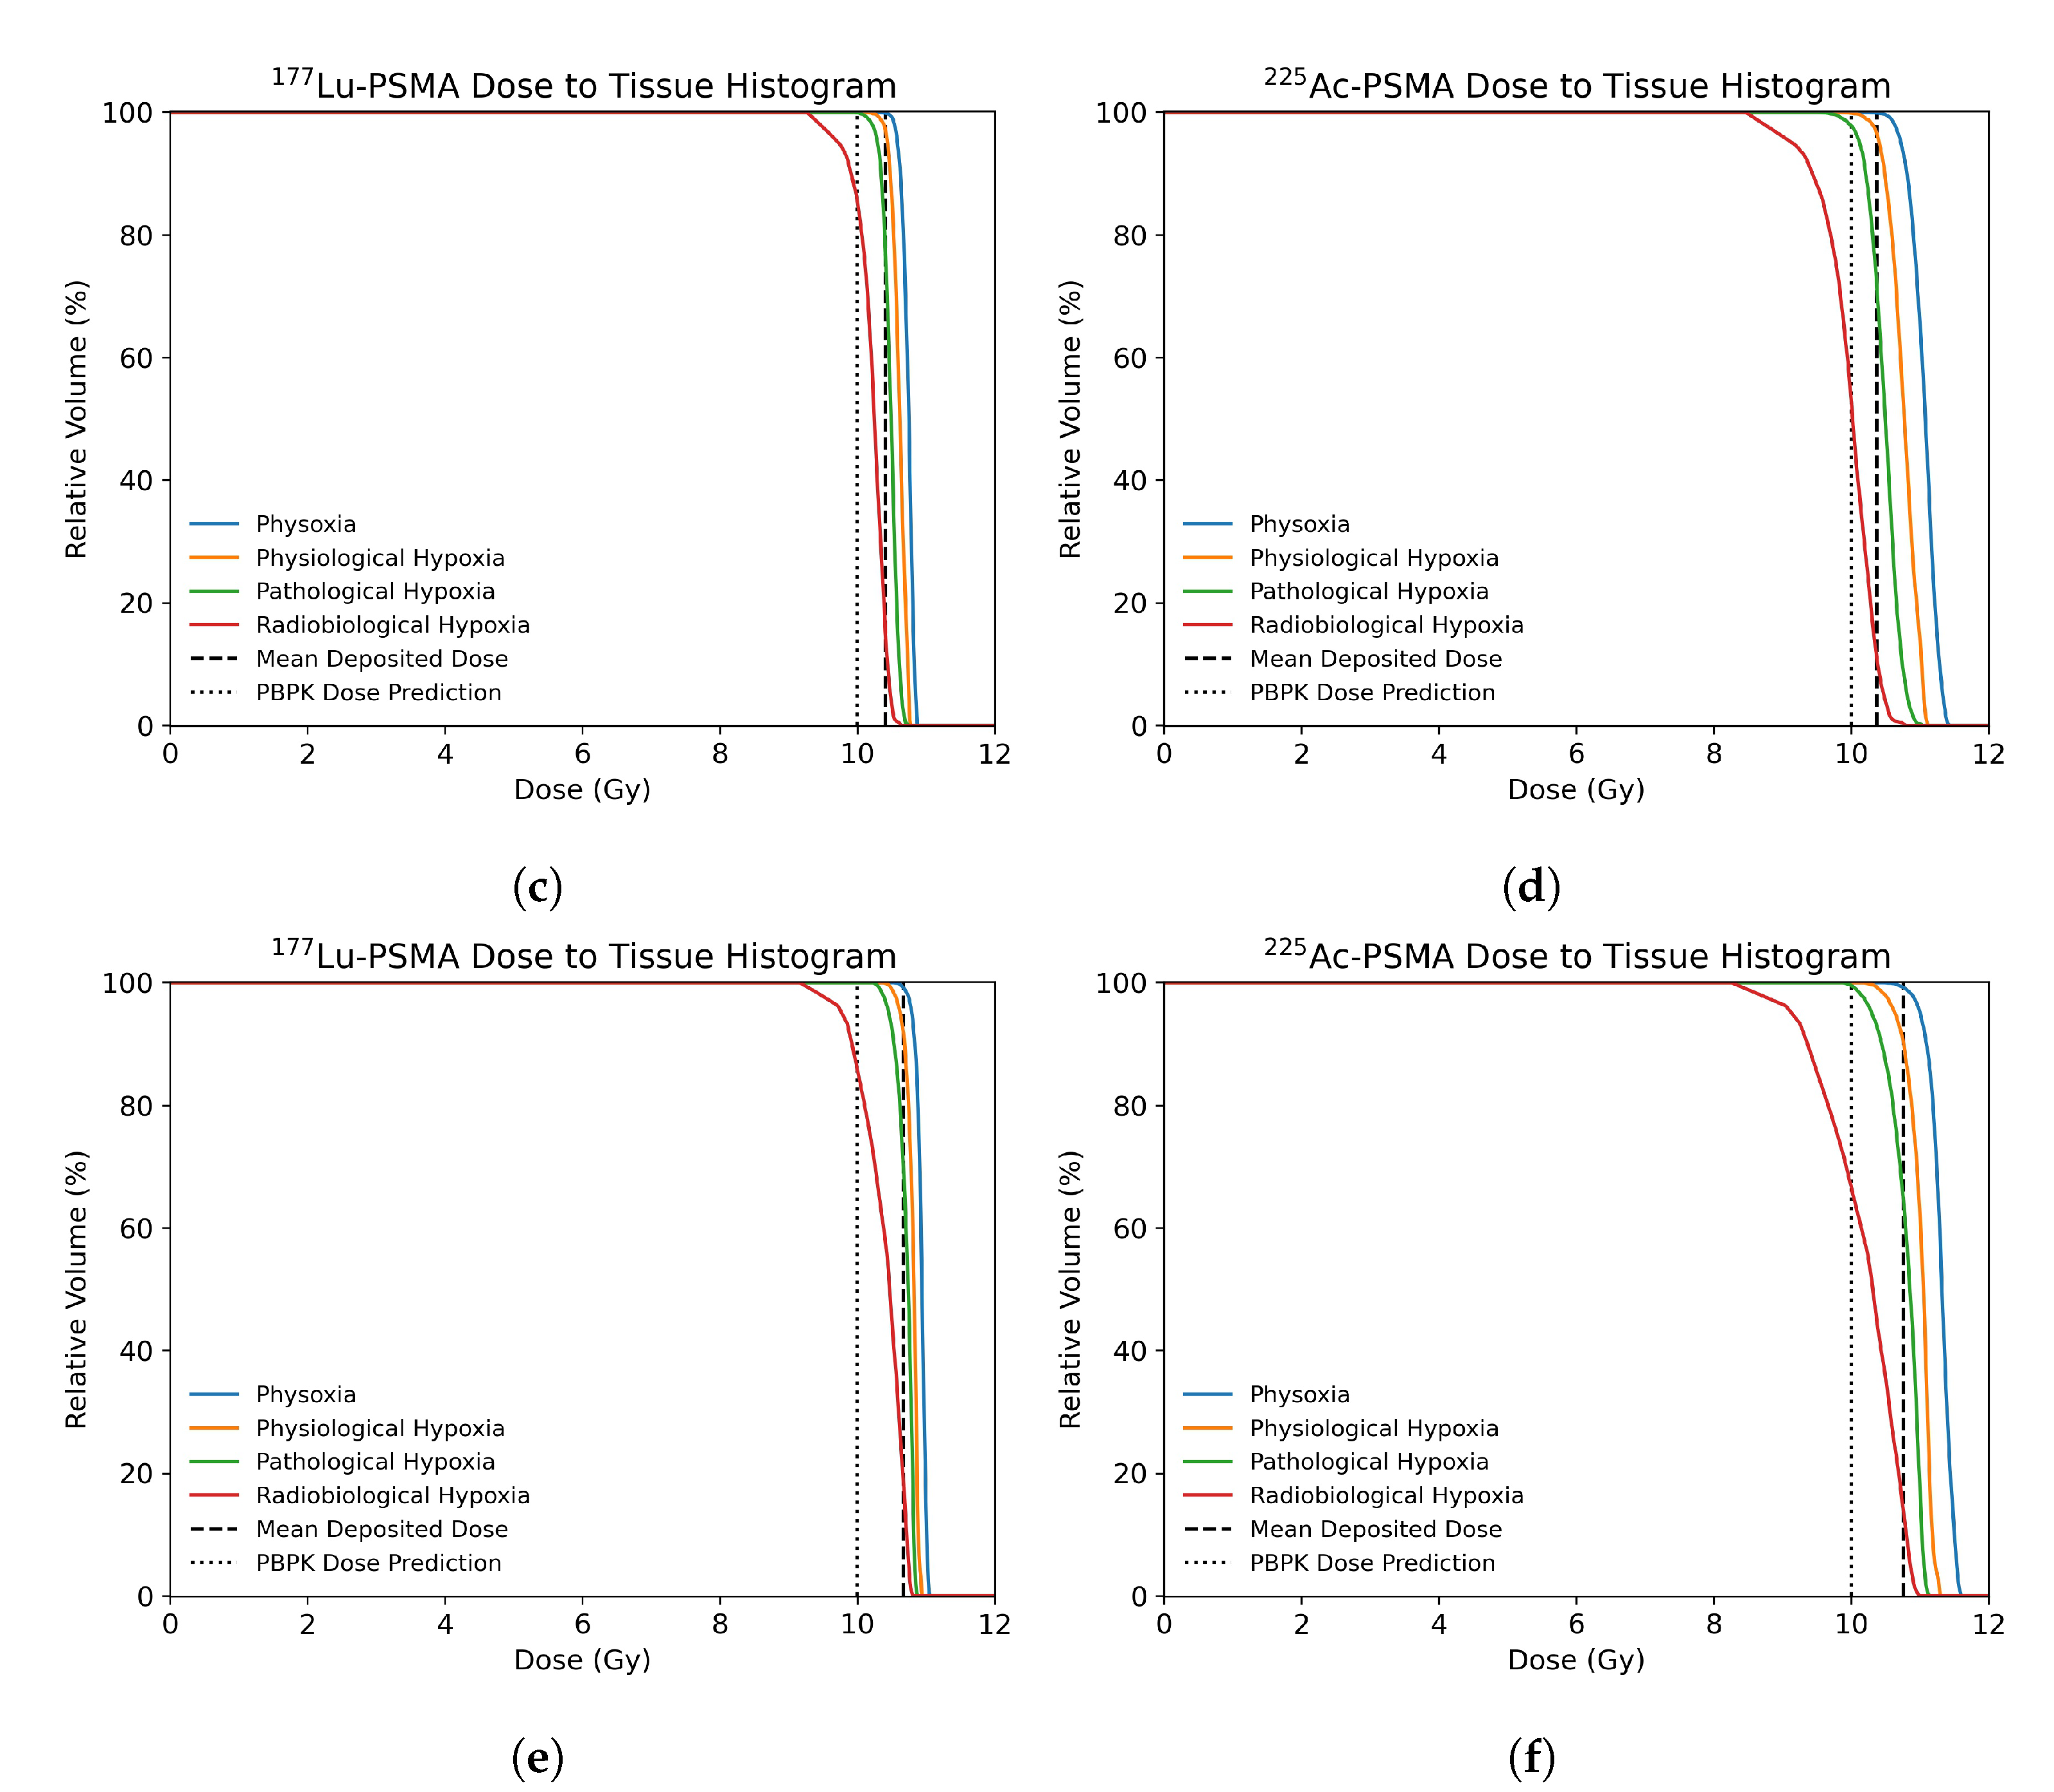
3.2. Dose Distribution in Tumor Microenvironment

Once the activity distribution was recovered, the Equation (9) was solved to calculate the dose distribution in the ROI. Figure 3 shows the cumulative dose to tissue histograms (DTH) calculated for the three ROIs and for each radionuclide at twenty days post injection. The DTH metric, similarly to the cumulative dose to volume histograms (DVH) commonly used in clinical practice, has been established in order to analyse the dose delivered to any defined tissue in the tumor microenvironment.
In all cases a more homogeneous dose distribution is produced by 177 Lu. The higher homogeneity of the dose distribution is highlighted by the steep shoulders of the DTHs for all the considered tissues. This is due to the higher “cross-fire” induced by the higher range covered by the β particles with respect to the α particles emitted by 225 Ac. Moreover, the DTH metric shows that in the poorly vascularized tissues (ROI A) only the 10% of radiobiological hypoxic tissue receives the target dose using 177 Lu-PSMA-ligand treatment. This percentage drops down to 5% using 225 Ac. In highly vascularized tissues (ROI C) the percentage of hypoxic tissue receiving the target dose increases to more than 85% and 65% for the 177 Lu and 225 Ac-PSMA-ligands, respectively.
The statistical analysis performed in all the ROIs shows an overall higher standard deviation in the dose distributions obtained with 225 Ac with respect to 177 Lu. A linear model was fitted to explore the relationship between the mean deposited dose and the L o g 10 median tissue oxygenation (Figure 4). For both 177 Lu-PSMA and 225 Ac-PSMA a high coefficient of determination ( R 2 = 0.97 and 0.98, respectively) was calculated, indicating a good model fit. A steeper slope was calculated in the case of 225 Ac-PSMA with respect to 177 Lu-PSMA (1.24 and 0.86, respectively).

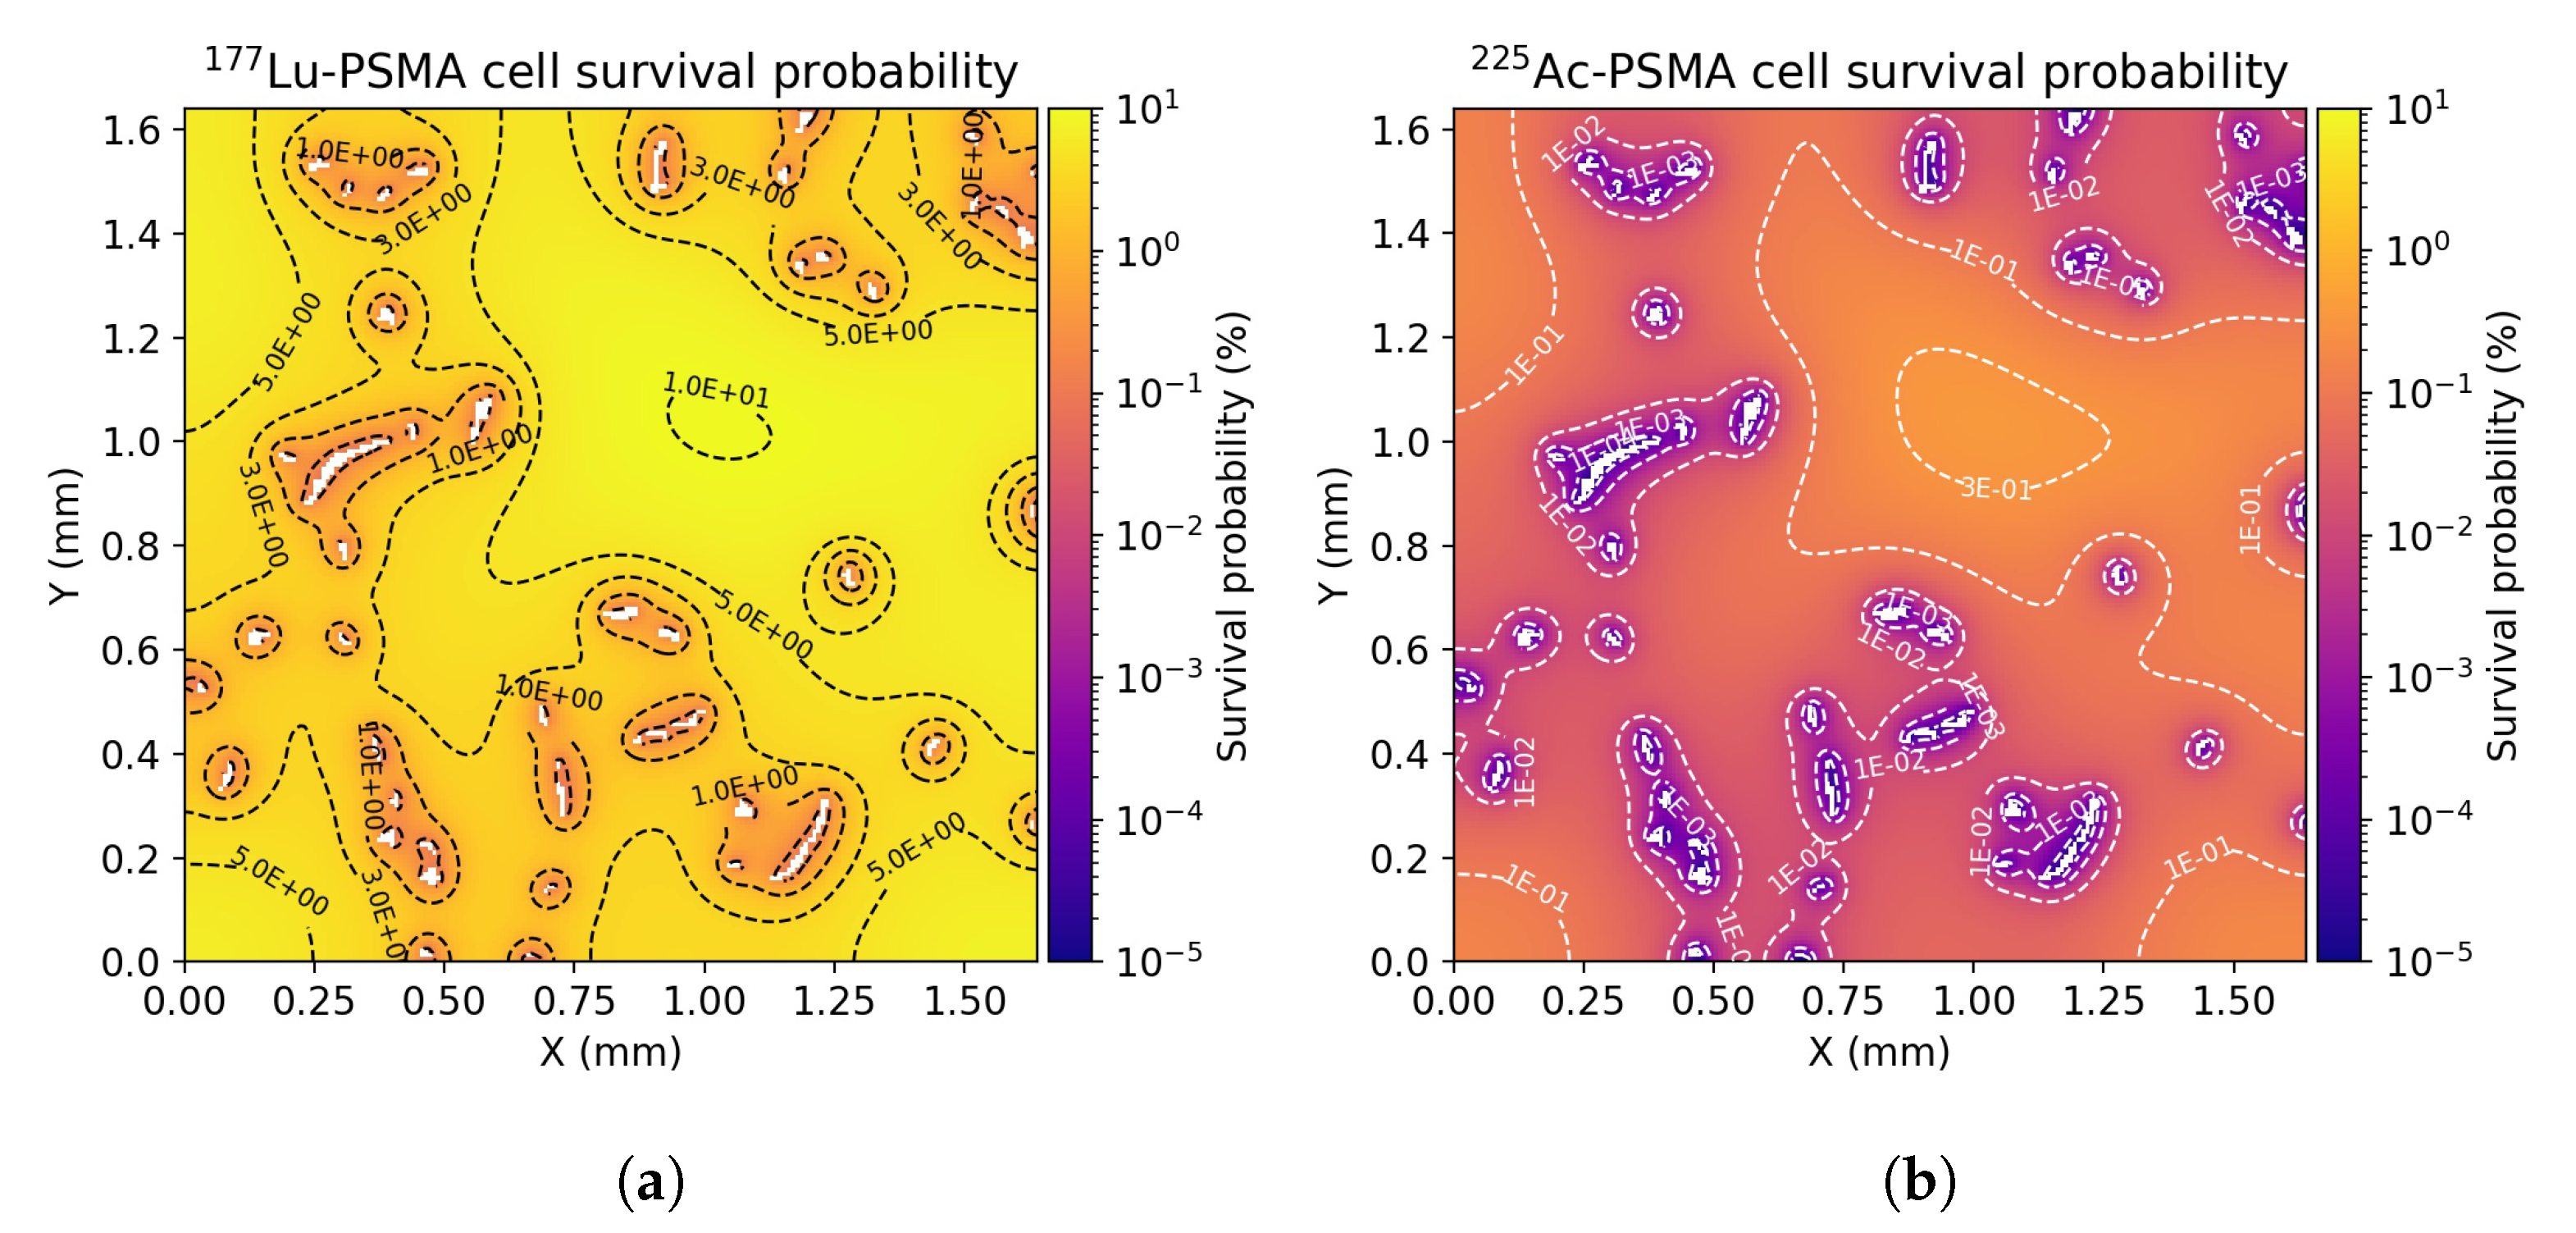
3.3. Radiobiological Efficacy Analysis

Applying the linear-quadratic model described in Section 2.7 to the dose maps, the cell survival probability for both 225 Ac-PSMA-ligands and 177 Lu-PSMA-ligand treatments has been calculated. The statistical analysis performed in all the ROIs shows an overall higher survival probability of tumor cells when the radiopharmaceutical is labelled with 177 Lu instead of 225 Ac (Figure 5). While the mean irradiation dose is comparable for both radiopharmaceuticals, the 225 Ac-PSMA-ligand has a overall significantly higher cell-killing potency. This finding is consistent with the reported higher probability of double-stranded break induction by the α particles, which are more difficult for the cell to repair.
Figure 6 depicts the cell survival probability distribution for the examined ROIs. The cell survival probability can be four order of magnitude higher for 177 Lu with respect to 225 Ac in vessels neighborhood. This difference can decrease by two orders of magnitude at large distances from vessels. While the 177 Lu-PSMA-ligand is overall less lethal, the longer range of β particles enables the 177 Lu based treatment to be less dependent on the degree of domain vascularization. This can be also seen by the smaller standard deviation in the mean cell survival probability for all the examined ROIs.

4. Discussion

In this work the influence of tumor hypoxia on the treatment outcome for PSMA-directed RLT with 177 Lu and 225 Ac has been investigated. The established hybrid histology-driven in silico model allowed to describe the dynamics of PSMA-ligands, the dose distribution and the radio-biological efficacy at the tumor microenvironment scale. The platform presented in this work is composed of four main models: a tissue oxygenation model based on the solution of a reaction-diffusion partial differential equation, a three compartment convection–reaction–diffusion model to simulate the propagation of radiopharmaceuticals in the tumor microenvironment, a kernel-based method for the dose calculation and a linear-quadratic model used to estimate the cell survival probability depending on the type of particle and the region oxygenation. The model parameters were derived from the existing literature and a validated PBPK model has been adopted to calculate the AIF.
In tumors, hypoxia occurs in regions with low vascular density [53]. On the contrary to the existing literature, our findings suggest that the dose distribution for both α and β emitters in poorly vascularized domains is heterogeneous. The low vascularization and the limited penetration of the radiopharmaceutical into the tumor microenvironment due to the high affinity of PSMA-ligands to the receptors, result in an overall low mean dose of radiation and a very low percentage of hypoxic tissue receiving the prescribed dose. Indeed, for the same mean irradiation dose 20 days p.i., the DTH metric shows that in poorly vascularized ROIs, the dose delivered to the radiobiological hypoxic tissues is suboptimal for both 177 Lu-PSMA-ligands and 225 Ac-PSMA-ligands. While the range of the β particles is high compared to the size of hypoxic regions, the “cross-fire” effect is not sufficient to completely homogenize the dose distribution within tissues. This could have an important effect on the treatment efficacy. On the other hand, a more homogeneous PSMA-ligands distribution is achieved in highly vascularized domains leading to a higher mean dose and a homogeneous dose distribution for both types of radiopharmaceuticals. In these ROIs, the percentage of radiobiological hypoxic tissue receiving the target dose is more than 85% and 65% for the 177 Lu and 225 Ac-PSMA-ligands, respectively.
Tumor hypoxia is also considered a critical factor associated with the resistance to conventional radiotherapy [4], where the X-ray-induced free radicals lead to DNA damage in a manner that is strongly dependent on the tissue oxygenation. While the lack of oxygen is less impactful on the treatment outcome compared to therapies with X- or γ -ray, for the emitted α and β particles the effect still exists. This, in combination with a lower deposited dose due to a limited penetration of the radiopharmaceutical and a low vascular density, leads to a significantly lower cell killing potency and hence treatment efficacy. Our findings suggests that for both α and β emitters, to a higher degree of oxygenation of the ROIs corresponds a lower cell survival probability. The previous findings on the significantly higher efficacy of the 225 Ac-PSMA-ligands therapy are confirmed. This is consistent with the higher probability of DSB induction by the α particles. However, our model suggests a lower dependency of the treatment outcome on the median oxygenation of the tissue for the treatment delivered with 177 Lu with respect to 225 Ac as shown in Figure 5.
This model is subject to some limitations. Two main types of hypoxia can be defined: Acute and chronic hypoxia. While chronic hypoxia is a quasi-steady state condition, acute hypoxia occurs due to fluctuations in red cell flux or hemoglobin saturation over minutes to hours [54,55]. In this study the morphological organization of the microvessels and the vessel wall permeability to oxygen ( L O 2 ) and PSMA-ligands ( L v ) was modelled as being constant. Therefore, as for previous theoretical studies, only chronic hypoxia was modeled [23,24,26,27,28,29]. While the perfusion of oxygen and pharmaceuticals can be highly heterogeneous especially in tumors [34], chronic hypoxia is the dominant type in tumor microenvironment (>70% [56]). The levels of median pO 2 calculated with our model in each ROI are in agreement with the existing in silico and in-vivo published studies [40] suggesting that the results of this work may still be meaningful. The vessel map generation could neglect some small vessels. This could bring to an inaccurate estimation of oxygen or radiopharmaceuticals supply. However, the visual comparison performed for all the ROIs confirmed the very good accuracy of the method. Moreover, the time activity curves (TACs) calculated in the ROIs with the PSMA-ligands dynamics models share the same characteristics of the PBPK-derived TACs [38]. This suggests that the model developed in this work is consistent with its macroscopical approximation giving at the same time a highly detailed description at a microscopical scale. Another source of inaccuracy is the use of the two-dimensional approximation. This limits the diffusion of the molecules only radially and neglects the contribution of the molecules moving in and out of the simulation plane [27]. Moreover, the vessel maps do not take into account vessels that are nearby but outside its thickness. In the actual tissue, these vessels can supply drugs and oxygen to the ROI. Therefore, the use of a 2D model systematically overestimates distances from tissue points to the nearest vessel, which could affect the predicted distribution of solutes. Nevertheless, the overall 3D inflow and outflow effect may be cancelled and the 2D based simulation was found to match the experimental results without large errors [29]. The same limitation can be referred to in the calculation of the dose distribution. The multi-compartment approach is very common in pharmacokinetic and in tumor microenvironment modelling where binding and internalization processes have to be described [57,58,59]. However, the assumptions of homogeneous cell density, of systematic division of the simulation space into sub-compartments and of constant diffusion coefficients are affected by the high tumour heterogeneity. A more realistic alternative would consist of a more detailed morphological segmentation of the tumour microenvironment. The S-values calculated for kernel construction were based on MIRD-cell (V2.0) that assumes uniform cell size and intercellular distance as well as spherical cell and nucleus geometry, which are all factors that have been shown to influence the deposited dose. The overall contribution of each of these factors to the dose accuracy is typically small [48]. However, deviations might occur for cells whose diameter substantially differs from the used value. Dose overestimation is also plausible in regions with small cellular density as the kernel assumes that each pixel in the domain is populated by a predefined fraction of a cell.
Radiation therapy has been linked with vascular remodeling [60]. In this model the vessel map derived from staining represents a “snapshot” of the tumor at a given time. For this reason, the dynamics of abnormal vessel growth that arise in tumor tissue due to angiogenesis [61] are not taken into account. Furthermore, it has been shown that radiation therapy can cause hypoxia [62] or upregulate HIF-1 expression [63], which in turn leads to a development and selection of more resistant cells [64,65]. Moreover, the biological effects induced by other pharmaceuticals, e.g., the effect of androgen-deprivation therapy with bicalutamide in selecting more resistant cells to the treatment [66], are not considered at this stage. We intend to consider these factors as potential model development.
The theoretical predictions of this paper should be further investigated experimentally. Autoradiography has been used in RLT research to characterize the radiopharmaceutical distribution in salivary glands [67,68]. Additionally, animals can be scanned with dynamic PET to obtain individual AIF for the simulation. The simulation results with the individual AIF can be compared with the obtained autoradiography images. The verification of the radiobiological effects will be performed by following the treatment effects in different groups of animals transplanted with the same type of tumor.

5. Conclusions

In this paper has been presented a hybrid in silico model to study the role of chronic hypoxia on the treatment outcome for PSMA-directed RLT. The incorporation of histology-derived microvascular networks in PBPK-integrated convection-reaction-diffusion model allows the investigation of the microdosimetry of 177 Lu and 225 Ac PSMA-directed radioligand therapy in the heterogeneous tumor microenvironment.
Although the higher homogeneity of the dose distribution delivered by 177 Lu with respect to 225 Ac is confirmed, the DTH metric shows that in poorly vascularized ROIs, i.e. hypoxic areas, the dose delivered to the radiobiological hypoxic tissues can be suboptimal for both 177 Lu-PSMA-ligands and 225 Ac-PSMA-ligands. Nevertheless, for the same mean irradiation dose 20 days p.i., the 225 Ac-PSMA-ligand has an overall significantly higher cell-killing potency. The development of advanced in silico modeling may assist the personalization of RLT.

Author Contributions

Conceptualization, K.S. (Kuangyu Shi), A.R., G.B., M.D., M.E. and W.W.; methodology, K.S. (Kuangyu Shi), A.R., G.B., M.D., M.E. and W.W.; software, G.B. and M.D.; validation, G.B., M.D., A.R. and K.S. (Kuangyu Shi); formal analysis, G.B. and M.D.; resources, V.M., K.S. (Katja Steiger), C.D.; investigations, E.G. and A.A.-O.; writing—original draft preparation, G.B. and M.D.; writing—review and editing, G.B., M.D., V.M., K.S. (Katja Steiger), C.D., E.G., A.A.-O., W.W., A.R., M.E., K.S. (Kuangyu Shi); visualization, G.B.; supervision, K.S. (Kuangyu Shi) and A.R.; project administration, K.S. (Kuangyu Shi); funding acquisition, K.S. (Kuangyu Shi) and A.R. All authors have read and agreed to the published version of the manuscript.

Funding

This research was funded by the Novartis Free Novation program.

Institutional Review Board Statement

Animal experiments were conducted with permission from the District Government of Upper Bavaria (application No.: 55.2-1-54-2532-216-15, approval date 19 April 2016) according to the guidelines for the welfare and use of animals in cancer research.

Informed Consent Statement

Not applicable.

Data Availability Statement

The Python script used to generate ROIs can be downloaded at https://www.dropbox.com/sh/fy5ud6f7vovh4ty/AABPbDhbONdqus4OAJEFNUmGa?dl=0, accessed date 13 June 2021.

Conflicts of Interest

The authors declare no conflict of interest. The funders had no role in the design of the study; in the collection, analyses, or interpretation of data; in the writing of the manuscript, or in the decision to publish the results.

References

  1. Michiels, C. Physiological and Pathological Responses to Hypoxia. Am. J. Pathol. 2004, 164, 1875–1882. [Google Scholar] [CrossRef] [Green Version]
  2. Vaupel, P. Hypoxia and Aggressive Tumor Phenotype: Implications for Therapy and Prognosis. Oncologist 2008, 13, 21–26. [Google Scholar] [CrossRef] [Green Version]
  3. Wilson, W.; Hay, M. Targeting Hypoxia in Cancer Therapy. Nat. Rev. Cancer 2011, 11, 393–410. [Google Scholar] [CrossRef]
  4. Moeller, B.; Richardson, R.; Dewhirst, M. Hypoxia and Radiotherapy: Opportunities for Improved Outcomes in Cancer Treatment. Cancer Metastasis Rev. 2007, 2, 241–248. [Google Scholar] [CrossRef] [PubMed]
  5. Löbrich, M.; Kühne, M.; Wetzel, J.; Rothkamm, K. Joining of Correct and Incorrect DNA Double-Strand Break Ends in Normal Human and Ataxia Telangiectasia Fibroblasts. Genes Chromosom. Cancer 2000, 1, 59–68. [Google Scholar] [CrossRef]
  6. Chaudhary, P.; Marshall, T.; Perozziello, F.; Manti, L.; Currell, F.; Hanton, F.; McMahon, S.; Kavanagh, J.; Cirrone, G.; Romano, F.; et al. Relative Biological Effectiveness Variation Along Monoenergetic and Modulated Bragg Peaks of A 62-Mev Therapeutic Proton Beam: A Preclinical Assessment. Int. J. Radiat. Oncol. Biol. Phys. 2014, 1, 27–35. [Google Scholar] [CrossRef] [PubMed] [Green Version]
  7. Tommasino, F.; Durante, M. Proton Radiobiology. Cancers 2015, 1, 353–381. [Google Scholar] [CrossRef]
  8. Wang, H.; Jiang, H.; Van De Gucht, M.; De Ridder, M. Hypoxic Radioresistance: Can ROS Be the Key to Overcome It? Cancers 2019, 1, 112. [Google Scholar] [CrossRef] [PubMed] [Green Version]
  9. Wenzl, T.; Wilkens, J. Modelling of the Oxygen Enhancement Ratio for Ion Beam Radiation Therapy. Phys. Med. Biol. 2011, 11, 3251–3268. [Google Scholar] [CrossRef]
  10. Helgstrand, J.; Røder, M.; Klemann, N.; Toft, B.; Lichtensztajn, D.; Brooks, J.; Brasso, K.; Vainer, B.; Iversen, P. Trends in Incidence and 5-Year Mortality in Men with Newly Diagnosed, Metastatic Prostate Cancer-A Population-Based Analysis of 2 National Cohorts. Cancer 2018, 14, 2931–2938. [Google Scholar] [CrossRef] [Green Version]
  11. Sweat, S.; Pacelli, A.; Murphy, G.; Bostwick, D. Prostate-Specific Membrane Antigen Expression Is Greatest in Prostate Adenocarcinoma and Lymph Node Metastases. Urology 1998, 4, 637–640. [Google Scholar] [CrossRef]
  12. Kratochwil, C.; Giesel, F.; Stefanova, M.; Bene Ova, M.; Bronzel, M.; Afshar-Oromieh, A.; Mier, W.; Eder, M.; Kopka, K.; Haberkorn, U. PSMA-Targeted Radionuclide Therapy of Metastatic Castration-Resistant Prostate Cancer with 177Lu-Labeled PSMA-617. J. Nucl. Med. 2016, 8, 1170–1176. [Google Scholar] [CrossRef] [PubMed] [Green Version]
  13. Hofman, M.; Violet, J.; Hicks, R.; Ferdinandus, J.; Thang, S.; Akhurst, T.; Iravani, A.; Kong, G.; Ravi Kumar, A.; Murphy, D.; et al. [177 Lu]-PSMA-617 Radionuclide Treatment in Patients with Metastatic Castration-Resistant Prostate Cancer (Lupsma Trial): A Single-Centre, Single-Arm, Phase 2 Study. Lancet Oncol. 2018, 6, 825–833. [Google Scholar] [CrossRef]
  14. Yadav, M.; Ballal, S.; Sahoo, R.; Dwivedi, S.; Bal, C. Radioligand Therapy with 177lu-PSMA for Metastatic Castration-Resistant Prostate Cancer: A Systematic Review and Meta-Analysis. Am. J. Roentgenol. 2019, 2, 275–285. [Google Scholar] [CrossRef]
  15. Tafreshi, N.; Doligalski, M.; Tichacek, C.; Pandya, D.; Budzevich, M.; El-Haddad, G.; Khushalani, N.; Moros, E.; McLaughlin, M.; Wadas, T.; et al. Development of Targeted Alpha Particle Therapy for Solid Tumors. Molecules 2019, 23, 4314. [Google Scholar] [CrossRef] [PubMed] [Green Version]
  16. Kratochwil, C.; Giesel, F.; Heussel, C.; Kazdal, D.; Endris, V.; Nientiedt, C.; Bruchertseifer, F.; Kippenberger, M.; Rathke, H.; Leichsenring, J.; et al. Patients Resistant Against PSMA-Targeting a Radiation Therapy often Harbor Mutations in DNA Damage-Repair-Associated Genes. J. Nucl. Med. 2020, 5, 683–688. [Google Scholar] [CrossRef] [PubMed]
  17. Satapathy, S.; Sood, A.; Das, C.; Mittal, B. Evolving Role of 225Ac-PSMA Radioligand Therapy in Metastatic Castration-Resistant Prostate Cancer—A Systematic Review and Meta-Analysis. Prostate Cancer Prostatic Dis. 2021, 1–11. [Google Scholar] [CrossRef]
  18. Movsas, B.; Chapman, J.; Horwitz, E.; Pinover, W.; Greenberg, R.; Hanlon, A.; Iyer, R.; Hanks, G. Hypoxic Regions Exist in Human Prostate Carcinoma. Urology 1999, 1, 11–18. [Google Scholar] [CrossRef]
  19. Movsas, B.; Chapman, J.; Hanlon, A.; Horwitz, E.; Pinover, W.; Greenberg, R.; Stobbe, C.; Hanks, G. Hypoxia in Human Prostate Carcinoma. Am. J. Clin. Oncol. 2001, 5, 458–461. [Google Scholar] [CrossRef]
  20. Parker, C.; Milosevic, M.; Toi, A.; Sweet, J.; Panzarella, T.; Bristow, R.; Catton, C.; Catton, P.; Crook, J.; Gospodarowicz, M.; et al. Polarographic Electrode Study of Tumor Oxygenation in Clinically Localized Prostate Cancer. Int. J. Radiat. Oncol. Biol. Phys. 2004, 3, 750–757. [Google Scholar] [CrossRef]
  21. Stewart, G.; Ross, J.; McLaren, D.; Parker, C.; Habib, F.; Riddick, A. The Relevance of a Hypoxic Tumour Microenvironment in Prostate Cancer. BJU Int. 2010, 1, 8–13. [Google Scholar] [CrossRef] [PubMed]
  22. Wang, Q.; Vaupel, P.; Ziegler, S.; Shi, K. Exploring the Quantitative Relationship between Metabolism and Enzymatic Phenotype by Physiological Modeling of Glucose Metabolism and Lactate Oxidation in Solid Tumors. Phys. Med. Biol. 2015, 6, 2547–2571. [Google Scholar] [CrossRef] [PubMed]
  23. Secomb, T.; Hsu, R.; Dewhirst, M.; Klitzman, B.; Gross, J. Analysis of Oxygen Transport to Tumor Tissue by Microvascular Networks. Int. J. Radiat. Oncol. Biol. Phys. 1993, 3, 481–489. [Google Scholar] [CrossRef]
  24. Secomb, T.; Hsu, R.; Ong, E.; Gross, J.; Dewhirst, M. Analysis of the Effects of Oxygen Supply and Demand on Hypoxic Fraction in Tumors. Acta Oncol. 1995, 3, 313–316. [Google Scholar] [CrossRef]
  25. Daşu, A.; Toma-Daşu, I.; Karlsson, M. Theoretical Simulation of Tumour Oxygenation and Results from Acute and Chronic Hypoxia. Phys. Med. Biol. 2003, 17, 2829–2842. [Google Scholar]
  26. Kelly, C.; Brady, M. A Model to Simulate Tumour Oxygenation and Dynamic [18F]-Fmiso PET Data. Phys. Med. Biol. 2006, 22, 5859–5873. [Google Scholar] [CrossRef]
  27. Mönnich, D.; Troost, E.; Kaanders, J.; Oyen, W.; Alber, M.; Thorwarth, D. Modelling and Simulation of [18F]Fluoromisonidazole Dynamics Based on Histology-Derived Microvessel Maps. Phys. Med. Biol. 2011, 7, 2045–2057. [Google Scholar] [CrossRef]
  28. Powathil, G.; Kohandel, M.; Milosevic, M.; Sivaloganathan, S. Modeling the spatial distribution of chronic tumor hypoxia: Implications for experimental and clinical studies. Comput. Math. Methods Med. 2012, 2012, 410602. [Google Scholar] [CrossRef]
  29. Shi, K.; Bayer, C.; Gaertner, F.; Astner, S.; Wilkens, J.; Nüsslin, F.; Vaupel, P.; Ziegler, S. Matching the Reaction-Diffusion Simulation to Dynamic [18F]FMISO PET Measurements in Tumors: Extension to a Flow-Limited Oxygen-Dependent Model. Physiol. Meas. 2017, 2, 188–204. [Google Scholar] [CrossRef]
  30. Horoszewicz, J.S.; Leong, S.S.; Chu, T.M.; Wajsman, Z.L.; Friedman, M.; Papsidero, L.; Kim, U.; Chai, L.S.; Kakati, S.; Arya, S.K.; et al. The LNCaP cell line: A new model for studies on human prostatic carcinoma. Prog. Clin. Biol. Res. 1980, 37, 115–132. [Google Scholar]
  31. Russell, P.; Kingsley, E. Human Prostate Cancer Cell Lines. Methods Mol. Med. 2003, 81, 21–39. [Google Scholar] [PubMed]
  32. Abramoff, M. ImageJ as an Image Processing Tool and Library. Microsc. Microanal. 2007, 13, 1672–1673. [Google Scholar] [CrossRef]
  33. Łuczyńska, E.; Heinze-Paluchowska, S.; Blecharz, P.; Jereczek-Fossa, B.; Petralia, G.; Bellomi, M.; Stelmach, A. Correlation between CT Perfusion and Clinico-Pathological Features in Prostate Cancer: A Prospective Study. Med. Sci. Monit. 2015, 21, 153–162. [Google Scholar] [PubMed] [Green Version]
  34. Jain, R. Determinants of tumor blood flow: A review. Cancer Res. 1988, 10, 2641–2658. [Google Scholar]
  35. Liu, H.; Rajasekaran, A.; Moy, P.; Xia, Y.; Kim, S.; Navarro, V.; Rahmati, R.; Bander, N. Constitutive and antibody-induced internalization of prostate-specific membrane antigen. Cancer Res. 1998, 18, 4055–4060. [Google Scholar]
  36. Swabb, E.; Wei, J.; Gullino, P. Diffusion and convection in normal and neoplastic tissues. Cancer Res. 1974, 10, 2814–2822. [Google Scholar]
  37. Jain, R. Transport of Molecules across Tumor Vasculature. Cancer Metastasis Rev. 1987, 4, 559–593. [Google Scholar] [CrossRef]
  38. Begum, N.; Glatting, G.; Wester, H.; Eiber, M.; Beer, A.; Kletting, P. The Effect of Ligand Amount, Affinity and Internalization on PSMA-Targeted Imaging and Therapy: A Simulation Study Using A PBPK Model. Sci. Rep. 2019, 9, 1–8. [Google Scholar] [CrossRef]
  39. Hecht, F. New Development in Freefem++. J. Numer. Math. 2012, 20, 251–266. [Google Scholar] [CrossRef]
  40. McKeown, S. Defining Normoxia, Physoxia and Hypoxia in Tumours—Implications for Treatment Response. Br. J. Radiol. 2014, 1035, 20130676. [Google Scholar] [CrossRef] [Green Version]
  41. Zhuang, X.; Lu, C. PBPK Modeling and Simulation in Drug Research and Development. Acta Pharm. Sin. B 2016, 5, 430–440. [Google Scholar] [CrossRef] [Green Version]
  42. Lyons, M.; Reisfeld, B.; Yang, R.; Lenaerts, A. A Physiologically Based Pharmacokinetic Model of Rifampin in Mice. Antimicrob. Agents Chemother. 2013, 4, 1763–1771. [Google Scholar] [CrossRef] [PubMed] [Green Version]
  43. Bi, Y.; Deng, J.; Murry, D.; An, G. A Whole-Body Physiologically Based Pharmacokinetic Model Of Gefitinib In Mice And Scale-Up to Humans. AAPS J. 2016, 1, 228–238. [Google Scholar] [CrossRef] [PubMed] [Green Version]
  44. Singh, S.; Pan, C.; Wood, R.; Yeh, C.; Yeh, S.; Sha, K.; Krolewski, J.; Nastiuk, K. Quantitative Volumetric Imaging of Normal, Neoplastic and Hyperplastic Mouse Prostate Using Ultrasound. BMC Urol. 2015, 1, 1–11. [Google Scholar] [CrossRef] [PubMed] [Green Version]
  45. Aggarwal, S.; Ricklis, R.; Williams, S.; Denmeade, S. Comparative Study of PSMA Expression in the Prostate of Mouse, Dog, Monkey, and Human. Prostate 2006, 9, 903–910. [Google Scholar] [CrossRef] [PubMed]
  46. Roy, J.; Warner, B.; Basuli, F.; Williams, M.; Wong, K.; Ton, A.; Chiorini, J.; Choyke, P.; Lin, F.; Jagoda, E. Identifying an appropriate animal model to examine preservation of salivary function with PSMA targeted radiotherapies. J. Nucl. Med. 2018, 59 (Suppl. 1), 1255. [Google Scholar]
  47. Bolch, W.; Bouchet, L.; Robertson, J.; Wessels, B.; Siegel, J.; Howell, R.; Erdi, A.; Aydogan, B.; Costes, S.; Watson, E. MIRD Pamphlet No. 17: The Dosimetry of Nonuniform Activity Distributions—Radionuclide S Values at the Voxel Level. J. Nucl. Med. 1999, 1, 11S–36S. [Google Scholar]
  48. Vaziri, B.; Wu, H.; Dhawan, A.; Du, P.; Howell, R. MIRD Pamphlet No. 25: Mirdcell V2.0 Software Tool for Dosimetric Analysis of Biologic Response of Multicellular Populations. J. Nucl. Med. 2014, 9, 1557–1564. [Google Scholar] [CrossRef] [Green Version]
  49. McMahon, S. The Linear Quadratic Model: Usage, Interpretation and Challenges. Phys. Med. Biol. 2018, 1, 01TR01. [Google Scholar] [CrossRef]
  50. Sgouros, G.; Roeske, J.; McDevitt, M.; Palm, S.; Allen, B.; Fisher, D.; Brill, A.; Song, H.; Howell, R.; Akabani, G. MIRD Pamphlet No. 22 (Abridged): Radiobiology and Dosimetry of α-Particle Emitters for Targeted Radionuclide Therapy. J. Nucl. Med. 2010, 2, 311–328. [Google Scholar] [CrossRef] [Green Version]
  51. Wang, J.; Li, X.; Mayr, N. Dose Escalation To Combat Hypoxia In Prostate Cancer: A Radiobiological Study On Clinical Data. Br. J. Radiol. 2006, 947, 905–911. [Google Scholar] [CrossRef]
  52. Barendsen, G.; Koot, C.; van Kersen, G.; Bewley, D.; Field, S.; Parnell, C. The Effect of Oxygen on Impairment of the Proliferative Capacity of Human Cells in Culture by Ionizing Radiations of Different LET. Int. J. Radiat. Biol. Relat. Stud. Phys. Chem. Med. 1966, 4, 317–327. [Google Scholar] [CrossRef]
  53. Dewhirst, M.; Cao, Y.; Moeller, B. Cycling Hypoxia And Free Radicals Regulate Angiogenesis And Radiotherapy Response. Nat. Rev. Cancer 2008, 6, 425–437. [Google Scholar] [CrossRef] [PubMed] [Green Version]
  54. Chaplin, D.J.; Olive, P.L.; Durand, R.E. Intermittent blood flow in a murine tumor: Radiobiological effects. Cancer Res. 1987, 47, 597–601. [Google Scholar]
  55. Bader, S.B.; Dewhirst, M.W.; Hammond, E.M. Cyclic Hypoxia: An Update on Its Characteristics, Methods to Measure It and Biological Implications in Cancer. Cancers 2021, 13, 23. [Google Scholar] [CrossRef]
  56. Maftei, C.A.; Bayer, C.; Shi, K.; Astner, S.T.; Vaupel, P. Quantitative assessment of hypoxia subtypes in microcirculatory supply units of malignant tumors using (immuno-) fluorescence techniques. Strahlenther. Und Onkol. 2011, 187, 260–266. [Google Scholar] [CrossRef] [PubMed]
  57. Levy, G.; Gibaldi, M.; Jusko, W. Multicompartment Pharmacokinetic Models And Pharmacologic Effects. J. Pharm. Sci. 1969, 4, 422–424. [Google Scholar] [CrossRef]
  58. Gerlowski, L.; Jain, R. Physiologically Based Pharmacokinetic Modeling: Principles and Applications. J. Pharm. Sci. 1983, 10, 1103–1127. [Google Scholar] [CrossRef]
  59. Liu, D.; Chalkidou, A.; Landau, D.; Marsden, P.; Fenwick, J. Interstitial Diffusion and The Relationship between Compartment Modelling and Multi-Scale Spatial-Temporal Modelling of 18f-FLT Tumour Uptake Dynamics. Phys. Med. Biol. 2014, 17, 5175–5202. [Google Scholar] [CrossRef] [PubMed] [Green Version]
  60. Potiron, V.; Clément-Colmou, K.; Jouglar, E.; Pietri, M.; Chiavassa, S.; Delpon, G.; Paris, F.; Supiot, S. Tumor Vasculature Remodeling by Radiation Therapy Increases Doxorubicin Distribution and Efficacy. Cancer Lett. 2019, 457, 1–9. [Google Scholar] [CrossRef]
  61. Kohandel, M.; Kardar, M.; Milosevic, M.; Sivaloganathan, S. Dynamics of Tumor Growth and Combination of Anti-Angiogenic and Cytotoxic Therapies. Phys. Med. Biol. 2007, 13, 3665–3677. [Google Scholar] [CrossRef]
  62. Vujaskovic, Z.; Anscher, M.; Feng, Q.; Rabbani, Z.; Amin, K.; Samulski, T.; Dewhirst, M.; Haroon, Z. Radiation-Induced Hypoxia May Perpetuate Late Normal Tissue Injury. Int. J. Radiat. Oncol. Biol. Phys. 2001, 4, 851–855. [Google Scholar] [CrossRef]
  63. Moeller, B.; Dewhirst, M. HIF-1 and Tumour Radiosensitivity. Br. J. Cancer 2006, 1, 1–5. [Google Scholar] [CrossRef]
  64. Kabakov, A.; Yakimova, A. Hypoxia-Induced Cancer Cell Responses Driving Radioresistance of Hypoxic Tumors: Approaches to Targeting and Radiosensitizing. Cancers 2021, 5, 1102. [Google Scholar] [CrossRef] [PubMed]
  65. Hennessey, D.; Martin, L.; Atzberger, A.; Lynch, T.; Hollywood, D.; Marignol, L. Exposure to Hypoxia Following Irradiation Increases Radioresistance in Prostate Cancer Cells. Urol. Oncol. Semin. Orig. Investig. 2013, 7, 1106–1116. [Google Scholar] [CrossRef]
  66. Nesbitt, H.; Byrne, N.; Williams, S.; Ming, L.; Worthington, J.; Errington, R.; Patterson, L.; Smith, P.; McKeown, S.; McKenna, D. Targeting Hypoxic Prostate Tumors Using the Novel Hypoxia-Activated Prodrug OCT1002 Inhibits Expression of Genes Associated with Malignant Progression. Clin. Cancer Res. 2016, 7, 1797–1808. [Google Scholar] [CrossRef] [Green Version]
  67. Solon, E. Autoradiography Techniques and Quantification of Drug Distribution. Cell Tissue Res. 2015, 1, 87–107. [Google Scholar] [CrossRef]
  68. Tönnesmann, R.; Meyer, P.; Eder, M.; Baranski, A. [177Lu]Lu-PSMA-617 Salivary Gland Uptake Characterized by Quantitative in vitro Autoradiography. Pharmaceuticals 2019, 1, 18. [Google Scholar] [CrossRef] [Green Version]
Figure 1. (a) Example of the used tissue microsection immunohistochemically stained for CD31 (vessel endothelium). The red square represents one of the regions of interest used for simulations. (b) Region of interest after binarization. (c) Zoom image of the ROI.
Cancers 13 03429 g001aCancers 13 03429 g001b
Figure 2. Tissue segmentation of the three representative ROIs based on the oxygenation level. Physoxia is labeled with red color, physiological hypoxia is labeled with green color, pathological hypoxia is labeled with blue color, and radiobiological hypoxia is labeled with black color. (a) Tissue segmentation for ROI A with a vascular fraction of 1%. (b) Tissue segmentation for ROI B with a vascular fraction of 2.34%. (c) Tissue segmentation for ROI C with a vascular fraction of 3.2%.
Cancers 13 03429 g002aCancers 13 03429 g002b
Figure 3. (a,c,e) Cumulative dose to tissue histogram of deposited dose in ROI A, ROI B and ROI C, respectively, within each tissue segment with 177 Lu-PSMA treatment at twenty days post-injection. (b,d,f) Cumulative dose to tissue histogram of deposited dose in ROI A, ROI B and ROI C, respectively, within each tissue segment with 225 Ac-PSMA treatment at twenty days post-injection.
Cancers 13 03429 g003aCancers 13 03429 g003b
Figure 4. Relationship between the mean absorbed dose and the median oxygenation for 177Lu-PSMA treatment (a) and 225Ac-PSMA treatment (b). The vertical lines represent the dose standard deviation within each examined ROI.
Cancers 13 03429 g004
Figure 5. Cell survival probability depending on the ROI median oxygen tension for 177 Lu-PSMA and 225 Ac-PSMA treatments.
Cancers 13 03429 g005
Figure 6. (a,c,e) 2D distribution of cell survival probabilities in ROI A, ROI B and ROI C, respectively, within each tissue segment with 177 Lu-PSMA treatment at twenty days post-injection. (b,d,f) 2D distribution of cell survival probabilities in ROI A, ROI B and ROI C, respectively, within each tissue segment with 225 Ac-PSMA treatment at twenty days post-injection.
Cancers 13 03429 g006aCancers 13 03429 g006b
Table 1. Model parameter values used in PSMA-ligands dynamics simulations.
SymbolParameterValueReference
L v Vessel wall permeability 3.3 × 10 4 cm s 1 [37]
D PSMA Diffusivity 8.7 × 10 7 cm 2 s 1 [36]
R f Molecule/Carrier movement coefficient1[36]
R 0 Receptor density 4.089 × 10 2 nmol ml 1 fitted
k on Association rate 7.7 × 10 1 ml nmol 1 s 1 [38]
k off Dissociation rate 7.7 × 10 4 s 1 [38]
k int Internalization rate 1.67 × 10 5 s 1 [38]
k rel Release rate 2.67 × 10 6 s 1 [38]
F V i Fractional interstitial volume39%[38]
F V c Fractional cellular volume61%[38]
λ dec 177 Lu decay constant 1.197 × 10 6 s 1
λ dec 225 Ac decay constant 8.087 × 10 7 s 1
Table 2. Model parameter values used in tissue oxygenation simulations.
SymbolParameterValueReference
L O 2 Vessel wall permeability to O 2 4.1 × 10 2 cm s 1 [27,29]
D O 2 Oxygen diffusivity 2.0 × 10 5 cm 2 s 1 [27,29]
P ie Intraerythrocyte pO 2 in tumors40 mmHg[27,29]
M 0 Maximum O 2 consumption rate15 mmHg s 1 [27,29]
P 0 Michaelis-Menten coefficient of oxygen consumption2.0 mmHg[27,29]
Table 3. Parameters used for the cells survival probability calculations.
ParameterPhysoxiaRadiobiological HypoxiaRef.
α 0.15 Gy 1 0.107 Gy 1  [51]
β 0.048 Gy 2 0.024 Gy 2  [51]
D 0 0.7 Gy1.18 Gy [52]
Publisher’s Note: MDPI stays neutral with regard to jurisdictional claims in published maps and institutional affiliations.

