Abstract
Retinoblastoma (RB) is the most common tumor of the eye in early childhood. Although recent advances in conservative treatment have greatly improved the visual outcome, local tumor control remains difficult in the presence of massive vitreous seeding. Traditional biopsy has long been considered unsafe in RB, due to the risk of extraocular spread. Thus, the identification of new biomarkers is crucial to design safer diagnostic and more effective therapeutic approaches. Exosomes, membrane-derived nanovesicles that are secreted abundantly by aggressive tumor cells and that can be isolated from several biological fluids, represent an interesting alternative for the detection of tumor-associated biomarkers. In this study, we defined the protein signature of exosomes released by RB tumors (RBT) and vitreous seeding (RBVS) primary cell lines by high resolution mass spectrometry. A total of 5666 proteins were identified. Among these, 5223 and 3637 were expressed in exosomes RBT and one RBVS group, respectively. Gene enrichment analysis of exclusively and differentially expressed proteins and network analysis identified in RBVS exosomes upregulated proteins specifically related to invasion and metastasis, such as proteins involved in extracellular matrix (ECM) remodeling and interaction, resistance to anoikis and the metabolism/catabolism of glucose and amino acids.
1. Introduction
Retinoblastoma (RB) is the most common intraocular malignancy of childhood and accounts for 3% of all childhood cancers [1]. About 40% of cases are hereditary and usually bilateral: 10% are due to a germline mutation of RB1 and 30% to a de novo germline mutation. The remaining 60% of cases are sporadic and non-hereditary, usually monolateral, with a somatic biallelic RB1 inactivation arising locally within the developing retina [2,3]. In both cases, the loss of RB1 protein function, which is a tumor suppressor located on chromosome 13q14, promotes uncontrolled cell division in retinal cells determining tumor formation [4,5]. The tumor can be endophytic in the vitreous, exophytic in the subretinal space, or have a mixed presentation. Vitreous seeding may occur when the tumor penetrates the inner limiting membrane of the retina, either spontaneously or by iatrogenic mechanisms (e.g., during focal ocular treatment). When the vitreous seeding is present at diagnosis, it is defined as “primary seeding”, whereas if the disease course complicates independently of the initial growth pattern, it is termed “secondary seeding” [6]. The vitreous seeds remain a challenge in the management of intraocular RB and the enucleation of the affected eye may represent the only treatment option when the tumor is too advanced [7]. In this context, the identification of early prognostic biomarkers, which are predictive for vitreous seeding and are a reliable indicator of response to treatment, is urgently needed. Compared with other cancers, RB cannot be biopsied, due to the risk of extraocular dissemination, and much is known about the RB genetics derived from studies of tumors in enucleated eyes. Liquid biopsy is a minimally invasive alternative to surgical biopsies of solid tumors, based on the analysis of tumor-derived material in blood sample or other body fluids. Exosomes represent a novel source of biomarkers in liquid biopsies for monitoring tumor progression and drug resistance. Exosomes are cell membrane-derived nanovesicles (30–100 nM in diameter), containing RNA, microRNA, lipids and proteins. Secreted abundantly by aggressive tumor cells, those microvesicles can be isolated from several biological fluids [8]. In recent years, numerous efforts are being made to characterize the content of exosomes, both at the microRNA and protein levels [9,10]. Proteins and peptides are promising biomarkers, since they are functionally involved in biological processes. Thus, there is a correlation between their expression levels and various disease pathologies [11]. Moreover, proteomic technology platforms have developed rapidly, enhancing the precision and expedience of proteome analyses [12]. In particular, mass spectrometry has emerged as a promising approach for protein biomarker discovery, by exploring the protein content of body fluids, both in patients and controls [13].
The present study aimed to identify an exosome signature specifically associated with vitreous seeding. Here, we characterized the proteomic cargo of exosomes isolated from RB cell lines established from solid tumor tissue in the retina (retinoblastoma tumors (RBT)) and from tumor seeding in the vitreous humor (RBVS). We identified, in RBVS exosomes upregulated proteins specifically related to invasion and metastasis such as proteins involved in extracellular matrix (ECM) remodeling and interaction, resistance to anoikis and metabolism/catabolism of glucose and amino acids.
2. Results
2.1. Characterization of Exosomes Derived from Primary RB Cell Lines
Exosomes were isolated from the cell culture conditioned media of primary RB cell lines generated from primitive mass (RBT1, RBT2, RBT5, RBT14) and vitreous seeding (RBVS1, RBVS3, RBVS10) by serial ultracentrifugations, as reported in Material and Methods. Scanning electron microscopy (SEM) analysis showed single and aggregate round-shaped nano-vesicles, the majority of which ranged from 50 to 70 nM (Figure 1A). A NanoSight tracking system analysis revealed a relatively uniform size distribution of peaks from 100 to 150 nM, which is consistent with exosomes size (Figure 1B). Exosome protein concentration is reported in Figure 1C. Western blot (WB) analysis showed an enrichment of exosomal-specific proteins, such as tumor susceptibility gene 101 protein (TSG101) and the tetraspanin CD9 (Figure 1D). Altogether, these results confirmed that isolated microvesicles corresponded to exosomes.
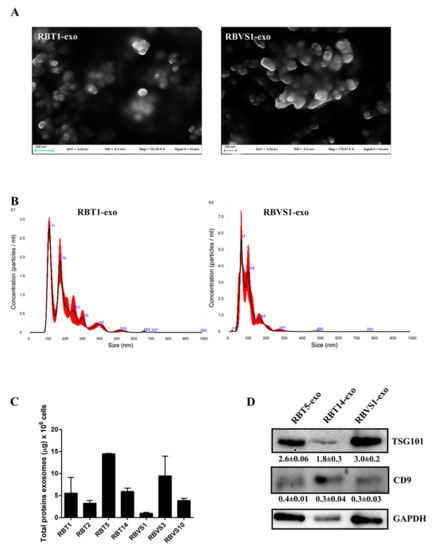
Figure 1.
Characterization of retinoblastoma tumor (RBT)- and RB vitreous seeding (RBVS)-derived exosomes. (A) Scanning electron microscopy (SEM) showing a population of heterogeneous-sized exosomes isolated from representative RBT1 and RBVS1 cell lines. Scale bar: 200 nM. A higher magnification image was reported for RBVS1. Scale bar: 100 nM. (B) Graphics representing size distribution of nanoparticles resulting from NanoSight particle-tracking analysis of RBT1 and RBVS1, taken as representative of all RB cell lines. (C) Quantity of total exosomal protein for 106 cells of the different RB cell lines analyzed. (D) Western blot analysis of the typical exosomal proteins, TSG101 and CD9 for two RBT and one RBVS representative cell lines. GAPDH was reported as loading control. Detailed information about western blot can be found at Figure S1.
2.2. Proteomic Analysis of RBT- and RBVS-Derived Exosomes
To determine the protein profile of exosomes released by RBT and RBVS cell lines, a single shot LC-MS/MS analysis was performed. From the protein database, a total of 5666 proteins were identified in all exosomes, of which 5223 and 3637 proteins were found in RBT- and RBVS-derived exosomes, respectively. Among all proteins, 3194 proteins were shared between the two groups (Figure 2A). In particular, 2831 proteins were found in RBT14, 3861 in RBT5, 2233 in RBT1, 4409 in RBT2, 2903 in RBVS1, 2044 in RBVS3, and 2601 in RBVS10 (Figure 2B,C). The Venn diagram, depicting the extent of overlap among proteins identified in each single RBT cell line, showed 1880 proteins in common (Figure 2B). The comparison between the three RBVS cell lines highlights 1657 proteins shared (Figure 2C). Venn diagram between 1880 RBT and 1657 RBVS common proteins reveals 1274 proteins shared by the two groups, 606 and 383 proteins detected only in RBT or RBVS samples respectively (Figure 2D).
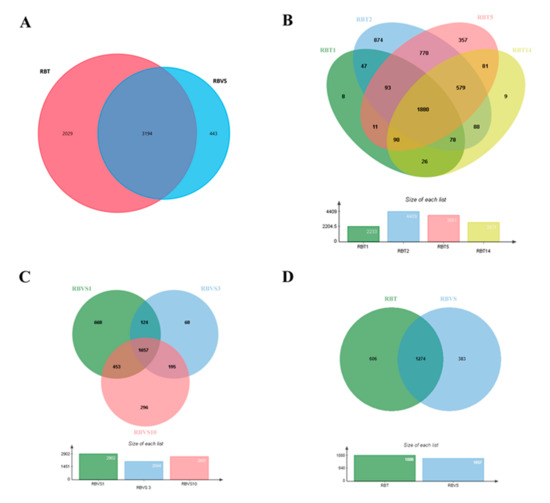
Figure 2.
Proteomic analysis of RBT- and RBVS-derived exosomes. (A) Venn diagram of the total number of detected proteins in RBT and RBVS-derived exosomes. (B) Venn diagram of proteins identified in single RBT1, RBT2, RBT5 and RBT14 cell lines. Notably, 1880 proteins resulted present in exosomes obtained from all RBT cell lines. (C) Venn diagram of proteins detected in single RBVS1, RBVS3 and RBVS10 cell lines. Moreover, 1657 proteins were shared by all the samples. (D) Additionally, 606 proteins were exclusively present in RBT-derived exosomes, while 383 proteins were exclusively present in RBVS-derived exosomes. Furthermore, 1274 proteins were shared by the two groups.
Gene enrichment analysis was performed by FunRich software [14], to characterize exosomal RBT and RBVS proteins, based on molecular function (Figure 3A) and biological processes (Figure 3B). Functionally, the proteins were associated in both groups with RNA binding (4.8% RBT; 5.6% RBVS); transporter activity (4.6% RBT; 4.8% RBVS); translation regulatory activity (1.4% RBT; 1.6% RBVS); chaperone activity (1.5% RBT; 1.8% RBVS); ligase activity (1.1% RBT; 1.4% RBVS); ATPase activity (1.2% RBT; 1.3% RBVS) and isomerase activity (0.6% RBT; 0.7% RBVS). Moreover, 1.9% and 2.2% for RBT and RBVS, respectively, clustered as structural constituent of ribosome, while 0.6% in RBT and 0.8% in RBVS as ribonucleoprotein. Proteins with serine/threonine kinase activity were present only in exosomes derived from RBT (2.4%), while cytoskeletal binding activity exclusively in exosomal RBVS associated proteins (2.1%). Clustering based on the involvement in biological processes (Figure 3B) revealed proteins involved in regulation of nucleic acid metabolism (20.2% RBT; 20% RBVS), energy pathways (11% RBT; 12.2% RBVS), metabolism (11.3% RBT; 12.6% RBVS), and cell growth and/or maintenance (7.1% RBT; 8.9% RBVS).
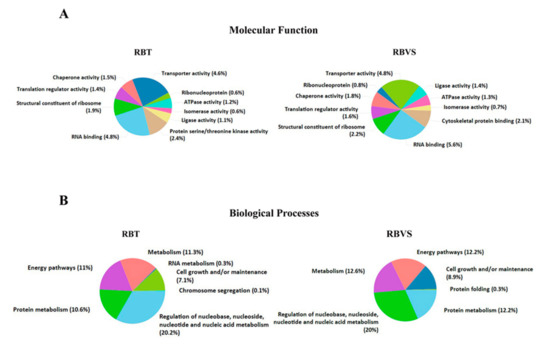
Figure 3.
Gene enrichment of RBT- and RBVS-exosomal proteins. (A) Graphical representation of the molecular function and (B) Biological processes gene enrichment obtained by FunRich software for the 5217 and 3637 proteins, found in RBT- and RBVS-derived exosomes, respectively.
2.3. Exclusive RBT- and RBVS-Exosomal Proteins
The comparison among all proteins highlighted 99 and 35 proteins exclusively present and statistically significant in RBT (Table 1) or RBVS-derived exosomes (Table 2), respectively. In RBT-derived exosomes were exclusively identified as the most significant, as present in all the samples analyzed, the proteins abl interactor 2 (ABI2), glutathione s-transferase Mu (GSTM), neurocan (NCAN), V-type proton ATPase subunit C 1 (ATP6V1C1), synaptosome associated protein 25 (SNAP25), serine/threonine-protein phosphatase 2A (PPP2R2A) and UBX domain protein 4 (UBXN4). In RBVS-derived exosomes were specifically found as the most significant as present in all the samples analyzed, the protein osteoglycin (OGN) and the low-density lipoprotein (LDL) receptor-related protein (LRP-1). The ABI family of adaptor proteins has been linked to signaling pathways involving the Abl tyrosine kinases and the Rac GTPase. ABI proteins localize to sites of actin polymerization in protrusive membrane structures and regulate actin dynamics in vitro, and cell morphogenesis and migration in vivo [15]. The homozygous deletion of murine abi2 results in cell migration defects in the neocortex and hippocampus in vivo and produces abnormal phenotype in the eye. In particular, ABI2 loss leads to the incorrect orientation and migration of secondary lens fibers, probably due to defect in actin polymerization [15]. There is no clear evidence of a role of ABI2 in tumors, but previous reports suggest that ABI2 functions as a tumor suppressor since ABI2 suppresses cell growth [16] and its truncated form accelerates the tumorigenesis [17].

Table 1.
Name, cellular location and function of proteins exclusively present in RBT derived exosomes.
Table 2.
Name, cellular location and function of proteins exclusively present in RBVS derived exosomes.
GSTM protein belongs to the superfamily of enzymes that protect normal cells, by catalyzing conjugation reactions of electrophilic compounds, including carcinogens, to glutathione [18]. In several cancers, the association between GSTM1 polymorphisms and cancer risk has been suggested through meta-analysis studies. These studies showed that the GSTM1 null phenotype increases the risk of liver, gastric, breast, and prostate cancer [19,20]. Moreover, a role for this enzyme in the cisplatin-resistance of cancer cells has been reported [21]. NCAN is expressed abundantly in developing rat retina [22], and in Müller cells correlate with the invasive phenotype in low-grade astrocytoma [23]. Müller cells are the radial glial cells of retina, spanning the entire thickness of the retina and interacting with all retinal cell types. Under pathological conditions, Müller cells are involved in retinal angiogenesis. In response to hypoxia, high glucose, and inflammation conditions, multiple signaling pathways are activated in these cells, which are involved in retinal remodeling following retinal damage [24]. Furthermore, high NCAN expression has been associated with unfavorable outcome in neuroblastoma, as it induces an undifferentiated phenotype that promotes the malignancy [25]. ATP6V1C1 belongs to the vacuolar (H+)-ATPases (or V-ATPases) family that is responsible for the acidification of intracellular compartments in eukaryotic cells [26]. It is known that V-ATPases at the cell surface play a role in maintaining an alkaline intracellular environment favorable for growth, while maintaining an acidic extracellular environment favorable for invasion [27,28]. ATP6V1C1 is overexpressed cancer such as metastatic oral squamous cell carcinoma [29], oral cancer patients [30] and breast cancer [31], and has a role in tumor progression and metastasis. Synaptosomal-associated protein-25 (SNAP-25) is a component of the trans soluble N-ethylmaleimide-sensitive factor (NSF) attachment protein receptors (SNAREs)-complex, a key protein that mediates several cellular processes, including synaptic vesicles fusion, transmitter release, cell growth, cytokinesis and protein transport [32]. An increase in SNAP-25 expression was reported in neuroblastoma SH-SY5Y cells during neuritogenesis [33], and is overexpressed in tumor cells of prolactinomas [34]. On the other hand, a low expression level of SNAP-25 has been found in medulloblastoma tumors associated with defects in dendrite formation and in the impairment of targeted chemotherapy [35].
PPP2R2A is a major heterotrimeric serine/threonine phosphatase, counteracting the actions of Ser/Thr kinases, such as the components of mitogen activated protein kinase (MAPK) and AKT pathways, tumor suppressor pRB and p53, and cyclin-dependent kinase 1 (CDK1) substrates, which are often defective or deregulated in cancer [36]. Finally, UBXN2A protein is a positive regulator of p53, facilitating the translocation of WT-p53 to the nucleus, where p53 regulates its target genes, particularly those involved in apoptosis. For those characteristics, UBXN2A represents an important anticancer factor [37].
OGN, detected exclusively in all samples of RBVS, is a matrix molecule, belonging to the small leucine-rich proteoglycan (SLRP), which functions as an important component of the extracellular matrix. This protein serves as cell scaffold and is involved in collagen fibrillogenesis and cell adhesion [38]. Decreased OGN expression has been observed in a variety of different cancers, including gastric cancer [39], colorectal adenoma [40], squamous cervical and vaginal cancer [41], invasive ductal breast carcinoma [42], and laryngeal carcinoma [43]. In colorectal cancer, OGN expression reduces cell proliferation, inhibits invasion and limits cancer progression [44]. LRP-1 modulates retinal neovascularization by regulating proteolytic activity [45]. In mouse retina, LRP-1 has a role in endothelial cell proliferation and retinal neovascularization. LRP-1 knockdown results in increased PARP-1 activity and subsequent phosphorylation of both RB protein and cyclin-dependent kinase 2 (CDK2), with cell cycle progression and angiogenesis [46]. LRP-1 function depends on the tumor cell type [47]. Indeed, if low LRP-1 expression has been associated with advanced tumor stages and poor survival in several cancers (hepatocellular carcinoma [48], lung adenocarcinoma [49], melanoma [50], and Wilms tumors [51]), high LRP-1 expression has been related to advanced tumor stages (in endometrial carcinoma [52], breast cancer [53], prostate carcinomas [54], and colon cancer [55]).
We further identified molecular function (Figure 4A), biological processes (Figure 4B) and biological pathway (Figure 4C) for proteins exclusively present in RTB- or RBVS-exosomes. Among molecular function, proteins with catalytic activity were abundant in both groups (6.9% RBT; 15.6% RBVS), while extracellular matrix structural constituents were only enriched in RBVS-exosomes (15.6%). The biological processes of proteins exclusively present in RBT-derived exosomes were essentially related to the regulation of energy pathway (13.9%), metabolism (13.9%) and transport (14.9%). There was an enrichment in energy pathway (21.9%), metabolism (25%), and cell growth and/or maintenance (15.6%), for proteins exclusively present in RBVS-exosomes. Intriguingly, the analysis of biological pathway highlighted an involvement in energy-related pathways and neurotransmitter release for proteins exclusively transported by RBT-exosomes, while RBVS-exosomes were enriched with proteins involved in integrins-mediated signaling and platelet aggregation (Figure 4C). Integrins participate in cell-cell and cell-matrix interaction and have been involved in metastatic processes in several cancers [56,57,58]. In particular, αIIbβ3 integrin was first identified in platelets and later in cells derived from solid tumors, where its expression correlates with the invasive phenotype [59,60,61]. Moreover, it has been described that, integrin αIIbβ3 specifically activates c-Src to induce platelet spreading and thrombus formation [62], mediating tumor cell attachment to the vessel wall under flow condition [63]. Another interesting pathway that emerged links p130Cas to integrins through the MAPK. p130Cas is a multifunctional signaling adaptor protein which integrates signals generated from a variety of extracellular stimuli and regulates several cellular processes including cell death. p130Cas has a particular role in anoikis, which is a programmed cell death induced upon cell detachment from extracellular matrix. Anoikis represents a critical mechanism in preventing adherent-independent cell growth and attachment to an inappropriate matrix, thus avoiding the colonizing of distant organs. p130Cas is specifically cleaved during anoikis; in anoikis-sensitive cells, but not in anoikis-resistant tumor cells [64]. Another biological pathway involves Netrins, secreted or membrane bound proteins originally proposed to play an important role in development of the central nervous system and in axon guidance, but recently shown to have a pivotal role in cancer [65,66]. The expression of Netrin-1 is increased in many cancers and the binding with its receptor, uncoordinated-5 homolog (UNC5B), results in the inhibition of p53-related apoptosis [66,67].
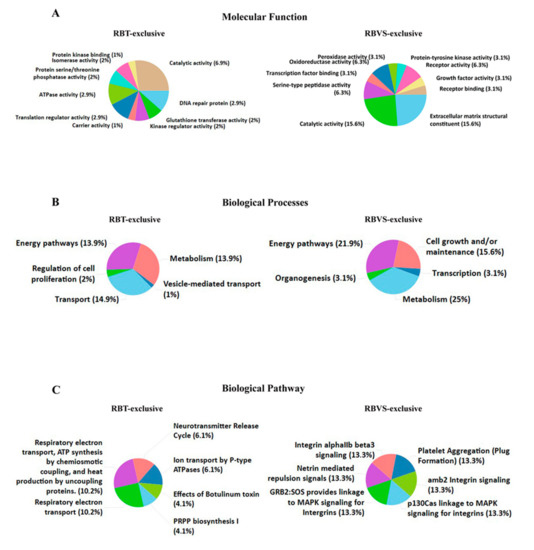
Figure 4.
Exclusive RBT- and RBVS-exosomal proteins. Graphical representation of the molecular function (A), biological processes (B) and biological pathway (C) gene enrichment obtained by FunRich software for the 99 and 35 proteins found exclusively in RBT- or RBVS-derived exosomes, respectively.
2.4. Differentially Expressed Proteins in RBT- and RBVS-Derived Exosomes and Their Network
Principal component analysis (PCA) was performed to visualize any similarities or differences between samples derived from RBT or RBVS cell lines. The two-dimensional plot shows that exosomal proteins from primary tumor (RBT1, RBT2, RBT5, RBT14) are well separated from proteins of vitreous seeding cell lines (RBVS1, RBVS3, RBVS10) (Figure 5).
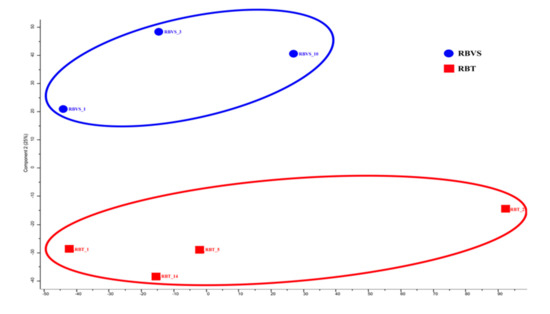
Figure 5.
Level of similarity of individual samples. Multidimensional scaling (MDS) and k-means analysis of exosomes of RBT and RBVS proteome profile. Two-dimensional scatter plot of MDS and k-means analysis of RBT (red square) and RBVS (blue square) exosomes shows a clear discrimination between the two types of samples. The average value of the three replicates analyzed is shown.
A Student’s t-test analysis (FDR < 0.05 and S0 > 0.1) was performed to characterize differences and reciprocal relationships between the two groups. The significant proteins were plotted using a Volcano plot (Figure 6A) and an unsupervised hierarchical clustered HeatMap (Figure 6B). A total of 246 proteins were differentially expressed: 205 were up-regulated in RBT and 41 in RBVS-derived exosomes. We performed a Cytoscape analysis to identify molecular interaction pathways and biological functions of proteins found in RB exosomes. For this purpose, we used significant proteins obtained between the two groups through the t-test (RBT and RBVS-derived exosomes). In order to gain biological information from statistically modulated proteins, we have highlighted which pathways were altered in the two groups of disease, through the representation of pie charts of the enrichments in terms of biological and immunological GO annotations and using the information described in Reactome and Wiki-pathways database to simultaneously graph RBT (red) and RBVS (blue) conditions. This analysis generated a network containing 81 proteins, where the color of each node represents the fold change obtained after Student’s t-test: the red proteins are significantly up-regulated in RBT-derived exosomes, while the blue proteins are up-regulated in RBVS-derived exosomes (Figure 6C). Each node expresses the percentage of protein found in RBT- and RBVS-derived exosomes. The most represented pathways were involved in: (i) cellular response to hypoxia, (ii) endoplasmatic reticulum unfolded protein response, (iii) response to elevated platelet cytosolic Ca2+, (iv) platelet degranulation, (v) transmission across chemical synapses, (vi) neurotransmitter release vesicle localization, (vii) glutamate neurotransmitter release cycle, (viii) synaptic vesicle localization, (ix) vesicle mediated transport in synapse, (x) ion transport by P-type ATPases, (xi) cardiac conduction, (xii) ion homeostasis, (xiii) ion channel transport, (xiv) cation-transporting ATPase activity, (xv), P-P-bond-hydrolysis-driven transmembrane transport activity, (xvi) proton-exporting ATPase activity, (xvii) ATPase activity, coupled to the transmembrane movement of ions, phosphorylative mechanism, xviii) purine, ribonucleoside triphosphate metabolic process.
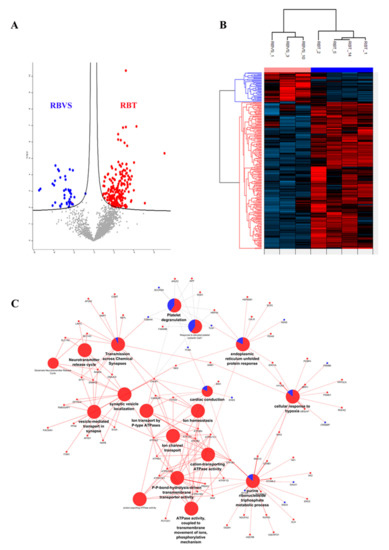
Figure 6.
Differentially expressed proteins in RBT- and RBVS-derived exosomes and their network. (A) Volcano plot of differentially expressed proteins. Red dots depict proteins that display both large magnitude fold changes (x-axis, to the right there are proteins upregulated in RBT samples), as well as high statistical significance (−log10 of p value, y-axis). On the left side, dots representing RBVS proteins were reported, while on the right side, dots representing RBT proteins were showed. The black line shows where FDR = 0.05 and s0 = 0.1. Grey dots represent proteins for whom either fold change is <2 (log2 = 1) or p > 0.05. Each data point is smoothed out by a suitable Gaussian kernel; (B) Unsupervised hierarchical-clustered heatmap of proteins identified by t-test. The amount of each protein in individual samples is represented by the color scheme, in which red and blue indicate high and low proteins expression, respectively. The average of three biological replicates is shown; (C) Network represents the interactions between proteins that are significantly modulated between RBT and RBVS. Small nodes are proteins, while the big ones represent the functional annotation of protein clusters. The color of each node represents the fold change obtained after t-test: the red ones are RBT significant proteins, while the blue ones are the RBVS significant proteins. Similarly, the nodes that represent GO annotations are colored using pie charts according to the percentage of proteins either up- or down-regulated. ABI2 Abl interactor 2 AK2 Adenylate kinase 2, mitochondrial; AP23S1 AP-3 complex subunit sigma-1; AP2A AP-2 complex subunit alpha-2: APLP2 Amyloid-like protein 2; APP Amyloid beta A4 protein; ASNS Asparagine synthetase [glutamine-hydrolyzing]; ATP1A3 Sodium/potassium-transporting; ATPase subunit alpha-3; ATP1B1 Sodium/potassium-transporting ATPase subunit beta-1; ATP2A2 Sarcoplasmic/endoplasmic reticulum calcium ATPase 2; ATP2B2 Plasma membrane calcium-transporting ATPase 2; ATP2B3 Plasma membrane calcium-transporting ATPase 3; ATP5F1D ATP synthase subunit delta, mitochondrial; ATP6V1B2 V-type proton ATPase subunit B, brain isoform; ATP6V1C1 V-type proton ATPase subunit C 1; ATP6V1E1 V-type proton ATPase subunit E 1; ATP6V1G2 V-type proton ATPase subunit G 2; ATP8A1 Phospholipid-transporting ATPase IA; BIN1 Myc box-dependent-interacting protein 1; CALM1 Calmodulin-1; CALR Calreticulin; CAMK2B Calcium/calmodulin-dependent protein kinase type II subunit beta; CCNB1 G2/mitotic-specific cyclin-B1; COMT Catechol O-methyltransferase; CREBBP CREB-binding protein; DLD Dihydrolipoyl dehydrogenase, mitochondrial; DNAJ5 DnaJ homolog subfamily C member 5; DPYSL2 Dihydropyrimidinase-related protein 2; EHD3 EH domain-containing protein 3; ENO2 Gamma-enolase; Enolase; ENO3 Beta-enolase; Enolase; ERO1A ERO1-like protein alpha; FAM49B Protein FAM49B; FLNA Filamin-A; FXYD6 FXYD domain-containing ion transport regulator 6; GALK1 Galactokinase; GNB1 Guanine nucleotide-binding protein G(I)/G(S)/G(T) subunit beta-1; HK1 Hexokinase-1; HSP90B1 Endoplasmin; HSPA5 78 kDa glucose-regulated protein; HYOU1 Hypoxia up-regulated protein 1; ITSN1 Integrator complex subunit 1; LIN7C Protein lin-7 homolog C; MAPT Microtubule-associated protein tau; MED12 Mediator of RNA polymerase II transcription subunit 12; MIA3 Melanoma inhibitory activity protein 3; MPP1 55 kDa erythrocyte membrane protein; NAPB Beta-soluble NSF attachment protein; NDUFA2 NADH dehydrogenase [ubiquinone] 1 alpha subcomplex subunit 2; NEFL Neurofilament light polypeptide; NUP50 Nuclear pore complex protein Nup50; OGDH 2-oxoglutarate dehydrogenase, mitochondrial; PACSIN1 Protein kinase C and casein kinase substrate in neurons protein 1; PCBP4 Poly(rC)-binding protein 4; PCYOX1 Prenylcysteine oxidase 1; PDIA5 Protein disulfide-isomerase A5; PFN2 Profilin-2;Profilin; PPIF Peptidyl-prolyl cis-trans isomerase F, mitochondrial; PPP3CA Serine/threonine-protein phosphatase 2B catalytic subunit alpha isoform; PRDX2 Peroxiredoxin-2; PSMB6 Proteasome subunit beta type-6;Proteasome subunit beta type; PSMD1 26S proteasome non-ATPase regulatory subunit 1; RAB3A Ras-related protein Rab-3A; RAB3GAP1 Rab3 GTPase-activating protein catalytic subunit; ROCK2 Rho-associated protein kinase 2; SCCPDH Saccharopine dehydrogenase-like oxidoreductase; SCP2 Non-specific lipid-transfer protein; SLC1A2 Excitatory amino acid transporter 2;Amino acid transporter; SLC1A3 Amino acid transporter; Excitatory amino acid transporter 1; SLC25A13 Calcium-binding mitochondrial carrier protein Aralar2; SNAP25 Synaptosomal-associated protein 25; SOD1 Superoxide dismutase [Cu-Zn]; STOML2 Stomatin-like protein 2, mitochondrial; SV2A Synaptic vesicle glycoprotein 2A; SYT1 Synaptotagmin-1; SYTL2 Synaptotagmin-like protein 2; TLN1 Talin-1; TUBA4A Tubulin alpha-4A chain; UBQLN1 Ubiquilin-1; UQCRB Cytochrome b-c1 complex subunit 7; UQCRFS1 Cytochrome b-c1 complex subunit Rieske, mitochondrial.
Exosomes derived from RBT cells showed upregulated proteins belonging to all the nodes listed above, while in exosomes isolated from RBVS cell lines, we found a significant representation of proteins involved in transmission across chemical synapses, platelet degranulation, response to elevated platelet cytosolic Ca2+, cardiac conduction, endoplasmatic reticulum unfolded protein response, cellular response to hypoxia, purine and ribonucleoside triphosphate metabolic process. In particular, 12 proteins were the most represented in the network for RBVS-exosomes: enolase 3 (ENO3), galactokinase-1 (GALK1), synaptotagmin like 2 (SYTL2), CREB binding protein (CREBBP), proteasome 26S subunit, non-ATPase (PSMD), Eps15 homology (EH) domain-containing protein 3 (EHD), filamin A (FLNA), talin-1 (TLN-1), asparagine synthetase (ASNS), saccharopine dehydrogenase (SCCPDH), tubulin alpha 4a (TUBA4A). Among those, ENO3, GALK1, ASNS and SCCPDH are all enzymes involved in metabolic pathways. ENO3, also known as phosphopyruvate hydratase, is a metalloenzyme responsible for the catalysis of the conversion of 2-phosphoglycerate (2-PG) to phosphoenolpyruvate (PEP), the ninth and penultimate step of glycolysis. GALK1 is an enzyme of the Leloir pathway, a metabolic pathway found in most organisms for the catabolism of β-D-galactose to glucose 1-phosphate. ASNS catalyzes the synthesis of asparagine and glutamate from aspartate and glutamine in an ATP-dependent amidotransferase reactin [68], and SCCPDH is an enzyme involved in the metabolism of the amino acid lysine, via an intermediate substance called saccharopine [69]. FLNA and TLN are important proteins for the connection of the cytoskeleton with ECM. In particular, FLNA is a well-known actin cross-linking protein that serves as a scaffold for over 90 binding partners and is involved in multiple cell functions, such as cell migration and adhesion [70]. The role of FLNA in cancer development is controversial and although its overexpression has been observed in several tumors [71,72,73,74,75,76,77,78,79,80], in some cases opposite roles have been described. For example, in breast cancer cells, the interaction of FLNA with cyclin D1 promotes migration and invasion [81], while on the other hand, the regulation of focal adhesion disassembly by FLNA leads to the suppression of breast cancer cell migration and invasion [82]. In prostate cancer, FLNA binding promoted androgen receptor (AR) localization to the nucleus [83], promoting prostate cancer progression, but once in the nucleus, it inhibited the transcriptional activity of the same transcription factor [84]. Moreover, being a scaffold protein, the function of FLNA depends on the binding partners available for its interaction.
TLN is a focal adhesion protein that links intracellular networks with the ECM, via its connection with the actin cytoskeleton and membrane integrins. TLN dysregulation can lead aberrant integrin activation and mechanotransduction, causing changes in cell spreading, migration and survival [85].
2.5. Comparison of Proteins Differentially Expressed between Exosomes Derived from RBT and RBVS of the Same Patient
We performed a comparison of exosomal proteins derived from RBT and RBVS cells of the same patients (RBT1 and RBVS1). This analysis showed a total of 1582 proteins for RBT1 and 1472 proteins for RBVS1, 1395 proteins were in common. Among all proteins, 187 proteins were exclusive for RBT1 and 77 for RBVS1 (Figure 7A). A total of 92 proteins were differentially expressed: 66 were up-regulated in RBT and 26 in RBVS-derived exosomes (Figure 7B). Gene enrichment analysis was performed by FunRich [14] software, to characterize common and exclusive exosomal proteins derived from RBT1 and RBVS1. Common proteins between RBT1 and RBVS1 were functionally involved in RNA binding (7.5%), were structural constituents of ribosome (5.2%), and presented a GTPase (3.7%), chaperone (3%) or translation regulator (2.2%) activity. Moreover, they were involved in biological processes such as regulation of nucleobase, nucleoside, nucleotide and nucleic acid metabolism (20.7%), protein metabolism (17.8%), energy pathways (14.5%) and cell growth and/or maintenance (10.3%) (Figure 7C). Instead proteins exclusively present in RBT1-derived exosomes were involved in molecular function such as RNA binding (6.4%) or protease activity ubiquitin-specific (6.4%), and in biological processes such as transport (10.1%), hormone metabolism (0.5%) and osmoregulation (0.5%) (Figure 7D,E). Proteins exclusively detected in RBVS1-derived exosomes were principally involved in enzymatic (5%) and transporter activity (6.5%), and in nucleic acid metabolism (20.4%) (Figure 7D,E).
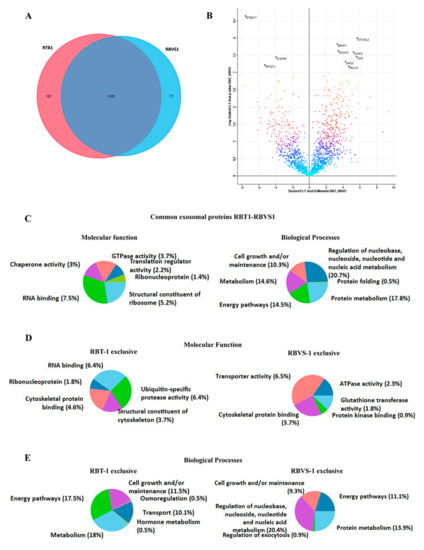
Figure 7.
Comparison of proteins differentially expressed between exosomes, derived from RBT and RBVS of the same patient. (A) Venn diagram of the total number of detected proteins in RBT1 and RBVS1-derived exosomes. Notably, 187 proteins were exclusively present in RBT1-derived exosomes, while 77 proteins were exclusively present in RBVS1-derived exosomes. Overall, 1395 proteins were shared by the two cell lines. (B) The volcano plot illustrates the results of data obtained from the two different conditions, RBT1 and RBVS1. The proteomes are compared, starting from a value of FDR < 0.05 and S0 > 0.1. Density plot coloration highlights the similarity between the two groups, black dots are the proteins that exceed the acceptability threshold, significantly modulated. (C) Graphical representation of the molecular function and biological processes for common exosomal proteins of RBT1 and RBVS1 obtained with FunRich software. (D) Graphical representation of molecular function gene enrichment for RBT1 and RBVS1 exclusive proteins. (E) Graphical representation of biological processes gene enrichment for RBT1 and RBVS1 exclusive proteins.
3. Discussion
Although intraocular RB has achieved a high cure rate through multimodal therapies, there is still an important need to develop new treatment in order to improve globe retention, in the most advanced intraocular cases, and vision preservation, as well as to avoid the late effects. Indeed, even though the management of advanced intraocular RB is improving rapidly, with enucleation progressively being supplanted by new therapeutic approaches with local delivery of standard chemotherapy [86], refractory or recurrent diffuse vitreous seeding is associated, in most cases, with the failure of eye salvage in patients with RB [7]. For these reasons, novel prognostic biomarkers, predictive for vitreous seeding dissemination and response to therapy, and new therapeutic targets are needed. Due to the risk of extraocular spread, traditional biopsy is contraindicated in RB, thus, the application of liquid biopsy as a non-invasive way represents a promising surrogate marker to perform molecular studies in RB and to define the disease more in depth. Exosomes are emerging as new circulating biomarkers in the liquid biopsy field. Cell membrane-derived nanovesicles (30–100 nM in diameter), containing RNA, microRNA, lipids and proteins, exosomes are released by several cell types and mainly by tumor cells [9,87,88]. The possibility to isolate exosomes from different sources, as well as to monitor their content in a relatively simple way, allows one to follow tumor evolution and evaluate the response to therapy over time. In this study, we characterized the proteomic cargo of exosomes isolated from RBT with those obtained from RBVS. We analyzed proteins exclusively present in all samples of RBVS and RBT-derived exosomes and proteins enriched in RBVS samples with respect to RBT. Moreover, having the primary cell lines of both primary tumor and vitreous seeding available to the same patient, we compared also these two samples. Our aim was to identify new putative biomarkers and therapeutic target associated to vitreous seeding in RB. Vitreous seeding results from a clonal selection of RB cells that are able to proliferate in the avascular vitreous environment and survive in such hypoxic conditions [89]. The ability of these cells to survive and grow under hypoxic condition depends on metabolic reprogramming and/or resistance to anoikis. The anoikis is a form of programmed cell death occurring in anchorage-dependent cells, following the detachment from the surrounding ECM. From our analysis, RBVS exosomal proteins are involved in processes of remodeling and interaction with ECM, in pathways linked to integrins signaling and in resistance to anoikis. These observations reflect the ability of RB cells that seed in the vitreous to detach from the primary retinal tumor, migrate and survive under inappropriate conditions. Alteration in integrin expression have been observed in several cancers and is thought to play a central role in cancer spread and metastasis [56]. Integrins bind to multi-adhesive ECM components, organizing the cytoskeleton and activating intracellular signaling pathways. They have been shown to affect cell shape, polarization, cytoskeletal organization, cell motility, proliferation, survival and differentiation [90]. Moreover, integrins have been identified in exosomes, and their transfer through these vesicles is implicated in the promotion of cell adhesion, migration and the determination of organotropism in metastatic dissemination [58,91]. During retinal development, ECM constituents play versatile roles, which include cellular proliferation, differentiation, migration, adhesion and maturation, as well as axonal growth and guidance [92,93,94,95]. ECM components and their remodeling have a crucial role in several diseases of the retina, such as retinal injury and cancer, where changes in the interaction of cells and ECM components occur with a consequent disruption of the retinal homeostasis [96,97]. In particular RBVS cells secrete exosomes enriched with TLN, a key cytoplasmic protein that mediates integrin adhesion to the ECM. TLN is an adaptor protein forming the core of integrin adhesion complexes by linking integrins directly to actin; TLN has been demonstrated to have an important role in cancerogenesis, promoting the invasion and anoikis’ resistance of human prostate cancer cells [98]. TLN-1 is upregulated in primary and metastatic prostate cancer compared to the normal prostate gland [98] and its downregulation led to a reduction of metastatic ability in vivo. Furthermore, the expression of TLN-1 has been reported as being significantly high in poorly differentiated prostate tumors and in cells with highly metastatic potential [99]. Intriguingly, the knockout of exosomal TLN-2 in murine lymphocytes TK1 leads to a reduced binding to the integrin ligand ICAM-1 and MAdCAM-1. Furthermore, TLN-2-deficient T-cell-exosomes were less efficiently internalized by murine bEnd.3 endothelial cells, compared with control exosomes, suggesting a critical role of TLN-2 in integrin functions in exosomes [100]. An interesting evidence is the involvement of TLN and integrin in invadosomes [101], microdomains including podosomes and invadopodia formed at the ventral surface of the cells capable of interacting with ECM and degrading it [102,103]. Invadosomes are formed by an F-actin core surrounded by a ring of regulatory and adhesive proteins such as integrins, TLN, vinculin and paxillin [101]. Furthermore, the ß3 integrin (ITGB3) founded exclusively in exosomes isolated from RBVS cells exerts several crucial roles in malignant tumor progression, such as metabolic reprogramming, maintenance of a stem-like phenotype and drug resistant acquisition [104]. Interestingly, vitreous seeds result from the clonal selection of RB cells that are able to proliferate in tumor-spheres likewise stem cells, and are prone to develop chemo-resistance properties. Additionally, GSTM1, exclusively detected in RBVS exosomes, has been implicated in cancer chemoresistance [105,106].
FLNA is another adaptor protein susceptible to proteolysis implicated in cytoplasm remodeling and interaction with the ECM. In the cytoplasm, full-length FLNA promotes the development of metastasis [107], whereas when nuclear, it was shown to be necessary for the inhibition of transcription and susceptibility to therapeutic interventions [84]. FLNA interacts with many proteins related to cancer metastasis and has a role in cancer progression [108,109,110]. Intriguingly, a role in podosomes formation and stabilization has been reported for FLNA in macrophages [111]. Through strategies of knock-out, knockdown and rescue it has been demonstrated that FLNA is involved in podosomes stability and their organization, regulates the proteolysis of the matrix and is required for podosomes formation in macrophages. A link between invadopodia formation and exosomes production has been described in the tongue squamous cell carcinoma SCC61 cell line [112]. In particular, it has been observed that the inhibition of invadopodia formation reduced exosomes secretion in culture media. On the other hand, the addition of purified exosomes or the inhibition of exosomes secretion affected the invadopodia formation, stabilization and exocytosis of proteinases indicating a key role for exosomes cargoes in the promotion of invasive activity. The fact that exosomes released by RBVS cells are enriched in proteins involved in ECM remodeling and invadosomes formation suggests their potential role in tumor dissemination during invasion and metastasis. OGN, detected exclusively in all samples of RBVS, is a small leucine rich proteoglycans of the ECM, where both structural and non-structural functions are exerted; it has been implicated in wound healing and inflammation of the eye [113]. Decreased OGN expression has been described in several malignancies, and for this reason, even if its precise role remains undefined, it is thought to be a tumor suppressor. The exclusive presence of this protein in the exosomes of RBVS cells suggests that it is eliminated by the metastatic cells to limit its tumor suppressor action or for its involvement in wound healing mechanisms related to tumor mass expansion and dissemination.
Netrins are a family of extracellular proteins that control axonal and cellular migration in embryogenesis. In particular, it has been suggested that Netrin acts through an adhesive process called haptotaxis [114], providing traction for a growth cone to navigate and generating a gradient to direct neurite growth.
In cancer, Netrin-1 has a double role: it is a survival factor and a promoter of cell invasion [115]. In particular, netrin-1 up-regulation has been observed to be the way to gain survival advantage for several cancers, such as colorectal cancer, neuroblastoma, glioblastoma and metastatic breast cancer [116,117,118,119]. Furthermore, higher Netrin-1 expression has been correlated with invasion and metastasis in distant sites in colon carcinoma, adenoma, pancreatic ductal adenocarcinoma and breast cancer [118,120,121].
In RBVS exosomes proteins involved in metabolic pathways or in resistance to anoikis were also found. Anoikis is a programmed cell death induced upon cell detachment from the extracellular matrix, behaving as a critical mechanism in preventing adherent-independent cell growth and attachment to an inappropriate matrix, thus avoiding the colonizing of distant organs. If non neoplastic cells undergo anoikis in response to ECM detachment, cancer cells rapidly develop several mechanisms to resist anoikis. Cancer cells can achieve resistance to anoikis through several mechanisms, such as a specific switch in integrins, which leads them to adapt to the metastatic site or change their metabolism [122]. Cells’ detachment from ECM strongly influences the metabolism of normal cells, reducing glucose uptake, glycolytic flux, mitochondrial respiration and the pentose phosphate pathway. The consequences of detachment from ECM are the reduction of both intracellular ATP and NADPH concentration, the reduction of fatty acid oxidation, the increase of ROS production and the induction of apoptosis. In recent years, it has been highlighted that the modulation of metabolic pathways in cancer cells contributes to the increase of anoikis resistance. Cancer cells metabolize high glucose levels through glycolysis, but most of the pyruvate obtained is transformed into lactate instead of being oxidized in mitochondria, a phenomenon described as the Warburg effect. Intriguingly, RBVS, which are metastatic cells able to survive in a hypoxic environment, release exosomes carrying up-regulated proteins involved in glycolysis, in glucose catabolism or in amino-acid synthesis, such as ENO3, GALK1, ASNS and SCCPDH. It is known that cells that manage to survive in the hypoxic environment of the eye and that are resistant to anoikis are able to escape from the primitive tumor site and establish a metastasis in the vitreous [89]. Based on our evidence, we hypothesize that these cells are able to produce exosomes loaded with proteins that facilitate ECM remodeling, resistance to anoikis and changes in metabolism (Figure 8). The fate and function of these exosomes depend on which cell they interact with. Indeed, exosomes released in the vitreous by vitreous seeding cells can be both incorporated by metastatic cells in an autocrine way, strengthening the aggressive phenotype, or reach sites as far away as the cells of the primary tumor. In target cells, RBVS-derived exosomes may transfer proteins involved in invadosomes formation inducing an invasive phenotype that, together with the increased resistance to anoikis and changes in metabolism, makes the cells able to escape from the primitive mass, digest the matrix and survive in a hypoxic environment in the vitreous. Moreover, Netrin-enriched exosomes secreted by vitreous seeding cells could generate a gradient that drives nerve growth and facilitates tumor innervation, which is an emerging feature of tumor progression [123].
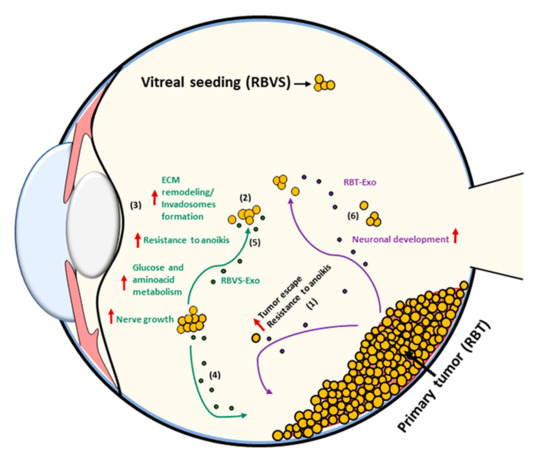
Figure 8.
Schematic model of RBVS-exosomes role in vitreous seeding formation. From primary tumor few cells (RBT) that are able to survive in the hypoxic environment of the eye and that acquire resistance to anoikis, escape from the primary mass (1) and establish a metastasis in the vitreous (RBVS) (2). Exosomes secreted by RBVS cells are enriched in proteins implicated in ECM remodeling/invadosomes formation, resistance to anoikis, changes in metabolism and nerve growth (3). These cells can be up-taked by: (i) RBT cells inducing an invasive phenotype transferring their protein cargo and inducing anoikis resistance, formation of invadosomes, changes in metabolism in target cells (4) or (ii) by RBVS- cells strengthening their aggressiveness (5). RBT-exosomes are enriched in proteins involved in neuronal development (6).
4. Materials and Methods
4.1. Cells and Cell Culture
Human RB cell lines HSJD-RBT1, HSJD-RBT2, HSJD-RBT5, HSJD-RBT14 and HSJD-RBVS1, HSJD-RBVS3, HSJD-RBVS10 were obtained from enucleated eyes of RB patients at Hospital Sant Joan de Deu (HSJD, Barcelona, Spain) and were kindly provided by Dr. Angel Montero Carcaboso. Specimens were collected from two possible sources: solid tumor tissue in the retina (RB tumor; RBT) and tumor seeding in the vitreous humor (RB vitreous seedings; RBVS) [124]. Cells were cultured as floating tumor-spheres in neural stem cell medium (serum-free), consisting of Neurobasal-A Medium (1×, ThermoFisher, Waltham, MA, USA), plus DMEM/F-12 (1×, ThermoFisher, Waltham, MA, USA) supplemented with HEPES Buffer Solution (1M, ThermoFisher, Waltham, MA, USA), Sodium pyruvate mem 100 mM (CE, ThermoFisher, Waltham, MA, USA), MEM Non-essential Amino Acids Solution 10 mM (100×, ThermoFisher, Waltham, MA, USA), GlutaMAX-I Supplement (100×, ThermoFisher, Waltham, MA, USA), Antibiotic-Antimycotic (100×, ThermoFisher, Waltham, MA, USA) B27 Supplement Minus Vitamin-A (50×, ThermoFisher, Waltham, MA, USA), Recombinant Human-basic FGF (20 ng/mL, Peprotech, Cranbury, NJ, USA), Recombinat Human EGF (20 ng/mL, Peprotech, Cranbury, NJ, USA), Human PDGF-AA (20ng/mL, Peprotech, Cranbury, NJ, USA), Human PDGF-BB (10 ng/mL, Peprotech, Cranbury, NJ, USA) and Heparin Solution 0.2% (2 µg/mL, Sigma Aldrich, St. Louis, MO, USA), as previously described [125]. Cell lines were maintained at 37 °C in a 5% (v/v) CO2 humidified incubator.
4.2. Exosomes Purification and Characterization
Exosomes were purified from culture media after 3–4 days culture by sequential centrifugation. Supernatants were centrifuged at 500× g for 10 min to remove cell contamination, then at 12,000× g for 20 min to eliminate possible apoptotic bodies and large cell debris. Then, exosomes were collected by spinning at 100,000× g for 70 min, twice, using a 70Ti rotor (Beckman Coulter, Fullerton, CA, USA). The final pellet was resuspended in PBS or specific lysis buffer for proteomic analysis. Three different biological replicates were prepared for each cell line, and analyzed both for characterization and mass spectrometry analysis. Protein concentration was measured by bicinchoninic acid assay (BCA, Pierce, Thermo Fisher Scientific, Waltham, MA, USA). Exosomes preparations were verified by SEM. Several drops of vesicles suspension (20 μL each) were placed on Parafilm. A formvar-coated nickel grid (Electron Microscopy Sciences, Hatfield, PA, USA) was placed on the top of each drop for 1 h in a humidified chamber. Grids were then fixed with 2.5% glutaraldehyde (Fluka, St. Louis, MO, USA) in phosphate buffer (PB), for 5 min at room temperature. The grids were attached on metal stubs, coated with chrome to a thickness of 10 nM and examined with a ZEISS-LEO 1525 (Laboratorio Universitario di Nanomateriali—University of Perugia). The NS500 nanoparticle characterization system (NanoSight, Salisbury, UK), equipped with a blue laser (405 nM), was used to characterize exosome size and particle number (CNIO, Madrid, Spain).
4.3. Western Blot
Cell lysis buffer (Cell Lysis Buffer (10×) #9803 Cell Signalling Technology, Danvers, MA, USA), supplemented with 10 mM phenylmethylsulphonylfluoride (PMSF 93,482 Sigma, St. Louis, MO, USA), as a protease inhibitor was used to extract the proteins from exosomes. Briefly, lysates were incubated on ice for 15 min and centrifugated at 13,000× g for 20 min at 4 °C. Equal micrograms of proteins, quantified with BCA assay (Pierce, Thermo Scientific, Waltham, MA, USA) and boiled in SDS-loading buffer (2× Laemmli Sample Buffer BIORAD cat.#161-0737), were resolved on 10% SDS-PAGE and transferred to PVDF membranes (Immun-Blot® PVDF Membrane for protein Blotting BIORAD cat.#162-0177). Blots were blocked for 1 h in TBS-T (TBS plus 0.05% Tween-20), 5% nonfat, dried milk and probed overnight at 4 °C with anti-TSG101 (4A10) ab83 (Abcam, Cambridge, UK), anti-CD9 (C-4) sc-13118 (Santa Cruz Biotechnology, Dallas, TX, USA), anti-GAPDH (D16H11) XP (Cell Signaling Technology®, Danvers, MA, USA). Immunocomplexes were detected with horseradish peroxidase-conjugated species-specific secondary antibodies (Santa Cruz Biotechnology, Dallas, TX, USA), followed by enhanced chemiluminescence reaction with Immobilion Western Chemiluminescence HRP substrate WBKLS0100 (Millipore, Burlington, MA, USA).
4.4. Sample Preparation for Mass Spectrometry, NanoLC and Mass Spectrometer Setup
The exosome pellets were re-suspended in 50 μL of lysis buffer (6M GdmCl, 10 mM TCEP, 40 mM CAA, 100 mM Tris pH 8.5). In eppendorf cells were lysed, reduced and alkylated; lastly, 5% ProteaseMAX surfactant (Promega, Madison, WI, USA) was added to enhance protein digestion by providing a denaturing environment prior to protease addition. To the samples were added 0.3 µg LysC and 0.7 µg Trypsin in 250 µL of a dilution buffer (10% ACN, 25 mM Tris HCl pH 8.5), to dilute the ProteaseMAX to 0.1%. After overnight digestion at 37 °C, the peptides were acidified with 0.1% TFA and loaded into StageTip. [126].
The tryptic peptides, after a speed vacuum concentration, were loaded directly into a 75 μm ID × 50 cm 2 μm, 100 Å C18 column, thermostated at 55 °C, and the peptides were separated with an organic solvent at a flow rate of 250 nL/min, using a non-linear gradient of 5–45% solution B (80% CAN and 20% H2O, 0.1% FA) in 140 min, and analyzed using an Orbitrap Fusion Tribrid mass spectrometer (Thermo Scientific Instruments, Bremen, Germany). Orbitrap detection was used for both MS1 and MS2 measurements at resolving powers of 120 K and 30 K (at m/z 200), respectively. Data dependent MS/MS analysis was performed in top speed mode with a 2 sec cycle-time, during which precursors detected within the range of m/z 375−1500 were selected for activation in order of charge state, using CHarge Ordered Parallel Ion aNalysis (CHOPIN) [127].
Briefly, if precursor charge state is 2, then follow with CID fragmentation and by scan in the ion trap with an isolation window 1.6 m/z, AGC 3e4, maximum injection time 250 ms and normalized collision energy of 35%. If precursor charge state is 3–7 and precursor intensity is greater than 500,000, then follow with HCD fragmentation and by scan in the Orbitrap with a resolution 15,000, AgC 1e4 and maximum injection time 40 ms. If precursor charge state is 3–7 and precursor intensity is below 500,000, then follow with CID fragmentation and scan in the ion trap.
The mass spectrometry proteomics data have been deposited to the ProteomeXchange Consortium via the PRIDE [128] partner repository with the dataset identifier PXD016488”. (Reviewer account details: Username: reviewer66723@ebi.ac.uk; Password: 6oxpairt)
4.5. Data Analysis and Statistical Methods
MaxQuant software was used to process the raw data, setting a false discovery rate (FDR) of 0.01 for the identification of proteins, peptides and PSM (peptide-spectrum match); moreover, a minimum length of six amino acids for peptide identification was required. Andromeda engine, incorporated into MaxQuant software, was used to search MS/MS spectra against the Uniprot human database. For protein digestion, allowing for cleavage N-terminal to proline, trypsin was chosen as enzyme. Cysteine carbamidomethylation was selected as fixed modification, whereas acetylation protein N-terminal, oxidation (M) and deamidation (N, Q) have been selected as variable modifications. A tolerance of 7 ppm was set for the mass deviation of the precursor ions, while the maximum mass deviation for MS2 events was 0.5 Da. Algorithm MaxLFQ [129] was chosen for protein quantification, with the activated option ‘match between runs’ to reduce the number of the missing proteins. All bioinformatics analyses were done with the Perseus software of the MaxQuant computational platform [130]. Protein groups were filtered to require 70% valid values in at least one experimental group. The label-free intensities were expressed as base log2, and empty values were imputed with random numbers from a normal distribution for each column, to best simulate low abundance values close to noise level. For each group, a t-test with permutation-based FDR of 0.05 and a s0 of 0.1 was used. The Venn diagram of identified proteins was calculated using an online tool [131]. To visualize the profile of the experiment, a hierarchical clustering of resulting proteins was performed on log2 intensities after z-score normalization of the data for each exosome line, using Euclidean distances. Lastly, the network was built on significant proteins obtained by the t-test between two groups (RBT and RBVS) and plot the GO Enrichment using Cytoscape 3.7 and the ClueGo app.
5. Conclusions
In conclusion, in this study, we isolated exosomes from RB primary tumor and vitreous seeding cell lines and characterized their content with a proteomic approach. To the best of our knowledge, this is the first evidence describing a proteomic exosome signature specifically associated with vitreous seeding in RB. This characterization may represent a starting point for future analyses that allow defining exosomal markers as promising diagnostic and potential prognostic markers in RB, as well as therapeutic targets.
Supplementary Materials
The following are available online at https://www.mdpi.com/2072-6694/12/6/1555/s1, Figure S1: Detailed information about western blot in Figure 1D.
Author Contributions
Methodology, A.G., P.M., V.D.P., C.L., L.P., H.P.; Investigation, A.G., P.M., V.D.P., C.L., L.P., H.P.; Validation, A.G., C.L.; Data Curation, A.G., M.C., A.D.G., A.P.; Formal Analysis, C.L., A.P., M.C.; Resources, R.C., A.R., P.V., I.R., R.D.V., A.M.C., F.L., A.D.G.; Writing—original draft, A.G., V.D.P., M.C., A.D.G.; Writing—review and editing, R.C., A.R., P.V., I.R., R.D.V., A.M.C., A.P., F.L., A.D.G.; Project administration, M.C., A.D.G; Supervision A.D.G. All authors have read and agreed to the published version of the manuscript.
Funding
This research received no external funding.
Acknowledgments
M.C. and V.D.P. are recipients of Fondazione Umberto Veronesi (FUV)-2020 post-doctoral fellowships. We thank Valentina Polcini for proofreading the manuscript.
Conflicts of Interest
The authors declare that they have no conflict of interest.
Abbreviations
| RB | Retinoblastoma |
| RBT | Retinoblastoma tumor |
| RBVS | Retinoblastoma vitreous seeding |
| ECM | Extracellular matrix |
| SEM | Scanning electron microscopy |
| WB | Western blot |
| TSG101 | Tumor susceptibility gene 101 |
| ABI2 | Abl Interactor 2 |
| GSTM | Glutathione s-transferase Mu |
| NCAM | Neurocan |
| ATP6V1C1 | V-type proton ATPase subunit C 1 |
| SNAP25 | Synaptosome associated protein 25 |
| PPP2R2A | Serine/threonine-protein phosphatase 2A |
| UBXN4 | UBX domain protein 4 |
| OGN | Osteoglycin |
| LDL | Low-density lipoprotein |
| LRP-1 | LDL receptor-related protein |
| V-ATPases | Vacuolar (H+)-ATPases |
| NSF | N-ethylmaleimide-sensitive factor |
| SLRP | Small leucine-rich proteoglycan |
| CDK2 | Cyclin-dependent kinase 2 |
| MAPK | Mitogen activated protein kinase |
| UNC5B | Uncoordinated-5 homolog |
| PCA | Principal component analysis |
| HeatMap | Unsupervised hierarchical clustered heatmap |
| ENO3 | Enolase 3 |
| GALK1 | Galactokinase-1 |
| SYTL2 | Synaptotagmin like 2 |
| CREBBP | CREB binding protein |
| PSMD | Proteasome 26S subunit, non-ATPase |
| EH | Eps15 homology |
| EHD | EH domain-containing protein 3 |
| FLNA | Filamin A |
| TLN1 | Talin 1 |
| ASNS | Asparagine synthetase |
| SCCPDH | Saccharopine dehydrogenase |
| TUBA4A | Tubulin alpha 4a |
| 2-PG | 2-phosphoglycerate |
| PEP | Phosphoenolpyruvate |
| AR | Androgen Receptor |
| RIAM | Rap1-GTP-interacting adaptor molecule |
| DLC1 | Rho GTPase-activating protein 7 |
| HSJD | Hospital sant Joan de Deu |
| PB | Phosphate buffer |
| FDR | False discovery rate |
| PSM | Peptide-spectrum match |
References
- Rao, R.; Honavar, S.G. Retinoblastoma. Indian J. Pediatr. 2017, 84, 937–944. [Google Scholar] [CrossRef] [PubMed]
- Knudson, A.G., Jr. Mutation and cancer: Statistical study of retinoblastoma. Proc. Natl. Acad. Sci. USA 1971, 68, 820–823. [Google Scholar] [CrossRef]
- Lohmann, D.R.; Gallie, B.L. Retinoblastoma: Revisiting the model prototype of inherited cancer. Am. J. Med. Genet. C. Semin. Med. Genet. 2004, 129C, 23–28. [Google Scholar] [CrossRef]
- Zhang, J.; Gray, J.; Wu, L.; Leone, G.; Rowan, S.; Cepko, C.L.; Zhu, X.; Craft, C.M.; Dyer, M.A. Rb regulates proliferation and rod photoreceptor development in the mouse retina. Nat. Genet. 2004, 36, 351–360. [Google Scholar] [CrossRef] [PubMed]
- Xu, X.L.; Singh, H.P.; Wang, L.; Qi, D.L.; Poulos, B.K.; Abramson, D.H.; Jhanwar, S.C.; Cobrinik, D. Rb suppresses human cone-precursor-derived retinoblastoma tumours. Nature 2014, 514, 385–388. [Google Scholar] [CrossRef] [PubMed]
- Munier, F.L. Classification and management of seeds in retinoblastoma. Ellsworth Lecture Ghent August 24th 2013. Ophthalmic. Genet. 2014, 35, 193–207. [Google Scholar] [CrossRef]
- Munier, F.L.; Gaillard, M.C.; Balmer, A.; Soliman, S.; Podilsky, G.; Moulin, A.P.; Beck-Popovic, M. Intravitreal chemotherapy for vitreous disease in retinoblastoma revisited: From prohibition to conditional indications. Br. J. Ophthalmol. 2012, 96, 1078–1083. [Google Scholar] [CrossRef] [PubMed]
- Mathivanan, S.; Ji, H.; Simpson, R.J. Exosomes: Extracellular organelles important in intercellular communication. J. Proteom. 2010, 73, 1907–1920. [Google Scholar] [CrossRef]
- Colletti, M.; Petretto, A.; Galardi, A.; Di Paolo, V.; Tomao, L.; Lavarello, C.; Inglese, E.; Bruschi, M.; Lopez, A.A.; Pascucci, L.; et al. Proteomic analysis of neuroblastoma-derived exosomes: New insights into a metastatic signature. Proteomics 2017, 17, 23–24. [Google Scholar] [CrossRef]
- Colletti, M.; Paolini, A.; Galardi, A.; Di Paolo, V.; Pascucci, L.; Russo, I.; De Angelis, B.; Peinado, H.; De Vito, R.; Milano, G.M.; et al. Expression profiles of exosomal miRNAs isolated from plasma of patients with desmoplastic small round cell tumor. Epigenomics 2019, 11, 489–500. [Google Scholar] [CrossRef]
- Ispas, C.R.; Crivat, G.; Andreescu, S. Recent developments in enzyme-based biosensors for biomedical analysis. Anal. Letts. 2012, 45, 186. [Google Scholar] [CrossRef]
- Geyer, P.E.; Voytik, E.; Treit, P.V.; Doll, S.; Kleinhempel, A.; Niu, L.; Müller, J.B.; Buchholtz, M.L.; Bader, J.M.; Teupser, D.; et al. Plasma proteome profiling to detect and avoid sample-related biases in biomarker studies. EMBO Mol. Med. 2019, 11, e10427. [Google Scholar] [CrossRef] [PubMed]
- Iglesias-Gato, D.; Thysell, E.; Tyanova, S.; Crnalic, S.; Santos, A.; Lima, T.S.; Geiger, T.; Cox, J.; Widmark, A.; Bergh, A.; et al. The proteome of prostate cancer bone metastasis reveals heterogeneity with prognostic implications. Clin. Cancer Res. 2018, 24, 5433–5444. [Google Scholar] [CrossRef] [PubMed]
- Pathan, M.; Keerthikumar, S.; Ang, C.S.; Gangoda, L.; Quek, C.Y.; Williamson, N.A.; Mouradov, D.; Sieber, O.M.; Simpson, R.J.; Salim, A.; et al. FunRich: An open access standalone functional enrichment and interaction network analysis tool. Proteomics 2015, 15, 2597–2601. [Google Scholar] [CrossRef] [PubMed]
- Grove, M.; Demyanenko, G.; Echarri, A.; Zipfel, P.A.; Quiroz, M.E.; Rodriguiz, R.M.; Playford, M.; Martensen, S.A.; Robinson, M.R.; Wetsel, W.C.; et al. ABI2-deficient mice exhibit defective cell migration, aberrant dendritic spine morphogenesis, and deficits in learning and memory. Mol. Cell Biol. 2004, 24, 10905–10922. [Google Scholar] [CrossRef] [PubMed]
- Lin, T.Y.; Huang, C.H.; Chou, W.G.; Juang, J.L. Abi enhances Abl-mediated CDC2 phosphorylation and inactivation. J. Biomed. Sci. 2004, 11, 902–910. [Google Scholar] [CrossRef]
- Dai, Z.; Pendergast, A.M. Abi-2, a novel SH3-containing protein interacts with the c-Abl tyrosine kinase and modulates c-Abl transforming activity. Genes. Dev. 1995, 9, 2569–2582. [Google Scholar] [CrossRef]
- Simic, T.; Savic-Radojevic, A.; Pljesa-Ercegovac, M.; Matic, M.; Mimic-Oka, J. Glutathione S-transferases in kidney and urinary bladder tumors. Nat. Rev. Urol 2009, 6, 281–289. [Google Scholar] [CrossRef]
- Tang, J.; Zhou, Q.; Zhao, F.; Wei, F.; Bai, J.; Xie, Y.; Huang, Y. Association of glutathione S-transferase T1, M1 and P1 polymorphisms in the breast cancer risk: A meta-analysis in Asian population. Int. J. Clin. Exp. Med. 2015, 8, 12430–12447. [Google Scholar]
- Cai, Q.; Wang, Z.; Zhang, W.; Guo, X.; Shang, Z.; Jiang, N.; Tian, J.; Niu, Y. Association between glutathione S-transferases M1 and T1 gene polymorphisms and prostate cancer risk: A systematic review and meta-analysis. Tumour. Biol. 2014, 35, 247–256. [Google Scholar] [CrossRef]
- Zou, M.; Hu, X.; Xu, B.; Tong, T.; Jing, Y.; Xi, L.; Zhou, W.; Lu, J.; Wang, X.; Yang, X.; et al. Glutathione S-transferase isozyme alpha 1 is predominantly involved in the cisplatin resistance of common types of solid cancer. Oncol. Rep. 2019, 41, 989–998. [Google Scholar] [CrossRef] [PubMed]
- Inatani, M.; Honjo, M.; Otori, Y.; Oohira, A.; Kido, N.; Tano, Y.; Honda, Y.; Tanihara, H. Inhibitory effects of neurocan and phosphacan on neurite outgrowth from retinal ganglion cells in culture. Invest. Ophthalmol. Vis. Sci. 2001, 42, 1930–1938. [Google Scholar]
- Varga, I.; Hutóczki, G.; Szemcsák, C.D.; Zahuczky, G.; Tóth, J.; Adamecz, Z.; Kenyeres, A.; Bognár, L.; Hanzély, Z.; Klekner, A. Brevican, neurocan, tenascin-C and versican are mainly responsible for the invasiveness of low-grade astrocytoma. Pathol. Oncol. Res. 2012, 18, 413–420. [Google Scholar] [CrossRef] [PubMed]
- Fisher, S.K.; Lewis, G.P. Müller cell and neuronal remodeling in retinal detachment and reattachment and their potential consequences for visual recovery: A review and reconsideration of recent data. Vision Res. 2003, 43, 887–897. [Google Scholar] [CrossRef]
- Su, Z.; Kishida, S.; Tsubota, S.; Sakamoto, K.; Cao, D.; Kiyonari, S.; Ohira, M.; Kamijo, T.; Narita, A.; Xu, Y.; et al. Neurocan, an extracellular chondroitin sulfate proteoglycan, stimulates neuroblastoma cells to promote malignant phenotypes. Oncotarget 2017, 8, 106296–106310. [Google Scholar] [CrossRef] [PubMed]
- Forgac, M. Structure and properties of the vacuolar (H+)-ATPases. J. Biol. Chem. 1999, 274, 12951–12954. [Google Scholar] [CrossRef]
- Mart’ınez-Zaguila’n, R.; Raghunand, N.; Lynch, R.M.; Bellamy, W.; Mart’ınez, G.M.; Rojas, B.; Smith, D.; Dalton, W.S.; Gillies, R.J. pH and drug resistance. I. Functional expression of plasmalemmal V-type H-ATPase in drug-resistant human breast carcinoma cell lines. Biochem. Pharmacol. 1999, 57, 1037–1046. [Google Scholar] [CrossRef]
- Mart’ınez-Zaguila’n, R.; Seftor, E.A.; Seftor, R.E.; Chu, Y.W.; Gillies, R.J.; Hendrix, M.J. Acidic pH enhances the invasive behavior of human melanoma cells. Clin. Exp. Metastasis. 1996, 14, 176–186. [Google Scholar] [CrossRef]
- McConnell, M.; Feng, S.; Chen, W.; Zhu, G.; Shen, D.; Ponnazhagan, S.; Deng, L.; Li, Y.P. Osteoclast proton pump regulator Atp6v1c1 enhances breast cancer growth by activating the mTORC1 pathway and bone metastasis by increasing V-ATPase activity. Oncotarget 2017, 8, 47675–47690. [Google Scholar] [CrossRef]
- Cai, M.; Liu, P.; Wei, L.; Wang, J.; Qi, J.; Feng, S.; Deng, L. Atp6v1c1 may regulate filament actin arrangement in breast cancer cells. PLoS ONE 2014, 9, e84833. [Google Scholar] [CrossRef]
- Feng, S.; Zhu, G.; McConnell, M.; Deng, L.; Zhao, Q.; Wu, M.; Zhou, Q.; Wang, J.; Qi, J.; Li, Y.P.; et al. Silencing of atp6v1c1 prevents breast cancer growth and bone metastasis. Int. J. Biol. Sci. 2013, 9, 853–862. [Google Scholar] [CrossRef]
- Rizo, J.; Südhof, T.C. Snares and Munc18 in synaptic vesicle fusion. Nat. Rev. Neurosci. 2002, 3, 641–653. [Google Scholar] [CrossRef]
- Héraud, C.; Chevrier, L.; Meunier, A.C.; Muller, J.M.; Chadéneau, C. Vasoactive intestinal peptide-induced neuritogenesis in neuroblastoma SH-SY5Y cells involves SNAP-25. Neuropeptides 2008, 42, 611–621. [Google Scholar] [CrossRef] [PubMed]
- Majó, G.; Ferrer, I.; Marsal, J.; Blasi, J.; Aguado, F. Immunocytochemical analysis of the synaptic proteins SNAP-25 and Rab3A in human pituitary adenomas. Overexpression of SNAP-25 in the mammmosomatotroph lineages. J. Pathol. 1997, 183, 440–446. [Google Scholar] [CrossRef]
- Huang, C.J.; Lee, C.L.; Liu, C.Y.; Huang, S.H.; Hou, J.W.; Chen, Y.H.; Chien, C.C.; Ho, C.M.; Lo, W.C.; Hung, K.L. Detection of lower levels of SNAP25 using multiple microarray systems and its functional significance in medulloblastoma. Int. J. Mol. Med. 2017, 39, 1195–1205. [Google Scholar] [CrossRef] [PubMed][Green Version]
- Beca, F.; Pereira, M.; Cameselle-Teijeiro, J.F.; Martins, D.; Schmitt, F. Altered PPP2R2A and Cyclin D1 expression defines a subgroup of aggressive luminal-like breast cancer. BMC Cancer 2015, 15, 285. [Google Scholar] [CrossRef] [PubMed]
- Sane, S.; Abdullah, A.; Boudreau, D.A.; Autenried, R.K.; Gupta, B.K.; Wang, X.; Wang, H.; Schlenker, E.H.; Zhang, D.; Telleria, C.; et al. Ubiquitin-like (UBX)-domain-containing protein, UBXN2A, promotes cell death by interfering with the p53-Mortalin interactions in colon cancer cells. Cell Death Dis. 2014, 5, e1118. [Google Scholar] [CrossRef]
- Kresse, H.; Schönherr, E. Proteoglycans of the extracellular matrix and growth control. J. Cell Physiol. 2001, 189, 266–274. [Google Scholar] [CrossRef]
- Lee, J.Y.; Eom, E.M.; Kim, D.S.; Ha-Lee, Y.M.; Lee, D.H. Analysis of gene expression profiles of gastric normal and cancer tissues by SAGE. Genomics 2003, 82, 78–85. [Google Scholar] [CrossRef]
- Wang, Y.; Ma, Y.; Lu, B.; Xu, E.; Huang, Q.; Lai, M. Differential expression of mimecan and thioredoxin domain-containing protein 5 in colorectal adenoma and cancer: A proteomic study. Exp. Biol. Med. 2007, 232, 1152–1159. [Google Scholar] [CrossRef]
- Lomnytska, M.I.; Becker, S.; Hellman, K.; Hellstrom, A.C.; Souchelnytskyi, S.; Mints, M. Diagnostic protein marker patterns in squamous cervical cancer. Proteom. Clin. Appl. 2010, 4, 17–31. [Google Scholar] [CrossRef] [PubMed]
- Rower, C.; Ziems, B.; Radtke, A.; Schmitt, O.; Reimer, T.; Koy, C. Toponostics of invasive ductal breast carcinoma: Combination of spatial protein expression imaging and quantitative proteome signature analysis. Int. J. Clin. Exp. Pathol. 2011, 4, 454–467. [Google Scholar] [PubMed]
- Li, L.; Zhang, Z.; Wang, C.; Miao, L.; Zhang, J.; Wang, J. Quantitative proteomics approach to screening of potential diagnostic and therapeutic targets for laryngeal carcinoma. PLoS ONE 2014, 9, e90181. [Google Scholar] [CrossRef] [PubMed]
- Hu, X.; Li, Y.Q.; Li, Q.G.; Ma, Y.L.; Peng, J.J.; Cai, S.J. Osteoglycin (OGN) reverses epithelial to mesenchymal transition and invasiveness in colorectal cancer via EGFR/Akt pathway. J. Exp. Clin. Cancer Res. 2018, 37, 41. [Google Scholar] [CrossRef]
- Sánchez, M.C.; Barcelona, P.F.; Luna, J.D.; Ortiz, S.G.; Juarez, P.C.; Riera, C.M.; Chiabrando, G.A. Low-density lipoprotein receptor-related protein-1 (LRP-1) expression in a rat model of oxygen-induced retinal neovascularization. Exp. Eye Res. 2006, 83, 1378–1385. [Google Scholar] [CrossRef]
- Mao, H.; Lockyer, P.; Townley-Tilson, W.H.; Xie, L.; Pi, X. LRP1 Regulates Retinal Angiogenesis by Inhibiting PARP-1 Activity and Endothelial Cell Proliferation. Arter. Thromb. Vasc. Biol. 2016, 36, 350–360. [Google Scholar] [CrossRef]
- Li, Y.; Reynolds, R.C. LRP1: A tumor and metastasis promoter or suppressor? Biochem. Pharmacol. 2012, 1, e121. [Google Scholar] [CrossRef]
- Huang, X.Y.; Shi, G.M.; Devbhandari, R.P.; Ke, A.W.; Wang, Y.; Wang, X.Y.; Wang, Z.; Shi, Y.H.; Xiao, Y.S.; Ding, Z.B.; et al. Low level of low-density lipoprotein receptor-related protein 1 predicts an unfavorable prognosis of hepatocellular carcinoma after curative resection. PLoS ONE 2012, 7, e32775. [Google Scholar] [CrossRef]
- Meng, H.; Chen, G.; Zhang, X.; Wang, Z.; Thomas, D.G.; Giordano, T.J.; Beer, D.G.; Wang, M.M. Stromal LRP1 in lung adenocarcinoma predicts clinical outcome. Clin. Cancer Res. 2011, 17, 2426–2433. [Google Scholar] [CrossRef] [PubMed]
- De Vries, T.J.; Verheijen, J.H.; De Bart, A.C.; Weidle, U.H.; Ruiter, D.J.; Van Muijen, G.N. Decreased expression of both the low-density lipoprotein receptor-related protein/alpha(2)-macroglobulin receptor and its receptor-associated protein in late stages of cutaneous melanocytic tumor progression. Cancer Res. 1996, 56, 1432–1439. [Google Scholar]
- Desrosiers, R.R.; Rivard, M.E.; Grundy, P.E.; Annabi, B. Decrease in LDL receptor-related protein expression and function correlates with advanced stages of Wilms tumors. Pediatr. Blood Cancer 2006, 46, 40–49. [Google Scholar] [CrossRef] [PubMed]
- Catasús, L.; Llorente-Cortés, V.; Cuatrecasas, M.; Pons, C.; Espinosa, I.; Prat, J. Low-density lipoprotein receptor-related protein 1 (LRP-1) is associated with highgrade, advanced stage and p53 and p16 alterations in endometrial carcinomas. Histopathology 2011, 59, 567–571. [Google Scholar] [CrossRef] [PubMed]
- Catasús, L.; Gallardo, A.; Llorente-Cortés, V.; Escuin, D.; Muñoz, J.; Tibau, A.; Peiro, G.; Barnadas, A.; Lerma, E. Low-density lipoprotein receptor-related protein 1 is associated with proliferation and invasiveness in Her-2/neu and triple-negative breast carcinomas. Hum. Pathol. 2011, 42, 1581–1588. [Google Scholar] [CrossRef] [PubMed]
- McGarvey, T.; Hussain, M.M.; Stearns, M.E. In situ hybridization studies of alpha 2-macroglobulin receptor and receptor-associated protein in human prostate carcinoma. Prostate 1996, 28, 311–317. [Google Scholar] [CrossRef]
- Boulagnon-Rombi, C.; Schneider, C.; Leandri, C.; Jeanne, A.; Grybek, V.; Bressenot, A.M.; Barbe, C.; Marquet, B.; Nasri, S.; Coquelet, C.; et al. LRP1 expression in colon cancer predicts clinical outcome. Oncotarget 2018, 9, 8849–8869. [Google Scholar] [CrossRef] [PubMed]
- Hamidi, H.; Ivaska, J. Every step of the way: Integrins in cancer progression and metastasis. Nat. Rev. Cancer 2018, 18, 533–548. [Google Scholar] [CrossRef] [PubMed]
- Seguin, L.; Desgrosellier, J.S.; Weis, S.M.; Cheresh, D.A. Integrins and cancer: Regulators of cancer stemness, metastasis, and drug resistance. Trends Cell Biol. 2015, 25, 234–240. [Google Scholar] [CrossRef]
- Hoshino, A.; Costa-Silva, B.; Shen, T.L.; Rodrigues, G.; Hashimoto, A.; Tesic Mark, M.; Molina, H.; Kohsaka, S.; Di Giannatale, A.; Ceder, S.; et al. Tumour exosome integrins determine organotropic metastasis. Nature 2015, 527, 329–335. [Google Scholar] [CrossRef]
- Tang, D.G.; Honn, K.V. Adhesion molecules and tumor metastasis: An update. Invasion Metastasis 1994, 14, 109–122. [Google Scholar]
- Trikha, M.; Timar, J.; Lundy, S.K.; Szekeres, K.; Tang, K.; Grignon, D.; Porter, A.T.; Honn, K.V. Human prostate carcinoma cells express functional alphaIIb(beta)3 integrin. Cancer Res. 1996, 56, 5071–5078. [Google Scholar]
- Chen, Y.Q.; Trikha, M.; Gao, X.; Bazaz, R.; Porter, A.T.; Timar, J.; Honn, K.V. Ectopic expression of platelet integrin alphaIIb beta3 in tumor cells from various species and histological origin. Int. J. Cancer 1997, 72, 642–648. [Google Scholar] [CrossRef]
- Huveneers, S.; Danen, E.H. The interaction of SRC kinase with beta3 integrin tails: A potential therapeutic target in thrombosis and cancer. Sci. World J. 2010, 10, 1100–1105. [Google Scholar] [CrossRef]
- Felding-Habermann, B.; Habermann, R.; Saldívar, E.; Ruggeri, Z.M. Role of beta3 integrins in melanoma cell adhesion to activated platelets under flow. J. Biol. Chem. 1996, 271, 5892–5900. [Google Scholar] [CrossRef]
- Wei, L.; Yang, Y.; Zhang, X.; Yu, Q. Cleavage of p130Cas in anoikis. J. Cell Biochem. 2004, 91, 325–335. [Google Scholar] [CrossRef] [PubMed]
- Delloye-Bourgeois, C.; Goldschneider, D.; Paradisi, A.; Therizols, G.; Belin, S.; Hacot, S.; Rosa-Calatrava, M.; Scoazec, J.Y.; Diaz, J.J.; Bernet, A.; et al. Nucleolar localization of a netrin-1 isoform enhances tumor cell proliferation. Sci. Signal. 2012, 5, ra57. [Google Scholar] [CrossRef] [PubMed]
- Arakawa, H. Netrin-1 and its receptors in tumorigenesis. Nat. Rev. Cancer 2004, 4, 978–987. [Google Scholar] [CrossRef] [PubMed]
- Tanikawa, C.; Matsuda, K.; Fukuda, S.; Nakamura, Y.; Arakawa, H. p53RDL1 regulates p53-dependent apoptosis. Nat. Cell Biol. 2003, 5, 216–223. [Google Scholar] [CrossRef]
- Lomelino, C.L.; Andring, J.T.; McKenna, R.; Kilberg, M.S. Asparagine synthetase: Function, structure, and role in disease. J. Biol. Chem. 2017, 292, 19952–19958. [Google Scholar] [CrossRef]
- Vashishtha, A.K.; West, A.H.; Cook, P.F. Chemical mechanism of saccharopine reductase from Saccharomyces cerevisiae. Biochemistry 2009, 48, 5899–5907. [Google Scholar] [CrossRef]
- Shao, Q.Q.; Zhang, T.P.; Zhao, W.J.; Liu, Z.W.; You, L.; Zhou, L.; Guo, J.C.; Zhao, Y.P. Filamin A: Insights into its Exact Role in Cancers. Pathol. Oncol. Res. 2016, 22, 245–252. [Google Scholar] [CrossRef]
- Bedolla, R.G.; Wang, Y.; Asuncion, A.; Chamie, K.; Siddiqui, S.; Mudryj, M.M.; Prihoda, T.J.; Siddiqui, J.; Chinnaiyan, A.M.; Mehra, R.; et al. Nuclear versus cytoplasmic localization of filamin A in prostate cancer: Immunohistochemical correlation with metastases. Clin. Cancer Res. 2009, 15, 788–796. [Google Scholar] [CrossRef] [PubMed]
- Alper, O.; Stetler-Stevenson, W.G.; Harris, L.N.; Leitner, W.W.; Ozdemirli, M.; Hartmann, D.; Raffeld, M.; Abu-Asab, M.; Byers, S.; Zhuang, Z.; et al. Novel anti-filamin-A antibody detects a secreted variant of filamin-A in plasma from patients with breast carcinoma and high-grade astrocytoma. Cancer Sci. 2009, 100, 1748–1756. [Google Scholar] [CrossRef] [PubMed]
- Tian, H.M.; Liu, X.H.; Han, W.; Zhao, L.L.; Yuan, B.; Yuan, C.J. Differential expression of filamin A and its clinical significance in breast cancer. Oncol. Lett. 2013, 6, 681–686. [Google Scholar] [CrossRef] [PubMed]
- Uramoto, H.; Akyürek, L.M.; Hanagiri, T. A positive relationship between filamin and VEGF in patients with lung cancer. Anticancer. Res. 2010, 30, 3939–3944. [Google Scholar]
- Porter, R.M.; Holme, T.C.; Newman, E.L.; Hopwood, D.; Wilkinson, J.M.; Cuschieri, A. Monoclonal antibodies to cytoskeletal proteins: An immunohistochemical investigation of human colon cancer. J. Pathol. 1993, 170, 435–440. [Google Scholar] [CrossRef]
- Larriba, M.J.; Martin-Villar, E.; Garcia, J.M.; Pereira, F.; Pena, C.; De Herreros, A.G.; Bonilla, F.; Munoz, A. Snail2 cooperates with Snail1 in the repression of vitamin D receptor in colon cancer. Carcinogenesis 2009, 30, 1459–1468. [Google Scholar] [CrossRef]
- Flanagan, L.A.; Chou, J.; Falet, H.; Neujahr, R.; Hartwig, J.H.; Stossel, T.P. Filamin A, the Arp2/3 complex, and the morphology and function of cortical actin filaments in human melanoma cells. J. Cell Biol. 2001, 155, 511–517. [Google Scholar] [CrossRef]
- Bachmann, A.S.; Howard, J.P.; Vogel, C.W. Actin-binding protein filamin A is displayed on the surface of human neuroblastoma cells. Cancer Sci. 2006, 97, 1359–1365. [Google Scholar] [CrossRef]
- Kamochi, N.; Nakashima, M.; Aoki, S.; Uchihashi, K.; Sugihara, H.; Toda, S.; Kudo, S. Irradiated fibroblast-induced bystander effects on invasive growth of squamous cell carcinoma under cancer–stromal cell interaction. Cancer Sci. 2008, 99, 2417–2427. [Google Scholar] [CrossRef]
- Guedj, N.; Zhan, Q.; Perigny, M.; Rautou, P.E.; Degos, F.; Belghiti, J.; Farges, O.; Bedossa, P.; Paradis, V. Comparative protein expression profiles of hilar and peripheral hepatic cholangiocarcinomas. J. Hepatol. 2009, 51, 93–101. [Google Scholar] [CrossRef]
- Zhong, Z.; Yeow, W.S.; Zou, C.; Wassell, R.; Wang, C.; Pestell, R.G.; Quong, J.N.; Quong, A.A. Cyclin D1/cyclin-dependent kinase 4 interacts with filamin A and affects the migration and invasion potential of breast cancer cells. Cancer Res. 2010, 70, 2105–2114. [Google Scholar] [CrossRef] [PubMed]
- Xu, Y.; Bismar, T.A.; Su, J.; Xu, B.; Kristiansen, G.; Varga, Z.; Teng, L.; Ingber, D.E.; Mammoto, A.; Kumar, R.; et al. Filamin A regulates focal adhesion disassembly and suppresses breast cancer cell migration and invasion. J. Exp. Med. 2010, 207, 2421–2437. [Google Scholar] [CrossRef] [PubMed]
- Ozanne, D.M.; Brady, M.E.; Cook, S.; Gaughan, L.; Neal, D.E.; Robson, C.N. Androgen receptor nuclear translocation is facilitated by the f-actin cross-linking protein filamin. Mol. Endocrinol. 2000, 14, 1618–1626. [Google Scholar] [CrossRef] [PubMed]
- Loy, C.J.; Sim, K.S.; Yong, E.L. Filamin-A fragment localizes to the nucleus to regulate androgen receptor and coactivator functions. PNAS 2003, 100, 4562–4567. [Google Scholar] [CrossRef] [PubMed]
- Haining, A.W.; Lieberthal, T.J.; Del Río Hernández, A. Talin: A mechanosensitive molecule in health and disease. FASEB J. 2016, 30, 2073–2085. [Google Scholar] [CrossRef] [PubMed]
- Wyse, E.; Handa, J.T.; Friedman, A.D.; Pearl, M.S. A review of the literature for intra-arterial chemotherapy used to treat retinoblastoma. Pediatr. Radiol. 2016, 46, 1223–1233. [Google Scholar] [CrossRef]
- Galardi, A.; Colletti, M.; Di Paolo, V.; Vitullo, P.; Antonetti, L.; Russo, I.; Di Giannatale, A. Exosomal MiRNAs in Pediatric Cancers. Int. J. Mol. Sci. 2019, 20, 4600. [Google Scholar] [CrossRef]
- Huang, T.; Deng, C.X. Current progresses of exosomes as cancer diagnostic and prognostic biomarkers. Int. J. Biol. Sci. 2019, 15, 1–11. [Google Scholar] [CrossRef]
- Munier, F.L.; Gaillard, M.C.; Balmer, A.; Beck-Popovic, M. Intravitreal chemotherapy for vitreous seeding in retinoblastoma: Recent advances and perspectives. Saudi J. Ophthalmol. 2013, 27, 147–150. [Google Scholar] [CrossRef]
- Engel, B.E.; Cress, W.D.; Santiago-Cardona, P.G. The retinoblastoma protein: A master tumor suppressor acts as a link between cell cycle and cell adhesion. Cell Health Cytoskelet. 2015, 7, 1–10. [Google Scholar]
- Fedele, C.; Singh, A.; Zerlanko, B.J.; Iozzo, R.V.; Languino, L.R. The αvβ6 integrin is transferred intercellularly via exosomes. J. Biol. Chem. 2015, 290, 4545–4551. [Google Scholar] [CrossRef] [PubMed]
- Hausman, R.E. Ocular extracellular matrices in development. Prog. Retin. Eye Res. 2007, 26, 162–188. [Google Scholar] [CrossRef] [PubMed]
- Libby, R.T.; Brunken, W.J.; Hunter, D.D. Roles of the extracellular matrix in retinal development and maintenance. Results Probl. Cell Differ. 2000, 31, 115–140. [Google Scholar] [PubMed]
- Oster, S.F.; Sretavan, D.W. Connecting the eye to the brain: The molecular basis of ganglion cell axon guidance. Br. J. Ophthalmol. 2003, 87, 639–645. [Google Scholar] [CrossRef] [PubMed]
- Pires Neto, M.A.; Braga-de-Souza, S.; Lent, R. Extracellular matrix molecules play diverse roles in the growth and guidance of central nervous system axons. Braz J. Med. Biol. Res. 1999, 32, 633–638. [Google Scholar] [CrossRef]
- Iozzo, R.V.; Schaefer, L. Proteoglycans in health and disease: Novel regulatory signaling mechanisms evoked by the small leucine-rich proteoglycans. FEBS J. 2010, 277, 3864–3875. [Google Scholar] [CrossRef]
- Isenmann, S.; Kretz, A.; Cellerino, A. Molecular determinants of retinal ganglion cell development, survival, and regeneration. Prog. Retin. Eye Res. 2003, 22, 483–543. [Google Scholar] [CrossRef]
- Sakamoto, S.; McCann, R.O.; Dhir, R.; Kyprianou, N. Talin1 promotes tumor invasion and metastasis via focal adhesion signaling and anoikis resistance. Cancer Res. 2010, 70, 1885–1895. [Google Scholar] [CrossRef]
- Everley, P.A.; Krijgsveld, J.; Zetter, B.R.; Gygi, S.P. Quantitative cancer proteomics: Stable isotope labeling with amino acids in cell culture (SILAC) as a tool for prostate cancer research. Mol. Cell Proteom. 2004, 3, 729–735. [Google Scholar] [CrossRef]
- Soe, Z.Y.; Prajuabjinda, O.; Myint, P.K.; Gaowa, A.; Kawamoto, E.; Park, E.J.; Shimaoka, M. Talin-2 regulates integrin functions in exosomes. Biochem. Biophys. Res. Commun. 2019, 512, 429–434. [Google Scholar] [CrossRef]
- Linder, S.; Wiesner, C.; Himmel, M. Degrading devices: Invadosomes in proteolytic cell invasion. Annu. Rev. Cell Dev. Biol. 2011, 27, 185–211. [Google Scholar] [CrossRef] [PubMed]
- Artym, V.V.; Zhang, Y.; Seillier-Moiseiwitsch, F.; Yamada, K.M.; Mueller, S.C. Dynamic interactions of cortactin and membrane type 1 matrix metalloproteinase at invadopodia: Defining the stages of invadopodia formation and function. Cancer Res. 2006, 66, 3034–3043. [Google Scholar] [CrossRef] [PubMed]
- Guegan, F.; Tatin, F.; Leste-Lasserre, T.; Drutel, G.; Genot, E.; Moreau, V. p190B RhoGAP regulates endothelial-cell-associated proteolysis through MT1-MMP and MMP2. J. Cell Sci. 2008, 121, 2054–2061. [Google Scholar] [CrossRef] [PubMed]
- Zhu, C.; Kong, Z.; Wang, B.; Cheng, W.; Wu, A.; Meng, X. ITGB3/CD61: A hub modulator and target in the tumor microenvironment. Am. J. Transl. Res. 2019, 11, 7195–7208. [Google Scholar] [PubMed]
- Fu, X.T.; Song, K.; Zhou, J.; Shi, Y.H.; Liu, W.R.; Tian, M.X.; Jin, L.; Shi, G.M.; Gao, Q.; Ding, Z.B.; et al. Autophagy activation contributes to glutathione transferase Mu 1-mediated chemoresistance in hepatocellular carcinoma. Oncol. Lett. 2018, 16, 346–352. [Google Scholar] [CrossRef]
- Depeille, P.; Cuq, P.; Mary, S.; Passagne, I.; Evrard, A.; Cupissol, D.; Vian, L. Glutathione S-transferase M1 and multidrug resistance protein 1 act in synergy to protect melanoma cells from vincristine effects. Mol. Pharmacol. 2004, 65, 897–905. [Google Scholar] [CrossRef]
- Yue, J.; Huhn, S.; Shen, Z. Complex roles of filamin-A mediated cytoskeleton network in cancer progression. Cell Biosci. 2013, 3, 7. [Google Scholar] [CrossRef]
- Ohta, Y.; Hartwig, J.H.; Stossel, T.P. FilGAP, a Rho- and ROCK-regulated GAP for Rac binds filamin A to control actin remodelling. Nat. Cell Biol. 2006, 8, 803–814. [Google Scholar] [CrossRef]
- Ohta, Y.; Suzuki, N.; Nakamura, S.; Hartwig, J.H.; Stossel, T.P. The small GTPase RalA targets filamin to induce filopodia. Proc. Natl. Acad. Sci. USA 1999, 96, 2122–2128. [Google Scholar] [CrossRef]
- Kim, H.; Sengupta, A.; Glogauer, M.; McCulloch, C.A. Filamin A regulates cell spreading and survival via beta1 integrins. Exp. Cell Res. 2008, 314, 834–846. [Google Scholar] [CrossRef]
- Guiet, R.; Vérollet, C.; Lamsoul, I.; Cougoule, C.; Poincloux, R.; Labrousse, A.; Calderwood, D.A.; Glogauer, M.; Lutz, P.G.; Maridonneau-Parini, I. Macrophage mesenchymal migration requires podosome stabilization by filamin A. J. Biol. Chem. 2012, 287, 13051–13062. [Google Scholar] [CrossRef] [PubMed]
- Hoshino, D.; Kirkbride, K.C.; Costello, K.; Clark, E.S.; Sinha, S.; Grega-Larson, N.; Tyska, M.J.; Weaver, A.M. Exosome secretion is enhanced by invadopodia and drives invasive behavior. Cell Rep. 2013, 5, 1159–1168. [Google Scholar] [CrossRef] [PubMed]
- Frikeche, J.; Maiti, G.; Chakravarti, S. Small Leucine-rich repeat proteoglycans in corneal inflammation and wound healing. Exp. Eye Res. 2016, 151, 142–149. [Google Scholar] [CrossRef] [PubMed]
- Dominici, C.; Moreno-Bravo, J.A.; Puiggros, S.R.; Rappeneau, Q.; Rama, N.; Vieugue, P.; Bernet, A.; Mehlen, P.; Chédotal, A. Floor-plate-derived netrin-1 is dispensable for commissural axon guidance. Nature 2017, 545, 350–354. [Google Scholar] [CrossRef]
- Ylivinkka, I.; Keski-Oja, J.; Hyytiäinen, M. Netrin-1: A regulator of cancer cell motility? Eur. J. Cell Biol. 2016, 95, 513–520. [Google Scholar] [CrossRef]
- Delloye-Bourgeois, C.; Brambilla, E.; Coissieux, M.M.; Guenebeaud, C.; Pedeux, R.; Firlej, V.; Cabon, F.; Brambilla, C.; Mehlen, P.; Bernet, A. Interference with netrin-1 and tumor cell death in non-small cell lung cancer. J. Natl. Cancer Inst. 2009, 101, 237–247. [Google Scholar] [CrossRef] [PubMed]
- Delloye-Bourgeois, C.; Fitamant, J.; Paradisi, A.; Cappellen, D.; Douc-Rasy, S.; Raquin, M.A.; Stupack, D.; Nakagawara, A.; Rousseau, R.; Combaret, V.; et al. Netrin-1 acts as a survival factor for aggressive neuroblastoma. J. Exp. Med. 2009, 206, 833–847. [Google Scholar] [CrossRef]
- Fitamant, J.; Guenebeaud, C.; Coissieux, M.M.; Guix, C.; Treilleux, I.; Scoazec, J.Y.; Bachelot, T.; Bernet, A.; Mehlen, P. Netrin-1 expression confers a selective advantage for tumor cell survival in metastatic breast cancer. Proc. Natl. Acad. Sci. USA 2008, 105, 4850–4855. [Google Scholar] [CrossRef]
- Mazelin, L.; Bernet, A.; Bonod-Bidaud, C.; Pays, L.; Arnaud, S.; Gespach, C.; Bredesen, D.E.; Scoazec, J.Y.; Mehlen, P. Netrin-1 controls colorectal tumorigenesis by regulating apoptosis. Nature 2004, 431, 80–84. [Google Scholar] [CrossRef]
- Rodrigues, S.; De Wever, O.; Bruyneel, E.; Rooney, R.J.; Gespach, C. Opposing roles of netrin-1 and the dependence receptor DCC in cancer cell invasion, tumor growth and metastasis. Oncogene 2007, 26, 5615–5625. [Google Scholar] [CrossRef]
- Dumartin, L.; Quemener, C.; Laklai, H.; Herbert, J.; Bicknell, R.; Bousquet, C.; Pyronnet, S.; Castronovo, V.; Schilling, M.K.; Bikfalvi, A.; et al. Netrin-1 mediates early events in pancreatic adenocarcinoma progression, acting on tumor and endothelial cells. Gastroenterology 2010, 138, 1595–1606. [Google Scholar] [CrossRef] [PubMed]
- Paoli, P.; Giannoni, E.; Chiarugi, P. Anoikis molecular pathways and its role in cancer progression. Biochim. Biophys. Acta 2013, 1833, 3481–3498. [Google Scholar] [CrossRef] [PubMed]
- Vermeer, P.D. Exosomal induction of tumor innervation. Cancer Res. 2019, 79, 3529–3535. [Google Scholar] [CrossRef]
- Pascual-Pasto, G.; Olaciregui, N.G.; Vila-Ubach, M.; Paco, S.; Monterrubio, C.; Rodriguez, E.; Winter, U.; Batalla-Vilacis, M.; Catala, J.; Salvador, H.; et al. Preclinical platform of retinoblastoma xenografts recapitulating human disease and molecular markers of dissemination. Cancer Lett. 2016, 380, 10–19. [Google Scholar] [CrossRef]
- Monje, M.; Mitra, S.S.; Freret, M.E.; Raveh, T.B.; Kim, J.; Masek, M.; Attema, J.L.; Li, G.; Haddix, T.; Edwards, M.S.; et al. Hedgehog-responsive candidate cell of origin for diffuse intrinsic pontine glioma. Proc. Natl. Acad. Sci. USA 2011, 108, 4453–4458. [Google Scholar] [CrossRef] [PubMed]
- Kulak, N.A.; Pichler, G.; Paron, I.; Nagaraj, N.; Mann, M. Minimal, encapsulated proteomic-sample processing applied to copy-number estimation in eukaryotic cells. Nat. Methods 2014, 11, 319–324. [Google Scholar] [CrossRef]
- Davis, S.; Charles, P.D.; He, L.; Mowlds, P.; Kessler, B.M.; Fischer, R. Expanding Proteome Coverage with CHarge Ordered Parallel Ion aNalysis (CHOPIN) Combined with Broad Specificity Proteolysis. J. Proteome Res. 2017, 16, 1288–1299. [Google Scholar] [CrossRef]
- Perez-Riverol, Y.; Csordas, A.; Bai, J.; Bernal-Llinares, M.; Hewapathirana, S.; Kundu, D.J.; Inuganti, A.; Griss, J.; Mayer, G.; Eisenacher, M.; et al. The PRIDE database and related tools and resources in 2019: Improving support for quantification data. Nucleic. Acids Res. 2019, 47, D442–D450. [Google Scholar] [CrossRef]
- Cox, J.; Hein, M.Y.; Luber, C.A.; Paron, I.; Nagaraj, N.; Mann, M. Accurate proteome-wide label-free quantification by delayed normalization and maximal peptide ratio extraction, termed MaxLFQ. Mol. Cell Proteom. 2014, 13, 2513–2526. [Google Scholar] [CrossRef]
- Tyanova, S.; Temu, T.; Sinitcyn, P.; Carlson, A.; Hein, M.Y.; Geiger, T.; Mann, M.; Cox, J. The Perseus computational platform for comprehensive analysis of (prote)omics data. Nat. Methods 2016, 13, 731–740. [Google Scholar] [CrossRef]
- Bardou, P.; Mariette, J.; Escudié, F.; Djemiel, C.; Klopp, C. jvenn: An interactive Venn diagram viewer. BMC Bioinform. 2014, 15, 293. [Google Scholar] [CrossRef] [PubMed]
© 2020 by the authors. Licensee MDPI, Basel, Switzerland. This article is an open access article distributed under the terms and conditions of the Creative Commons Attribution (CC BY) license (http://creativecommons.org/licenses/by/4.0/).