MiR-181 Family Modulates Osteopontin in Glioblastoma Multiforme

Abstract
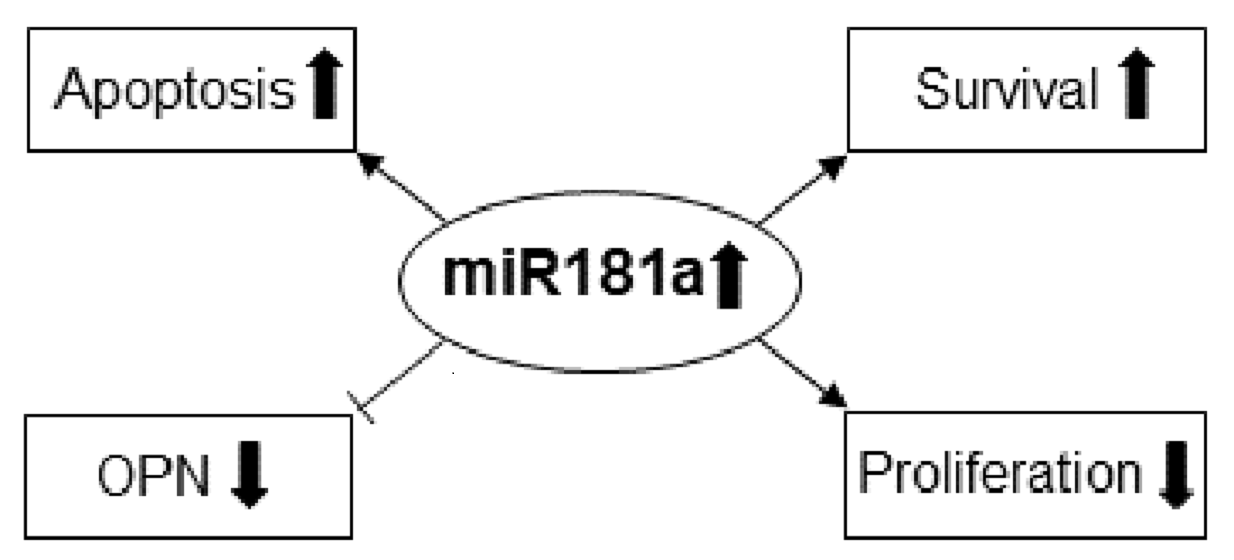
Simple Summary
Abstract

1. Introduction
2. Results
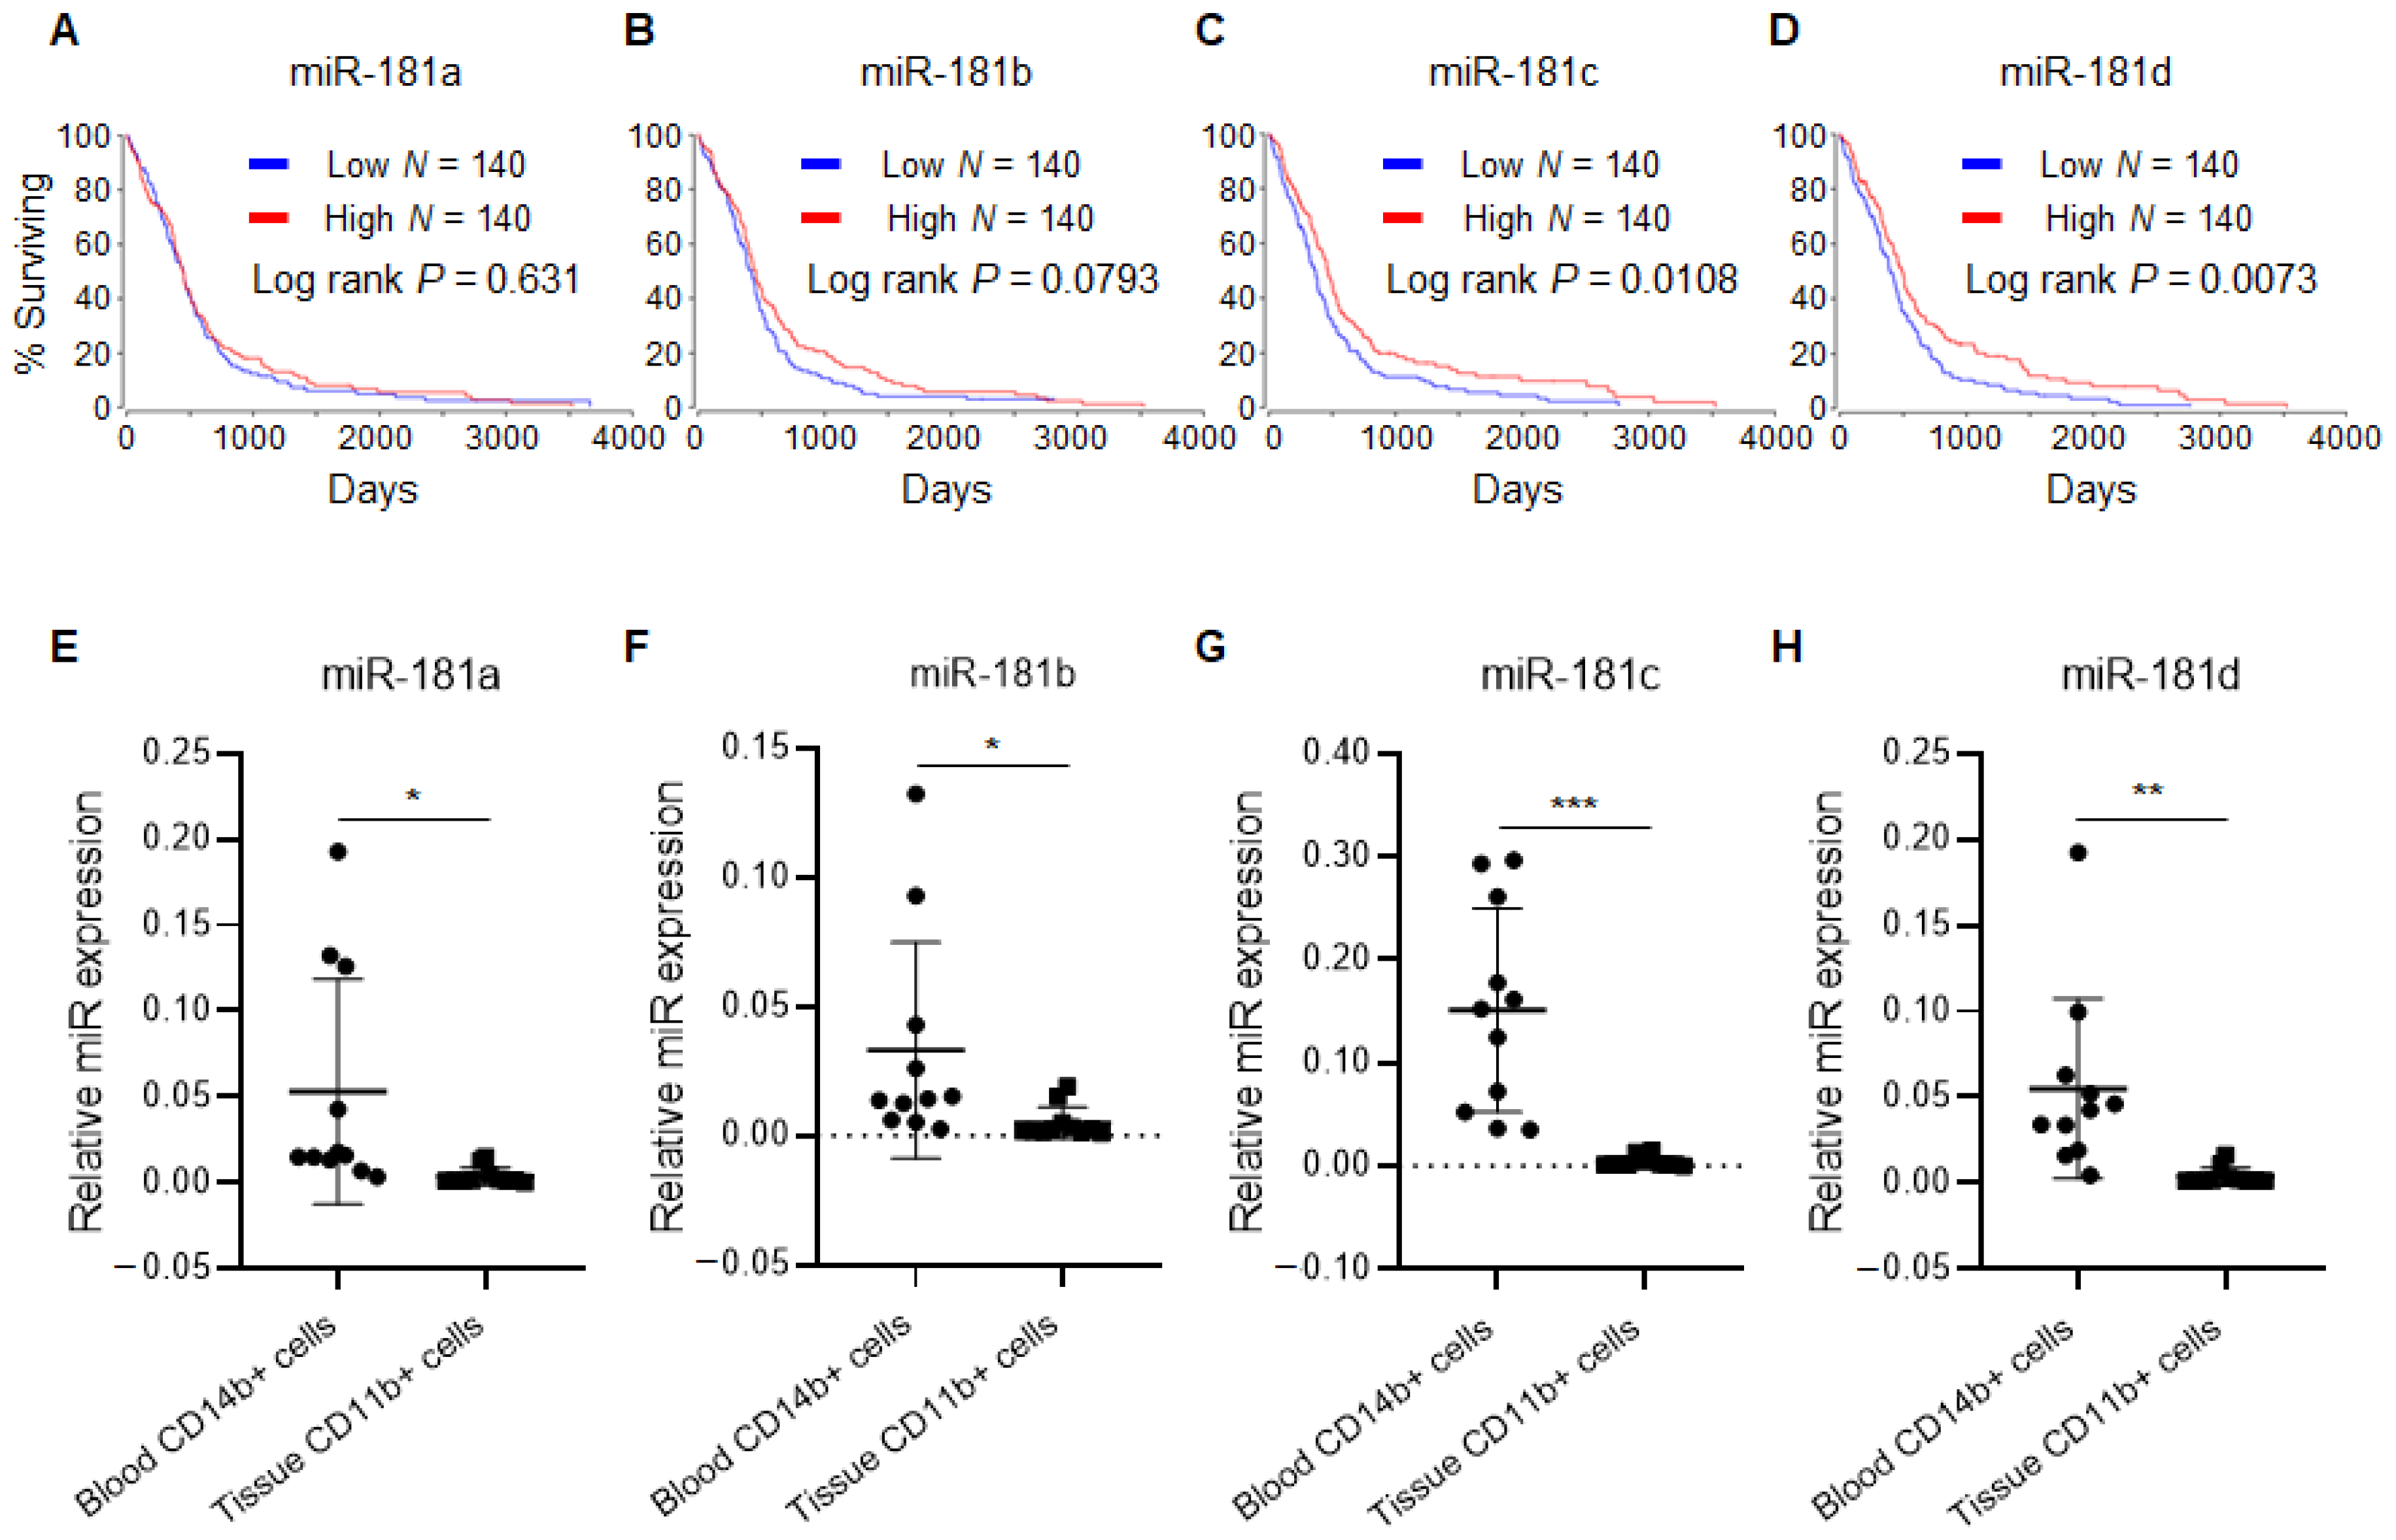
2.1. miR-181 Family Is Downregulated in CD11b+ Monocytes Extracted from Glioblastoma
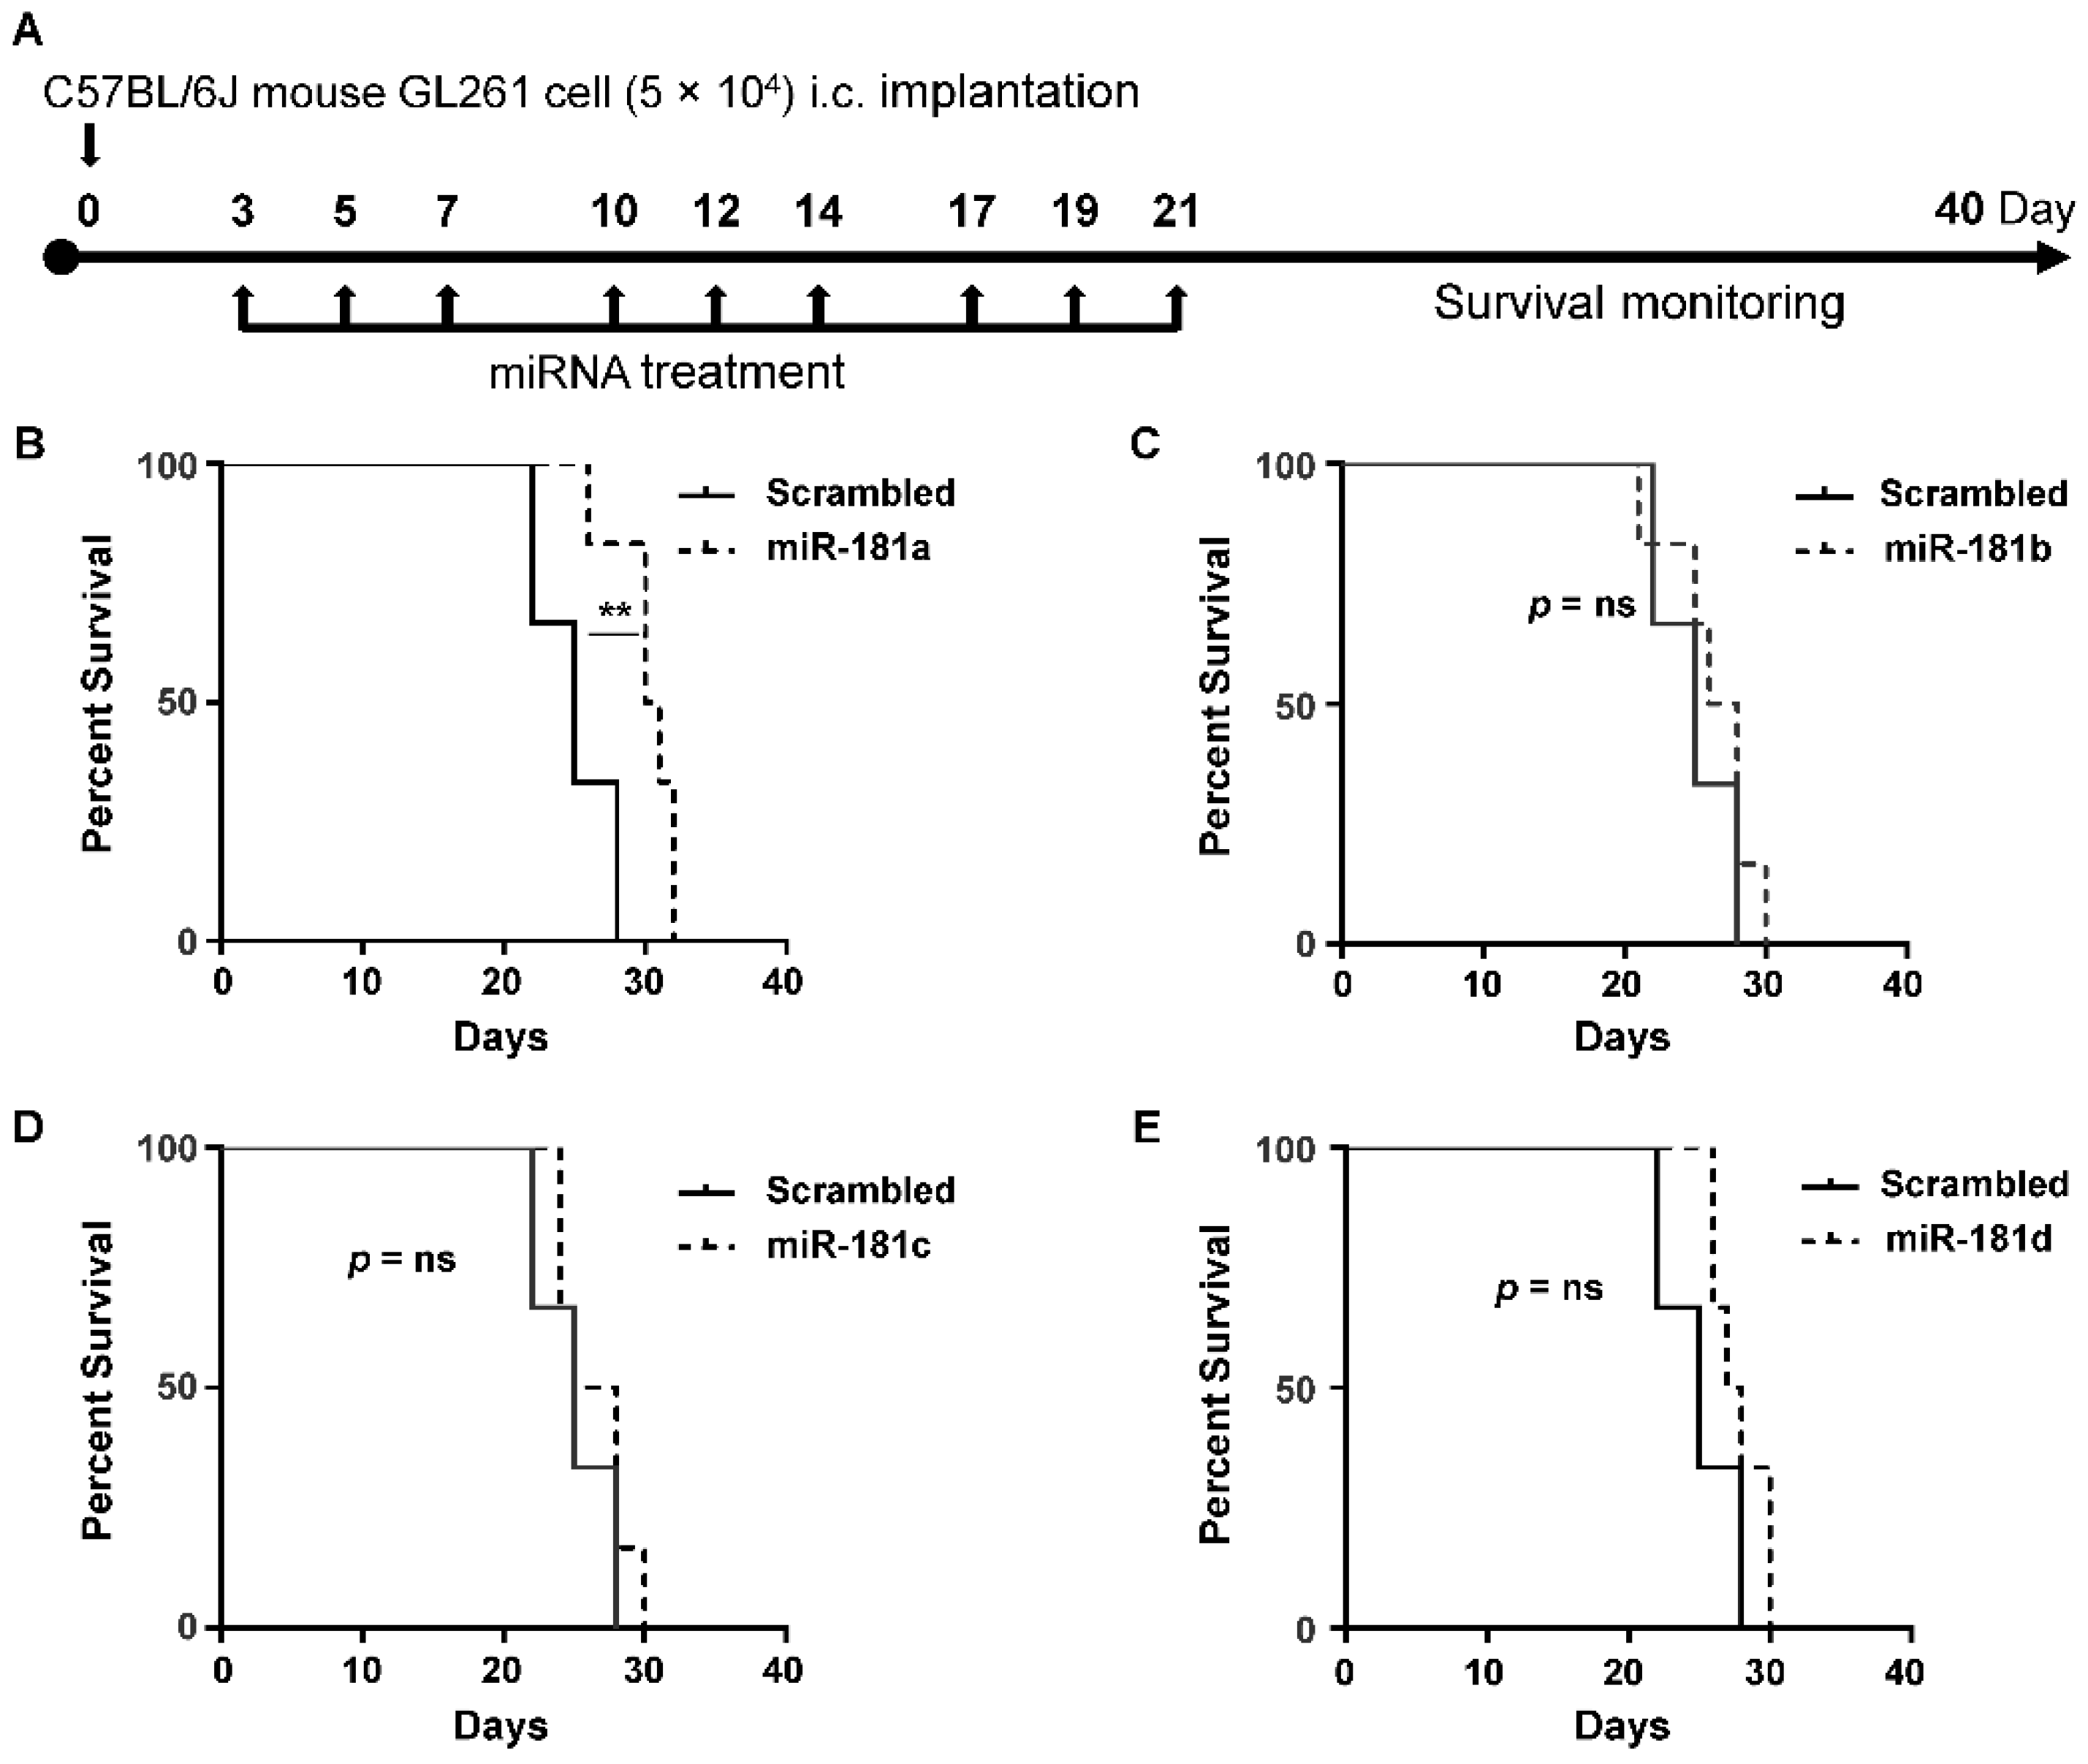
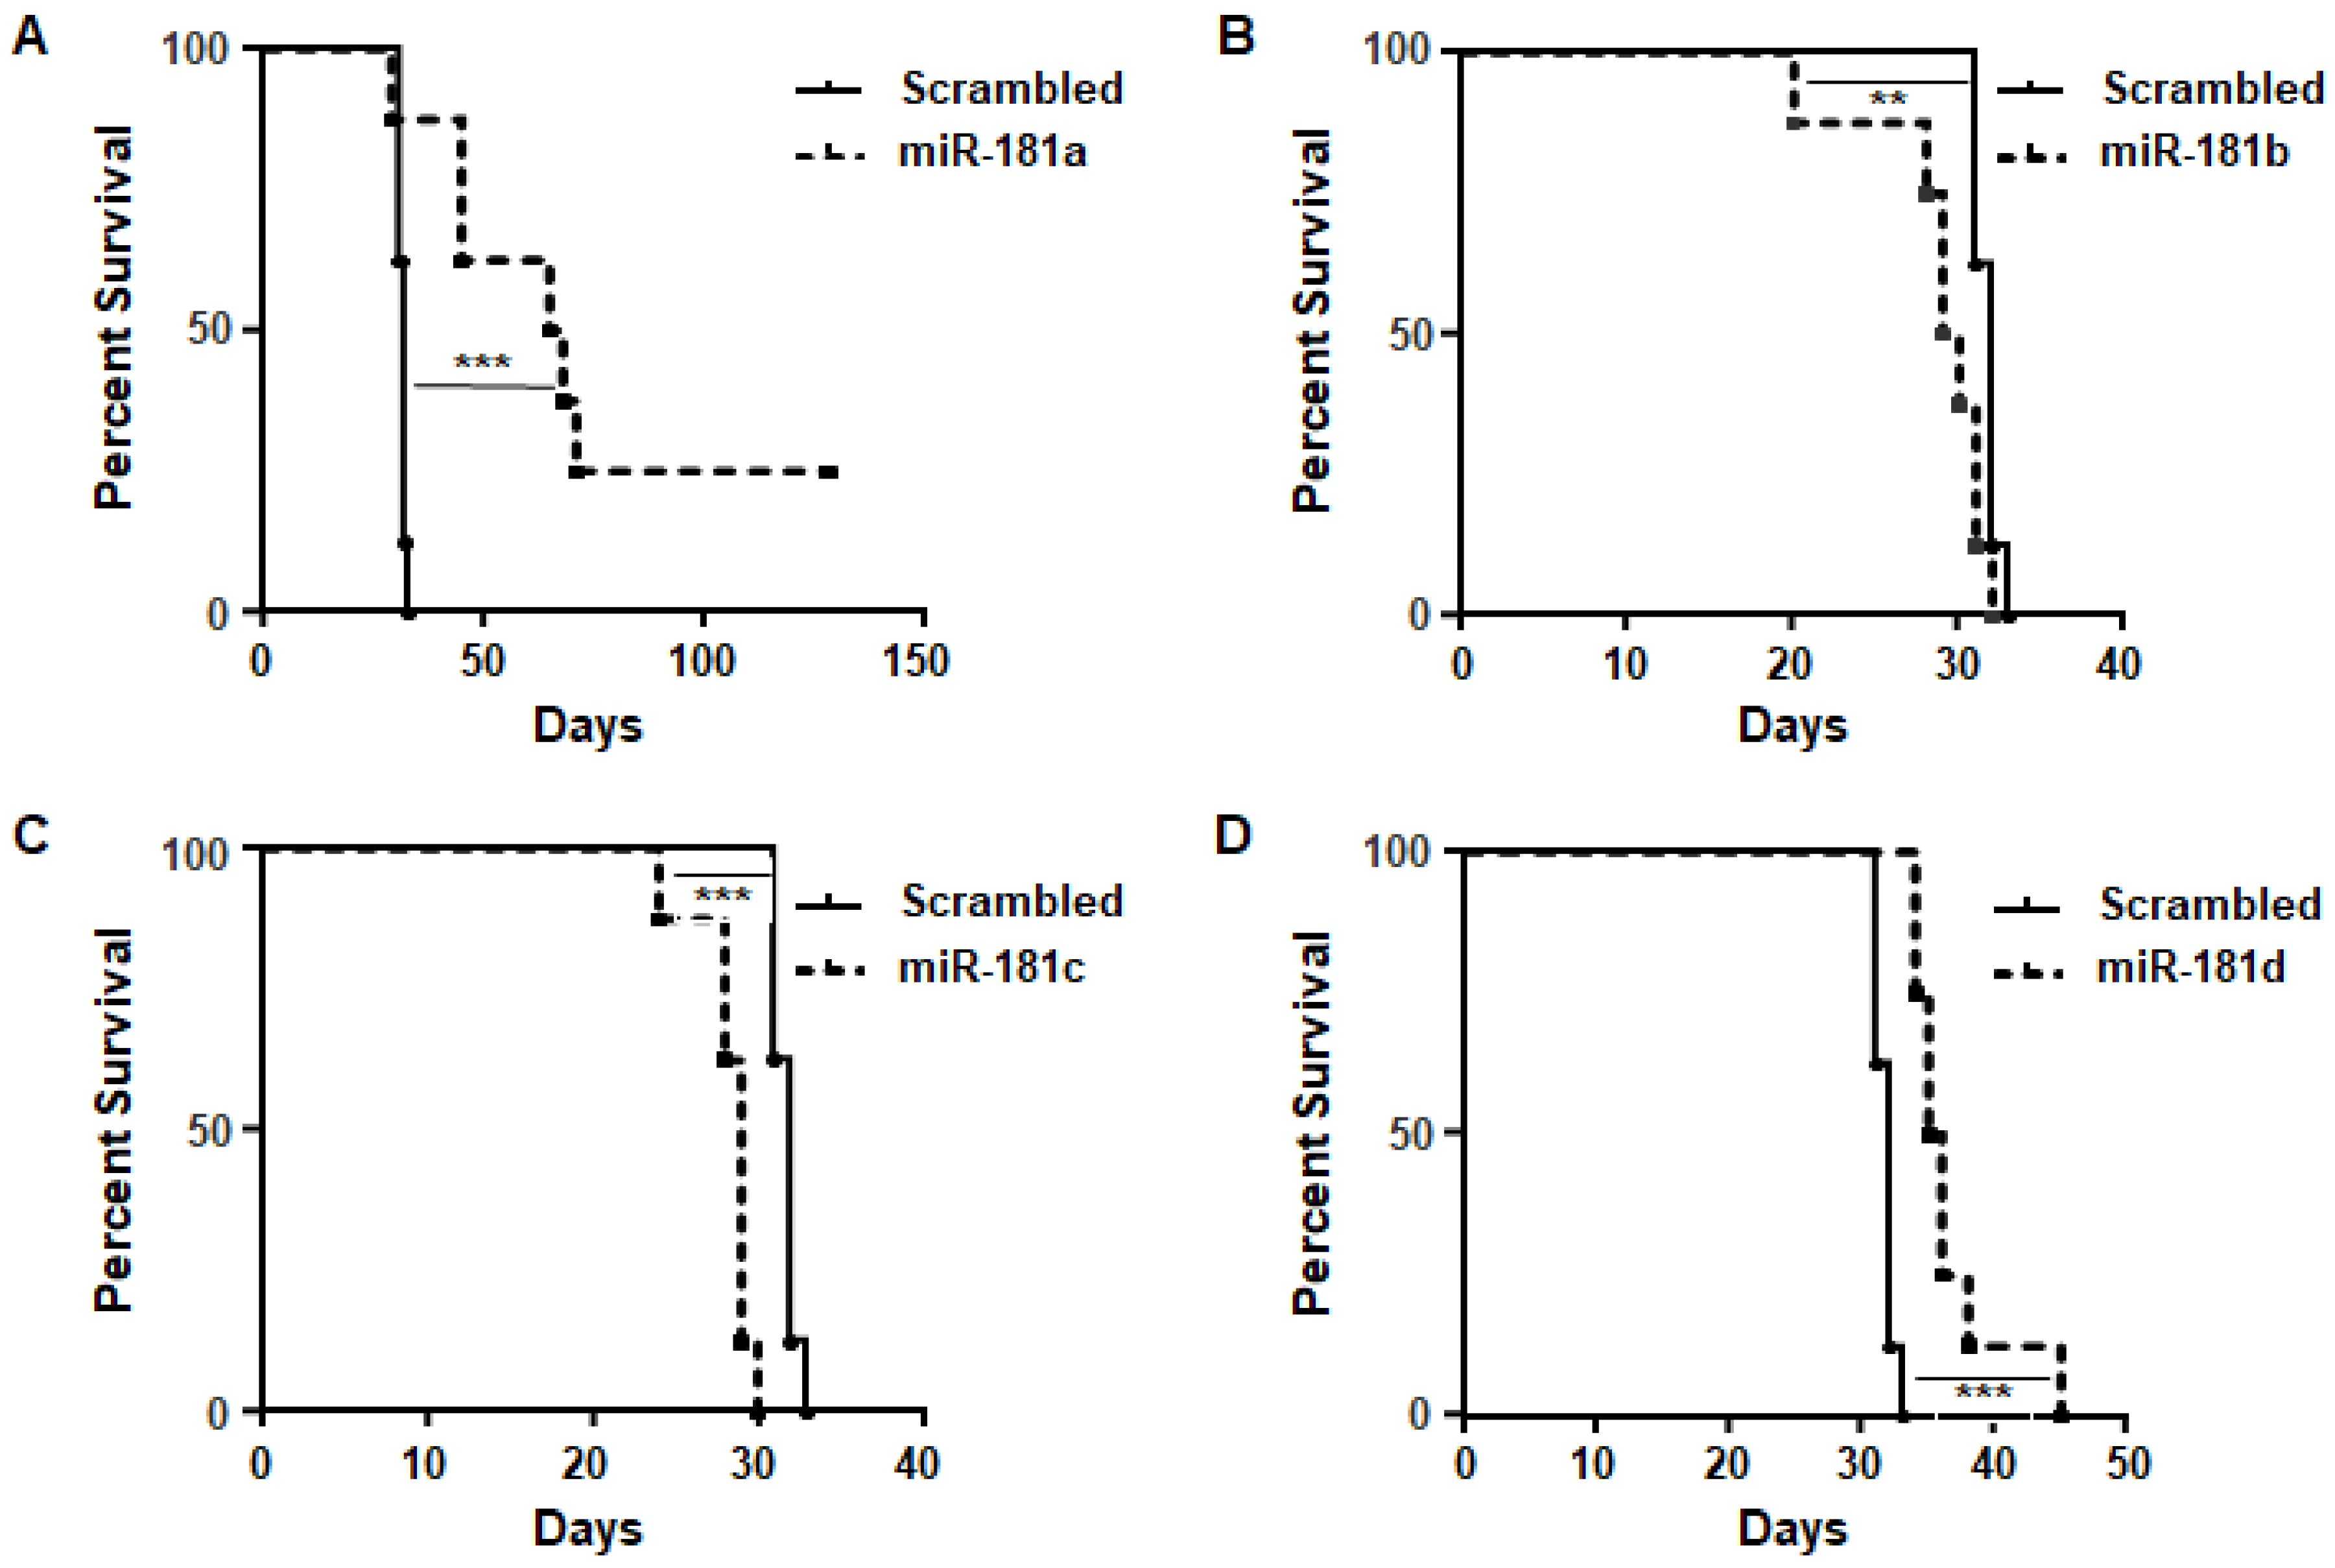
2.2. MiR-181a Regulates the Survival of Immune-Competent Mice Harboring GL261 Brain Tumors
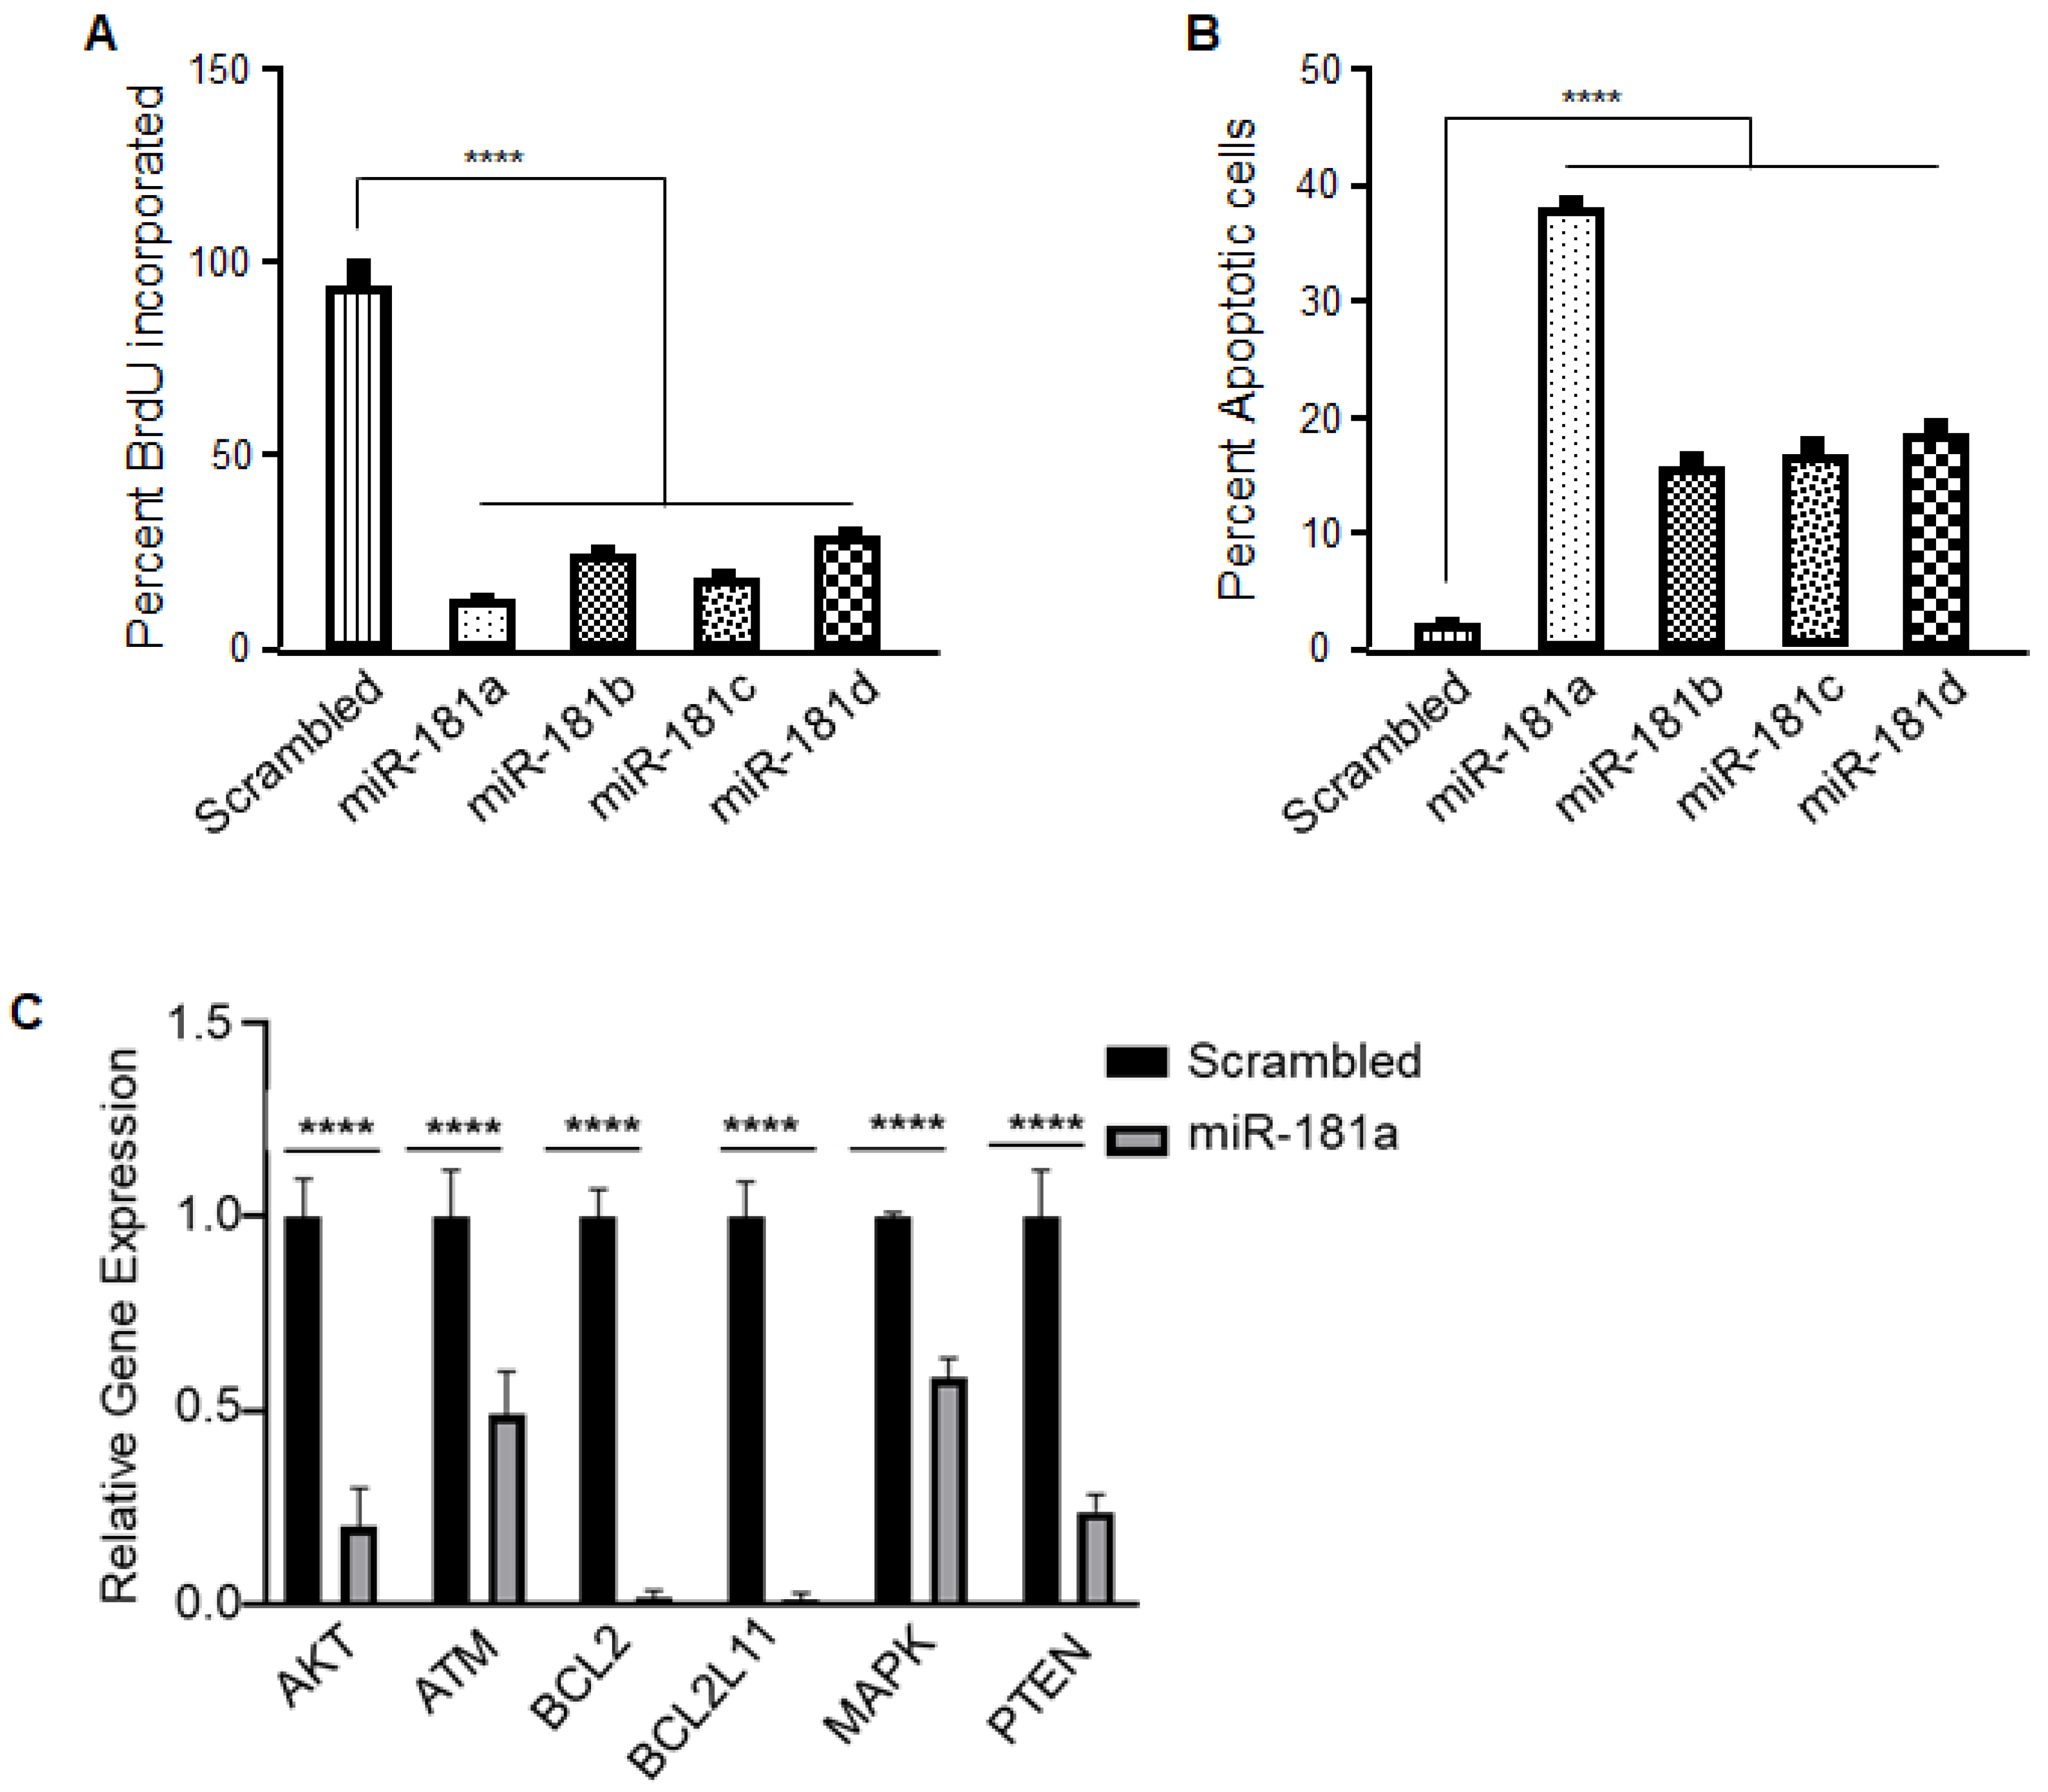
2.3. Identification and Validation of miR-181a-5p Apoptotic Targets
3. Discussion
4. Materials and Methods
4.1. Isolation of CD14b+ Cells from Blood and CD11b+ Cells from Glioblastoma Tissue
4.2. RNA Extraction and Quantitative Real-Time PCR
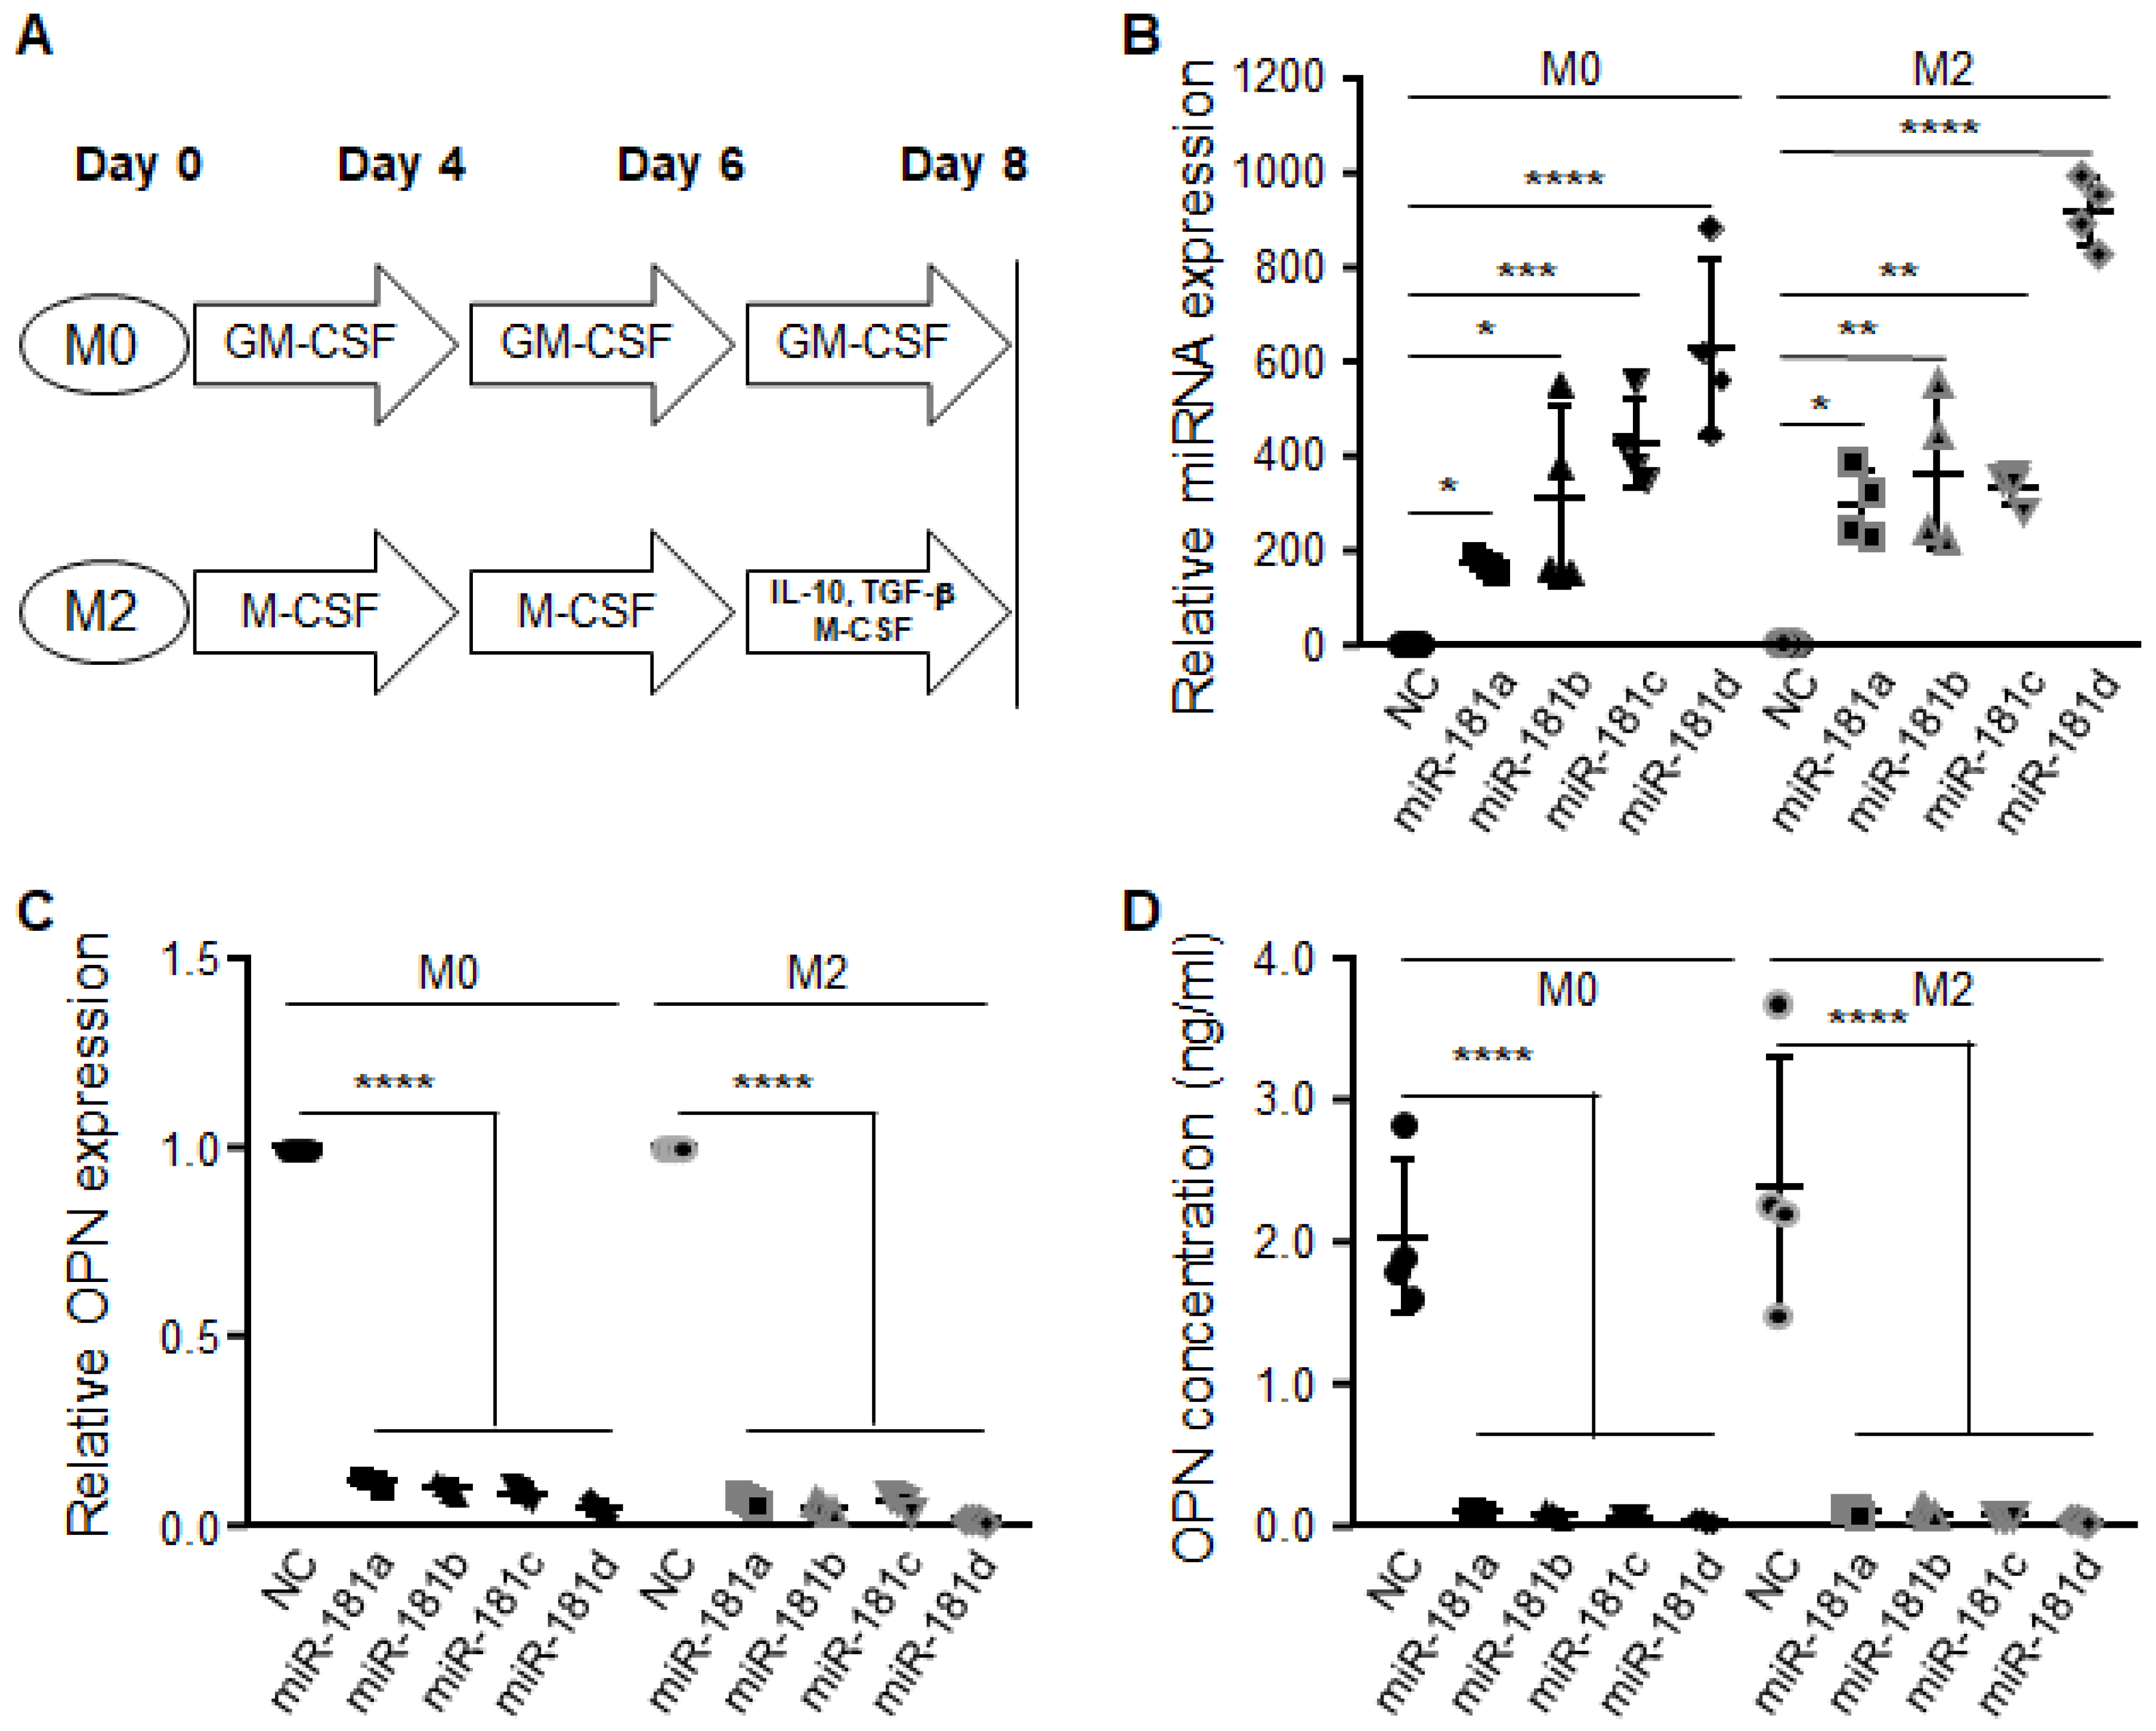
4.3. Monocyte Culture and Differentiation
4.4. Quantification of OPN Using Enzyme-Linked Immunosorbent Assay
4.5. Cell Culture
4.6. Transient and Stable Transfections of miRNAs
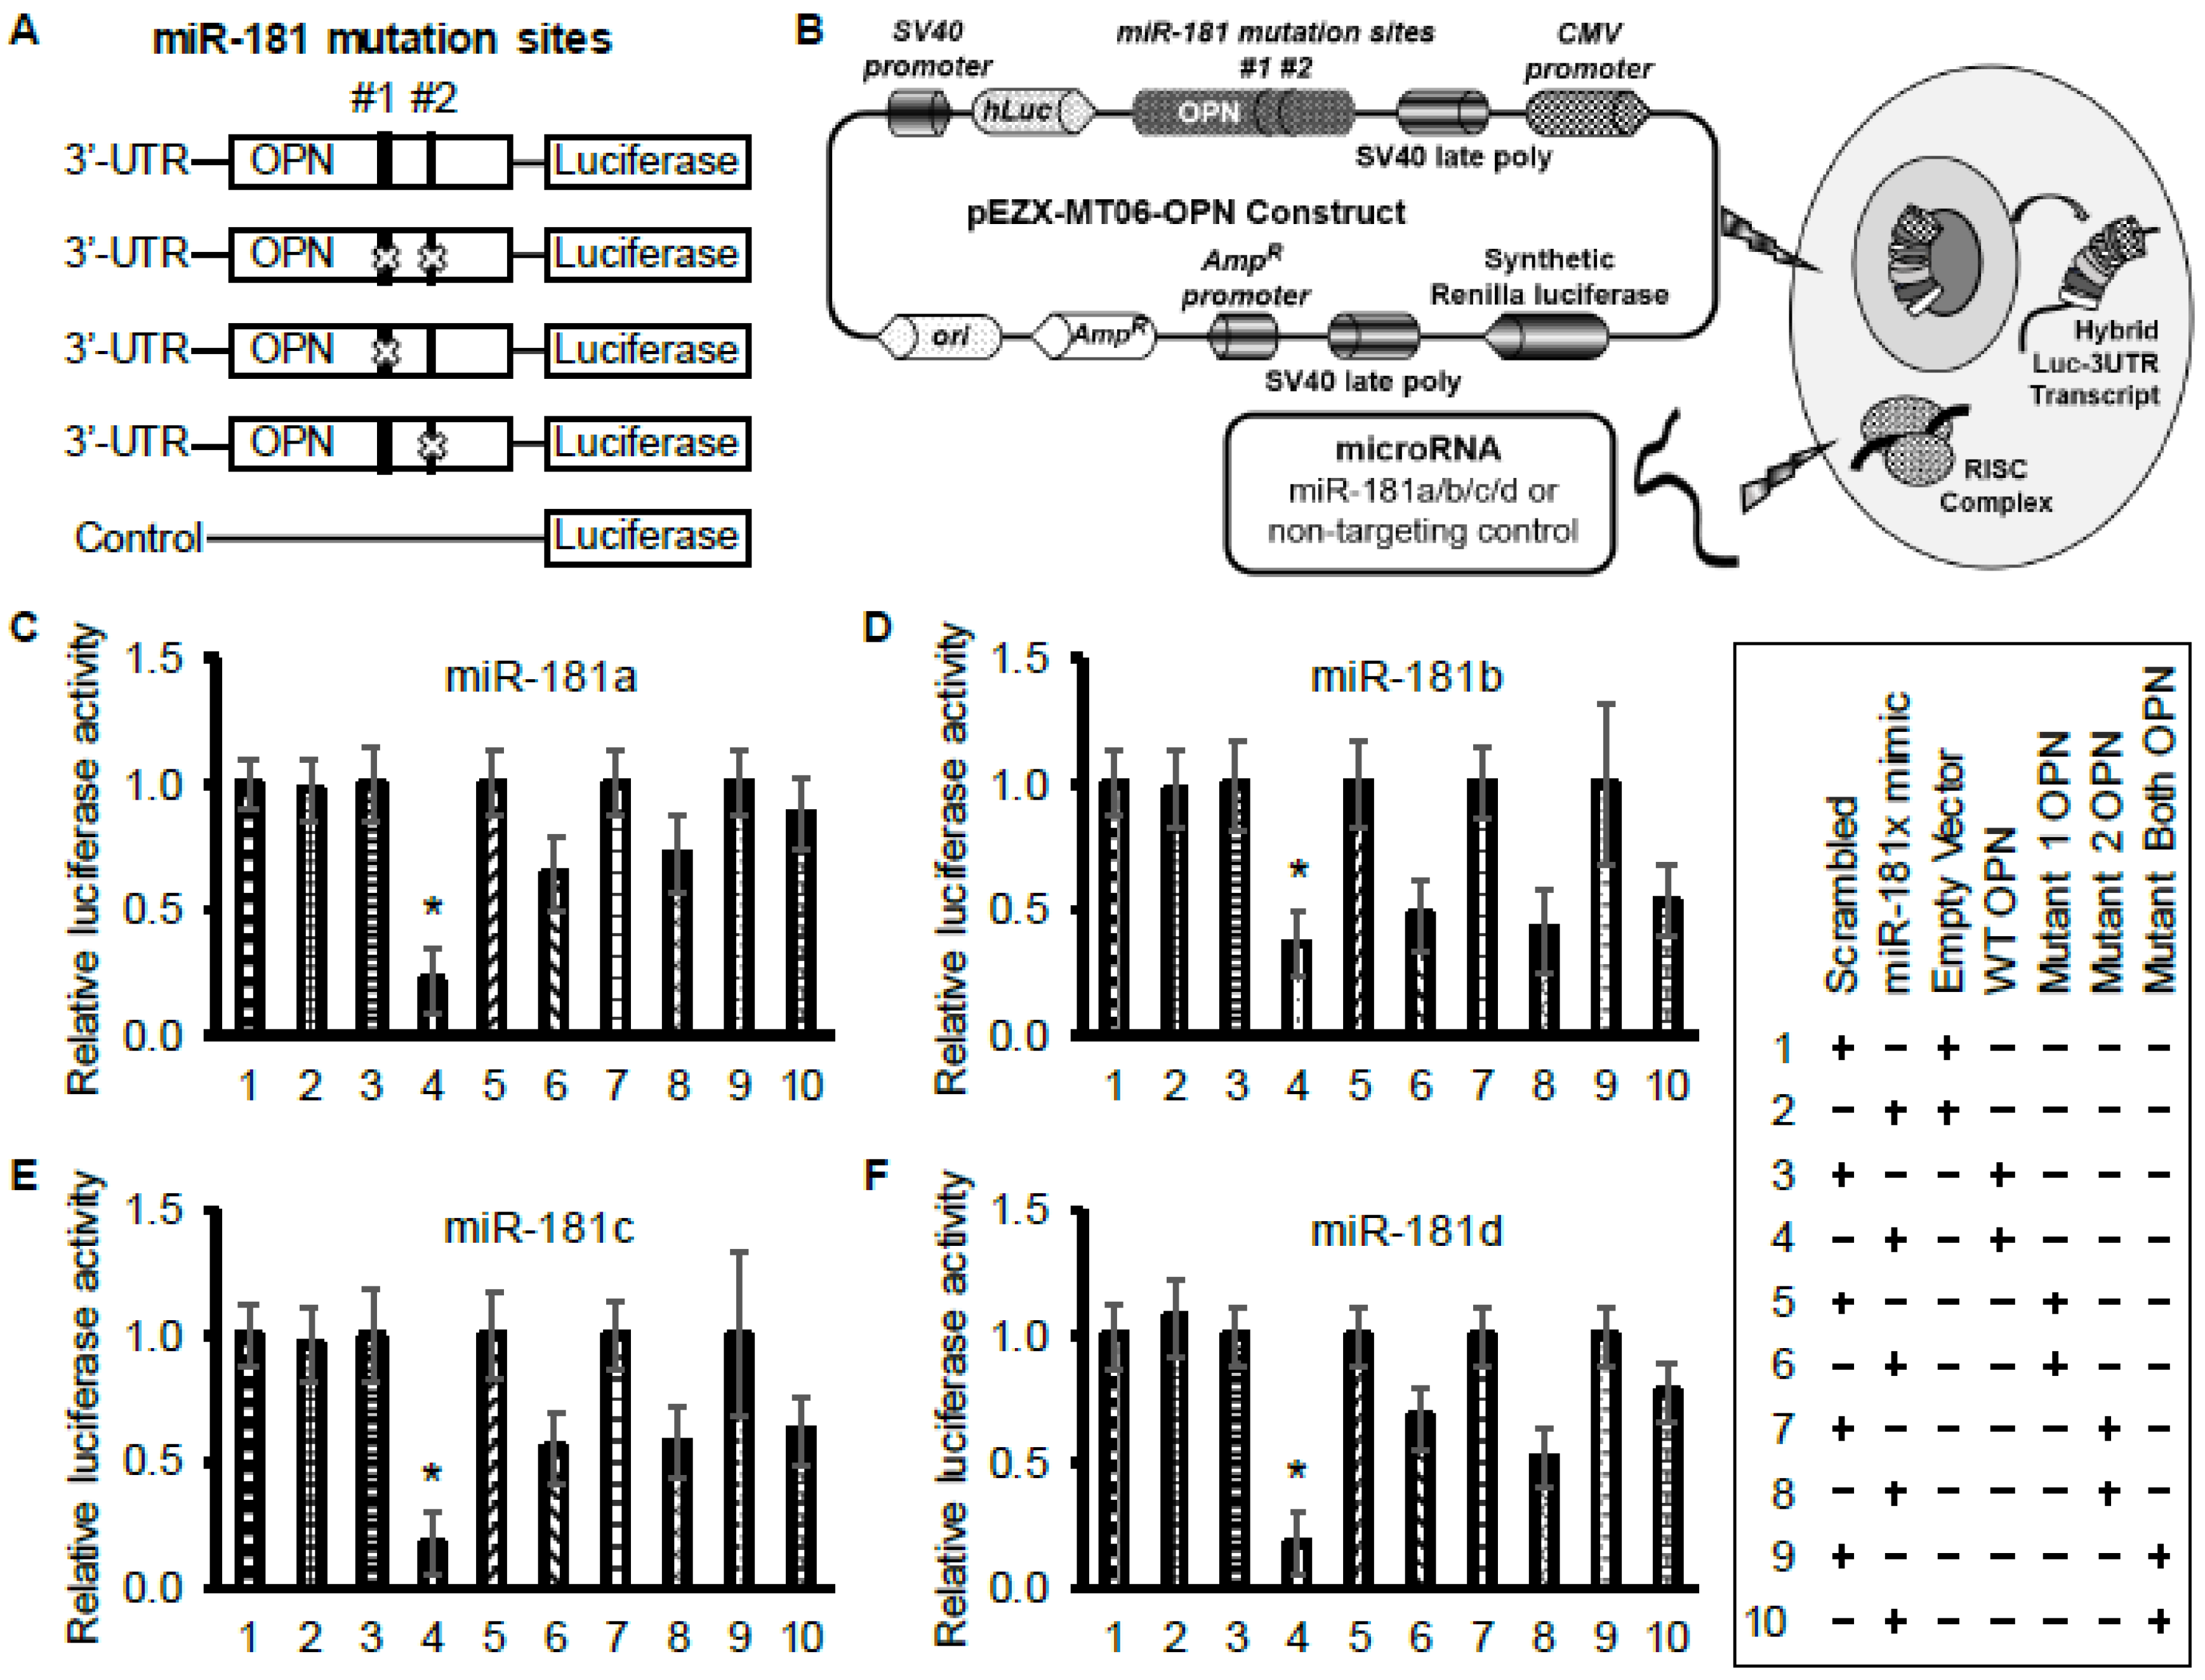
4.7. Luciferase Assay
4.8. BrdU Proliferation Assay
4.9. Apoptosis Assay
4.10. Caspase-3 Activity
4.11. Syngeneic Intracranial Glioma Model
4.12. In Vivo Treatments
4.13. Statistical Analysis
4.14. Approval & Ethical Statement
5. Conclusions
Supplementary Materials
Author Contributions
Funding
Acknowledgments
Conflicts of Interest
References
- Hussain, S.F.; Yang, D.; Suki, D.; Aldape, K.; Grimm, E.; Heimberger, A.B. The role of human glioma-infiltrating microglia/macrophages in mediating antitumor immune responses. Neuro Oncol. 2006, 8, 261–279. [Google Scholar] [CrossRef] [PubMed]
- Prionisti, I.; Bühler, L.H.; Walker, P.R.; Jolivet, R.B. Harnessing Microglia and Macrophages for the Treatment of Glioblastoma. Front. Pharmacol. 2019, 10, 506. [Google Scholar] [CrossRef] [PubMed]
- Domingues, P.; González-Tablas, M.; Otero, Á.; Pascual, D.; Miranda, D.; Ruiz, L.; Sousa, P.; Ciudad, J.; Gonçalves, J.M.; Lopes, M.C.; et al. Tumor infiltrating immune cells in gliomas and meningiomas. Brain Behav. Immun. 2016, 53, 1–15. [Google Scholar] [CrossRef] [PubMed]
- Wu, A.; Wei, J.; Kong, L.Y.; Wang, Y.; Priebe, W.; Qiao, W.; Sawaya, R.; Heimberger, A.B. Glioma cancer stem cells induce immunosuppressive macrophages/microglia. Neuro Oncol. 2010, 12, 1113–1125. [Google Scholar] [CrossRef]
- Zhang, F.; Parayath, N.N.; Ene, C.I.; Stephan, S.B.; Koehne, A.L.; Coon, M.E.; Holland, E.C.; Stephan, M.T. Genetic programming of macrophages to perform anti-tumor functions using targeted mRNA nanocarriers. Nat. Commun. 2019, 10, 3974. [Google Scholar] [CrossRef]
- Long, K.B.; Beatty, G.L. Harnessing the antitumor potential of macrophages for cancer immunotherapy. Oncoimmunology 2013, 2, e26860. [Google Scholar] [CrossRef]
- Xu, S.; Wei, J.; Wang, F.; Kong, L.Y.; Ling, X.Y.; Nduom, E.; Gabrusiewicz, K.; Doucette, T.; Yang, Y.; Yaghi, N.K.; et al. Effect of miR-142-3p on the M2 macrophage and therapeutic efficacy against murine glioblastoma. J. Natl. Cancer Inst. 2014, 106. [Google Scholar] [CrossRef]
- Gabrusiewicz, K.; Rodriguez, B.; Wei, J.; Hashimoto, Y.; Healy, L.M.; Maiti, S.N.; Thomas, G.; Zhou, S.; Wang, Q.; Elakkad, A.; et al. Glioblastoma-infiltrated innate immune cells resemble M0 macrophage phenotype. JCI Insight 2016, 1. [Google Scholar] [CrossRef]
- Wei, J.; Marisetty, A.; Schrand, B.; Gabrusiewicz, K.; Hashimoto, Y.; Ott, M.; Grami, Z.; Kong, L.Y.; Ling, X.; Caruso, H.; et al. Osteopontin mediates glioblastoma-associated macrophage infiltration and is a potential therapeutic target. J. Clin. Investig. 2019, 129, 137–149. [Google Scholar] [CrossRef]
- Lund, S.A.; Giachelli, C.M.; Scatena, M. The role of osteopontin in inflammatory processes. J. Cell Commun. Signal. 2009, 3, 311–322. [Google Scholar] [CrossRef]
- Wei, J.; Wang, F.; Kong, L.Y.; Xu, S.; Doucette, T.; Ferguson, S.D.; Yang, Y.; McEnery, K.; Jethwa, K.; Gjyshi, O.; et al. miR-124 inhibits STAT3 signaling to enhance T cell-mediated immune clearance of glioma. Cancer Res. 2013, 73, 3913–3926. [Google Scholar] [CrossRef]
- Wei, J.; Nduom, E.K.; Kong, L.Y.; Hashimoto, Y.; Xu, S.; Gabrusiewicz, K.; Ling, X.; Huang, N.; Qiao, W.; Zhou, S.; et al. miR-138 exerts anti-glioma efficacy by targeting immune checkpoints. Neuro Oncol. 2016, 18, 639–648. [Google Scholar] [CrossRef] [PubMed]
- Xue, J.; Zhou, A.; Wu, Y.; Morris, S.A.; Lin, K.; Amin, S.; Verhaak, R.; Fuller, G.; Xie, K.; Heimberger, A.B.; et al. miR-182-5p Induced by STAT3 Activation Promotes Glioma Tumorigenesis. Cancer Res. 2016, 76, 4293–4304. [Google Scholar] [CrossRef]
- Yaghi, N.K.; Wei, J.; Hashimoto, Y.; Kong, L.Y.; Gabrusiewicz, K.; Nduom, E.K.; Ling, X.; Huang, N.; Zhou, S.; Kerrigan, B.C.; et al. Immune modulatory nanoparticle therapeutics for intracerebral glioma. Neuro Oncol. 2017, 19, 372–382. [Google Scholar] [CrossRef] [PubMed]
- Zhang, M.; Zhang, Q.; Hu, Y.; Xu, L.; Jiang, Y.; Zhang, C.; Ding, L.; Jiang, R.; Sun, J.; Sun, H.; et al. miR-181a increases FoxO1 acetylation and promotes granulosa cell apoptosis via SIRT1 downregulation. Cell Death Dis. 2017, 8, e3088. [Google Scholar] [CrossRef] [PubMed]
- Chen, G.; Zhu, W.; Shi, D.; Lv, L.; Zhang, C.; Liu, P.; Hu, W. MicroRNA-181a sensitizes human malignant glioma U87MG cells to radiation by targeting Bcl-2. Oncol. Rep. 2010, 23, 997–1003. [Google Scholar] [CrossRef]
- Ji, J.; Yamashita, T.; Budhu, A.; Forgues, M.; Jia, H.L.; Li, C.; Deng, C.; Wauthier, E.; Reid, L.M.; Ye, Q.H.; et al. Identification of microRNA-181 by genome-wide screening as a critical player in EpCAM-positive hepatic cancer stem cells. Hepatology 2009, 50, 472–480. [Google Scholar] [CrossRef]
- Li, N.; Cheng, C.; Wang, T. miR-181c-5p Mitigates Tumorigenesis in Cervical Squamous Cell Carcinoma via Targeting Glycogen Synthase Kinase 3β Interaction Protein (GSKIP). OncoTargets Ther. 2020, 13, 4495–4505. [Google Scholar] [CrossRef]
- Li, Y.; Kuscu, C.; Banach, A.; Zhang, Q.; Pulkoski-Gross, A.; Kim, D.; Liu, J.; Roth, E.; Li, E.; Shroyer, K.R.; et al. miR-181a-5p Inhibits Cancer Cell Migration and Angiogenesis via Downregulation of Matrix Metalloproteinase-14. Cancer Res. 2015, 75, 2674–2685. [Google Scholar] [CrossRef]
- Wang, H.; Tao, T.; Yan, W.; Feng, Y.; Wang, Y.; Cai, J.; You, Y.; Jiang, T.; Jiang, C. Upregulation of miR-181s reverses mesenchymal transition by targeting KPNA4 in glioblastoma. Sci. Rep. 2015, 5, 13072. [Google Scholar] [CrossRef]
- Zhai, F.; Chen, X.; He, Q.; Zhang, H.; Hu, Y.; Wang, D.; Liu, S.; Zhang, Y. MicroRNA-181 inhibits glioblastoma cell growth by directly targeting CCL8. Oncol. Lett. 2019, 18, 1922–1930. [Google Scholar] [CrossRef] [PubMed]
- Wen, X.; Li, S.; Guo, M.; Liao, H.; Chen, Y.; Kuang, X.; Liao, X.; Ma, L.; Li, Q. miR-181a-5p inhibits the proliferation and invasion of drug-resistant glioblastoma cells by targeting F-box protein 11 expression. Oncol. Lett. 2020, 20, 235. [Google Scholar] [CrossRef] [PubMed]
- Adams, J.M.; Cory, S. The Bcl-2 apoptotic switch in cancer development and therapy. Oncogene 2007, 26, 1324–1337. [Google Scholar] [CrossRef]
- Willis, S.; Day, C.L.; Hinds, M.G.; Huang, D.C. The Bcl-2-regulated apoptotic pathway. J. Cell Sci. 2003, 116, 4053–4056. [Google Scholar] [CrossRef]
- Yip, K.W.; Reed, J.C. Bcl-2 family proteins and cancer. Oncogene 2008, 27, 6398–6406. [Google Scholar] [CrossRef]
- Lessene, G.; Czabotar, P.E.; Colman, P.M. BCL-2 family antagonists for cancer therapy. Nat. Rev. Drug Discov. 2008, 7, 989–1000. [Google Scholar] [CrossRef]
- Zhu, T.; Shen, Y.; Tang, Q.; Chen, L.; Gao, H.; Zhu, J. BCNU/PLGA microspheres: A promising strategy for the treatment of gliomas in mice. Chin. J. Cancer Res. 2014, 26, 81–88. [Google Scholar] [CrossRef] [PubMed]
- Wu, X.F.; Zhou, Z.H.; Zou, J. MicroRNA-181 inhibits proliferation and promotes apoptosis of chondrocytes in osteoarthritis by targeting PTEN. Biochem. Cell Biol. 2017, 95, 437–444. [Google Scholar] [CrossRef] [PubMed]
- Xu, C.H.; Xiao, L.M.; Zeng, E.M.; Chen, L.K.; Zheng, S.Y.; Li, D.H.; Liu, Y. MicroRNA-181 inhibits the proliferation, drug sensitivity and invasion of human glioma cells by targeting Selenoprotein K (SELK). Am. J. Transl. Res. 2019, 11, 6632–6640. [Google Scholar] [PubMed]
- Zhang, X.; Nie, Y.; Li, X.; Wu, G.; Huang, Q.; Cao, J.; Du, Y.; Li, J.; Deng, R.; Huang, D.; et al. MicroRNA-181a functions as an oncomir in gastric cancer by targeting the tumour suppressor gene ATM. Pathol. Oncol. Res. 2014, 20, 381–389. [Google Scholar] [CrossRef]
- Wang, Q.; Hu, B.; Hu, X.; Kim, H.; Squatrito, M.; Scarpace, L.; de Carvalho, A.C.; Lyu, S.; Li, P.; Li, Y.; et al. Tumor Evolution of Glioma-Intrinsic Gene Expression Subtypes Associates with Immunological Changes in the Microenvironment. Cancer Cell 2017, 32, 42–56.e46. [Google Scholar] [CrossRef] [PubMed]
- Chen, P.; Zhao, D.; Li, J.; Liang, X.; Li, J.; Chang, A.; Henry, V.K.; Lan, Z.; Spring, D.J.; Rao, G.; et al. Symbiotic Macrophage-Glioma Cell Interactions Reveal Synthetic Lethality in PTEN-Null Glioma. Cancer Cell 2019, 35, 868–884.e886. [Google Scholar] [CrossRef]
- Gimba, E.R.P.; Brum, M.C.M.; De Moraes, G.N. Full-length osteopontin and its splice variants as modulators of chemoresistance and radioresistance (Review). Int. J. Oncol. 2019, 54, 420–430. [Google Scholar] [CrossRef] [PubMed]
- Han, B.; Huang, J.; Han, Y.; Hao, J.; Wu, X.; Song, H.; Chen, X.; Shen, Q.; Dong, X.; Pang, H.; et al. The microRNA miR-181c enhances chemosensitivity and reduces chemoresistance in breast cancer cells via down-regulating osteopontin. Int. J. Biol. Macromol. 2019, 125, 544–556. [Google Scholar] [CrossRef] [PubMed]
- Icer, M.A.; Gezmen-Karadag, M. The multiple functions and mechanisms of osteopontin. Clin. Biochem. 2018, 59, 17–24. [Google Scholar] [CrossRef]
- Semonche, A.; Shah, A.H.; Ivan, M.E.; Komotar, R.J. Towards a microRNA-based Gene Therapy for Glioblastoma. Neurosurgery 2019, 85, E210–E211. [Google Scholar] [CrossRef]
- Gao, W.; Yu, Y.; Cao, H.; Shen, H.; Li, X.; Pan, S.; Shu, Y. Deregulated expression of miR-21, miR-143 and miR-181a in non small cell lung cancer is related to clinicopathologic characteristics or patient prognosis. Biomed. Pharmacother. 2010, 64, 399–408. [Google Scholar] [CrossRef]
- Shi, L.; Cheng, Z.; Zhang, J.; Li, R.; Zhao, P.; Fu, Z.; You, Y. hsa-mir-181a and hsa-mir-181b function as tumor suppressors in human glioma cells. Brain Res. 2008, 1236, 185–193. [Google Scholar] [CrossRef]
- Chen, G.; Shen, Z.L.; Wang, L.; Lv, C.Y.; Huang, X.E.; Zhou, R.P. Hsa-miR-181a-5p expression and effects on cell proliferation in gastric cancer. Asian Pac. J. Cancer Prev. 2013, 14, 3871–3875. [Google Scholar] [CrossRef]
- Keutgen, X.M.; Filicori, F.; Crowley, M.J.; Wang, Y.; Scognamiglio, T.; Hoda, R.; Buitrago, D.; Cooper, D.; Zeiger, M.A.; Zarnegar, R.; et al. A panel of four miRNAs accurately differentiates malignant from benign indeterminate thyroid lesions on fine needle aspiration. Clin. Cancer Res. 2012, 18, 2032–2038. [Google Scholar] [CrossRef]
- Zhang, X.; Nie, Y.; Du, Y.; Cao, J.; Shen, B.; Li, Y. MicroRNA-181a promotes gastric cancer by negatively regulating tumor suppressor KLF6. Tumour Biol. 2012, 33, 1589–1597. [Google Scholar] [CrossRef] [PubMed]
- Yang, L.; Ma, Y.; Xin, Y.; Han, R.; Li, R.; Hao, X. Role of the microRNA 181 family in glioma development. Mol. Med. Rep. 2018, 17, 322–329. [Google Scholar] [CrossRef] [PubMed]
- Svoronos, A.A.; Engelman, D.M.; Slack, F.J. OncomiR or Tumor Suppressor? The Duplicity of MicroRNAs in Cancer. Cancer Res. 2016, 76, 3666–3670. [Google Scholar] [CrossRef] [PubMed]
- Omar, H.A.; El-Serafi, A.T.; Hersi, F.; Arafa, E.A.; Zaher, D.M.; Madkour, M.; Arab, H.H.; Tolba, M.F. Immunomodulatory MicroRNAs in cancer: Targeting immune checkpoints and the tumor microenvironment. FEBS J. 2019, 286, 3540–3557. [Google Scholar] [CrossRef]
- Orso, F.; Quirico, L.; Dettori, D.; Coppo, R.; Virga, F.; Ferreira, L.C.; Paoletti, C.; Baruffaldi, D.; Penna, E.; Taverna, D. Role of miRNAs in tumor and endothelial cell interactions during tumor progression. Semin. Cancer Biol. 2020, 60, 214–224. [Google Scholar] [CrossRef]
- He, B.; Zhao, Z.; Cai, Q.; Zhang, Y.; Zhang, P.; Shi, S.; Xie, H.; Peng, X.; Yin, W.; Tao, Y.; et al. miRNA-based biomarkers, therapies, and resistance in Cancer. Int. J. Biol. Sci. 2020, 16, 2628–2647. [Google Scholar] [CrossRef]
- Louis, D.N.; Ohgaki, H.; Wiestler, O.D.; Cavenee, W.K.; Burger, P.C.; Jouvet, A.; Scheithauer, B.W.; Kleihues, P. The 2007 WHO classification of tumours of the central nervous system. Acta Neuropathol. 2007, 114, 97–109. [Google Scholar] [CrossRef]
- Marisetty, A.L.; Singh, S.K.; Nguyen, T.N.; Coarfa, C.; Liu, B.; Majumder, S. REST represses miR-124 and miR-203 to regulate distinct oncogenic properties of glioblastoma stem cells. Neuro Oncol. 2017, 19, 514–523. [Google Scholar] [CrossRef]
- Heimberger, A.B.; Crotty, L.E.; Archer, G.E.; Hess, K.R.; Wikstrand, C.J.; Friedman, A.H.; Friedman, H.S.; Bigner, D.D.; Sampson, J.H. Epidermal growth factor receptor VIII peptide vaccination is efficacious against established intracerebral tumors. Clin. Cancer Res. 2003, 9, 4247–4254. [Google Scholar]
- National Center for Biotechnology Information, BLAST. Available online: https://blast.ncbi.nlm.nih.gov/Blast.cgi (accessed on 23 December 2019).
- Graner, M.W.; Schnell, S.; Olin, M.R. Tumor-derived exosomes, microRNAs, and cancer immune suppression. Semin. Immunopathol. 2018, 40, 505–515. [Google Scholar] [CrossRef]
- Barros, F.M.; Carneiro, F.; Machado, J.C.; Melo, S.A. Exosomes and Immune Response in Cancer: Friends or Foes? Front. Immunol. 2018, 9, 730. [Google Scholar] [CrossRef] [PubMed]


Publisher’s Note: MDPI stays neutral with regard to jurisdictional claims in published maps and institutional affiliations. |
© 2020 by the authors. Licensee MDPI, Basel, Switzerland. This article is an open access article distributed under the terms and conditions of the Creative Commons Attribution (CC BY) license (http://creativecommons.org/licenses/by/4.0/).
Share and Cite
Marisetty, A.; Wei, J.; Kong, L.-Y.; Ott, M.; Fang, D.; Sabbagh, A.; Heimberger, A.B. MiR-181 Family Modulates Osteopontin in Glioblastoma Multiforme. Cancers 2020, 12, 3813. https://doi.org/10.3390/cancers12123813
Marisetty A, Wei J, Kong L-Y, Ott M, Fang D, Sabbagh A, Heimberger AB. MiR-181 Family Modulates Osteopontin in Glioblastoma Multiforme. Cancers. 2020; 12(12):3813. https://doi.org/10.3390/cancers12123813
Chicago/Turabian StyleMarisetty, Anantha, Jun Wei, Ling-Yuan Kong, Martina Ott, Dexing Fang, Aria Sabbagh, and Amy B. Heimberger. 2020. "MiR-181 Family Modulates Osteopontin in Glioblastoma Multiforme" Cancers 12, no. 12: 3813. https://doi.org/10.3390/cancers12123813
APA StyleMarisetty, A., Wei, J., Kong, L.-Y., Ott, M., Fang, D., Sabbagh, A., & Heimberger, A. B. (2020). MiR-181 Family Modulates Osteopontin in Glioblastoma Multiforme. Cancers, 12(12), 3813. https://doi.org/10.3390/cancers12123813