Tumors Widely Express Hundreds of Embryonic Germline Genes

 , and
, and 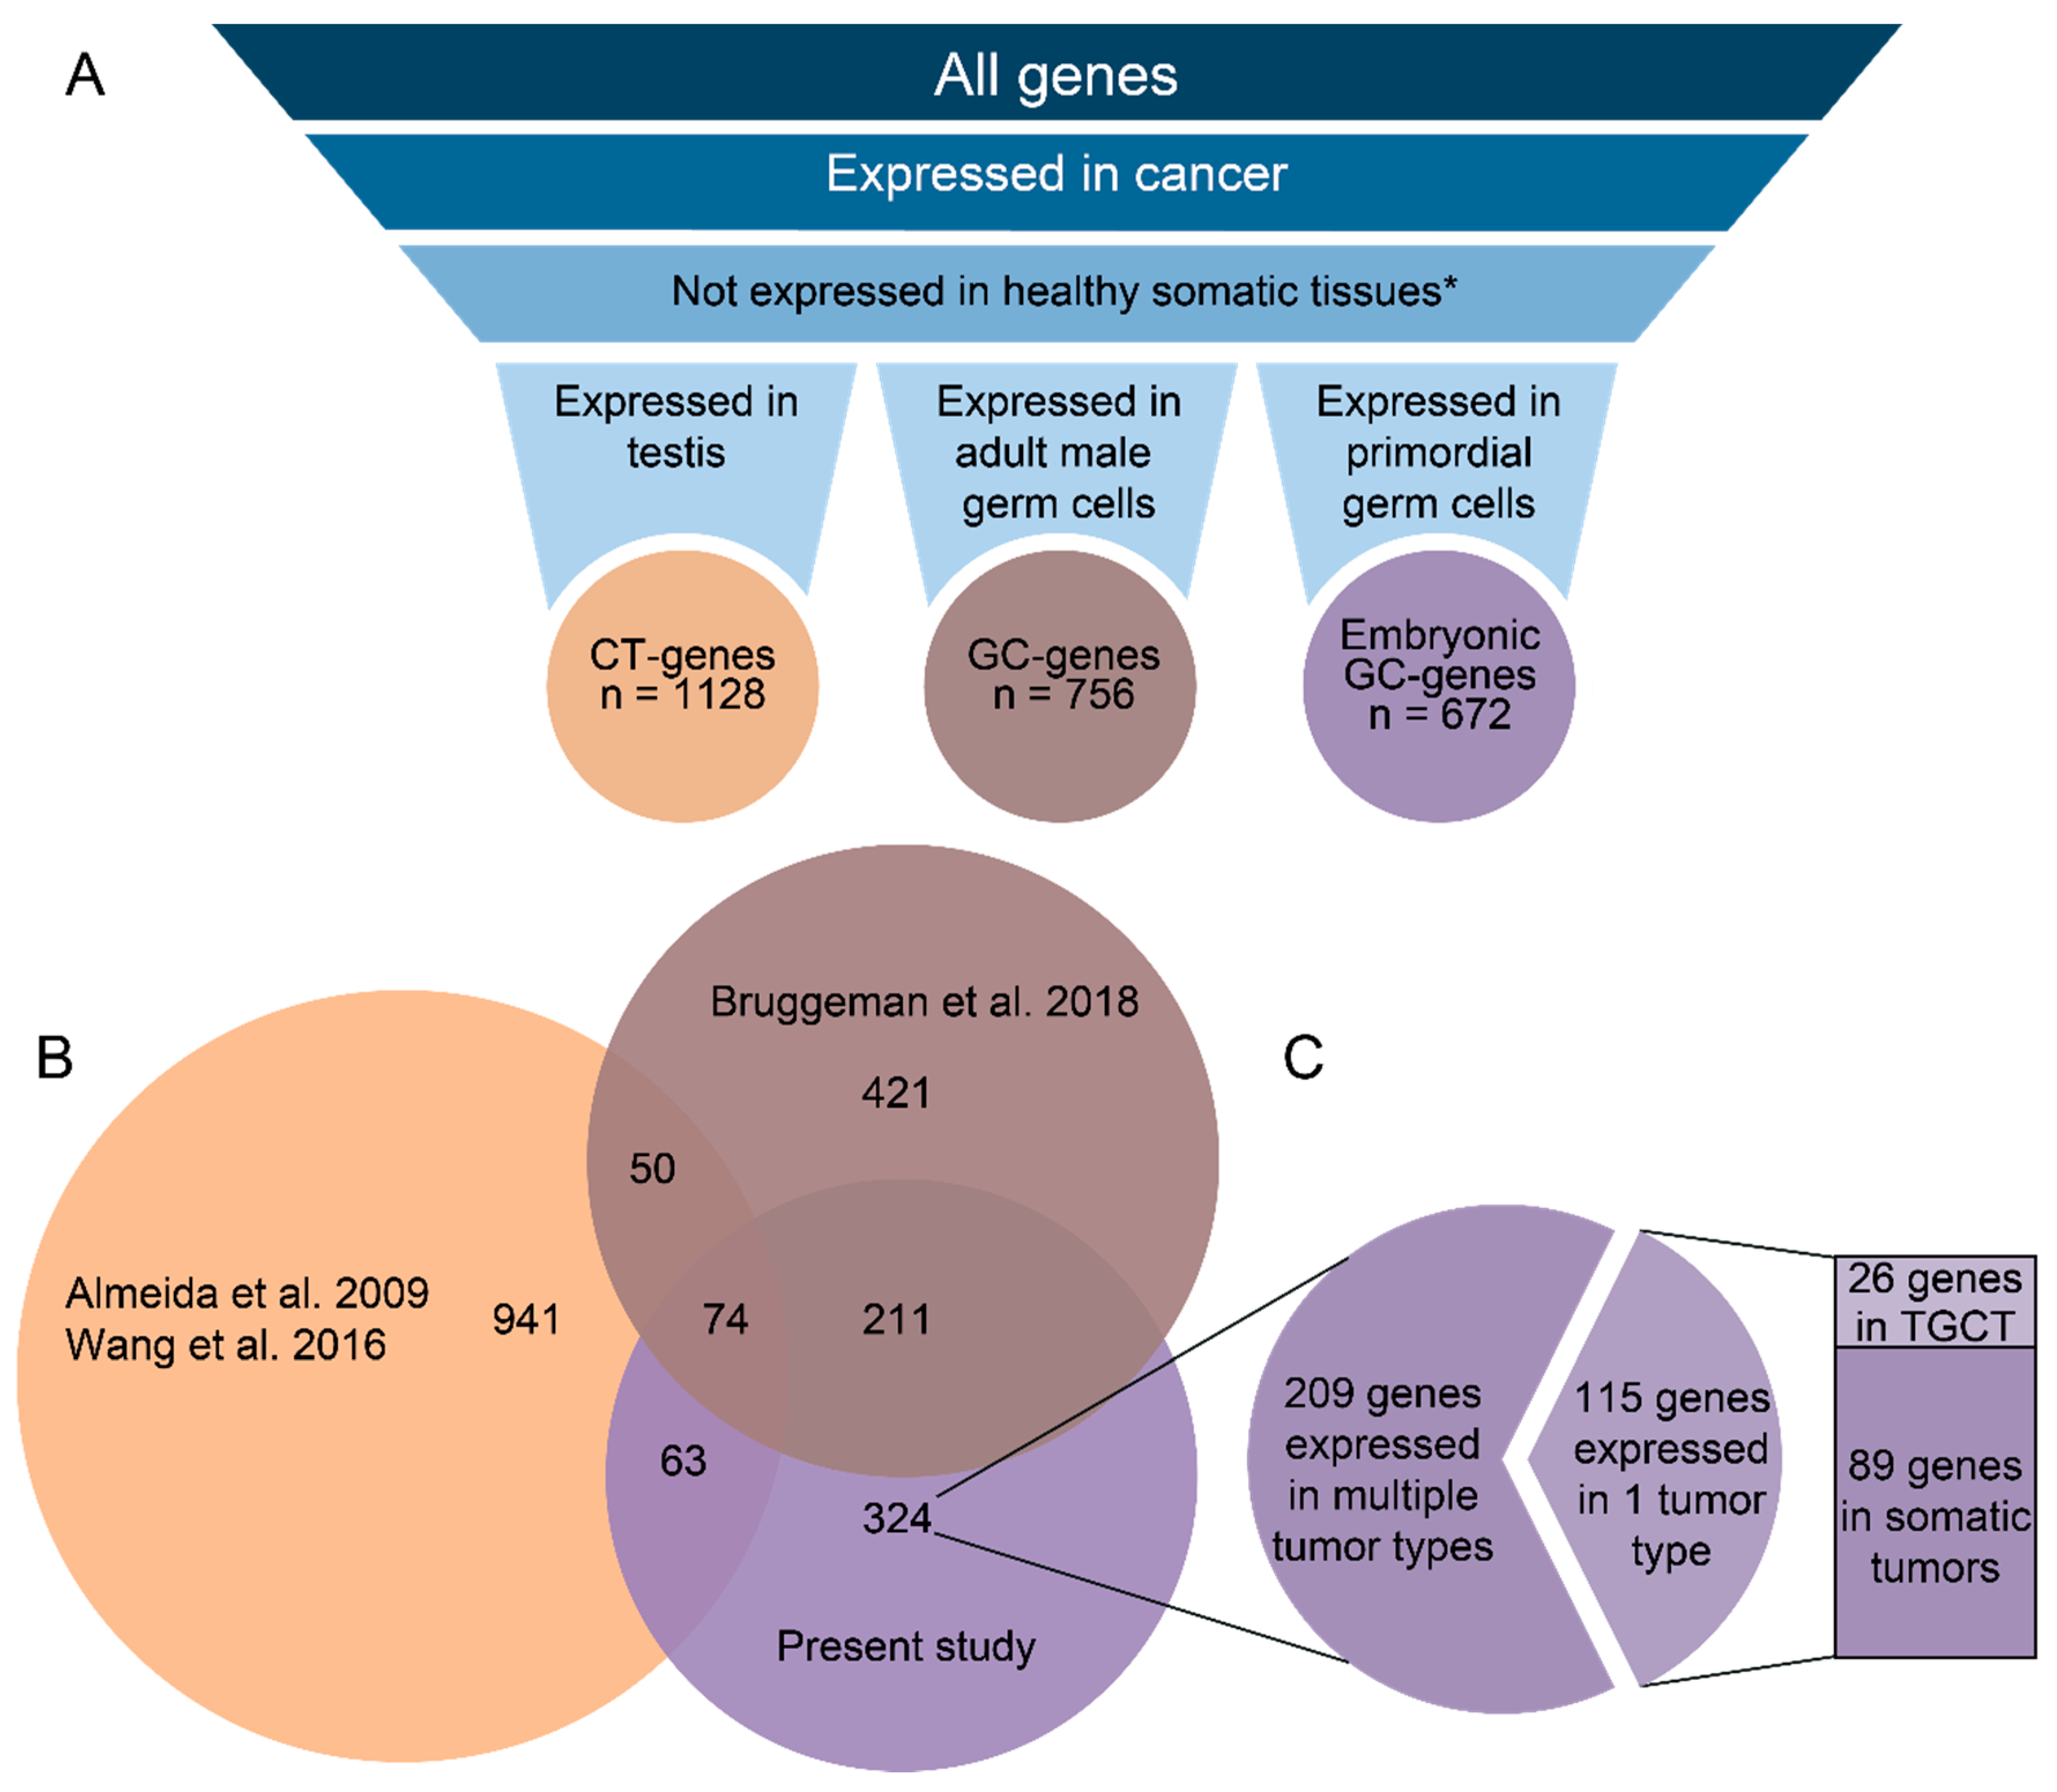
Abstract
Simple Summary
Abstract
1. Introduction
2. Results
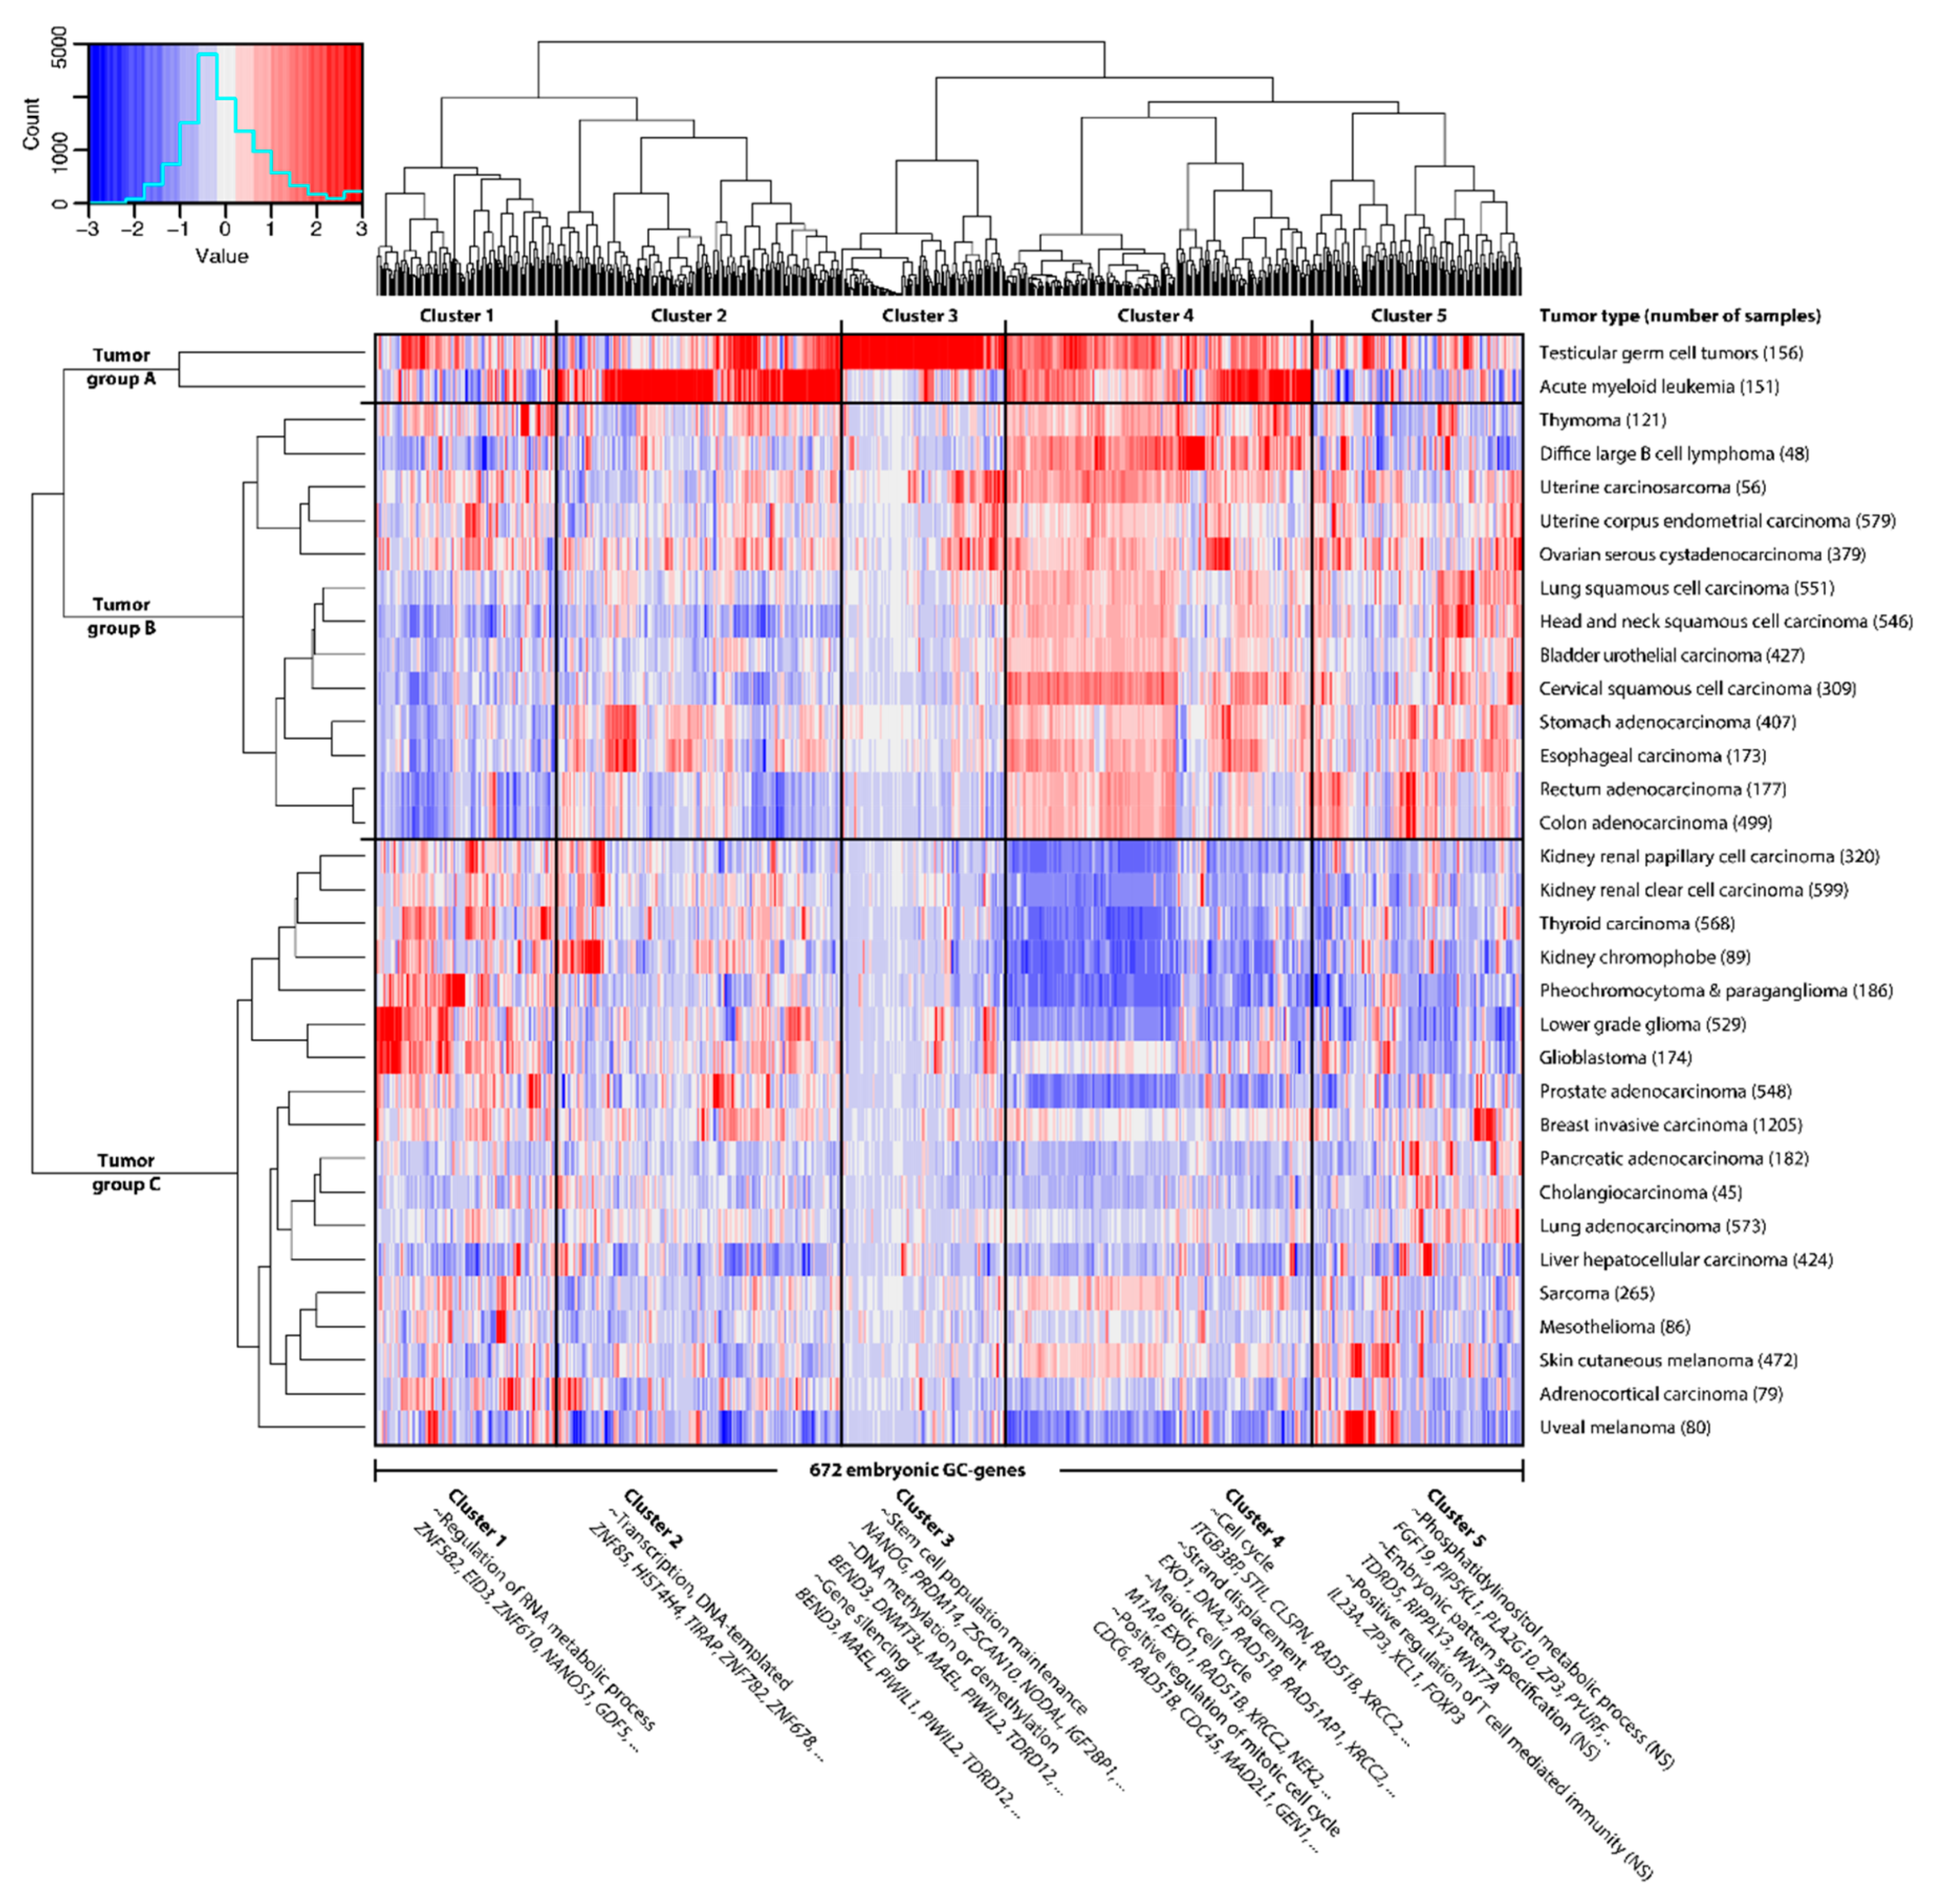
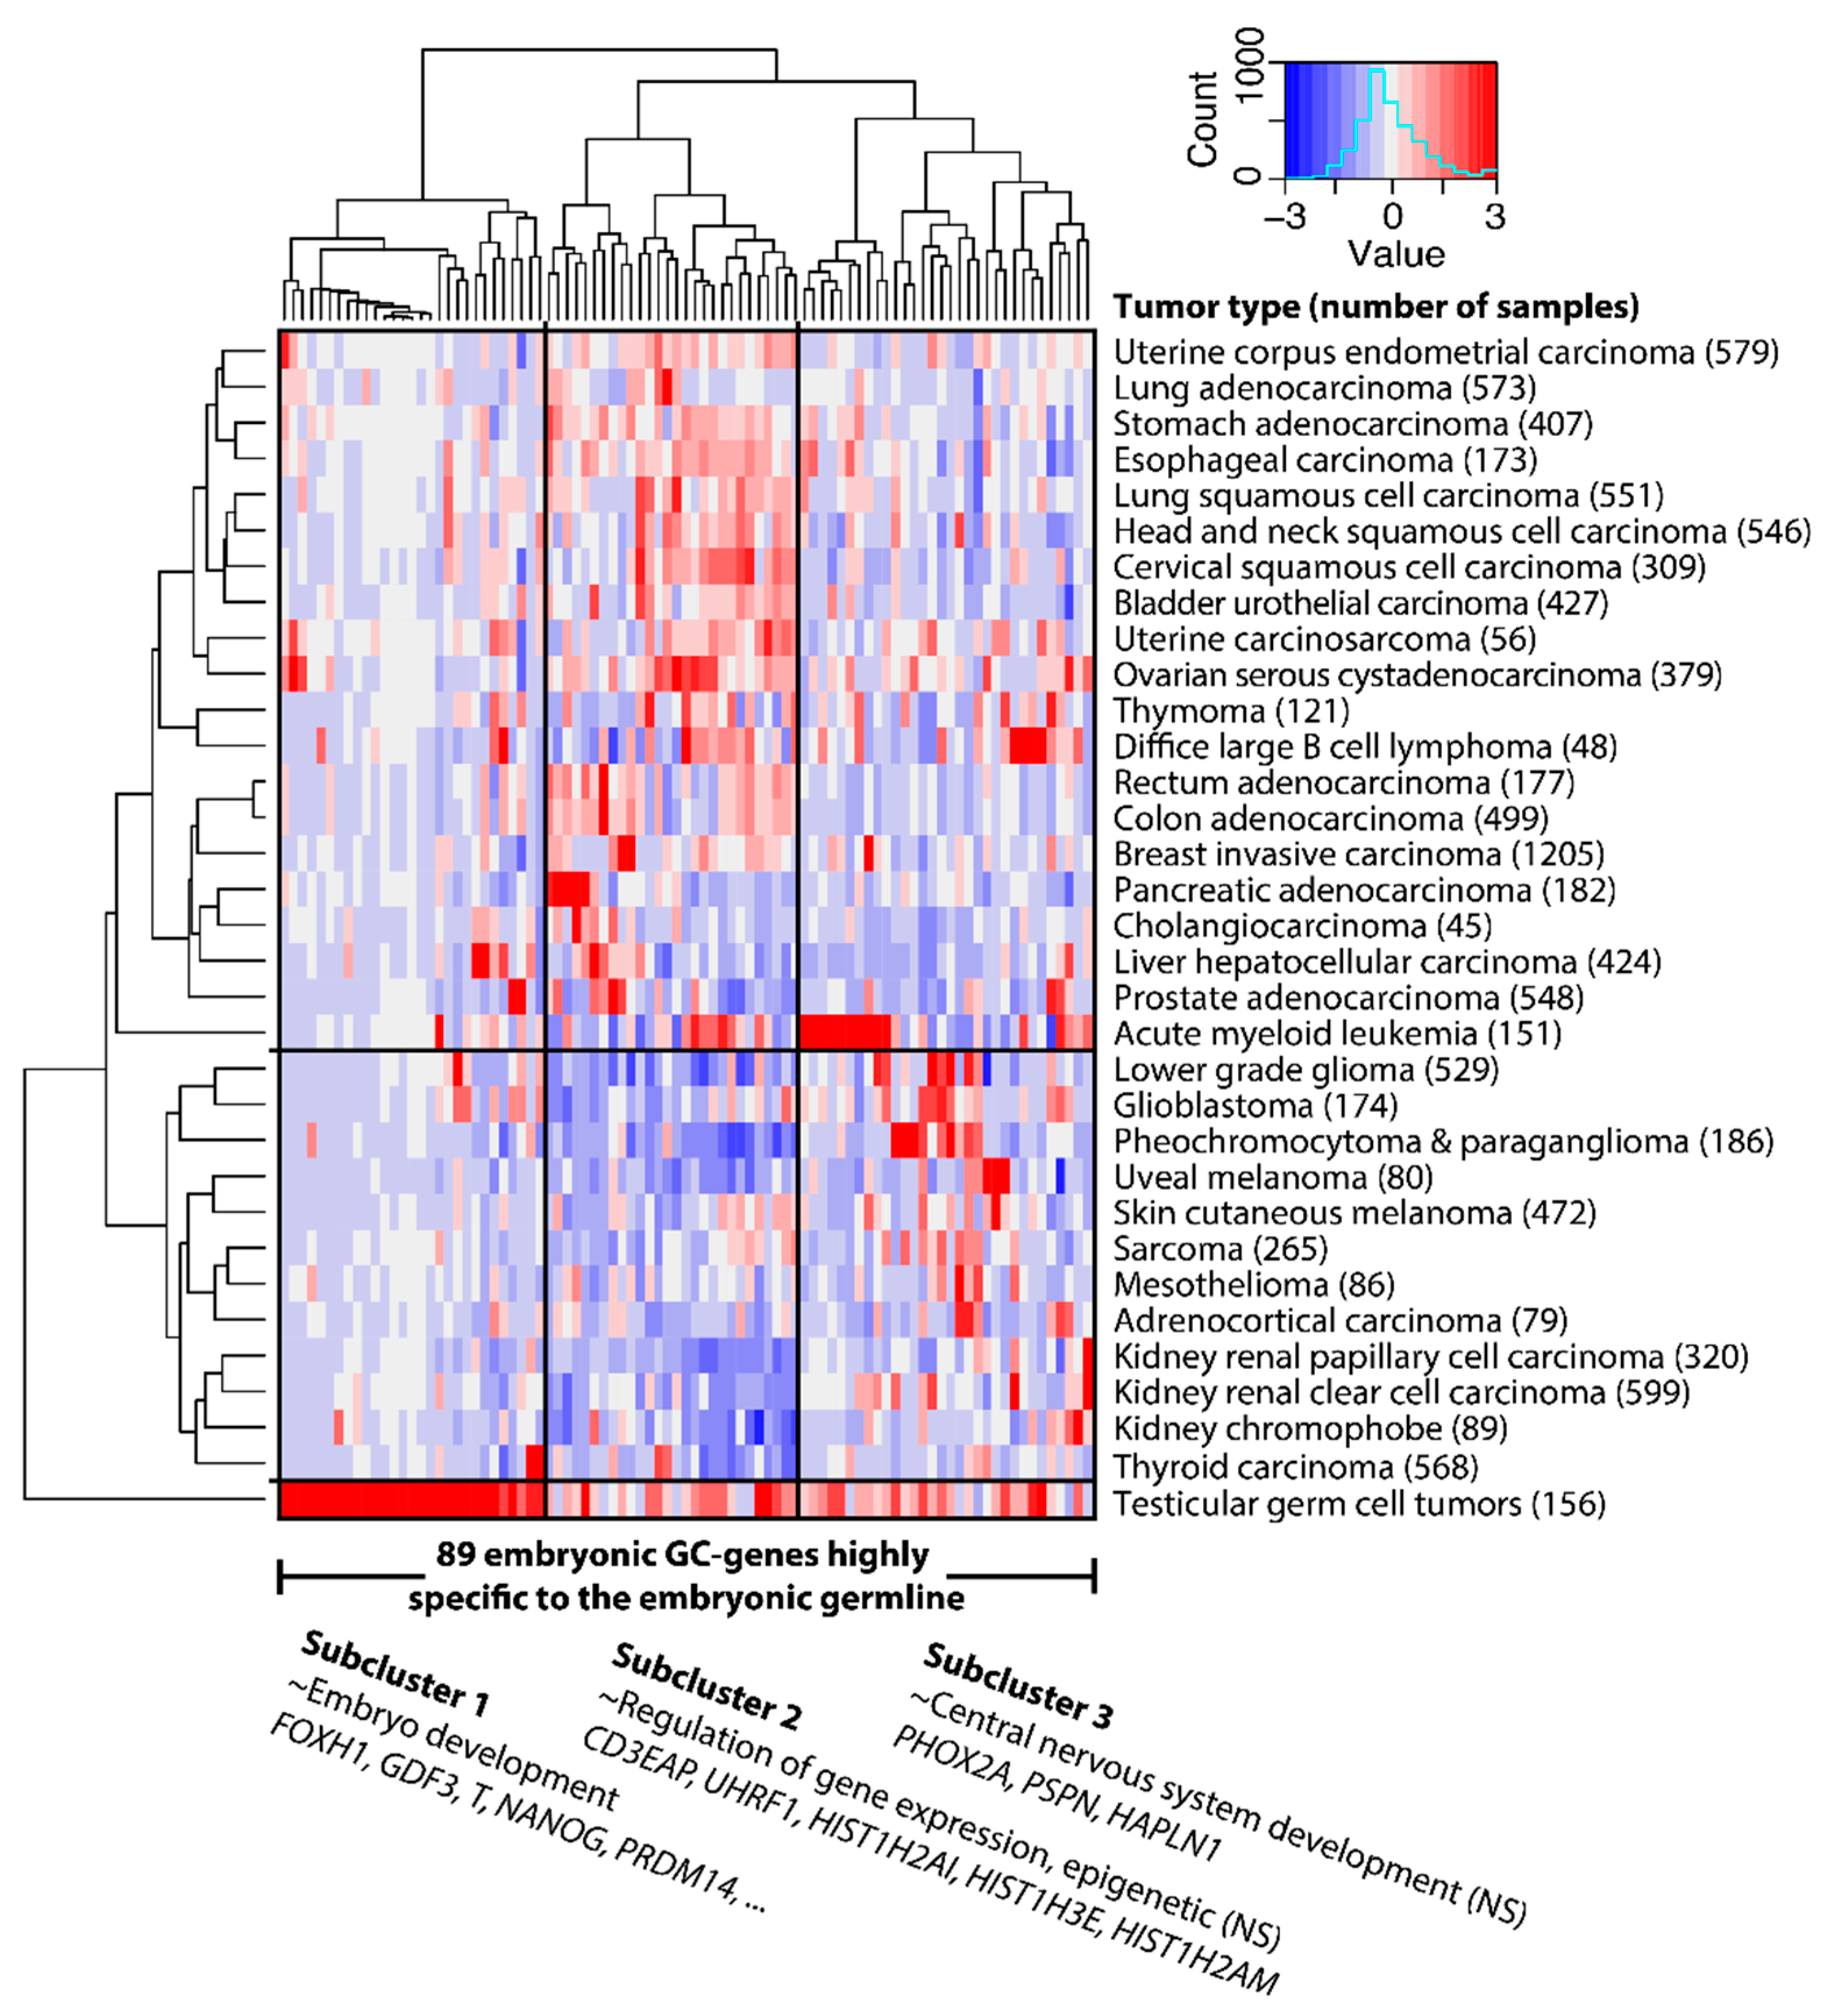
2.1. GC Genes Can be Classified into Groups Based on Similar Expression Profiles in Cancer
2.2. Embryonic GC Genes are Often Expressed in Multiple Tumor Types
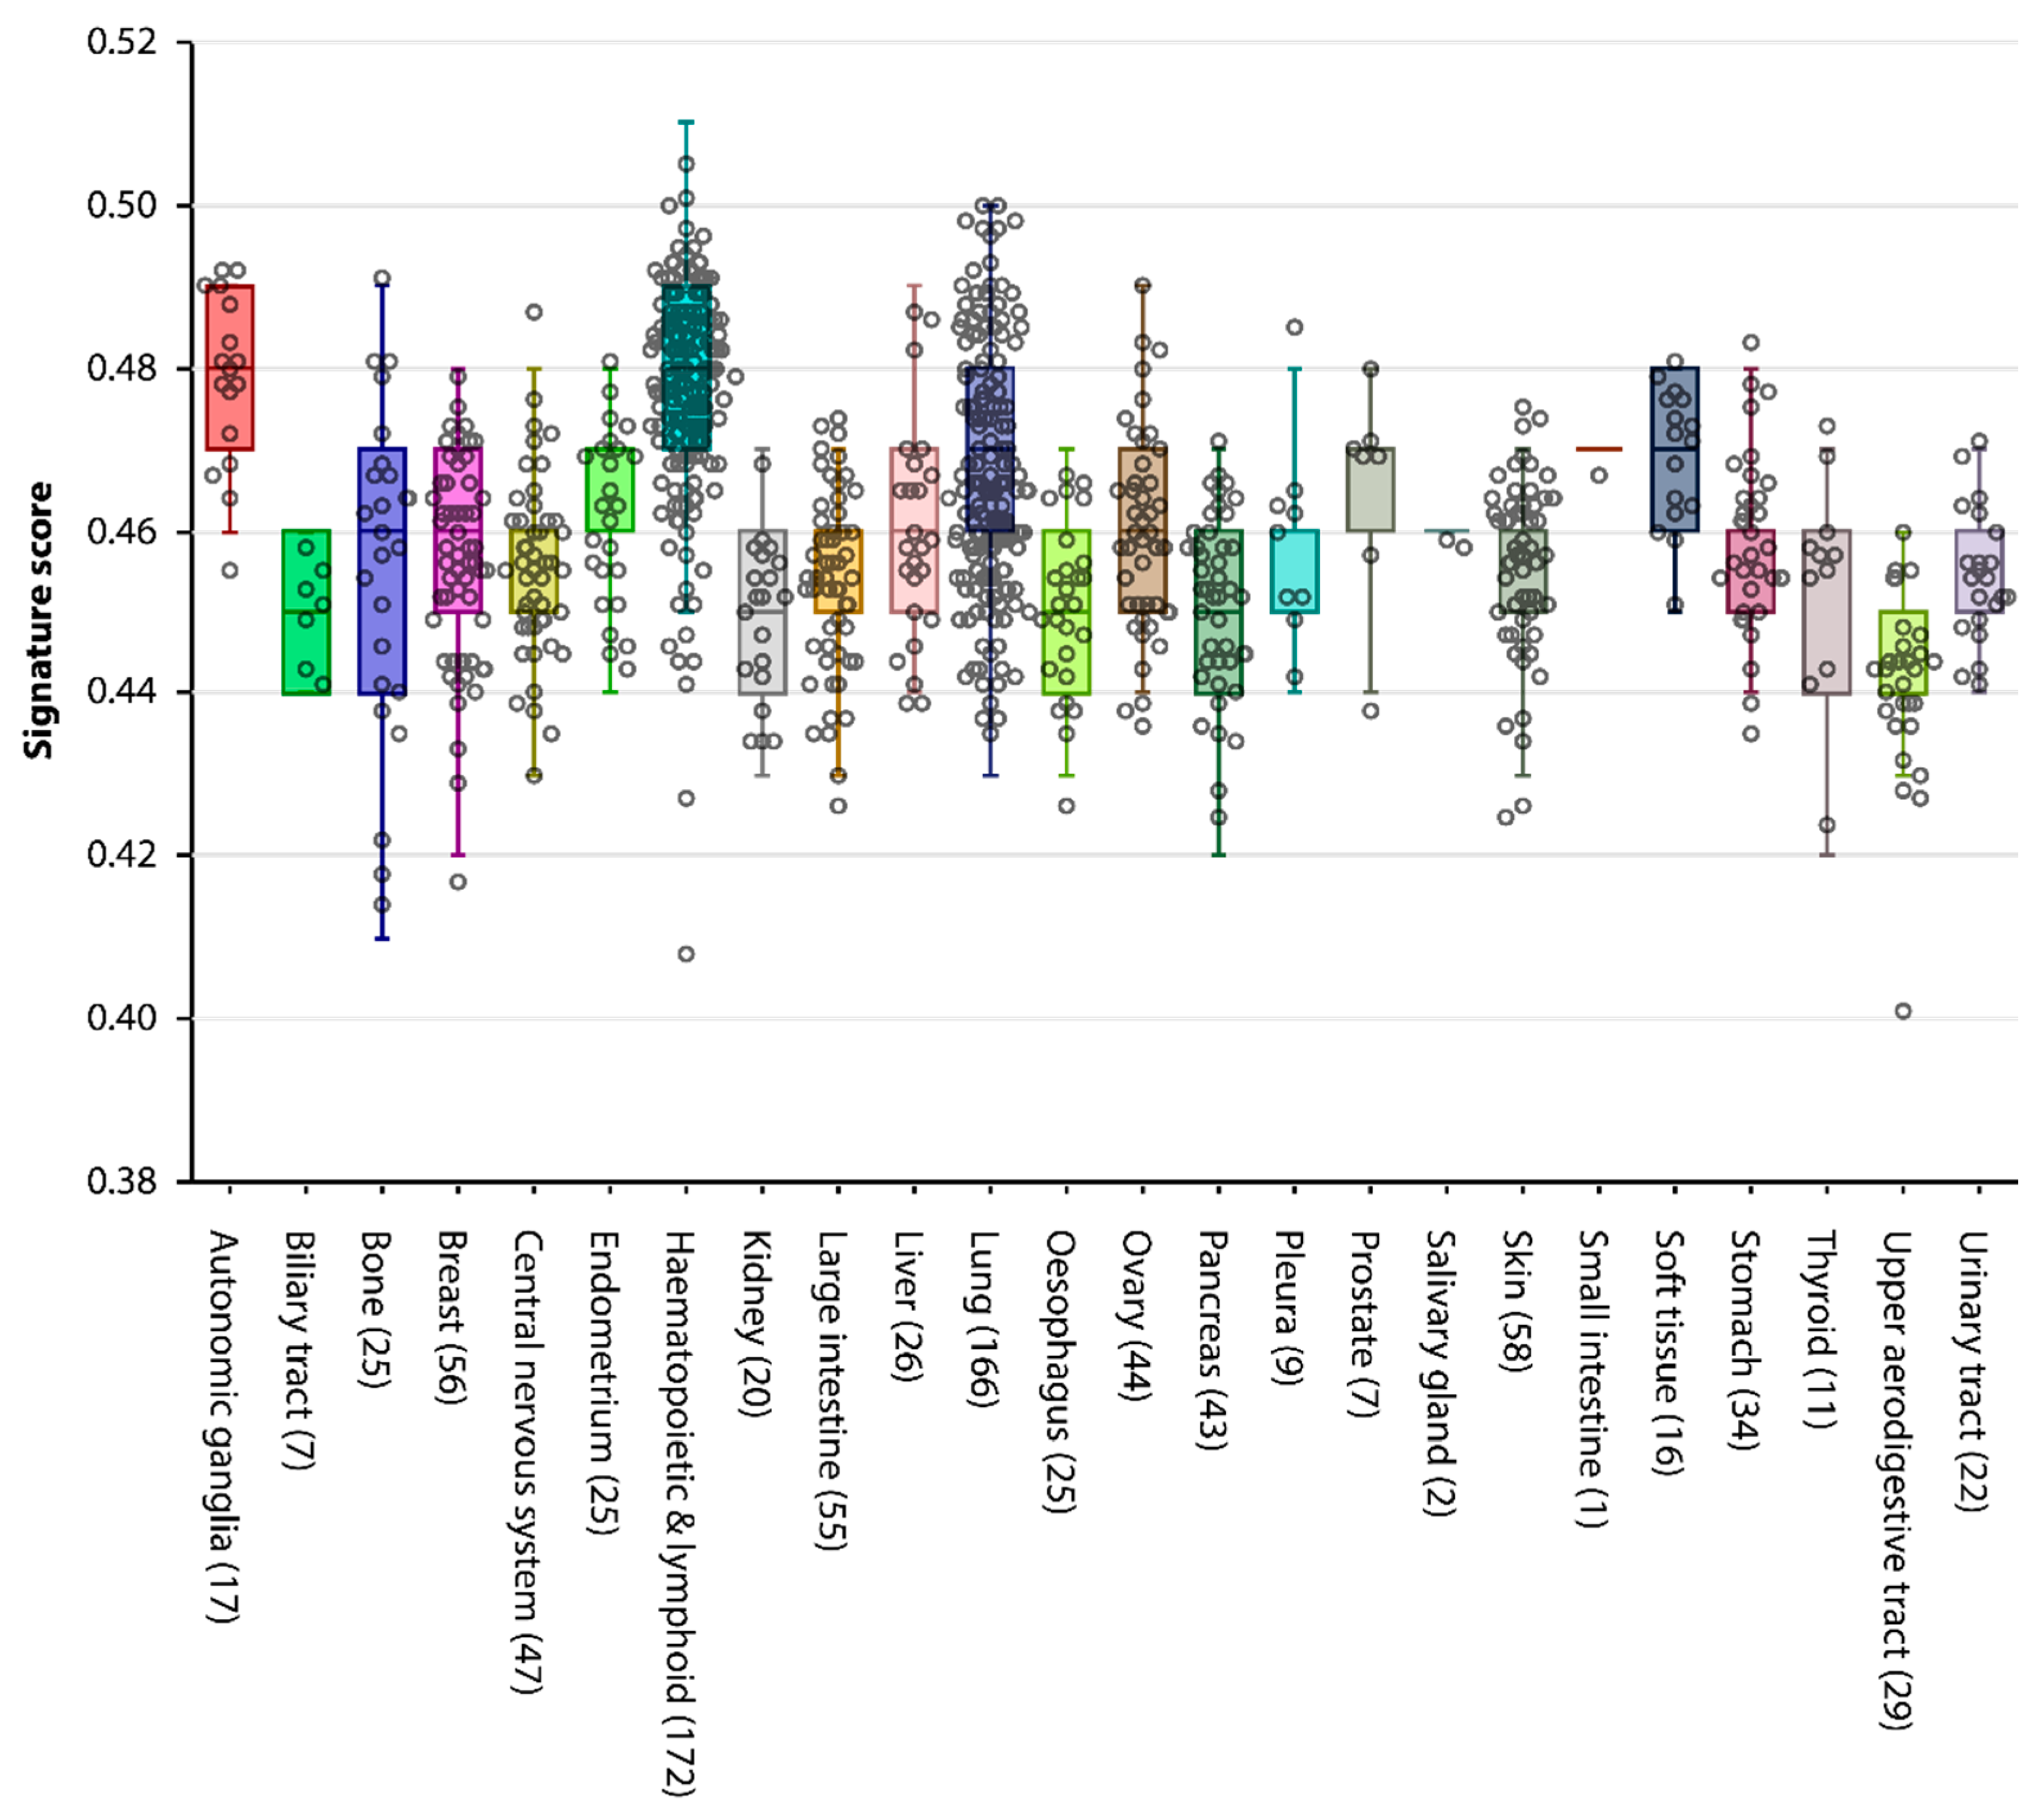
2.3. A GC Gene Signature Score to Rate Shared Properties between Cancer and the Germline
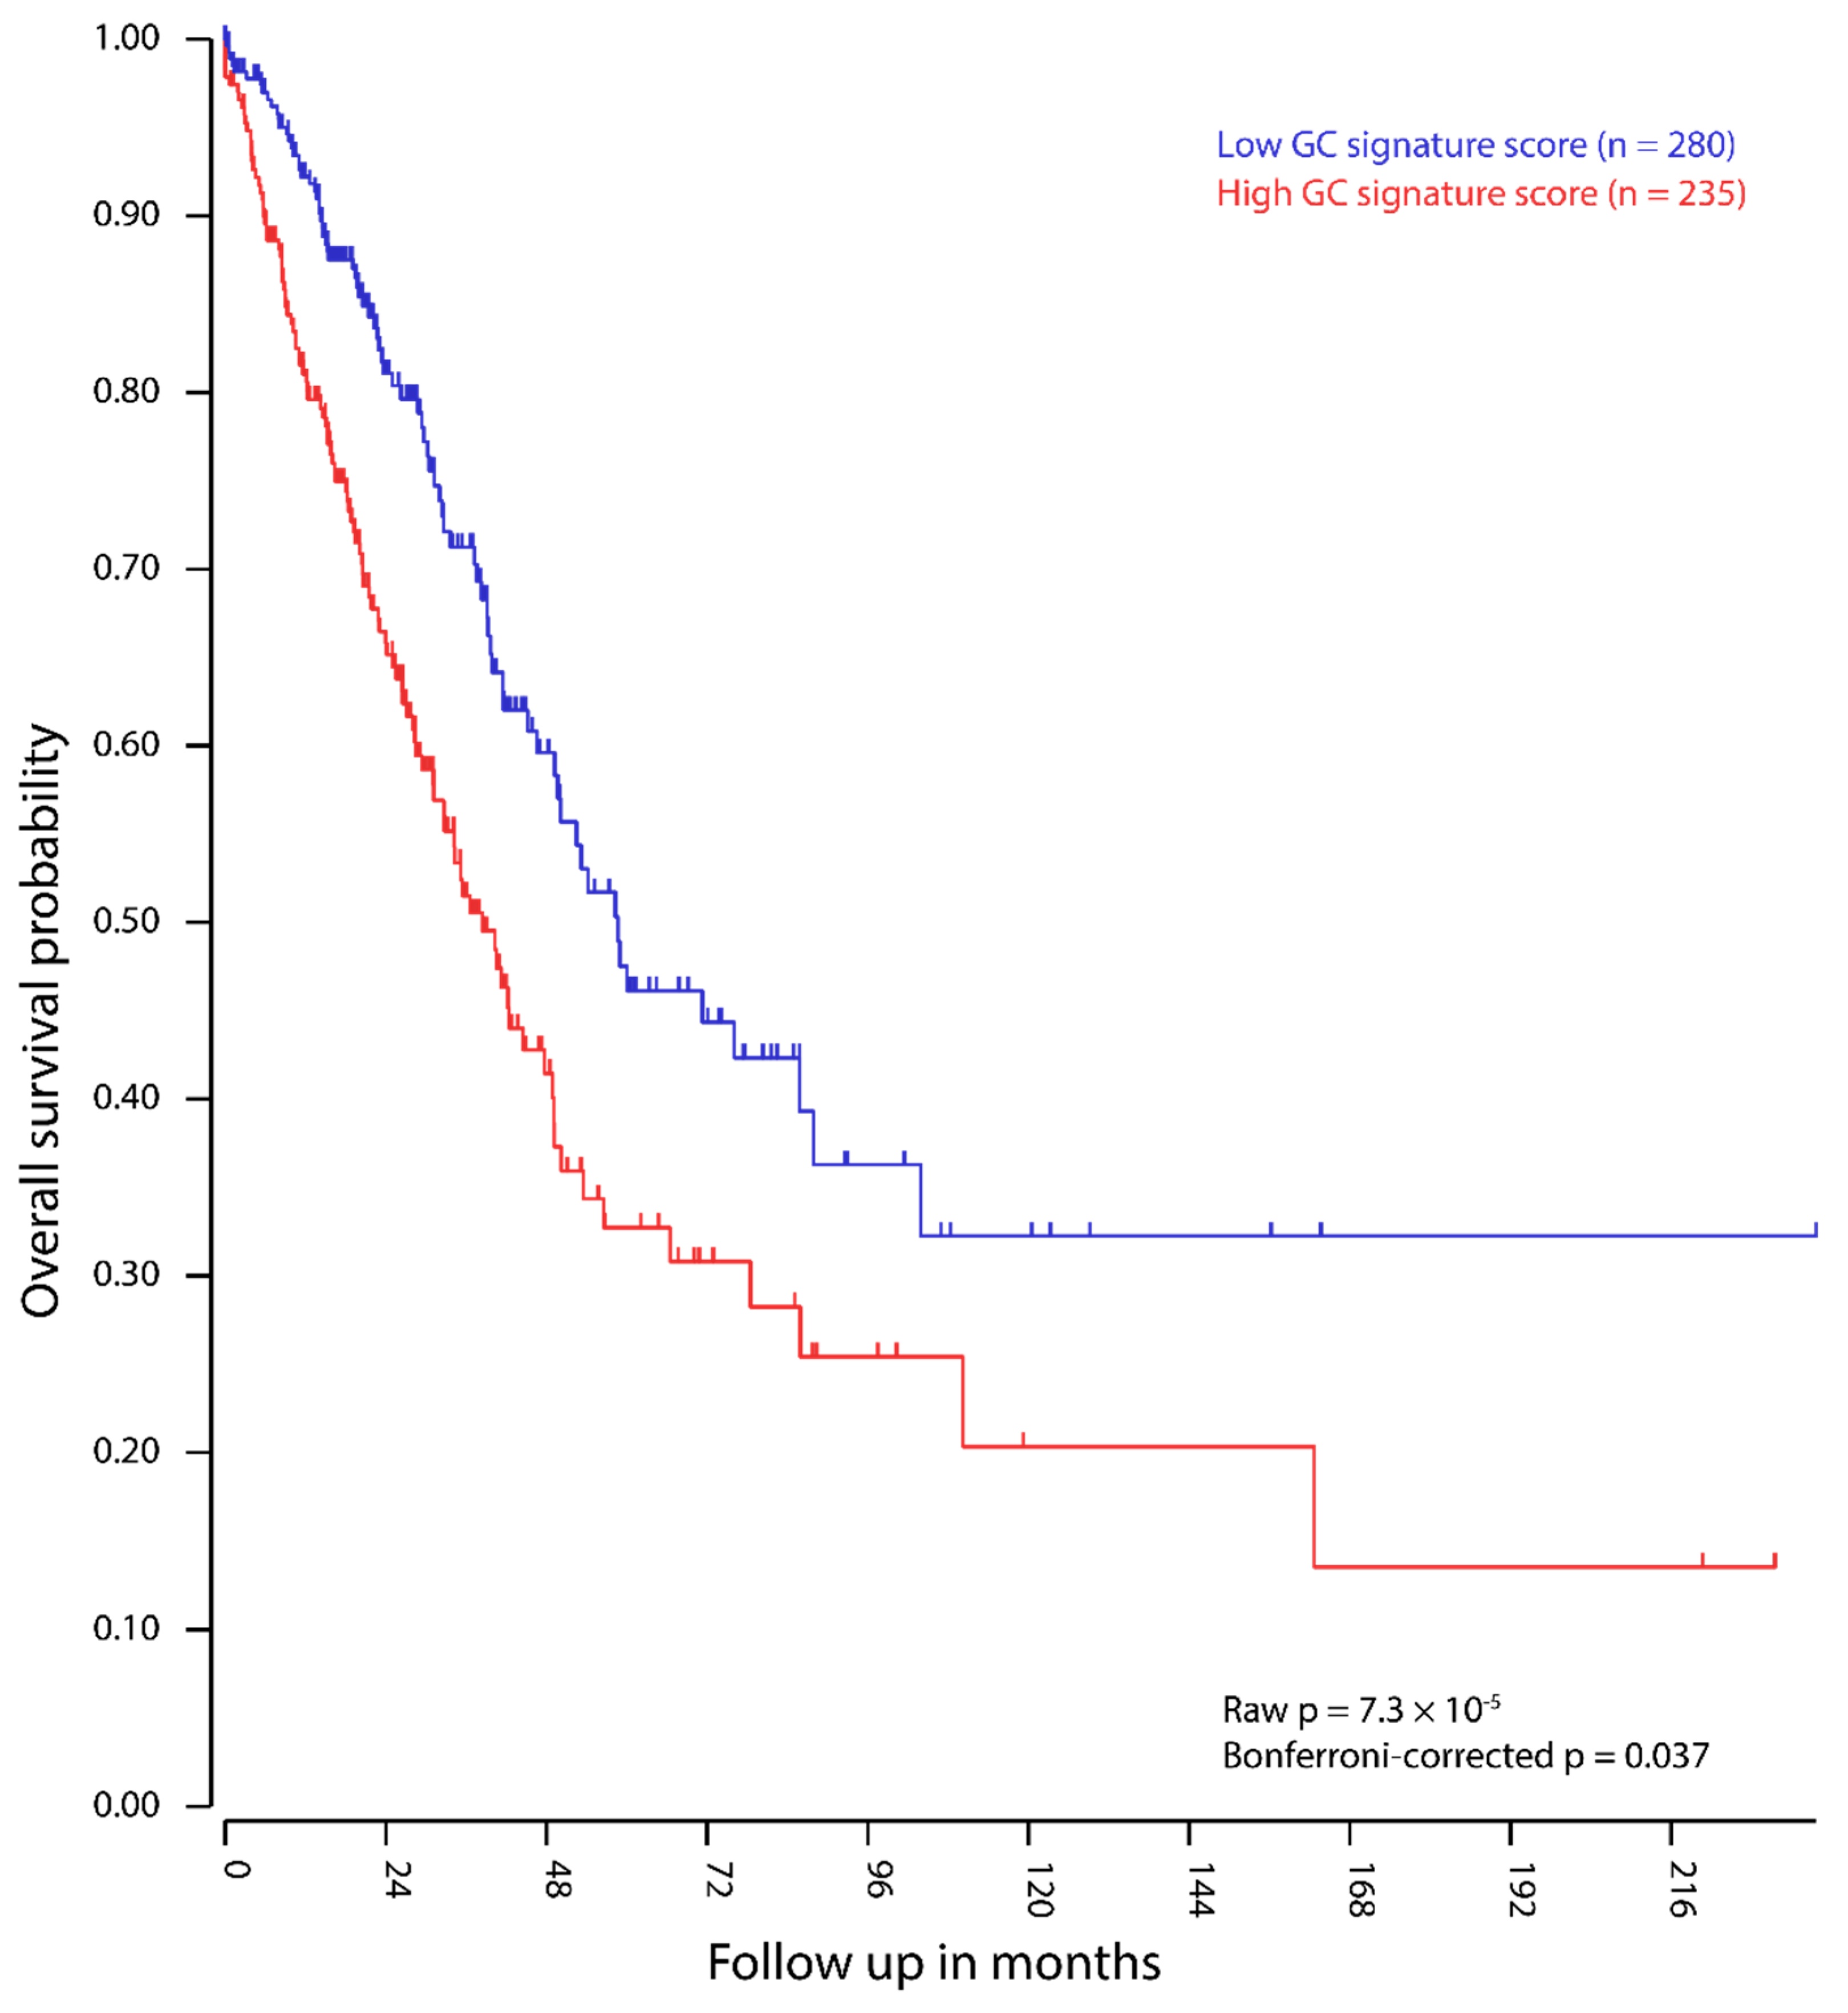
2.4. Expression of GC Genes is Linked to Increased Mortality in Lung Adenocarcinoma
2.5. Highly PGC-Specific Genes Promote Epigenetic Alterations
2.6. Cell Surface Molecules
2.7. Protein Expression
2.8. Combination of Subgroups
3. Discussion
4. Materials and Methods
4.1. Datasets
4.2. Selection of Genes
4.3. Data Analysis
5. Conclusions
Supplementary Materials
Author Contributions
Funding
Acknowledgments
Conflicts of Interest
References
- Hanahan, D.; Weinberg, R.A. The hallmarks of cancer. Cell 2000, 100, 57–70. [Google Scholar] [CrossRef]
- Hanahan, D.; Weinberg, R.A. Hallmarks of cancer: The next generation. Cell 2011, 144, 646–674. [Google Scholar] [CrossRef]
- Old, L.J. Cancer/testis (CT) antigens—A new link between gametogenesis and cancer. Cancer Immun. 2001, 1, 1. [Google Scholar]
- Simpson, A.J.G.; Caballero, O.L.; Jungbluth, A.; Chen, Y.T.; Old, L.J. Cancer/testis antigens, gametogenesis and cancer. Nat. Rev. Cancer 2005, 5, 615–625. [Google Scholar] [CrossRef]
- Almeida, L.G.; Sakabe, N.J.; de Oliveira, A.R.; Silva, M.C.C.; Mundstein, A.S.; Cohen, T.; Chen, Y.T.; Chua, R.; Gurung, S.; Gnjatic, S.; et al. CTdatabase: A knowledge-base of high-throughput and curated data on cancer-testis antigens. Nucleic Acids Res. 2009, 37, D816–D819. [Google Scholar] [CrossRef] [PubMed]
- Wang, C.; Gu, Y.; Zhang, K.; Xie, K.; Zhu, M.; Dai, N.; Jiang, Y.; Guo, X.; Liu, M.; Dai, J.; et al. Systematic identification of genes with a cancer-testis expression pattern in 19 cancer types. Nat. Commun. 2016, 7, 10499. [Google Scholar] [CrossRef] [PubMed]
- Bruggeman, J.W.; Koster, J.; Lodder, P.; Repping, S.; Hamer, G. Massive expression of germ cell-specific genes is a hallmark of cancer and a potential target for novel treatment development. Oncogene 2018, 37, 5694–5700. [Google Scholar] [CrossRef] [PubMed]
- Jan, S.Z.; Vormer, T.L.; Jongejan, A.; Röling, M.D.; Silber, S.J.; de Rooij, D.G.; Hamer, G.; Repping, S.; van Pelt, A.M.M. Unraveling transcriptome dynamics in human spermatogenesis. Development 2017, 144, 3659–3673. [Google Scholar] [CrossRef] [PubMed]
- Feichtinger, J.; Larcombe, L.; McFarlane, R.J. Meta-analysis of expression of l(3)mbt tumor-associated germline genes supports the model that a soma-to-germline transition is a hallmark of human cancers. Int. J. Cancer 2014, 134, 2359–2365. [Google Scholar] [CrossRef]
- McFarlane, R.J.; Wakeman, J.A. Meiosis-like functions in oncogenesis: A new view of cancer. Cancer Res. 2017, 77, 5712–5716. [Google Scholar] [CrossRef]
- Whitehurst, A.W. Cause and consequence of cancer/testis antigen activation in cancer. Annu. Rev. Pharmacol. Toxicol. 2014, 54, 251–272. [Google Scholar] [CrossRef] [PubMed]
- Erenpreisa, J.; Cragg, M.S. MOS, aneuploidy and the ploidy cycle of cancer cells. Oncogene 2010, 29, 5447–5451. [Google Scholar] [CrossRef] [PubMed]
- Pjanova, D.M.; Vainshelbaum, N.; Salmina, K.; Erenpreisa, J. The Role of the Meiotic Component in Reproduction of B-RAF-Mutated Melanoma: A Review and “Brainstorming” Session. In Melanoma; IntechOpen: London, UK, 2020. [Google Scholar]
- Vincent, M.D. Cancer: Beyond Speciation. In Advances in Cancer Research; Academic Press: Cambridge, MA, USA, 2011; Volume 112, pp. 283–350. [Google Scholar]
- Irie, N.; Weinberger, L.; Tang, W.W.C.; Kobayashi, T.; Viukov, S.; Manor, Y.S.; Dietmann, S.; Hanna, J.H.; Surani, M.A. SOX17 is a critical specifier of human primordial germ cell fate. Cell 2015, 160, 253–268. [Google Scholar] [CrossRef] [PubMed]
- Kobayashi, T.; Zhang, H.; Tang, W.W.C.; Irie, N.; Withey, S.; Klisch, D.; Sybirna, A.; Dietmann, S.; Contreras, D.A.; Webb, R.; et al. Principles of early human development and germ cell program from conserved model systems. Nature 2017, 546, 416–420. [Google Scholar] [CrossRef]
- Sasaki, K.; Yokobayashi, S.; Nakamura, T.; Okamoto, I.; Yabuta, Y.; Kurimoto, K.; Ohta, H.; Moritoki, Y.; Iwatani, C.; Tsuchiya, H.; et al. Robust In Vitro Induction of Human Germ Cell Fate from Pluripotent Stem Cells. Cell Stem Cell 2015, 17, 178–194. [Google Scholar] [CrossRef]
- Buehr, M. The primordial germ cells of mammals: Some current perspectives. Exp. Cell Res. 1997, 232, 194–207. [Google Scholar] [CrossRef]
- Surani, M.A. Human Germline: A New Research Frontier. Stem Cell Rep. 2015, 4, 955–960. [Google Scholar] [CrossRef]
- Motta, P.M.; Nottola, S.A.; Makabe, S.; Heyn, R. Mitochondrial morphology in human fetal and adult female germ cells. Hum. Reprod. 2000, 15, 129–147. [Google Scholar] [CrossRef]
- Molyneaux, K.; Wylie, C. Primordial germ cell migration. Int. J. Dev. Biol. 2004, 48, 537–544. [Google Scholar] [CrossRef]
- Hayashi, K.; Surani, M.A. Resetting the Epigenome beyond Pluripotency in the Germline. Cell Stem Cell 2009, 4, 493–498. [Google Scholar] [CrossRef][Green Version]
- Van Tongelen, A.; Loriot, A.; De Smet, C. Oncogenic roles of DNA hypomethylation through the activation of cancer-germline genes. Cancer Lett. 2017, 396, 130–137. [Google Scholar] [CrossRef] [PubMed]
- The Results Shown Here Are in Part Based Upon Data Generated by the TCGA Research Network. Available online: https://www.cancer.gov/tcga (accessed on 8 October 2018).
- Lonsdale, J.; Thomas, J.; Salvatore, M.; Phillips, R.; Lo, E.; Shad, S.; Hasz, R.; Walters, G.; Garcia, F.; Young, N.; et al. The Genotype-Tissue Expression (GTEx) project. Nat. Genet. 2013, 45, 580–585. [Google Scholar] [CrossRef] [PubMed]
- Koster, J.; Molenaar, J.J.; Versteeg, R. Abstract A2-45: R2: Accessible web-based genomics analysis and visualization platform for biomedical researchers. Cancer Res. 2015, 75, A2-45. [Google Scholar] [CrossRef]
- Barretina, J.; Caponigro, G.; Stransky, N.; Venkatesan, K.; Margolin, A.A.; Kim, S.; Wilson, C.J.; Lehár, J.; Kryukov, G.V.; Sonkin, D.; et al. The Cancer Cell Line Encyclopedia enables predictive modelling of anticancer drug sensitivity. Nature 2012, 483, 603–607. [Google Scholar] [CrossRef]
- Uhlén, M.; Fagerberg, L.; Hallström, B.M.; Lindskog, C.; Oksvold, P.; Mardinoglu, A.; Sivertsson, Å.; Kampf, C.; Sjöstedt, E.; Asplund, A.; et al. Proteomics. Tissue-based map of the human proteome. Science 2015, 347, 1260419. [Google Scholar] [CrossRef] [PubMed]
- Gillette, M.A.; Satpathy, S.; Cao, S.; Dhanasekaran, S.M.; Vasaikar, S.V.; Krug, K.; Petralia, F.; Li, Y.; Liang, W.-W.; Reva, B.; et al. Proteogenomic Characterization Reveals Therapeutic Vulnerabilities in Lung Adenocarcinoma. Cell 2020, 182, 200–225.e35. [Google Scholar] [CrossRef] [PubMed]
- Vasaikar, S.; Huang, C.; Wang, X.; Petyuk, V.A.; Savage, S.R.; Wen, B.; Dou, Y.; Zhang, Y.; Shi, Z.; Arshad, O.A.; et al. Proteogenomic Analysis of Human Colon Cancer Reveals New Therapeutic Opportunities. Cell 2019, 177, 1035–1049.e19. [Google Scholar] [CrossRef]
- Dou, Y.; Kawaler, E.A.; Cui Zhou, D.; Gritsenko, M.A.; Huang, C.; Blumenberg, L.; Karpova, A.; Petyuk, V.A.; Savage, S.R.; Satpathy, S.; et al. Proteogenomic Characterization of Endometrial Carcinoma. Cell 2020, 180, 729–748. [Google Scholar] [CrossRef]
- Hofmann, O.; Caballero, O.L.; Stevenson, B.J.; Chen, Y.T.; Cohen, T.; Chua, R.; Maher, C.A.; Panji, S.; Schaefer, U.; Kruger, A.; et al. Genome-wide analysis of cancer/testis gene expression. Proc. Natl. Acad. Sci. USA 2008, 105, 20422–20427. [Google Scholar] [CrossRef]
- da Silva, V.L.; Fonseca, A.F.; Fonseca, M.; da Silva, T.E.; Coelho, A.C.; Kroll, J.E.; de Souza, J.E.S.; Stransky, B.; de Souza, G.A.; de Souza, S.J. Genome-wide identification of cancer/testis genes and their association with prognosis in a pan-cancer analysis. Oncotarget 2017, 8, 92966–92977. [Google Scholar] [CrossRef]
- Da Cunha, J.P.C.; Galante, P.A.F.; De Souza, J.E.; De Souza, R.F.; Carvalho, P.M.; Ohara, D.T.; Moura, R.P.; Oba-Shinja, S.M.; Marie, S.K.N.; Silva, W.A.; et al. Bioinformatics construction of the human cell surfaceome. Proc. Natl. Acad. Sci. USA 2009, 106, 16752–16757. [Google Scholar] [CrossRef] [PubMed]
- Gjerstorff, M.F.; Andersen, M.H.; Ditzel, H.J. Oncogenic cancer/testis antigens: Prime candidates for immunotherapy. Oncotarget 2015, 6, 15772–15787. [Google Scholar] [CrossRef] [PubMed]
- Chen, Y.T.; Scanlan, M.J.; Venditti, C.A.; Chua, R.; Theiler, G.; Stevenson, B.J.; Iseli, C.; Gure, A.O.; Vasicek, T.; Strausberg, R.L.; et al. Identification of cancer/testis-antigen genes by massively parallel signature sequencing. Proc. Natl. Acad. Sci. USA 2005, 102, 7940–7945. [Google Scholar] [CrossRef] [PubMed]
- Nielsen, A.; Gjerstorff, M. Ectopic Expression of Testis Germ Cell Proteins in Cancer and Its Potential Role in Genomic Instability. Int. J. Mol. Sci. 2016, 17, 890. [Google Scholar] [CrossRef] [PubMed]
- Jin, S.; Cao, S.; Li, J.; Meng, Q.; Wang, C.; Yao, L.; Lang, Y.; Cao, J.; Shen, J.; Pan, B.; et al. Cancer/testis antigens (CTAs) expression in resected lung cancer. Oncotarget Targets Ther. 2018, 11, 4491–4499. [Google Scholar] [CrossRef]
- Nichols, B.A.; Oswald, N.W.; McMillan, E.A.; McGlynn, K.; Yan, J.; Kim, M.S.; Saha, J.; Mallipeddi, P.L.; LaDuke, S.A.; Villalobos, P.A.; et al. HORMAD1 Is a Negative Prognostic Indicator in Lung Adenocarcinoma and Specifies Resistance to Oxidative and Genotoxic Stress. Cancer Res. 2018, 78, 6196–6208. [Google Scholar] [CrossRef]
- Gao, Y.; Kardos, J.; Yang, Y.; Tamir, T.Y.; Mutter-Rottmayer, E.; Weissman, B.; Major, M.B.; Kim, W.Y.; Vaziri, C. The Cancer/Testes (CT) Antigen HORMAD1 promotes Homologous Recombinational DNA Repair and Radioresistance in Lung adenocarcinoma cells. Sci. Rep. 2018, 8, 15304. [Google Scholar] [CrossRef]
- Mecklenburg, I.; Sienel, W.; Schmid, S.; Passlick, B.; Kufer, P. A Threshold of Systemic MAGE-A Gene Expression Predicting Survival in Resected Non–Small Cell Lung Cancer. Clin. Cancer Res. 2017, 23, 1213–1219. [Google Scholar] [CrossRef]
- Cheng, C.C.; Wooten, J.; Gibbs, Z.; McGlynn, K.; Mishra, P.; Whitehurst, A.W. Sperm-specific cox6b2 enhances oxidative phosphorylation, proliferation, and survival in human lung adenocarcinoma. Elife 2020, 9, e58108. [Google Scholar] [CrossRef]
- Nie, K.; Li, J.; He, X.; Wang, Y.; Zhao, Q.; Du, M.; Sun, H.; Wang, J.; Lyu, J.; Fang, H.; et al. COX6B2 drives metabolic reprogramming toward oxidative phosphorylation to promote metastasis in pancreatic ductal cancer cells. Oncogenesis 2020, 9, 1–13. [Google Scholar] [CrossRef]
- Ehrlich, M. DNA hypomethylation in cancer cells. Epigenomics 2009, 1, 239–259. [Google Scholar] [CrossRef] [PubMed]
- Hartshorne, G.M.; Lyrakou, S.; Hamoda, H.; Oloto, E.; Ghafari, F. Oogenesis and cell death in human prenatal ovaries: What are the criteria for oocyte selection? Mol. Hum. Reprod. 2009, 15, 805–819. [Google Scholar] [CrossRef] [PubMed]
- Vogel, C.; Marcotte, E.M. Insights into the regulation of protein abundance from proteomic and transcriptomic analyses. Nat. Rev. Genet. 2012, 13, 227–232. [Google Scholar] [CrossRef] [PubMed]
- O’Carroll, D.; Scherthan, H.; Peters, A.H.F.M.; Opravil, S.; Haynes, A.R.; Laible, G.; Rea, S.; Schmid, M.; Lebersorger, A.; Jerratsch, M.; et al. Isolation and Characterization ofSuv39h2, a Second Histone H3 Methyltransferase Gene That Displays Testis-Specific Expression. Mol. Cell. Biol. 2000, 20, 9423–9433. [Google Scholar] [CrossRef] [PubMed]
- García-Cao, M.; O’Sullivan, R.; Peters, A.H.F.M.; Jenuwein, T.; Blasco, M.A. Epigenetic regulation of telomere length in mammalian cells by the Suv39h1 and Suv39h2 histone methyltransferases. Nat. Genet. 2004, 36, 94–99. [Google Scholar] [CrossRef]
- Ait-Si-Ali, S.; Guasconi, V.; Fritsch, L.; Yahi, H.; Sekhri, R.; Naguibneva, I.; Robin, P.; Cabon, F.; Polesskaya, A.; Harel-Bellan, A. A Suv39h-dependent mechanism for silencing S-phase genes in differentiating but not in cycling cells. EMBO J. 2004, 23, 605–615. [Google Scholar] [CrossRef]
- Kuijk, E.W.; de Gier, J.; Chuva de Sousa Lopes, S.M.; Chambers, I.; van Pelt, A.M.M.; Colenbrander, B.; Roelen, B.A.J. A distinct expression pattern in mammalian testes indicates a conserved role for NANOG in spermatogenesis. PLoS ONE 2010, 5, e10987. [Google Scholar] [CrossRef]
- Leitch, H.G.; Tang, W.W.C.; Surani, M.A. Primordial Germ-Cell Development and Epigenetic Reprogramming in Mammals. In Current Topics in Developmental Biology; Academic Press: Cambridge, MA, USA, 2013; Volume 104, pp. 149–187. [Google Scholar]
- Hamer, G.; De Rooij, D.G. Mutations causing specific arrests in the development of mouse primordial germ cells and gonocytes. Biol. Reprod. 2018, 99, 75–86. [Google Scholar] [CrossRef]
- Gkountela, S.; Li, Z.; Vincent, J.J.; Zhang, K.X.; Chen, A.; Pellegrini, M.; Clark, A.T. The ontogeny of cKIT+ human primordial germ cells proves to be a resource for human germ line reprogramming, imprint erasure and in vitro differentiation. Nat. Cell Biol. 2013, 15, 113–122. [Google Scholar] [CrossRef]
- Huang, D.W.; Sherman, B.T.; Tan, Q.; Kir, J.; Liu, D.; Bryant, D.; Guo, Y.; Stephens, R.; Baseler, M.W.; Lane, H.C.; et al. DAVID Bioinformatics Resources: Expanded annotation database and novel algorithms to better extract biology from large gene lists. Nucleic Acids Res. 2007, 35, W169–W175. [Google Scholar] [CrossRef]
- Subramanian, A.; Tamayo, P.; Mootha, V.K.; Mukherjee, S.; Ebert, B.L.; Gillette, M.A.; Paulovich, A.; Pomeroy, S.L.; Golub, T.R.; Lander, E.S.; et al. Gene set enrichment analysis: A knowledge-based approach for interpreting genome-wide expression profiles. Proc. Natl. Acad. Sci. USA 2005, 102, 15545–15550. [Google Scholar] [CrossRef] [PubMed]
- Ashburner, M.; Ball, C.A.; Blake, J.A.; Botstein, D.; Butler, H.; Cherry, J.M.; Davis, A.P.; Dolinski, K.; Dwight, S.S.; Eppig, J.T.; et al. Gene ontology: Tool for the unification of biology. Nat. Genet. 2000, 25, 25–29. [Google Scholar] [CrossRef] [PubMed]
- Vasaikar, S.V.; Straub, P.; Wang, J.; Zhang, B. LinkedOmics: Analyzing multi-omics data within and across 32 cancer types. Nucleic Acids Res. 2018, 46, D956–D963. [Google Scholar] [CrossRef] [PubMed]


Publisher’s Note: MDPI stays neutral with regard to jurisdictional claims in published maps and institutional affiliations. |
© 2020 by the authors. Licensee MDPI, Basel, Switzerland. This article is an open access article distributed under the terms and conditions of the Creative Commons Attribution (CC BY) license (http://creativecommons.org/licenses/by/4.0/).
Share and Cite
Bruggeman, J.W.; Irie, N.; Lodder, P.; van Pelt, A.M.M.; Koster, J.; Hamer, G. Tumors Widely Express Hundreds of Embryonic Germline Genes. Cancers 2020, 12, 3812. https://doi.org/10.3390/cancers12123812
Bruggeman JW, Irie N, Lodder P, van Pelt AMM, Koster J, Hamer G. Tumors Widely Express Hundreds of Embryonic Germline Genes. Cancers. 2020; 12(12):3812. https://doi.org/10.3390/cancers12123812
Chicago/Turabian StyleBruggeman, Jan Willem, Naoko Irie, Paul Lodder, Ans M. M. van Pelt, Jan Koster, and Geert Hamer. 2020. "Tumors Widely Express Hundreds of Embryonic Germline Genes" Cancers 12, no. 12: 3812. https://doi.org/10.3390/cancers12123812
APA StyleBruggeman, J. W., Irie, N., Lodder, P., van Pelt, A. M. M., Koster, J., & Hamer, G. (2020). Tumors Widely Express Hundreds of Embryonic Germline Genes. Cancers, 12(12), 3812. https://doi.org/10.3390/cancers12123812