ZIP4 Is a Novel Cancer Stem Cell Marker in High-Grade Serous Ovarian Cancer


Abstract
Simple Summary
Abstract
1. Introduction
2. Results
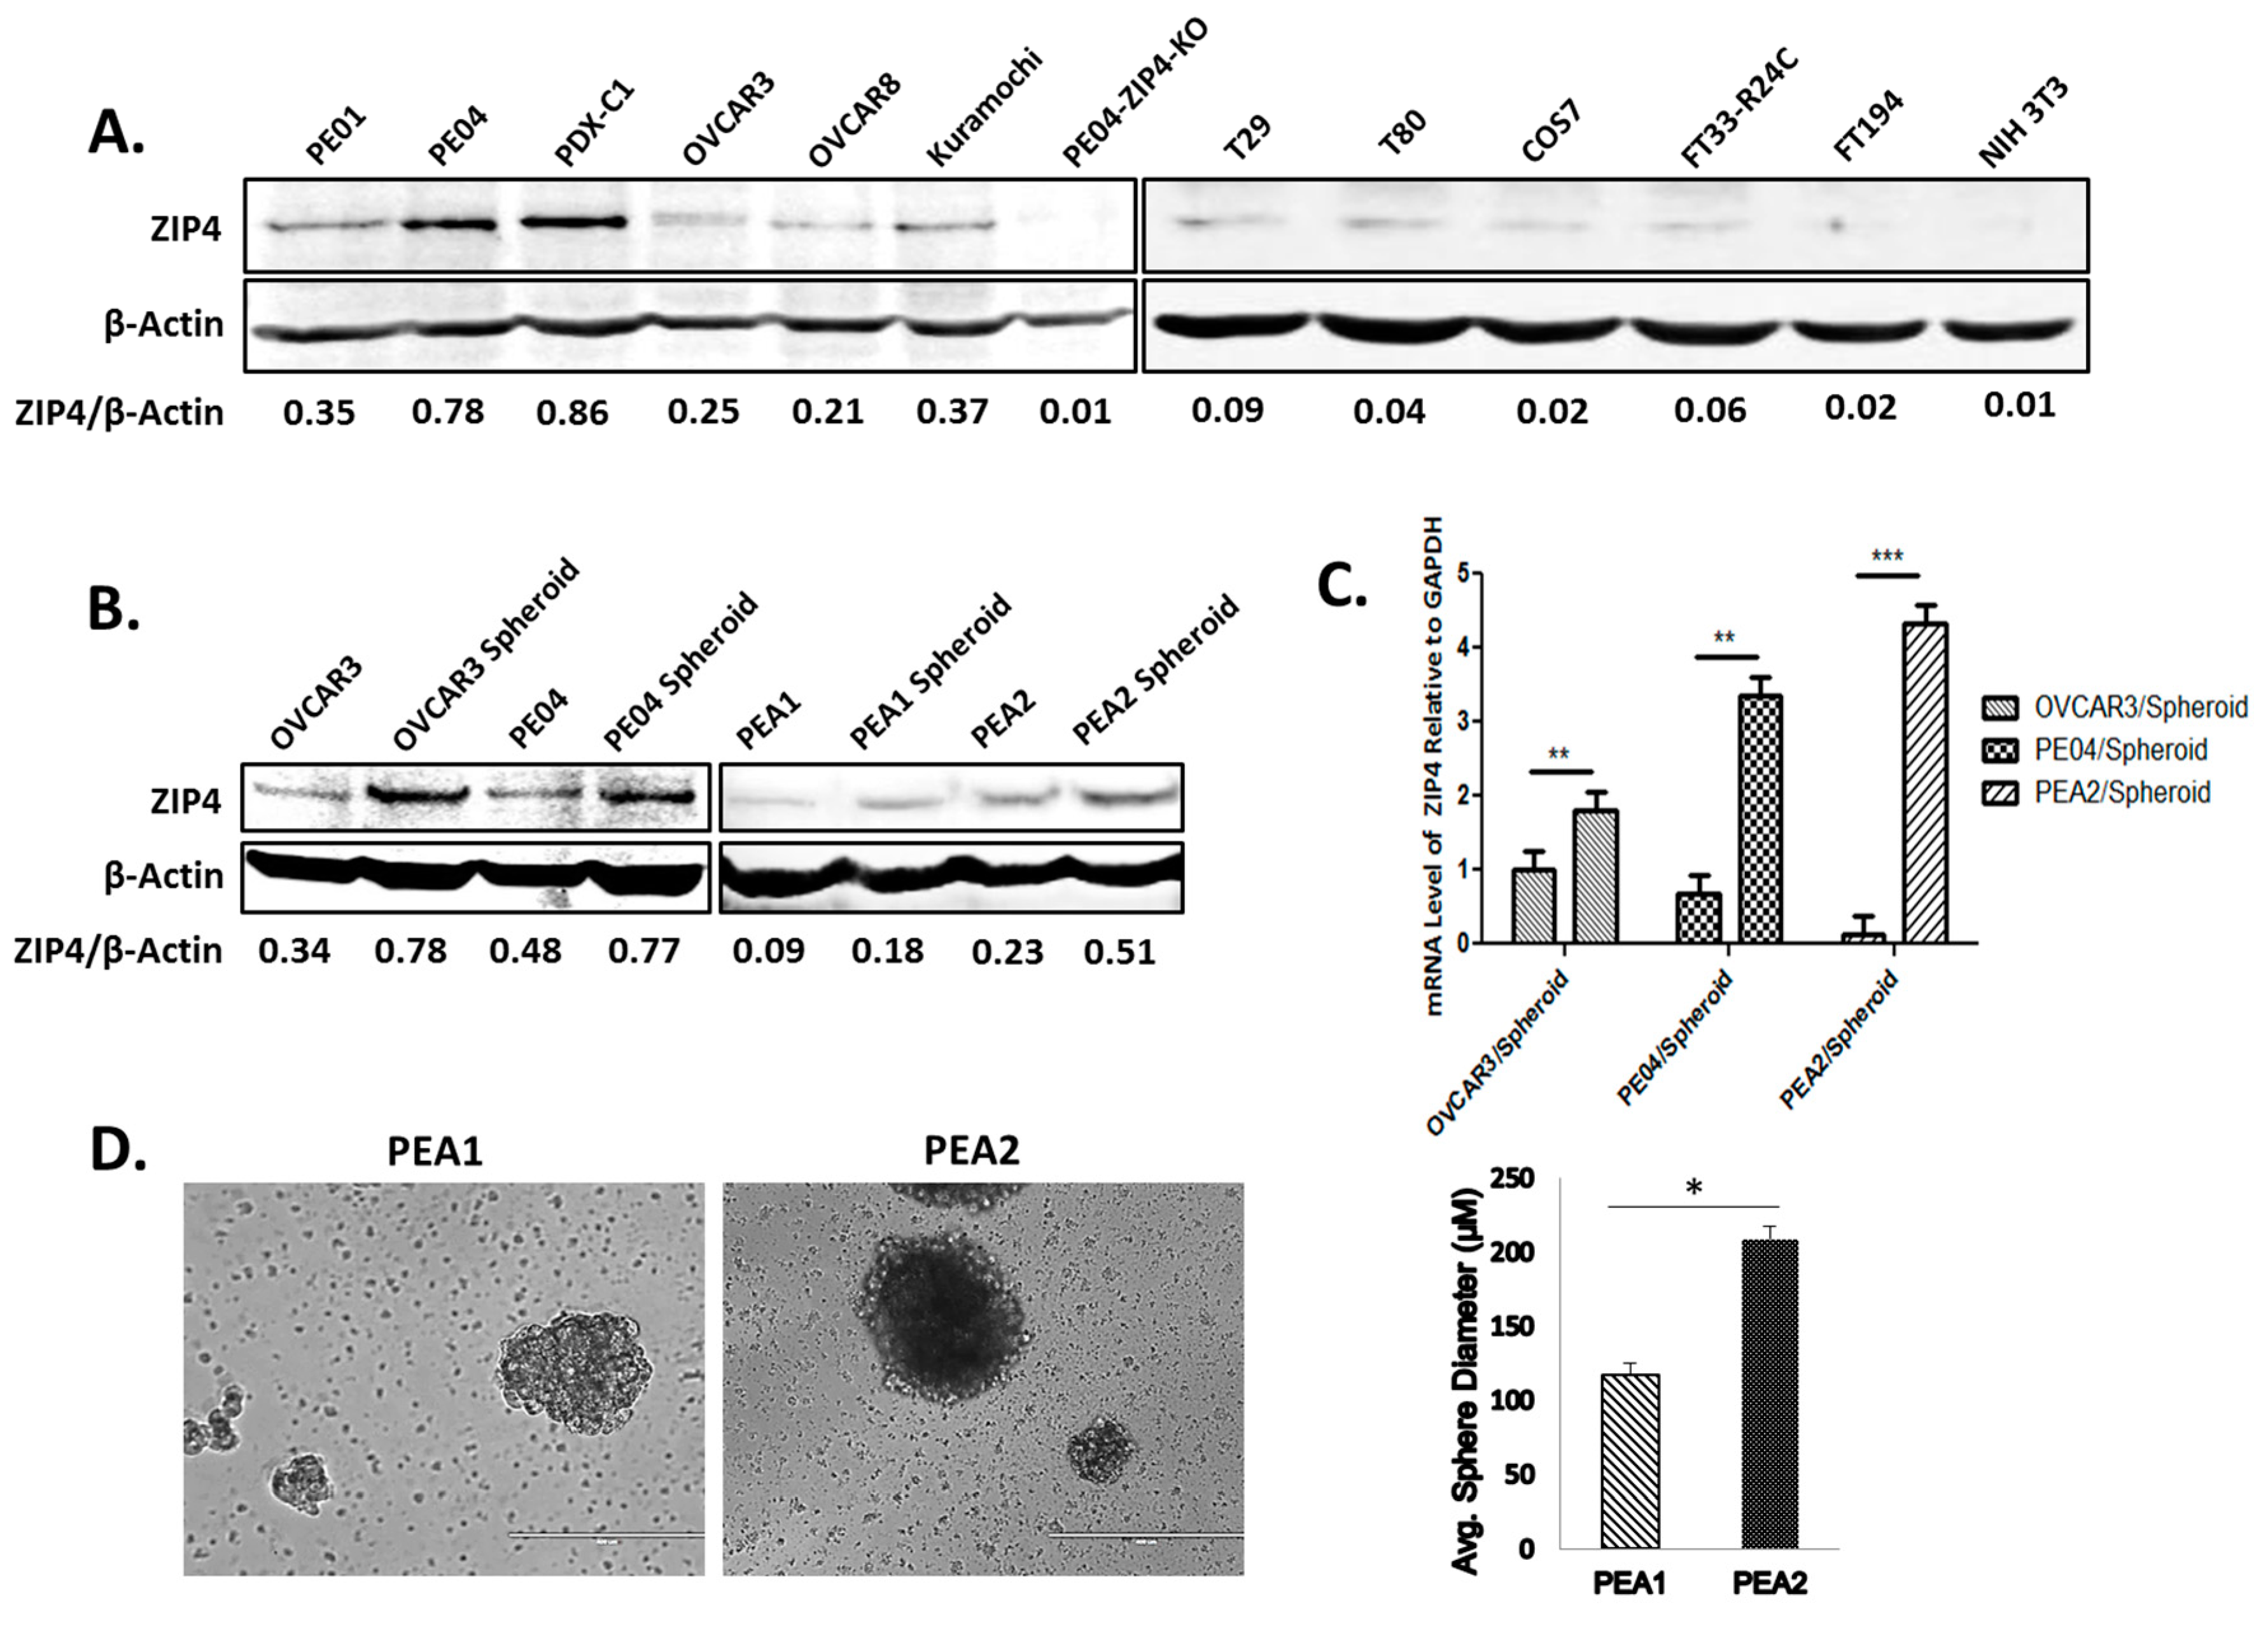
2.1. Differentiation in ZIP4 Expression and Isolation of ZIP4+ and ZIP4− Cells
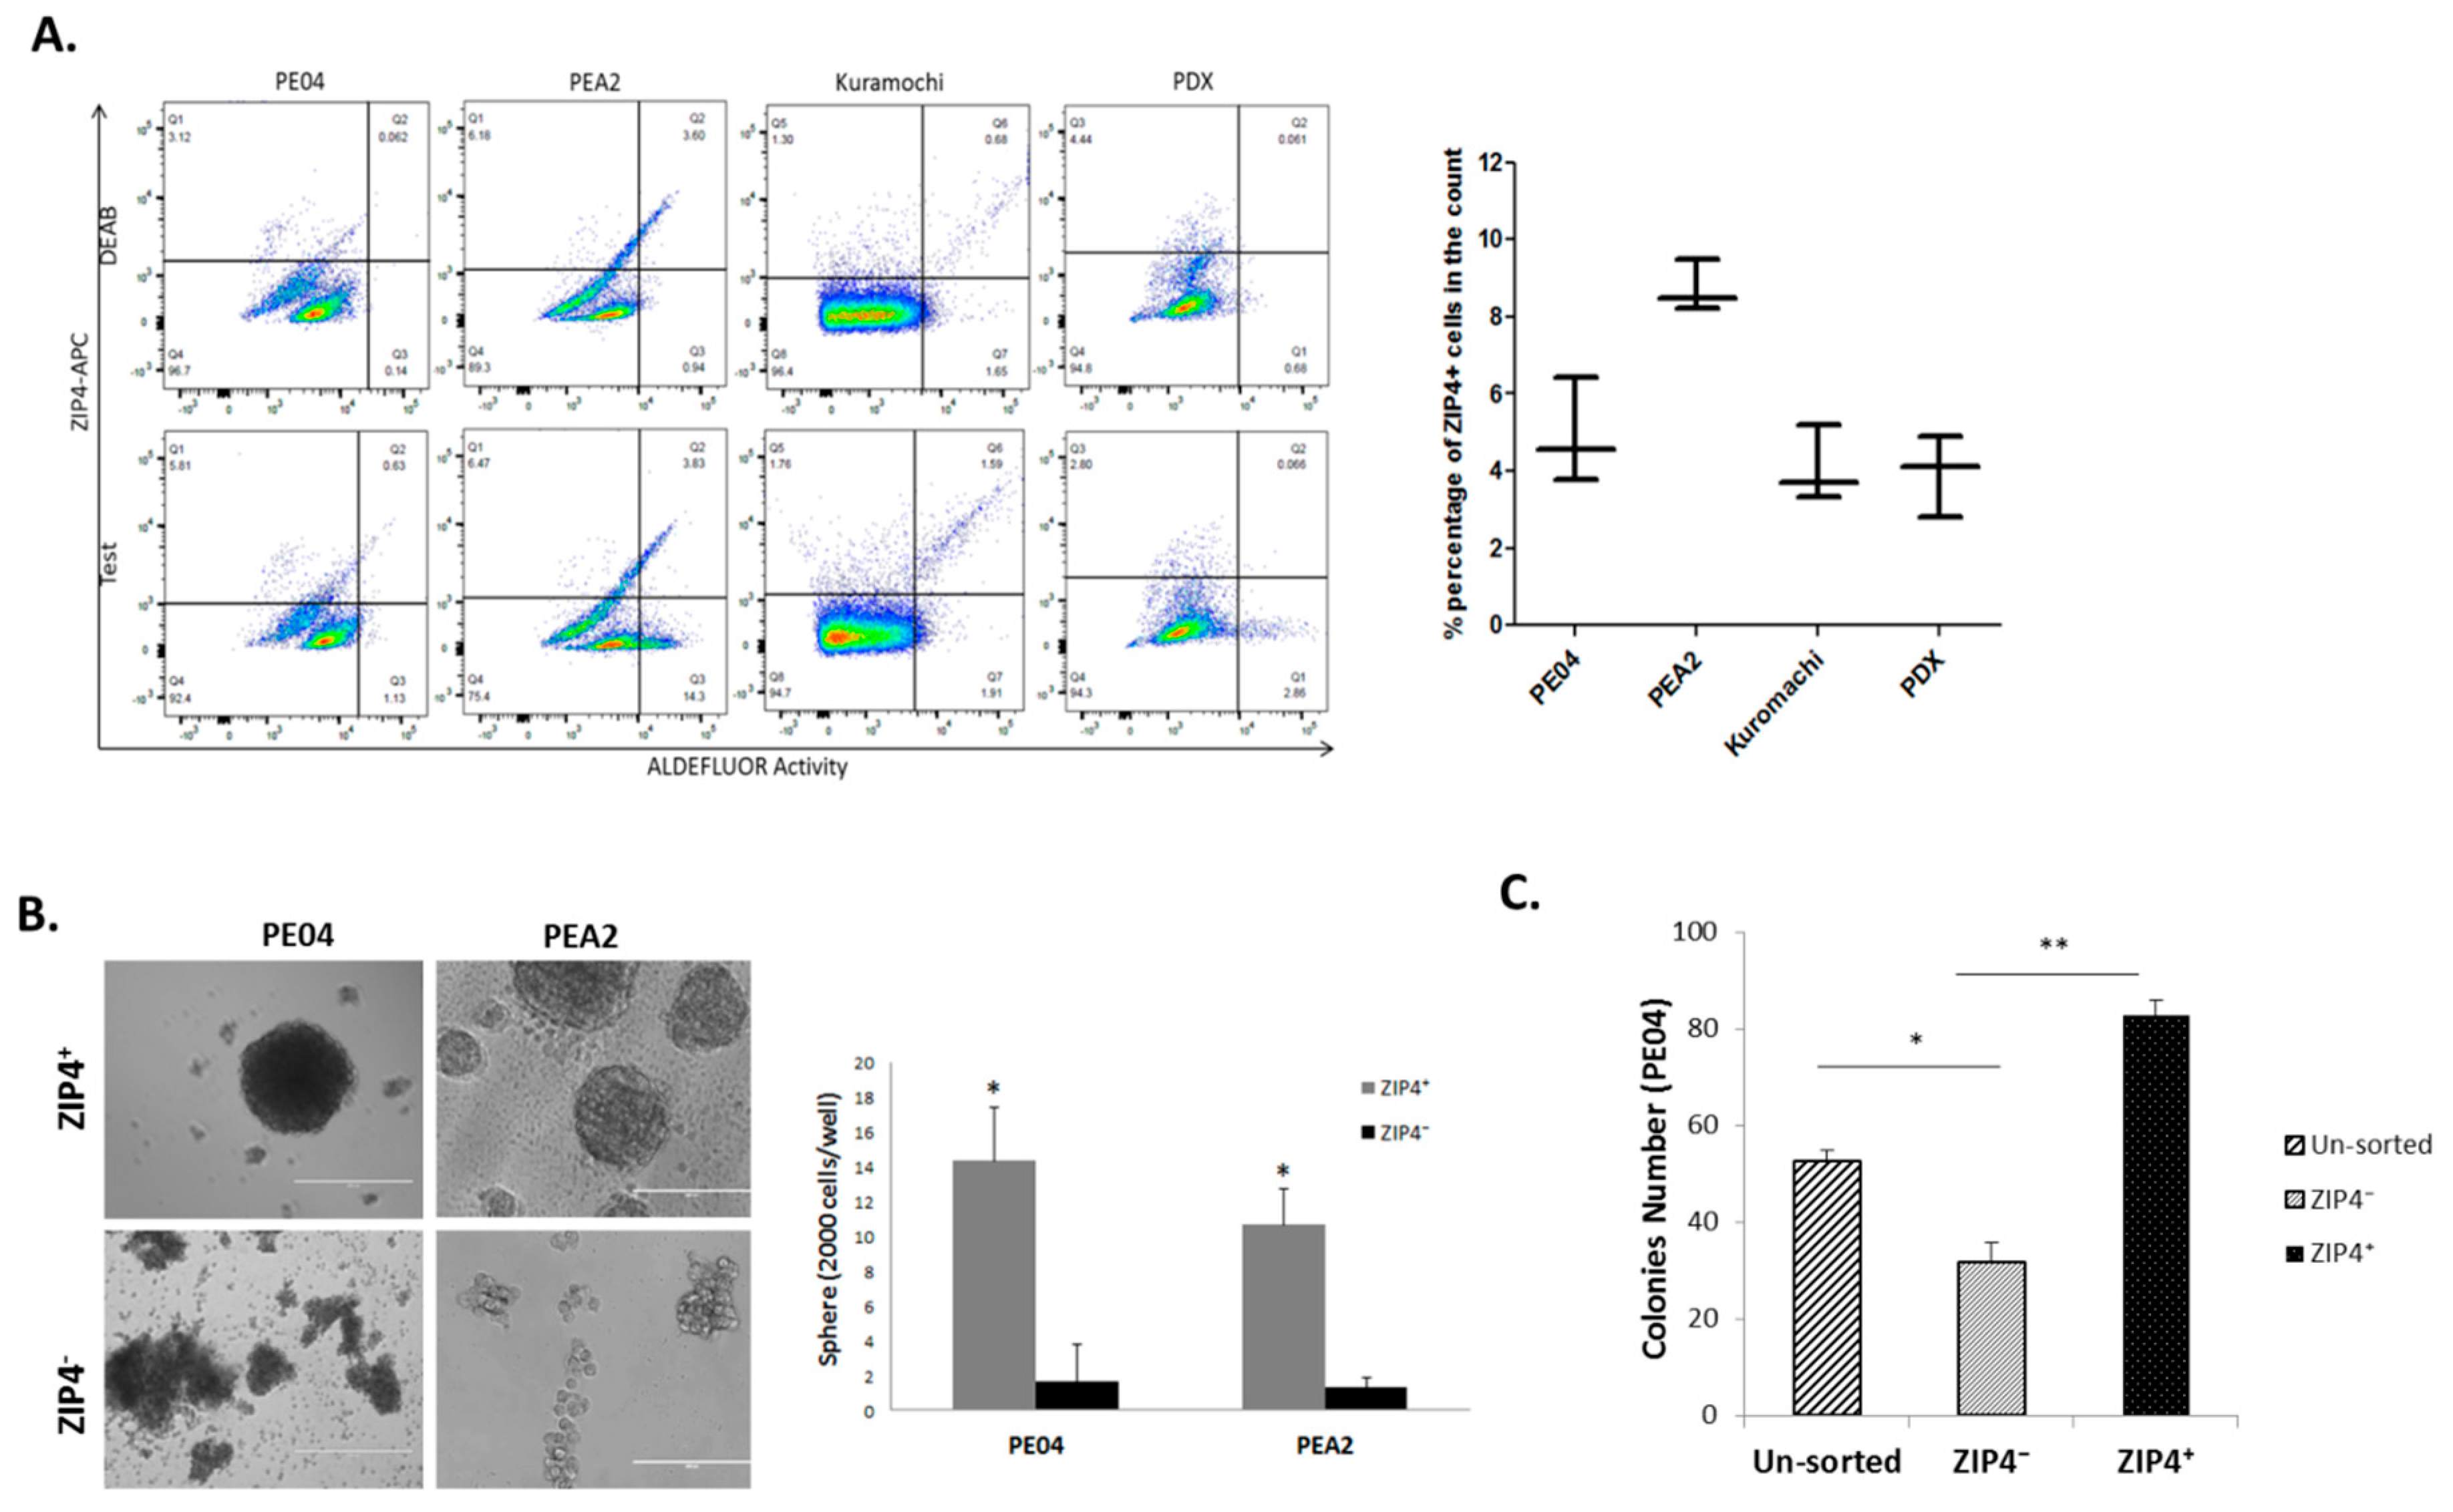
2.2. Isolation of ZIP4+ and ZIP4− Cells
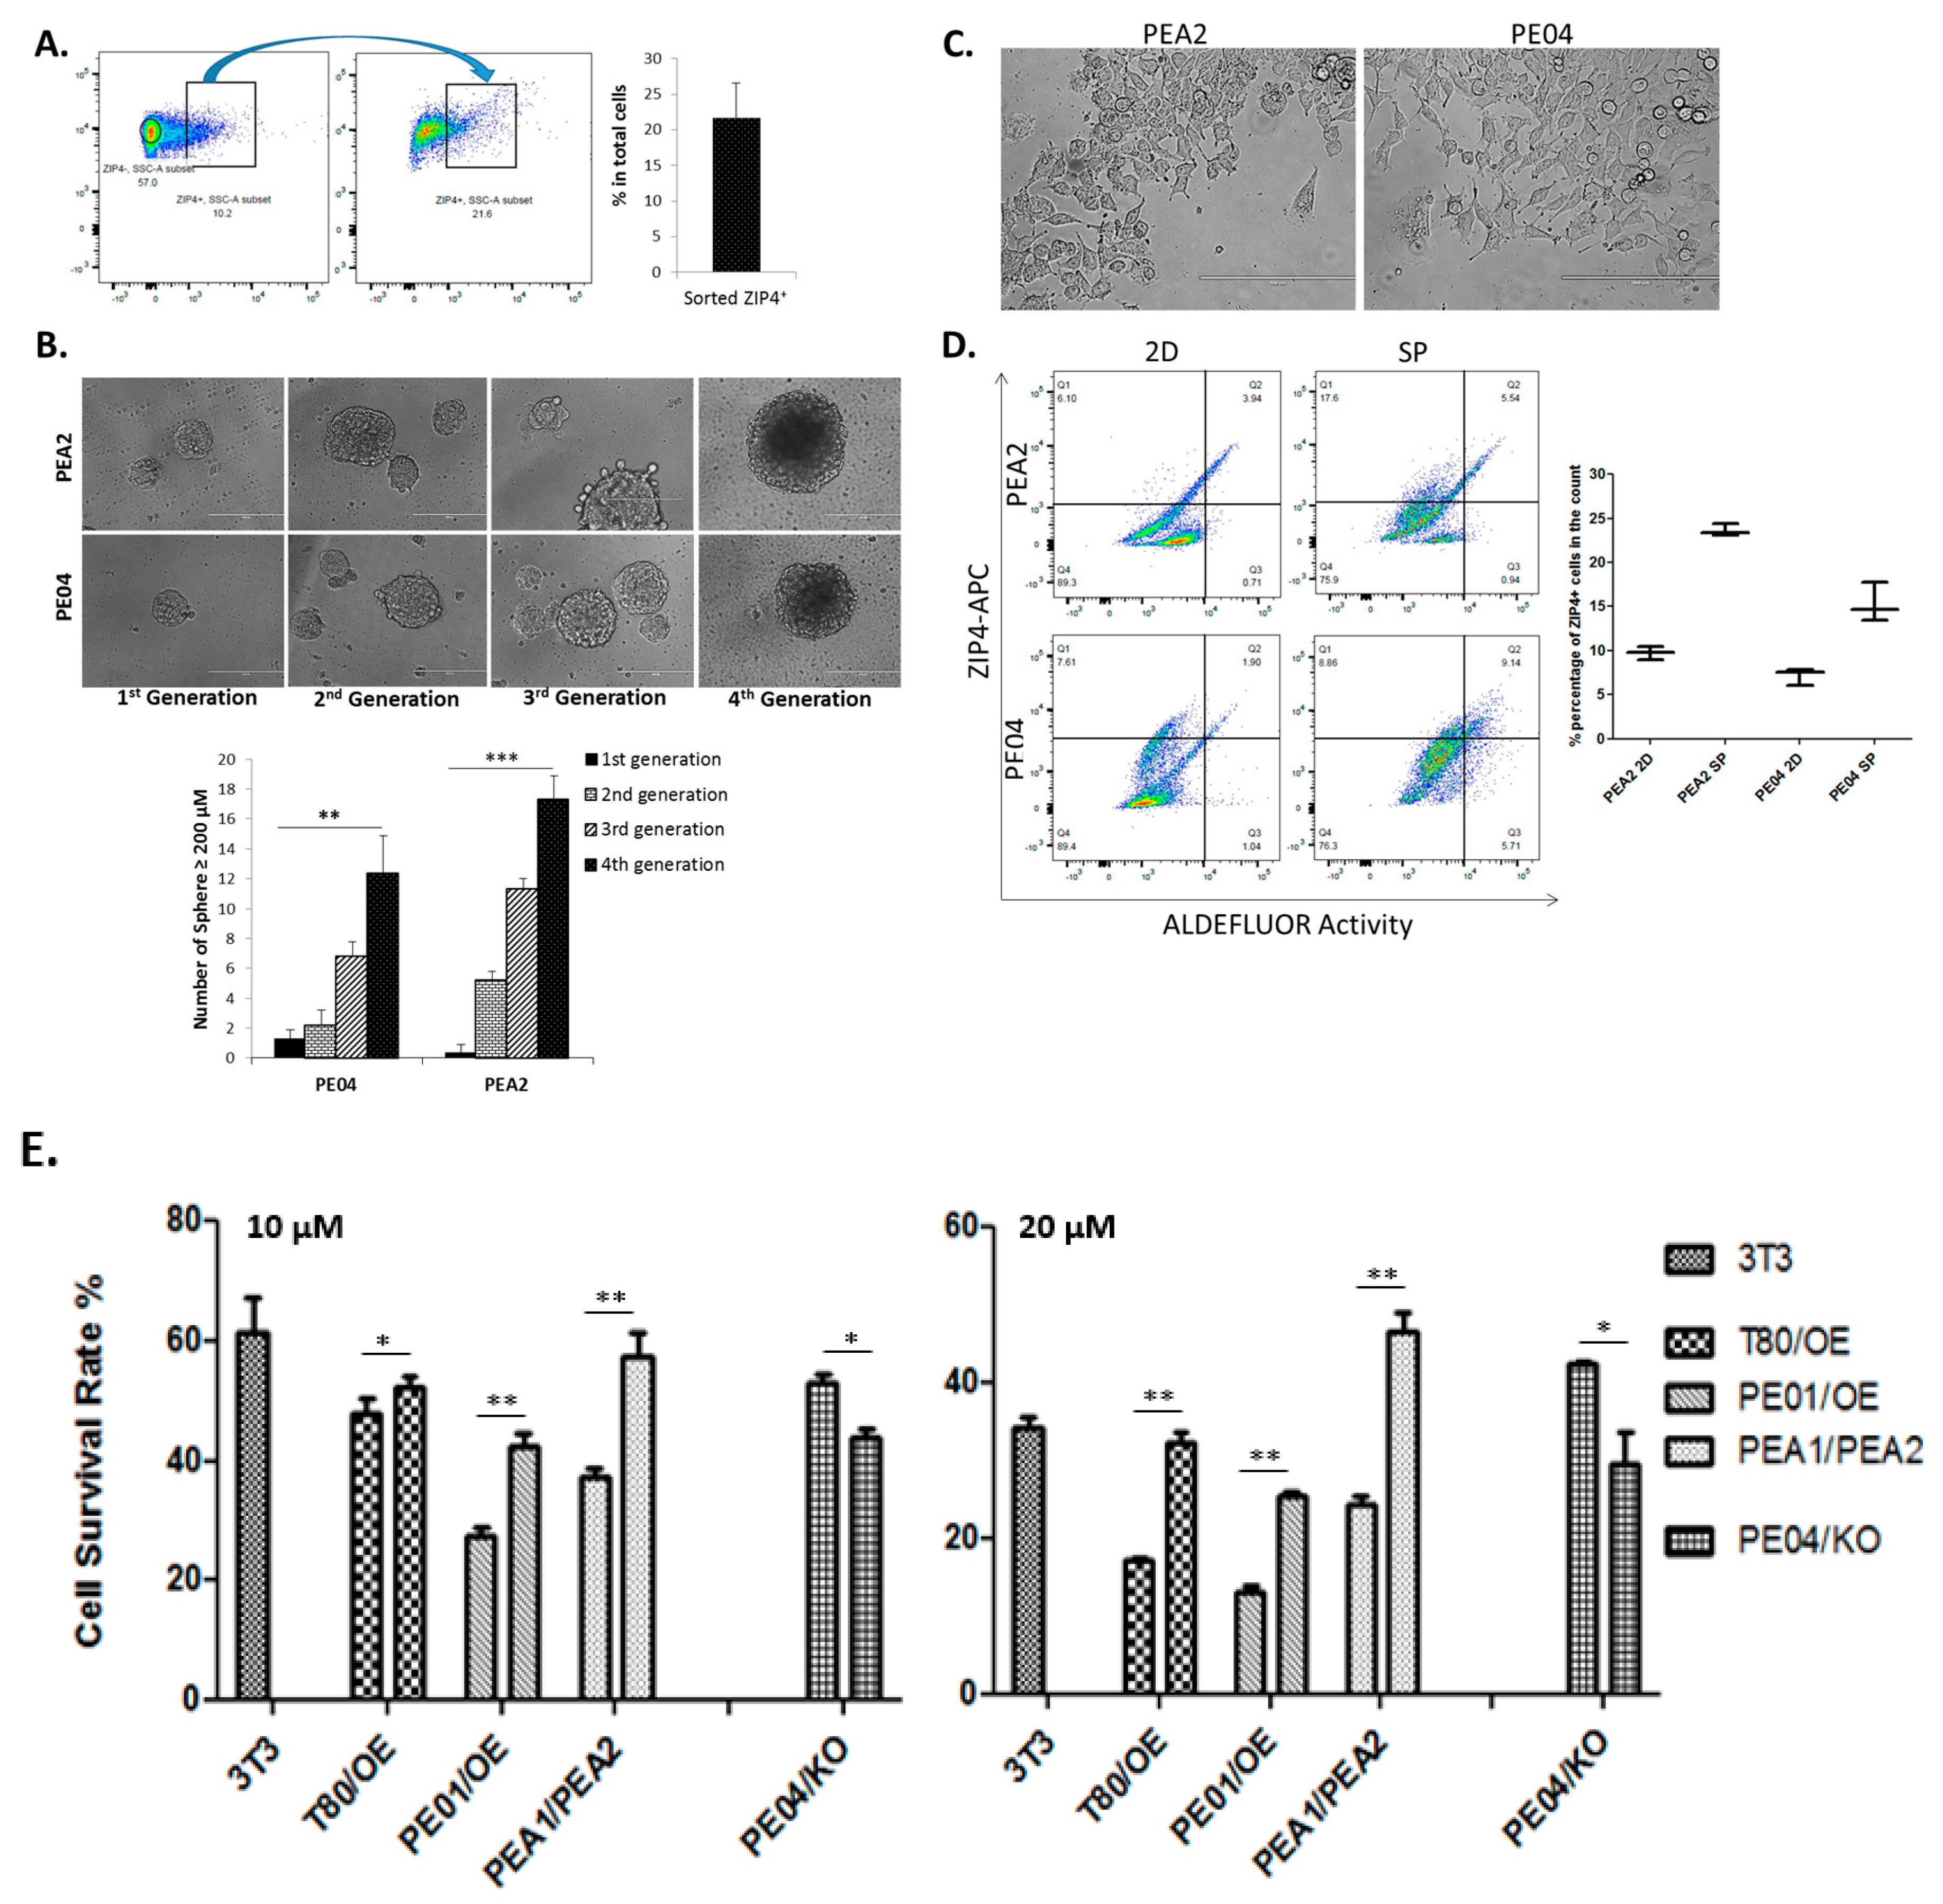
2.3. Differentiation and Renewal of ZIP4, and Drug Resistance Conferred by ZIP4
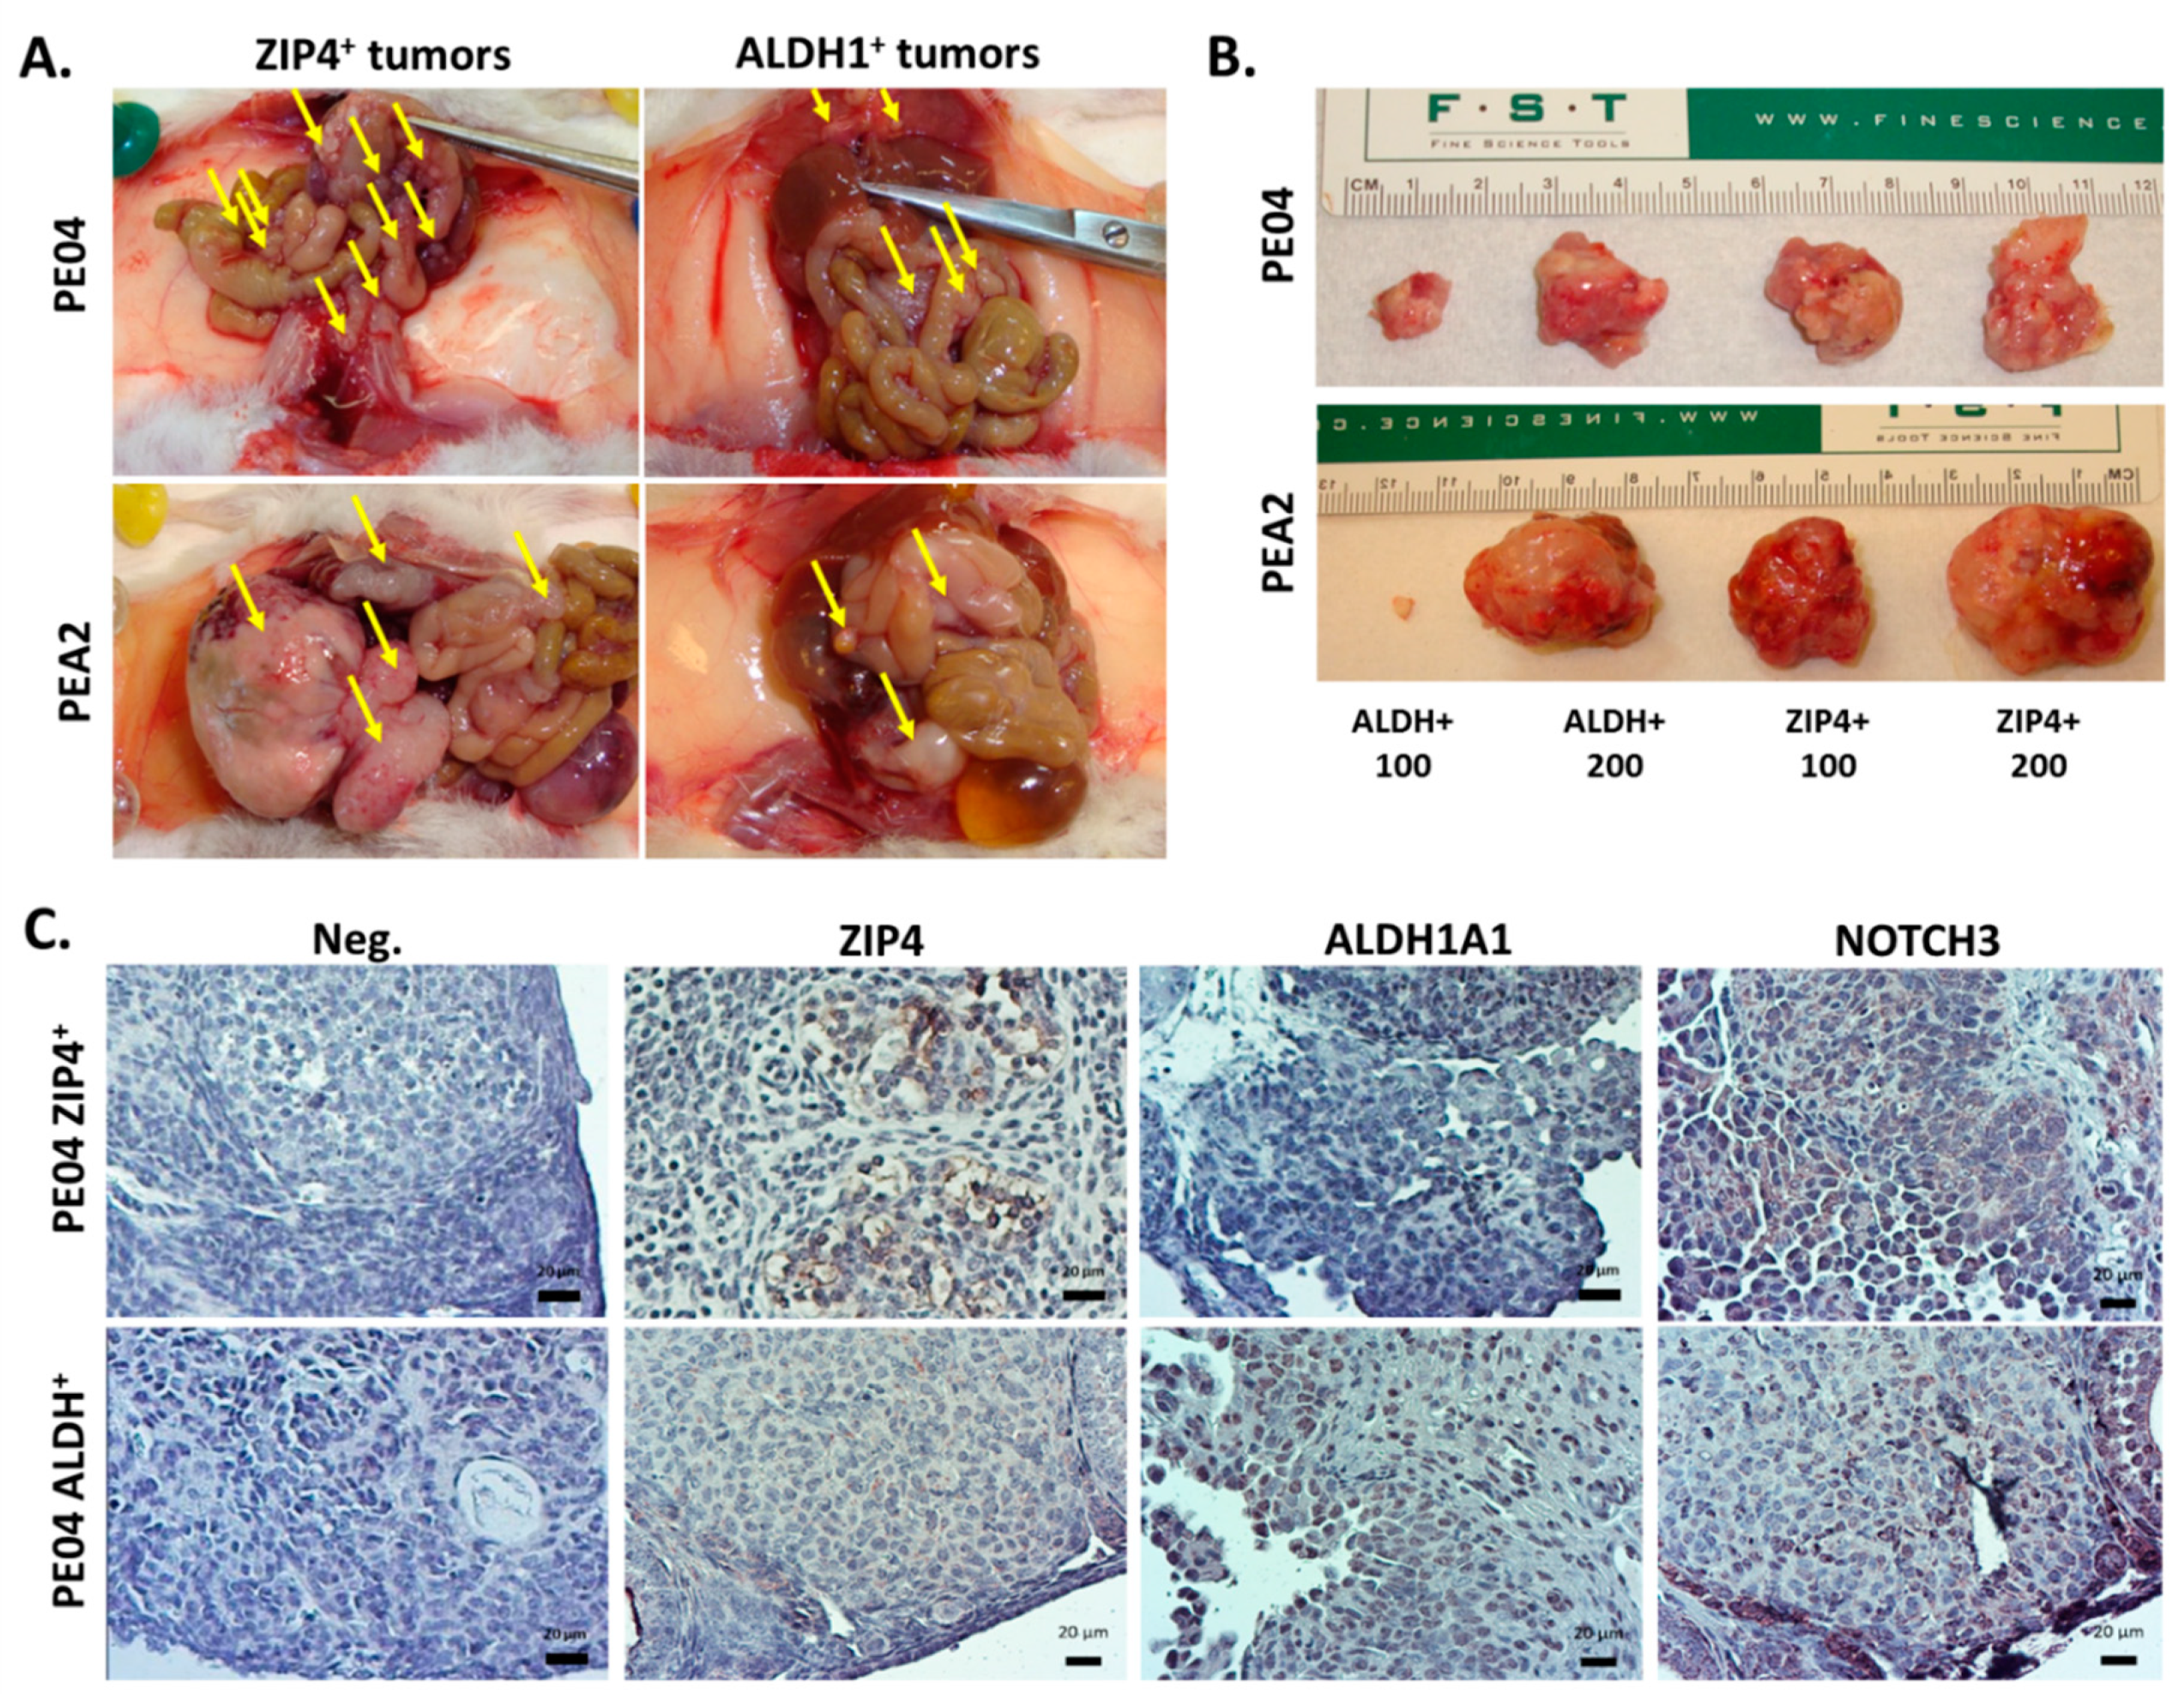
2.4. ZIP4 Represents a Highly Potent and Selective Marker for Tumor Formation In Vivo in HGSOC
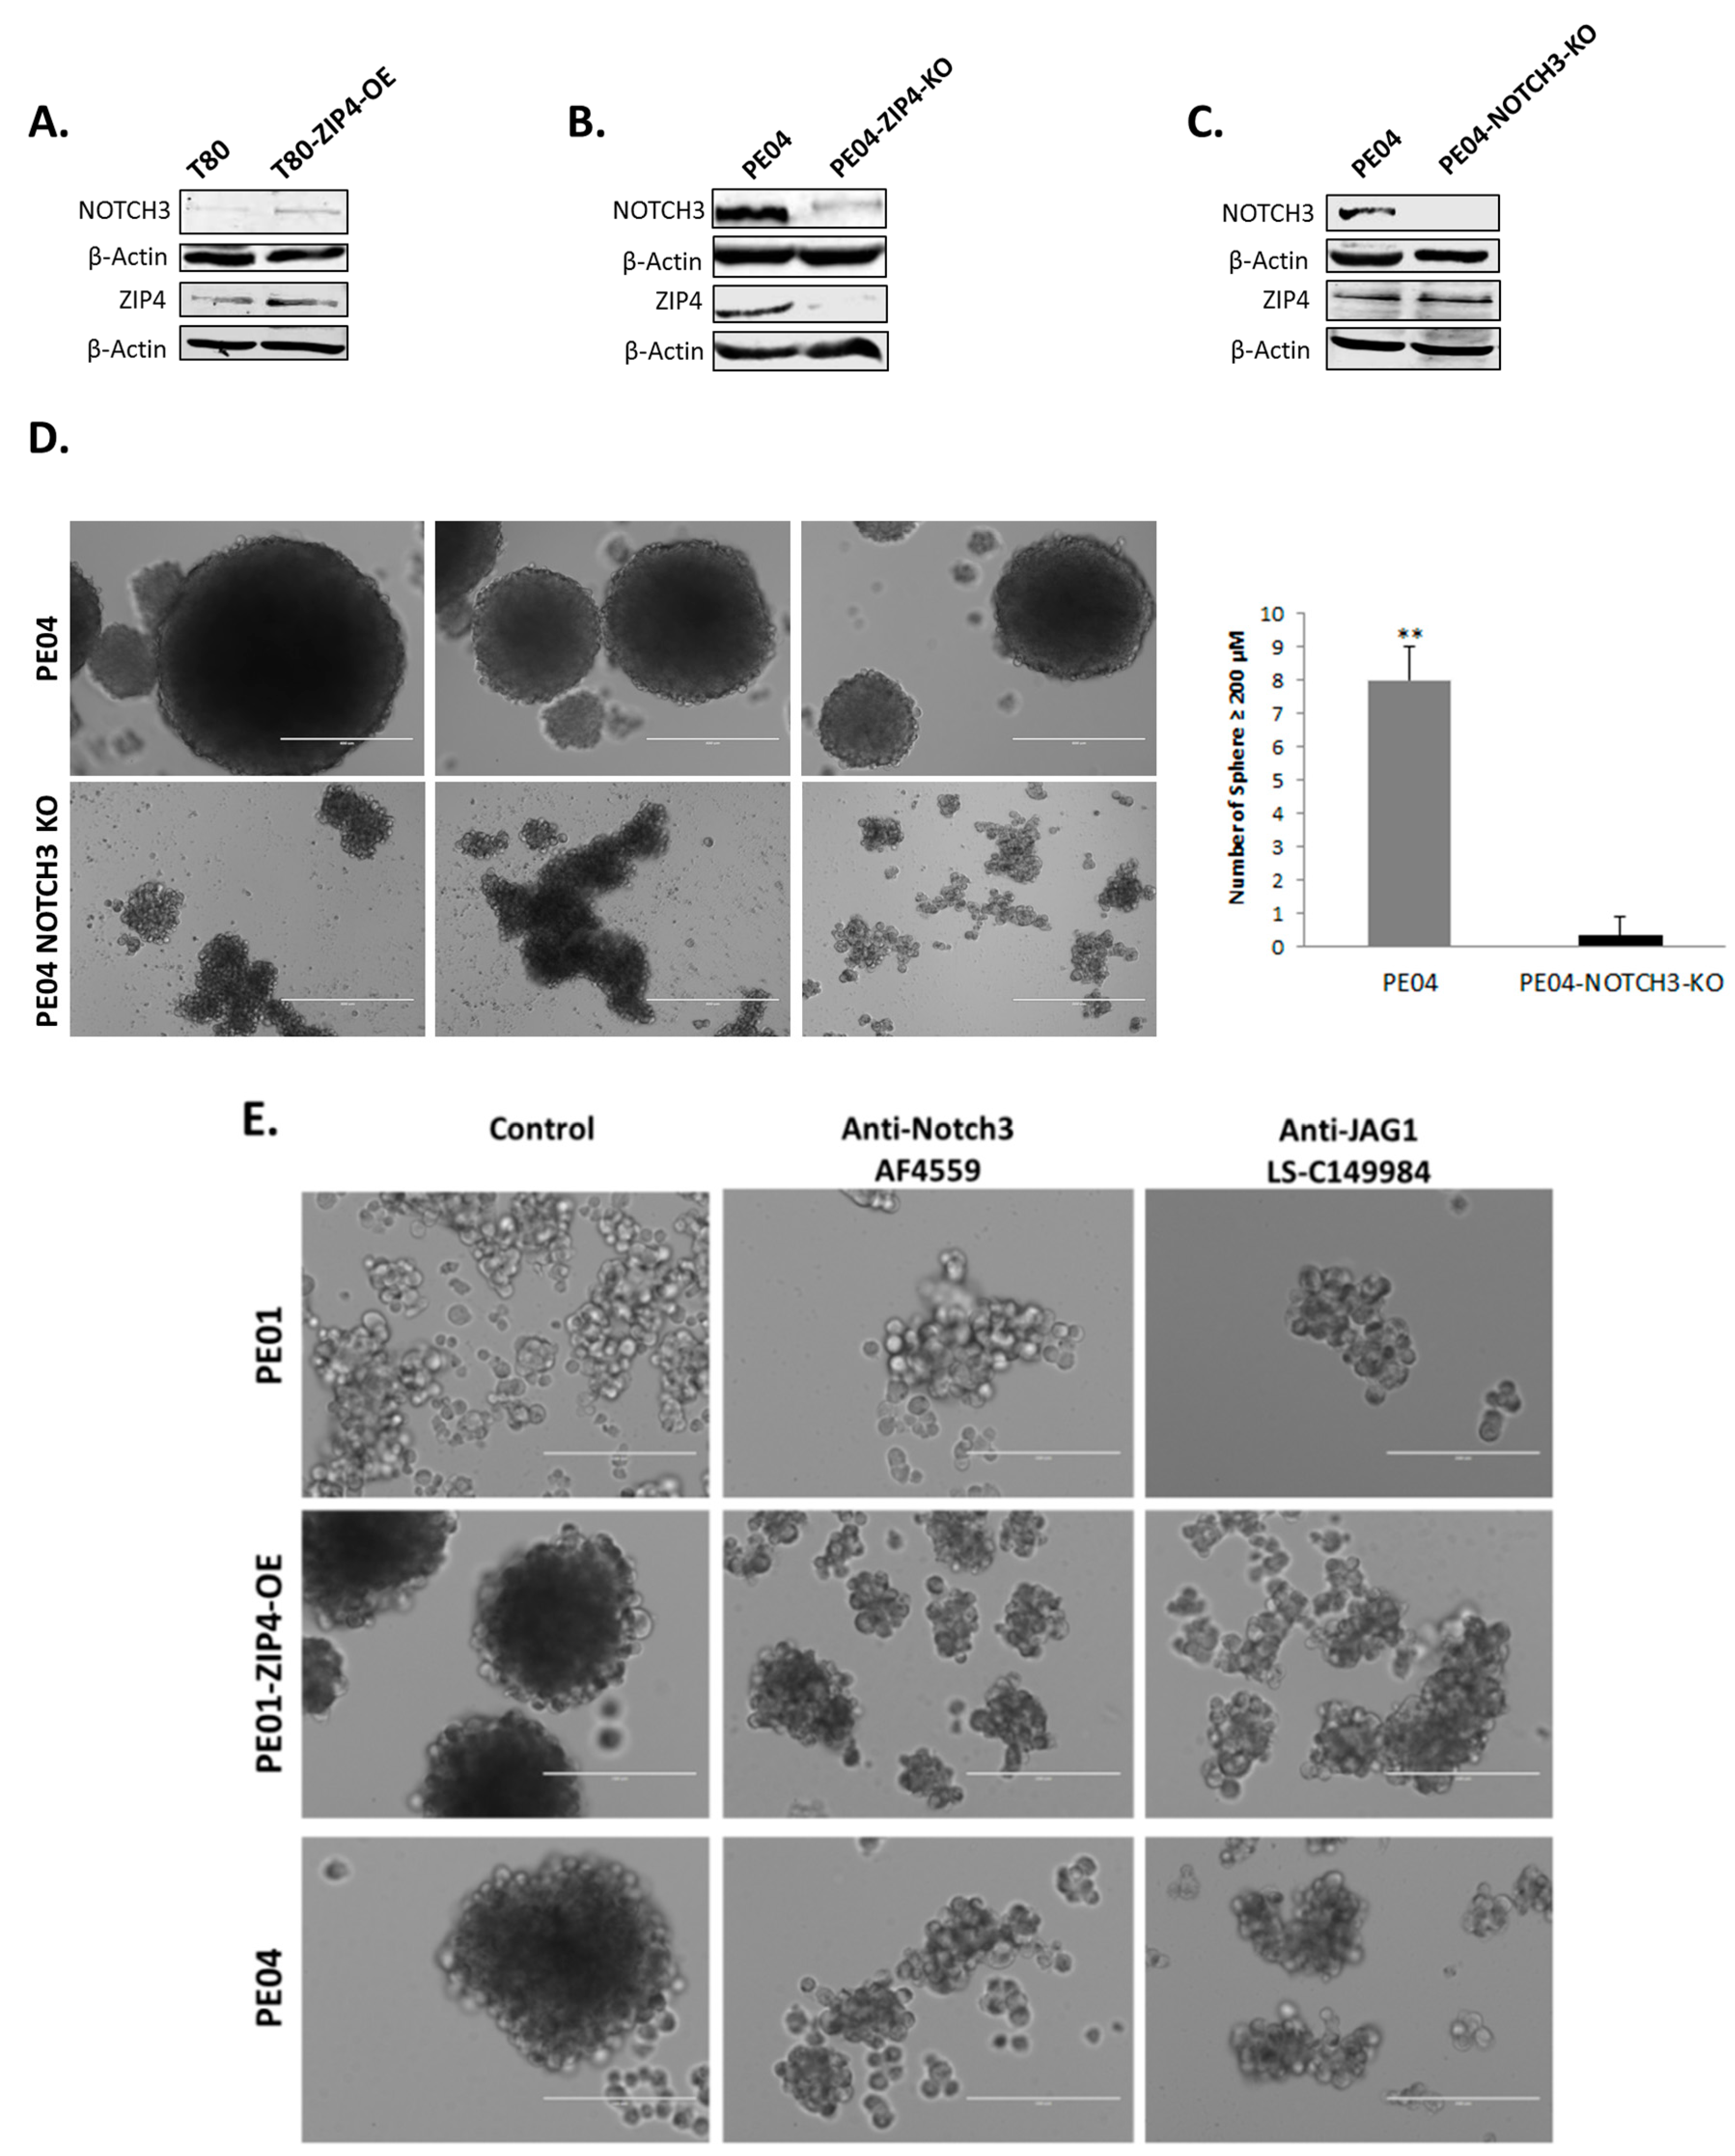
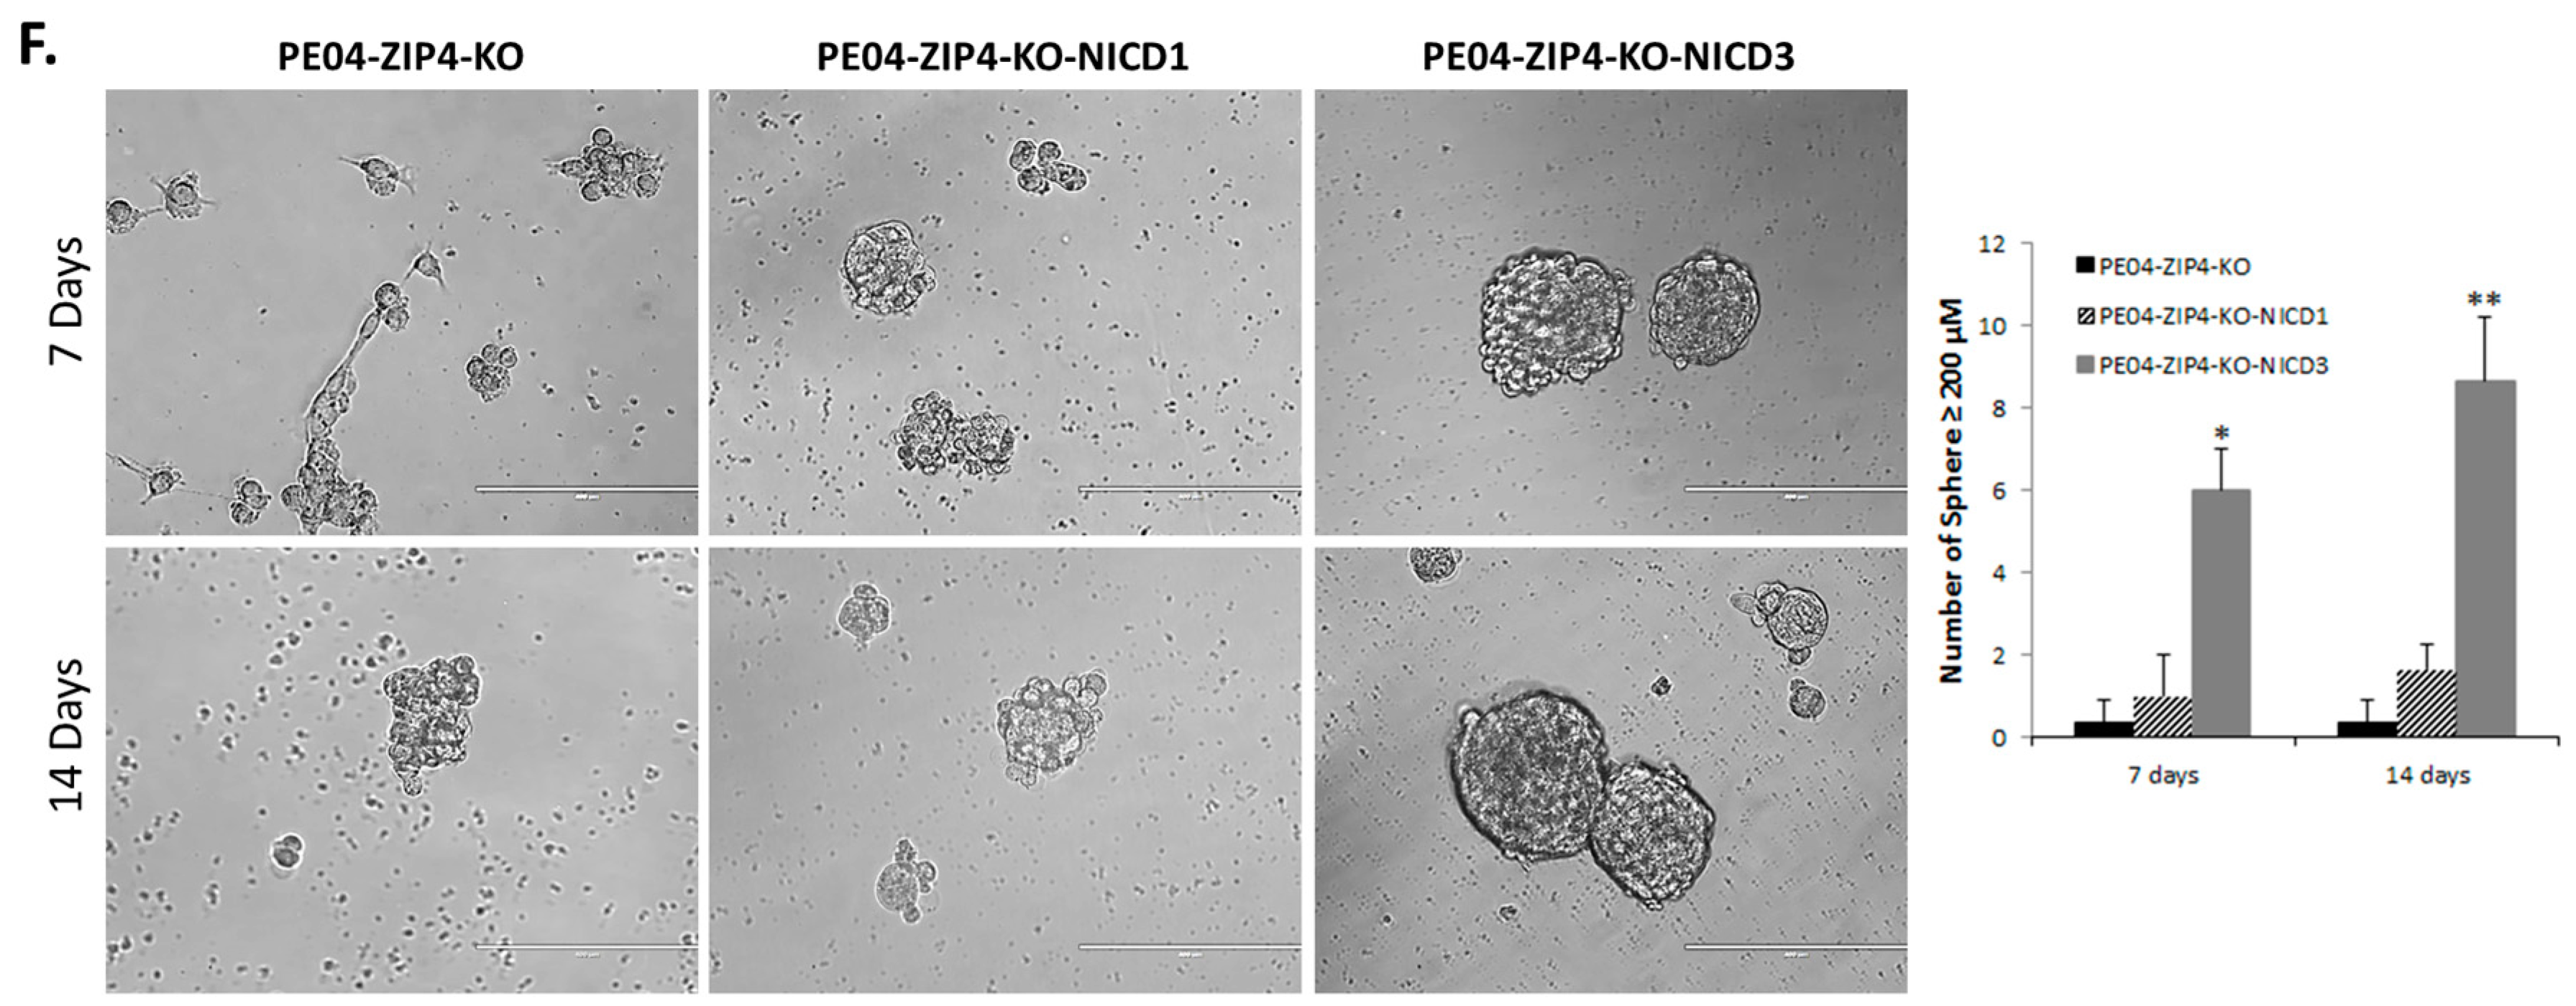
2.5. NOTCH3 Was an Important Down-Stream Mediator for ZIP4’s Activity
2.6. ZIP4 Physically Interacted with NOTCH3
2.7. NOTCH3-KO Significantly Reduced Tumorigenesis In Vivo
3. Discussion
4. Materials and Methods
4.1. Reagents, Cell Lines, and Culture
4.2. The Patient-Derived Xenograft (PDX) Model and Human HGSOC Tissues
4.3. Western Blot Analysis
4.4. mRNA Expression Analyses Using Quantitative-PCR (Q-PCR)
4.5. Assessments of Spheroid Renewal and Differentiation
4.6. Coimmunoprecipitation (Co-IP)
4.7. Spheroids and Colony Formation Assay
4.8. Cytotoxicity Assay
4.9. Fluorescence-Activated Cell Sorting (FACS) Analysis and the ZIP4+ Cell Self-Renewal Assay
4.10. Xenograft Mouse Model
4.11. Statistical Analyses
5. Conclusions
Supplementary Materials
Author Contributions
Funding
Acknowledgments
Conflicts of Interest
References
- Rojas, V.; Hirshfield, K.M.; Ganesan, S.; Rodriguez-R, L. Molecular characterization of epithelial ovarian cancer: Implications for diagnosis and treatment. Int. J. Mol. Sci. 2016, 17, 2113. [Google Scholar] [CrossRef]
- Klemba, A.; Purzycka-Olewiecka, J.K.; Wcisło, G.; Czarnecka, A.M.; Lewicki, S.; Lesyng, B.; Szczylik, C.; Kieda, C. Surface markers of cancer stem-like cells of ovarian cancer and their clinical relevance. Contemp. Oncol. 2018, 22, 48–55. [Google Scholar] [CrossRef] [PubMed]
- Nwani, N.G.; Condello, S.; Wang, Y.; Swetzig, W.M.; Barber, E.; Hurley, T.; Matei, D. A novel ALDH1A1 inhibitor targets cells with stem cell characteristics in ovarian cancer. Cancers 2019, 11, 502. [Google Scholar] [CrossRef] [PubMed]
- Reya, T.; Morrison, S.J.; Clarke, M.F.; Weissman, I.L. Stem cells, cancer, and cancer stem cells. Nature 2001, 414, 105–111. [Google Scholar] [CrossRef]
- The Cancer Genome Atlas Research Network. Integrated genomic analyses of ovarian carcinoma. Nature 2011, 474, 609–615. [Google Scholar] [CrossRef]
- Keyvani, V.; Farshchian, M.; Esmaeili, S.-A.; Hadi, Y.; Moghbeli, M.; Nezhad, S.-R.K.; Abbaszadegan, M.R. Ovarian cancer stem cells and targeted therapy. J. Ovarian Res. 2019, 12, 120. [Google Scholar] [CrossRef]
- Al-Alem, L.F.; Pandya, U.M.; Baker, A.T.; Bellio, C.; Zarrella, B.D.; Clark, J.; DiGloria, C.M.; Rueda, B.R. Ovarian cancer stem cells: What progress have we made? Int. J. Biochem. Cell Biol. 2019, 107, 92–103. [Google Scholar] [CrossRef]
- Kambe, T.; Hashimoto, A.; Fujimoto, S. Current understanding of ZIP and ZnT zinc transporters in human health and diseases. Cell Mol. Life Sci. 2014, 71, 3281–3295. [Google Scholar] [CrossRef] [PubMed]
- Donahue, T.; Hines, O.J. The ZIP4 pathway in pancreatic cancer. Cancer Biol. Ther. 2010, 9, 243–245. [Google Scholar] [CrossRef] [PubMed][Green Version]
- Li, M.; Zhang, Y.; Liu, Z.; Bharadwaj, U.; Wang, H.; Wang, X.; Zhang, S.; Liuzzi, J.P.; Shou-Mei Chang, S.-M. Aberrant expression of zinc transporter ZIP4 (SLC39A4) significantly contributes to human pancreatic cancer pathogenesis and progression. Proc. Natl. Acad. Sci. USA 2007, 104, 18636–18641. [Google Scholar] [CrossRef]
- Lin, Y.; Chen, Y.; Wang, Y.; Yang, J.; Zhu, V.F.; Liu, Y.; Cui, X.; Chen, L.; Yan, W.; Jiang, T. ZIP4 is a novel molecular marker for glioma. Neuro. Oncol. 2013, 15, 1008–1016. [Google Scholar] [CrossRef] [PubMed]
- Xu, X.; Guo, H.-J.; Xie, H.-J.; Li, J.; Zhuang, R.-Z.; Ling, Q.; Zhou, L.; Wei, X.-Y.; Liu, Z.-K.; Ding, S.-M.; et al. ZIP4, a novel determinant of tumor invasion in hepatocellular carcinoma, contributes to tumor recurrence after liver transplantation. Int. J. Biol. Sci. 2014, 10, 245–256. [Google Scholar] [CrossRef] [PubMed]
- Zeng, Q.; Liu, Y.-M.; Liu, J.; Han, J.; Guo, J.-X.; Lu, S.; Huang, X.-M.; Yi, P.; Lang, J.-Y. Inhibition of ZIP4 reverses epithelial-to-mesenchymal transition and enhances the radiosensitivity in human nasopharyngeal carcinoma cells. Cell Death Dis. 2019, 10, 588. [Google Scholar] [CrossRef] [PubMed]
- Fan, Q.; Cai, Q.; Li, P.; Wang, W.; Wang, J.; Gerry, E.; Wang, T.-L.; Shih, I.-M.; Nephew, K.P.; Xu, Y.; et al. The novel ZIP4 regulation and its role in ovarian cancer. Oncotarget 2017, 8, 90090–90107. [Google Scholar] [CrossRef] [PubMed]
- Cai, Q.; Fan, Q.; Buechlein, A.; Miller, D.; Nephew, K.P.; Liu, S.; Wan, J.; Xu, Y. Changes in mRNA/protein expression and signaling pathways in in vivo passaged mouse ovarian cancer cells. PLoS ONE 2018, 13, e0197404. [Google Scholar] [CrossRef] [PubMed]
- Fan, Q.; Cai, Q.; Xu, Y. LPA regulates SOX9 in ovarian cancer cells. J. Obstetrics Gynecolog. 2017. [Google Scholar] [CrossRef]
- Wu, D.M.; Liu, T.; Deng, S.-H.; Han, R.; Xu, Y. SLC39A4 expression is associated with enhanced cell migration, cisplatin resistance, and poor survival in non-small cell lung cancer. Sci. Rep. 2017, 7, 7211. [Google Scholar] [CrossRef]
- Braune, E.B.; Lendahl, U.; Notch, L. A goldilocks signaling pathway in disease and cancer therapy. Discov. Med. 2016, 21, 189–196. [Google Scholar]
- Ivan, C.; Hu, W.; Bottsford-Miller, J.; Zand, B.; Dalton, J.J.; Liu, T.; Huang, J.; Nick, A.M.; Lopez-Berestein, G.; Coleman, R.L. Epigenetic analysis of the Notch superfamily in high-grade serous ovarian cancer. Gynecol. Oncol. 2013, 128, 506–511. [Google Scholar] [CrossRef]
- Lai, I.C.; Shih, P.-H.; Yao, C.-J.; Yeh, C.-T.; Wang-Peng, J.; Lui, T.-N.; Chuang, S.-E.; Hu, T.-S.; Lai, T.-Y.; Lai, G.-M.; et al. Elimination of cancer stem-like cells and potentiation of temozolomide sensitivity by Honokiol in glioblastoma multiforme cells. PLoS ONE 2015, 10, e0114830. [Google Scholar] [CrossRef]
- Park, J.T.; Li, M.; Nakayama, K.; Mao, T.-L.; Davidson, B.; Zhang, Z.; Kurman, R.J.; Eberhart, C.G.; Shih, I.-M.; Wang, T.-L.; et al. Notch3 gene amplification in ovarian cancer. Cancer Res. 2006, 66, 6312–6318. [Google Scholar] [CrossRef]
- Choi, J.H.; Joon, T.; Park, J.T.; Davidson, B.; Morin, P.J.; Shih, I.-M.; Wang, T.-L. Jagged-1 and Notch3 juxtacrine loop regulates ovarian tumor growth and adhesion. Cancer Res. 2008, 68, 5716–5723. [Google Scholar] [CrossRef]
- Chen, X.; Stoeck, A.; Lee, S.J.; Shih, I.-M.; Wang, M.M.; Wang, T.-L. Jagged1 expression regulated by Notch3 and Wnt/beta-catenin signaling pathways in ovarian cancer. Oncotarget 2010, 1, 210–218. [Google Scholar] [CrossRef] [PubMed]
- Park, J.T.; Chen, X.; Tropè, C.G.; Davidson, B.; Shih, I.-M.; Wanget, T.-L. Notch3 overexpression is related to the recurrence of ovarian cancer and confers resistance to carboplatin. Am. J. Pathol. 2010, 177, 1087–1094. [Google Scholar] [CrossRef] [PubMed]
- Jung, S.G.; Kwon, Y.D.; Song, J.A.; Back, M.J.; Lee, S.Y.; Lee, C.; Hwang, Y.Y.; An, H.J. Prognostic significance of Notch 3 gene expression in ovarian serous carcinoma. Cancer Sci. 2010, 101, 1977–1983. [Google Scholar] [CrossRef]
- Rahman, M.T.; Nakayama, K.; Rahman, M.; Katagiri, H.; Katagiri, A.; Ishibashi, T.; Ishikawa, M.; Iida, K.; Nakayama, S.; Otsuki, Y. Notch3 overexpression as potential therapeutic target in advanced stage chemoresistant ovarian cancer. Am. J. Clin. Pathol. 2012, 138, 535–544. [Google Scholar] [CrossRef] [PubMed]
- Ceccarelli, S.; Megiorni, F.; Bellavia, D.; Marchese, C.; Screpanti, I.; Checquolo, S. Notch3 targeting: A novel weapon against ovarian cancer stem cells. Stem. Cells Int. 2019, 2019, 6264931. [Google Scholar] [CrossRef] [PubMed]
- Domcke, S.; Sinha, R.; Levine, D.A.; Sander, C.; Schultz, N. Evaluating cell lines as tumour models by comparison of genomic profiles. Nat. Commun. 2013, 4, 2126. [Google Scholar] [CrossRef]
- Thu, K.L.; Papari-Zareei, M.; Stastny, V.; Song, K.; Peyton, M.; Martinez, V.D.; Zhang, Y.-A.; Castro, I.B.; Varella-Garcia, M.; Liang, H. A comprehensively characterized cell line panel highly representative of clinical ovarian high-grade serous carcinomas. Oncotarget 2017, 8, 50489–50499. [Google Scholar] [CrossRef]
- Elias, K.M.; Emori, M.M.; Papp, E.; MacDuffie, E.; Konecny, G.E.; Velculescu, V.E.; Drapkin, R. Beyond genomics: Critical evaluation of cell line utility for ovarian cancer research. Gynecol Oncol. 2015, 139, 97–103. [Google Scholar] [CrossRef]
- Stronach, E.A.; Alfraidi, A.; Rama, N.; Datler, C.; Studd, J.B.; Agarwal, E.; Guney, T.G.; Charlie Gourley, C.; Hennessy, B.T.; Mills, G.B.; et al. HDAC4-regulated STAT1 activation mediates platinum resistance in ovarian cancer. Cancer Res. 2011, 71, 4412–4422. [Google Scholar] [CrossRef] [PubMed]
- Ricci, F.; Bizzaro, F.; Cesca, M.; Guffanti, F.; Ganzinelli, M.; Decio, A.; Ghilardi, C.; Perego, P.; Fruscio, R.; Buda, A.; et al. Patient-derived ovarian tumor xenografts recapitulate human clinicopathology and genetic alterations. Cancer Res. 2014, 74, 6980–6990. [Google Scholar] [CrossRef] [PubMed]
- Liu, J.F.; Palakurthi, S.; Zeng, Q.; Zhou, S.; Ivanova, E.; Huang, W.; Zervantonakis, J.K.; Selfors, L.M.; Shen, Y.; Pritchard, C.C.; et al. Establishment of patient-derived tumor xenograft models of epithelial ovarian cancer for preclinical evaluation of novel therapeutics. Clin. Cancer Res. 2017, 23, 1263–1273. [Google Scholar] [CrossRef] [PubMed]
- Lewis, A.D.; Hayes, J.D.; Wolf, C.R. Glutathione and glutathione-dependent enzymes in ovarian adenocarcinoma cell lines derived from a patient before and after the onset of drug resistance: Intrinsic differences and cell cycle effects. Carcinogenesis 1988, 9, 1283–1287. [Google Scholar] [CrossRef] [PubMed]
- Sakai, W.; Swisher, E.M.; Jacquemont, C.; Chandramohan, K.V.; Couch, F.J.; Langdon, S.P.; Wurz, K.; Higgins, J.; Villegas, E.; Taniguchi, T. Functional restoration of BRCA2 protein by secondary BRCA2 mutations in BRCA2-mutated ovarian carcinoma. Cancer Res. 2009, 69, 6381–6386. [Google Scholar] [CrossRef]
- Muralikrishnan, V.; Hurley, T.D.; Nephew, K.P. Targeting aldehyde dehydrogenases to eliminate cancer stem cells in gynecologic malignancies. Cancers 2020, 12, 961. [Google Scholar] [CrossRef]
- Wang, Y.; Zong, X.; Mitra, S.; Mitra, A.K.; Matei, D.; Nephew, K.P. IL-6 mediates platinum-induced enrichment of ovarian cancer stem cells. JCI Insight 2018, 3, e12236. [Google Scholar] [CrossRef]
- Zhang, S.; Balch, C.; Chan, M.W.; Lai, H.-C.; Matei, D.; Schilder, J.M.; Yan, P.S.; Huang, T.H.-M.; Nephewet, K.P. Identification and characterization of ovarian cancer-initiating cells from primary human tumors. Cancer Res. 2008, 68, 4311–4320. [Google Scholar] [CrossRef]
- Najafi, M.; Mortezaee, K.; Majidpoor, J. Cancer stem cell (CSC) resistance drivers. Life Sci. 2019, 234, 116781. [Google Scholar] [CrossRef]
- Zhang, T.; Xu, J.; Deng, S.; Zhou, F.; Li, J.; Zhang, L.; Li, L.; Wang, Q.-E.; Fuhai Li, F. Core signaling pathways in ovarian cancer stem cell revealed by integrative analysis of multi-marker genomics data. PLoS ONE 2018, 13, e0196351. [Google Scholar] [CrossRef]
- Kaipio, K.; Chen, P.; Roering, P.; Huhtinen, K.; Mikkonen, P.; Östling, P.; Lehtinen, L.; Mansuri, N.; Korpela, T.; Potdar, S.; et al. ALDH1A1-related stemness in high-grade serous ovarian cancer is a negative prognostic indicator but potentially targetable by EGFR/mTOR-PI3K/aurora kinase inhibitors. J. Pathol. 2019, 250, 159–169. [Google Scholar] [CrossRef] [PubMed]
- Pan, Z.; Choi, S.; Ouadid-Ahidouch, H.; Yang, J.-M.; Beattie, J.H.; Korichneva, I. Zinc transporters and dysregulated channels in cancers. Front. Biosci. 2017, 22, 623–643. [Google Scholar] [CrossRef] [PubMed]
- Groth, C.; Sasamura, T.; Khanna, M.R.; Whitley, M.; Fortini, M.E. Protein trafficking abnormalities in Drosophila tissues with impaired activity of the ZIP7 zinc transporter Catsup. Development 2013, 140, 3018–3027. [Google Scholar] [CrossRef] [PubMed]
- Farra, R.; Maruna, M.; Perrone, F.; Grassi, M.; Benedetti, F.; Maddaloni, M.; Boustani, M.E.; Salvo Parisi, S.; Rizzolio, F.; Forte, G.; et al. Strategies for delivery of sirnas to ovarian cancer cells. Pharmaceutics 2019, 11, 547. [Google Scholar] [CrossRef] [PubMed]
- Zheng, D.; Feeney, G.P.; Handy, R.D.; Hogstrand, C.; Killeb, P. Uptake epithelia behave in a cell-centric and not systems homeostatic manner in response to zinc depletion and supplementation. Metallomics 2014, 6, 154–165. [Google Scholar] [CrossRef]
- Huang, C.; Cui, X.; Sun, X.; Yang, J.; Li, M. Zinc transporters are differentially expressed in human non-small cell lung cancer. Oncotarget 2016, 7, 66935–66943. [Google Scholar] [CrossRef]
- Cui, X.; Zhang, Y.; Yang, J.; Sun, X.; Hagan, J.P.; Guha, S.; Min Li, M. ZIP4 confers resistance to zinc deficiency-induced apoptosis in pancreatic cancer. Cell Cycle 2014, 13, 1180–1186. [Google Scholar] [CrossRef]
- McAuliffe, S.M.; Morgan, S.L.; Wyant, G.A.; Tran, L.T.; Muto, K.W.; Chen, Y.S.; Chin, K.T.; Partridge, J.C.; Poole, B.B.; Cheng, K.-H.; et al. Targeting Notch, a key pathway for ovarian cancer stem cells, sensitizes tumors to platinum therapy. Proc. Natl. Acad. Sci. USA 2012, 109, 2939–2948. [Google Scholar] [CrossRef]
- Piazzi, G.; Bazzoli, F.; Ricciardiello, L. Epigenetic silencing of Notch signaling in gastrointestinal cancers. Cell Cycle 2012, 11, 4323–4327. [Google Scholar] [CrossRef]
- Aithal, M.G.; Rajeswari, N. Role of Notch signalling pathway in cancer and its association with DNA methylation. J. Genet. 2013, 92, 667–675. [Google Scholar] [CrossRef]
- Wakabayashi, N.; Chartoumpekis, D.V.; Kensler, T.W. Crosstalk between Nrf2 and Notch signaling. Free Radic. Biol. Med. 2015, 88, 158–167. [Google Scholar] [CrossRef] [PubMed]
- Hosseini-Alghaderi, S.; Baron, M. Notch3 in development, health and disease. Biomolecules 2020, 10, 485. [Google Scholar] [CrossRef] [PubMed]
- Yeh, C.H.; Bellon, M.; Nicot, C. FBXW7: A critical tumor suppressor of human cancers. Mol. Cancer 2018, 17, 115. [Google Scholar] [CrossRef] [PubMed]
- Wiechert, A.; Saygin, C.; Thiagarajan, P.S.; Rao, V.S.; Hale, J.S.; Gupta, N.; Hitomi, M.; Nagaraj, B.A.; DiFeo, A.; Justin, D.; et al. Cisplatin induces stemness in ovarian cancer. Oncotarget 2016, 7, 30511–30522. [Google Scholar] [CrossRef] [PubMed]
- Saygin, C.; Matei, D.; Majeti, R.; Reizes, O.; Lathia, J.D. Targeting cancer stemness in the clinic: From hype to hope. Cell Stem. Cell 2019, 24, 25–40. [Google Scholar] [CrossRef] [PubMed]
- Ishiguro, T.; Ohata, H.; Sato, A.; Yamawaki, K.; Enomoto, T.; Okamotoet, K. Tumor-derived spheroids: Relevance to cancer stem cells and clinical applications. Cancer Sci. 2017, 108, 283–289. [Google Scholar] [CrossRef] [PubMed]
- Mayer, B.; Klement, G.; Kaneko, M.; Man, S.; Jothy, S.; Rak, J.; Kerbelet, R.S. Multicellular gastric cancer spheroids recapitulate growth pattern and differentiation phenotype of human gastric carcinomas. Gastroenterology 2001, 121, 839–852. [Google Scholar] [CrossRef] [PubMed]
- Pannuti, A.; Foreman, K.; Rizzo, P.; Osipo, C.; Golde, T.; Osborne, B.; Mieleet, L. Targeting Notch to target cancer stem cells. Clin. Cancer Res. 2010, 16, 3141–3152. [Google Scholar] [CrossRef]
- Takebe, N.; Miele, L.; Harris, P.J.; Jeong, W.; Bando, H.; Kahn, M.; Yang, X.S.; Percy, S. Targeting Notch, Hedgehog, and Wnt pathways in cancer stem cells: Clinical update. Nat. Rev. Clin. Oncol. 2015, 12, 445–464. [Google Scholar] [CrossRef]
- Takebe, N.; Nguyen, D.; Yang, S.X. Targeting notch signaling pathway in cancer: Clinical development advances and challenges. Pharmacol. Ther. 2014, 141, 140–149. [Google Scholar] [CrossRef]
- Agliano, A.; Calvo, A.; Box, C. The challenge of targeting cancer stem cells to halt metastasis. Semin. Cancer Biol. 2017, 44, 25–42. [Google Scholar] [CrossRef] [PubMed]
- Dwivedi, A.R.; Thakur, A.; Kumar, V.; Skvortsova, I.; Kumar, V. Targeting cancer stem cells pathways for the effective treatment of cancer. Curr. Drug Targets 2020, 21, 258–278. [Google Scholar] [CrossRef] [PubMed]
- Jung, J.G.; Stoeck, A.; Guan, B.; Wu, R.-C.; Zhu, H.; Blackshaw, S.; Shih, I.-M.; Wang, T.-W. Notch3 interactome analysis identified WWP2 as a negative regulator of Notch3 signaling in ovarian cancer. PLoS Genet. 2014, 10, e1004751. [Google Scholar] [CrossRef] [PubMed]
- Shah, M.M.; Zerlin, M.; Li, B.L.; Herzog, T.J.; Kitajewski, J.K.; Wrightet, J.D. The role of Notch and gamma-secretase inhibition in an ovarian cancer model. Anticancer Res. 2013, 33, 801–808. [Google Scholar] [PubMed]
- Groeneweg, J.W.; DiGloria, C.M.; Yuan, J.; Richardson, W.S.; Growdon, W.B.; Sathyanarayanan, S.; Foster, R.; Rueda, B.R. Inhibition of notch signaling in combination with Paclitaxel reduces platinum-resistant ovarian tumor growth. Front. Oncol. 2014, 4, 171. [Google Scholar] [CrossRef] [PubMed]
- Anglesio, M.S.; Wiegand, K.C.; Melnyk, N.; Chow, C.; Salamanca, C.; Prentice, L.M.; Senz, J.; Yang, W.; Spillman, M.A.; Cochrane, D.R.; et al. Type-specific cell line models for type-specific ovarian cancer research. PLoS ONE 2013, 8, e72162. [Google Scholar] [CrossRef]
- Mitra, A.K.; Davis, D.A.; Tomar, S.; Roy, L.; Gurler, H.; Xie, J.; Lantvit, D.D.; Cardenas, H.; Fang, F.; Liu, Y.; et al. In vivo tumor growth of high-grade serous ovarian cancer cell lines. Gynecol. Oncol. 2015, 138, 372–377. [Google Scholar] [CrossRef]
- Bae, Y.; Yang, T.; Zeng, H.-C.; Campeau, P.M.; Chen, Y.; Bertin, T.; Dawson, B.C.; Munivez, E.; Tao, J.; Lee, B.H. miRNA-34c regulates Notch signaling during bone development. Hum. Mol. Genet. 2012, 21, 2991–3000. [Google Scholar] [CrossRef]
- Chen, S.; Lee, B.H.; Bae, Y. Notch signaling in skeletal stem cells. Calcif. Tissue Int. 2014, 94, 68–77. [Google Scholar] [CrossRef]
- Swiatek, P.J.; Lindsell, C.E.; del Amo, F.F.; Weinmaster, G.; Gridley, T. Notch1 is essential for postimplantation development in mice. Genes Dev. 1994, 8, 707–719. [Google Scholar] [CrossRef]
- Hamada, Y.; Kadokawa, Y.; Okabe, M.; Ikawa, M.; Coleman, J.R.; Tsujimoto, Y. Mutation in ankyrin repeats of the mouse Notch2 gene induces early embryonic lethality. Development 1999, 126, 3415–3424. [Google Scholar]
- Kitamoto, T.; Takahashi, K.; Takimoto, H.; Tomizuka, K.; Hayasaka, M.; Tabira, T.; Hanaokaet, K. Functional redundancy of the Notch gene family during mouse embryogenesis: Analysis of Notch gene expression in Notch3-deficient mice. Biochem. Biophys. Res. Commun. 2005, 331, 1154–1162. [Google Scholar] [CrossRef] [PubMed]
- Ran, Y.; Hossain, F.; Pannuti, A.; Lessard, C.B.; Ladd, G.L.; Jung, J.I.; Minter, L.M.; Osborne, B.A.; Miele, L.; Golde, T.E. Gamma-Secretase inhibitors in cancer clinical trials are pharmacologically and functionally distinct. EMBO Mol. Med. 2017, 9, 950–966. [Google Scholar] [CrossRef] [PubMed]
- De Strooper, B.; Gutierrez, L.C. Learning by failing: Ideas and concepts to tackle gamma-secretases in Alzheimer’s disease and beyond. Annu. Rev. Pharmacol. Toxicol. 2015, 55, 419–437. [Google Scholar] [CrossRef] [PubMed]
- Villalobos, V.M.; Hall, F.; Jimeno, A.; Gore, L.; Kern, K.; Cesari, R.; Huang, B.; Schowinsky, J.T.; Blatchford, P.J.; Hoffner, B.; et al. Long-term follow-up of desmoid fibromatosis treated with PF-03084014, an oral gamma secretase inhibitor. Ann. Surg. Oncol. 2018, 25, 768–775. [Google Scholar] [CrossRef]
- Ileana Dumbrava, E.E.; Mills, G.B.; Yap, T.A. Targeting gamma secretase: Has progress moved up a Notch? Ann. Oncol. 2018, 29, 1889–1891. [Google Scholar] [CrossRef] [PubMed]
- Pine, S.R. Rethinking gamma-secretase inhibitors for treatment of non-small-cell lung cancer: Is notch the target? Clin. Cancer Res. 2018, 24, 6136–6141. [Google Scholar] [CrossRef]
- Zhang, Y.; Bharadwaj, U.; Logsdon, C.D.; Chen, C.; Yao, Q.; Min Li, M. ZIP4 regulates pancreatic cancer cell growth by activating IL-6/STAT3 pathway through zinc finger transcription factor CREB. Clin. Cancer Res. 2010, 16, 1423–1430. [Google Scholar] [CrossRef]
- Cai, H.; Xu, Y. The role of LPA and YAP signaling in long-term migration of human ovarian cancer cells. Cell Commun. Signal. 2013, 11, 31. [Google Scholar] [CrossRef]


| Cell Type | Injection Site | Cell No. | Mice No. | Survival Days | Ascites Vol. (mL) | Tumor No. | Tumor Sites |
| PE04 ZIP4+ | I.P. | 10K | 7/7 | 47 ± 10 | 26.90 ± 14.55 | 249 ± 111 | D, F, L, M, Om, Ov, P, SI, PW |
| PE04 ZIP4− | I.P. | 10K | 0/5 | 267 ± 30 | 0.00 | 0 | NONE |
| PE04 ALDH+ | I.P. | 10K | 5/5 | 91 ± 13 | 14.00 ± 2.35 | 95 ± 44 | D, F, L, M, Ov, PW |
| PE04 ALDH- | I.P. | 10K | 1/4 | 217 | 1.50 | 13 | D, W |
| PEA2 ZIP4+ | I.P. | 10K | 5/5 | 102 ± 11 | 1.00 ± 0.60 | 17 ± 4 | Ov, M, P, SI, PW, L |
| PEA2 ZIP4− | I.P. | 10K | 1/3 | 238 | 1.00 | 12 | PW, M |
| Cell Type | Injection Site | Cell No. | Mice No. | Survival Days | Tumor Size (cm3) | Tumor No. | Tumor Sites |
| PE04 ZIP4+ | S.C. | 100 | 3/4 | 110 ± 5 | 0.17 ± 0.16 | 1 | Front Left |
| PE04 ZIP4+ | S.C. | 200 | 4/4 | 110 ± 5 | 2.24 ± 1.13 | 1 | Rear Left |
| PE04 ALDH+ | S.C. | 100 | 2/3 | 110 ± 5 | 0.04 ± 0.06 | 1 | Front Right |
| PE04 ALDH+ | S.C. | 200 | 3/3 | 110 ± 5 | 1.41 ± 0.76 | 1 | Rear Right |
| PEA2 ZIP4+ | S.C. | 100 | 3/3 | 81 ± 21 | 2.30 ± 3.75 | 1 | Front Left |
| PEA2 ZIP4+ | S.C. | 200 | 3/3 | 81 ± 21 | 5.85 ± 5.20 | 1 | Rear Left |
| PEA2 ALDH+ | S.C. | 100 | 3/3 | 81 ± 21 | 0.02 ± 0.02 | 1 | Front Right |
| PEA2 ALDH+ | S.C. | 200 | 3/3 | 81 ± 21 | 3.14 ± 5.12 | 1 | Rear Right |
| Cell Type | Injection Site | Cell No. | Mice No. | Survival Days | Ascites Vol. (mL) | Tumor No. | Tumor Sites |
| PE04 | I.P. | 5 × 10⁶ | 5/5 | 42 ± 4 | 12.10 ± 3.25 | 137 ± 27 | D, M, Om, Ov, P, SI, PW |
| PE04-NOTCH3-KO | I.P. | 5 × 10⁶ | 6/6 | 161 ± 21 | 4.72 ± 1.53 | 36 ± 18 | D, M, Ov, PW |
Publisher’s Note: MDPI stays neutral with regard to jurisdictional claims in published maps and institutional affiliations. |
© 2020 by the authors. Licensee MDPI, Basel, Switzerland. This article is an open access article distributed under the terms and conditions of the Creative Commons Attribution (CC BY) license (http://creativecommons.org/licenses/by/4.0/).
Share and Cite
Fan, Q.; Zhang, W.; Emerson, R.E.; Xu, Y. ZIP4 Is a Novel Cancer Stem Cell Marker in High-Grade Serous Ovarian Cancer. Cancers 2020, 12, 3692. https://doi.org/10.3390/cancers12123692
Fan Q, Zhang W, Emerson RE, Xu Y. ZIP4 Is a Novel Cancer Stem Cell Marker in High-Grade Serous Ovarian Cancer. Cancers. 2020; 12(12):3692. https://doi.org/10.3390/cancers12123692
Chicago/Turabian StyleFan, Qipeng, Wen Zhang, Robert E. Emerson, and Yan Xu. 2020. "ZIP4 Is a Novel Cancer Stem Cell Marker in High-Grade Serous Ovarian Cancer" Cancers 12, no. 12: 3692. https://doi.org/10.3390/cancers12123692
APA StyleFan, Q., Zhang, W., Emerson, R. E., & Xu, Y. (2020). ZIP4 Is a Novel Cancer Stem Cell Marker in High-Grade Serous Ovarian Cancer. Cancers, 12(12), 3692. https://doi.org/10.3390/cancers12123692