Insights on TAM Formation from a Boolean Model of Macrophage Polarization Based on In Vitro Studies

 ,
,  , ,
, , 
Abstract
:Simple Summary
Abstract
1. Introduction
2. Results
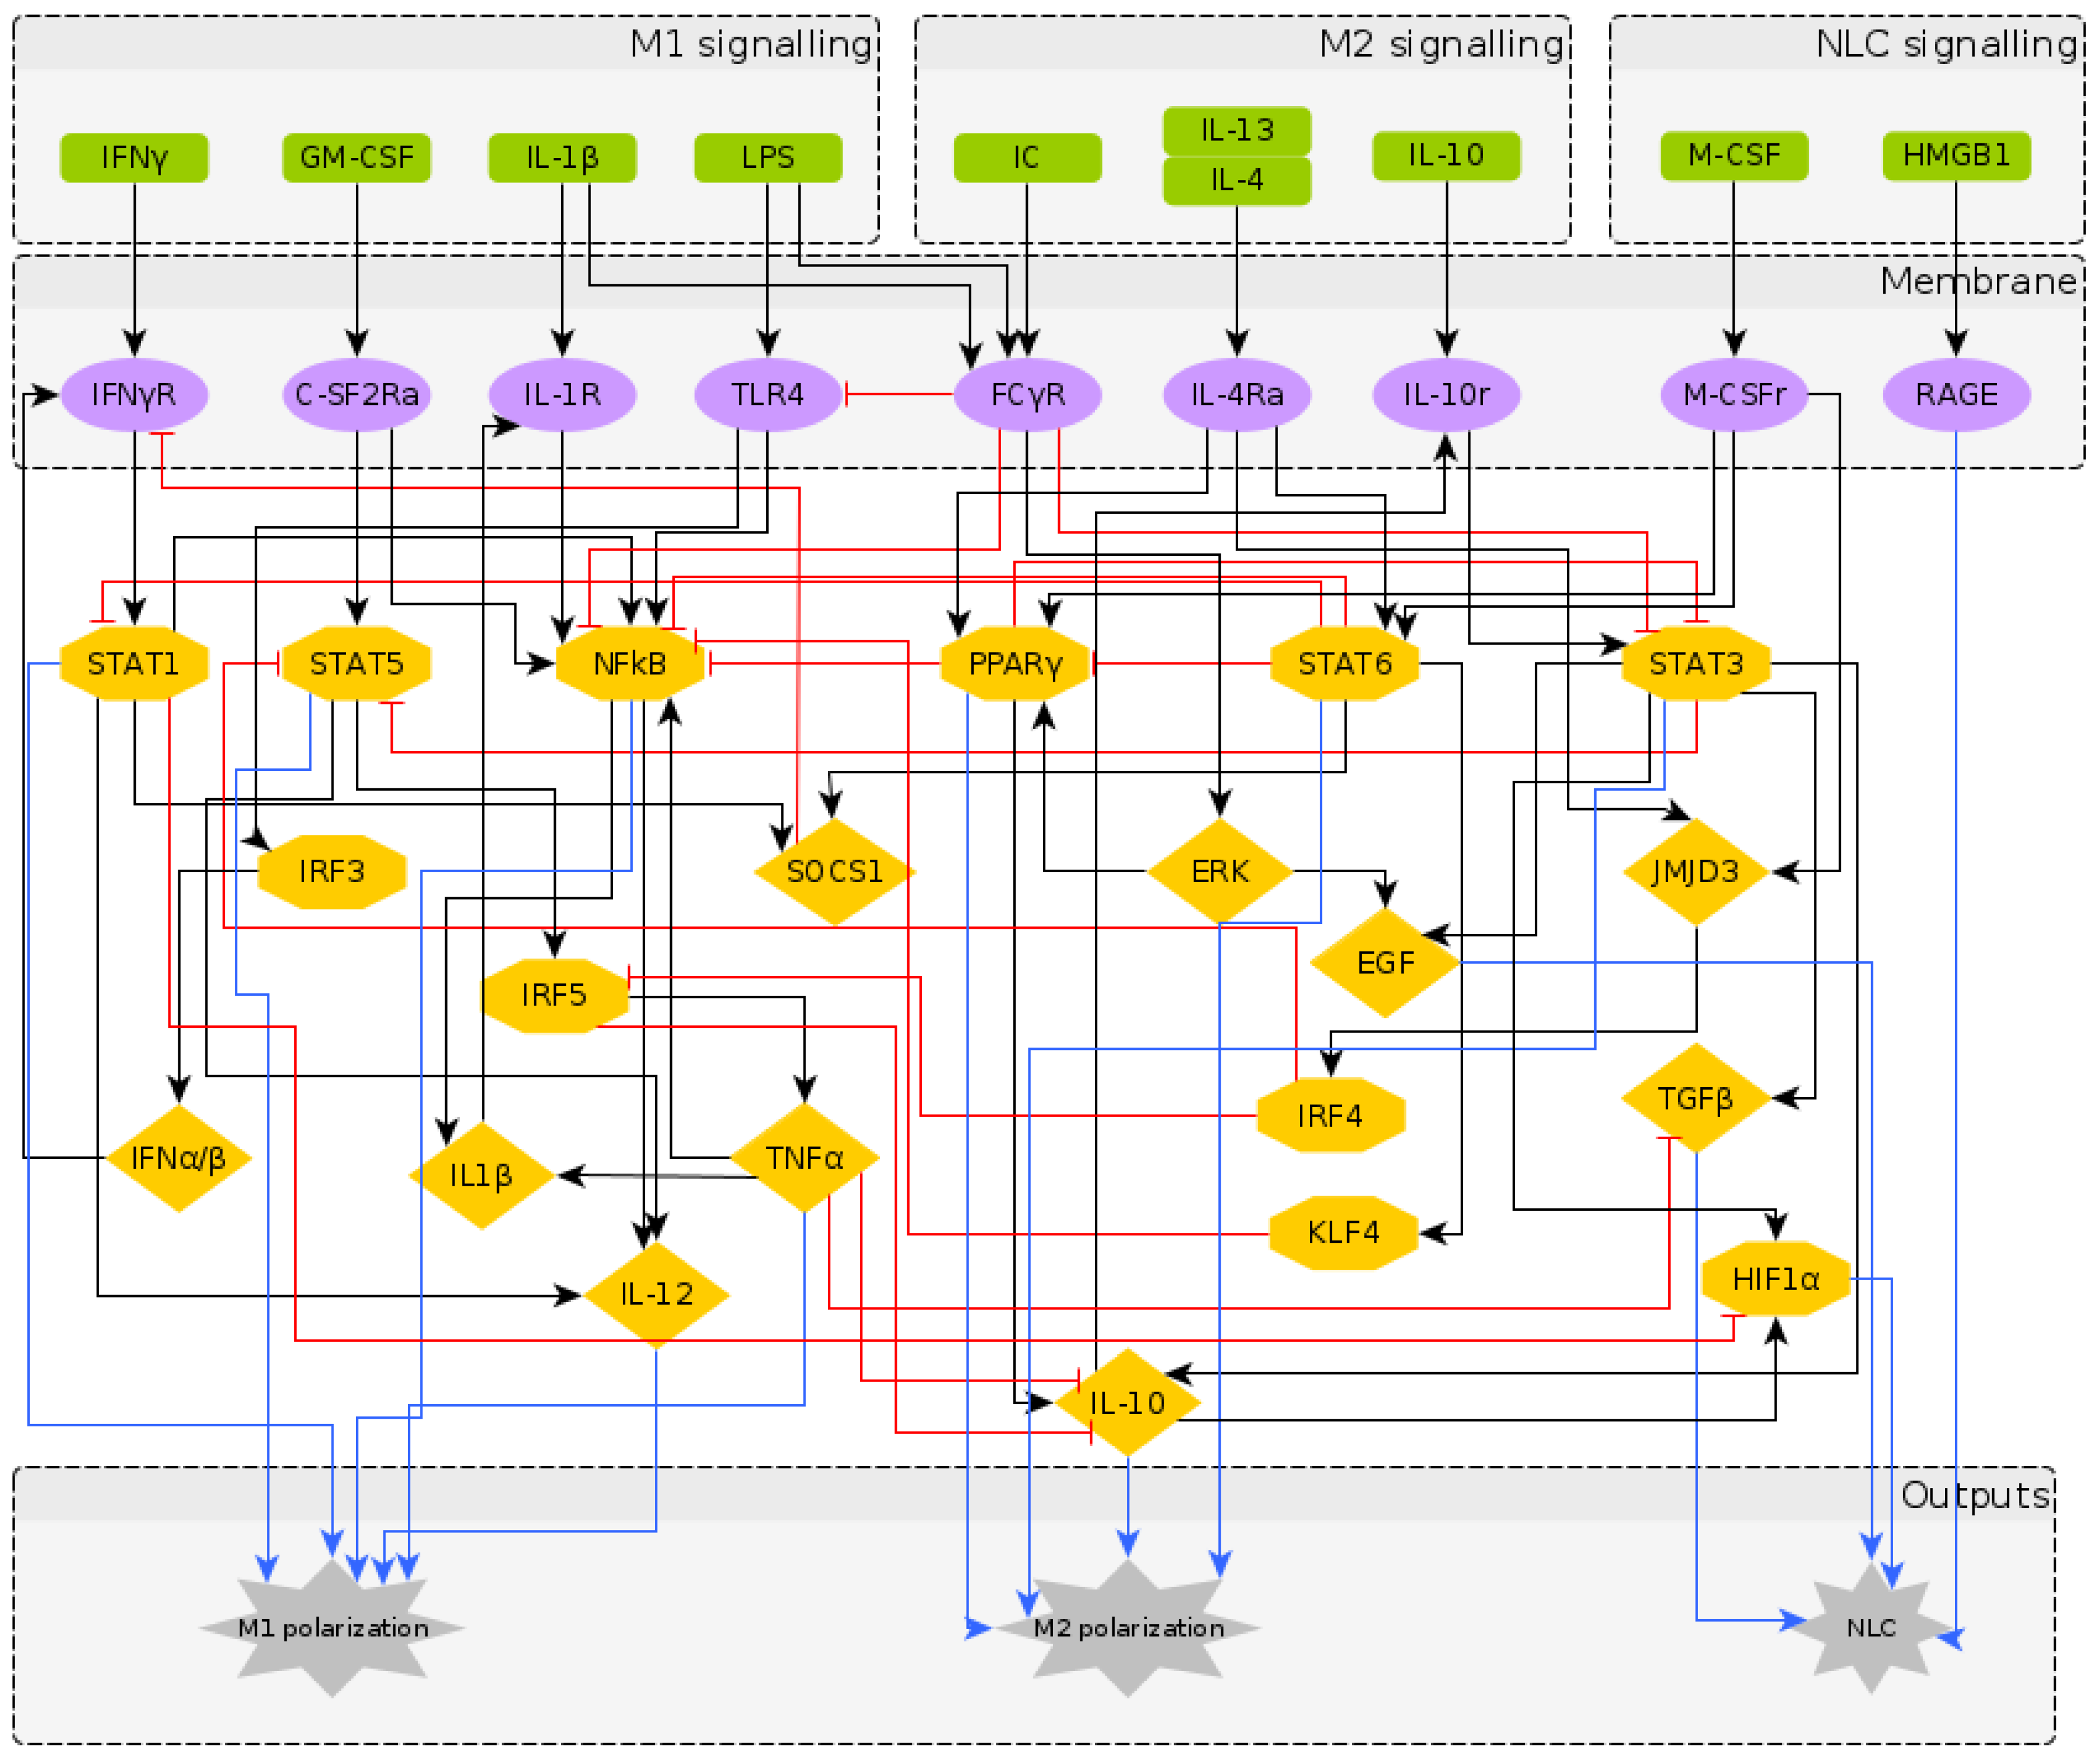
2.1. Reconstruction of the Regulatory Network Leading to NLC Formation
2.2. A Boolean Model of Macrophage Polarization
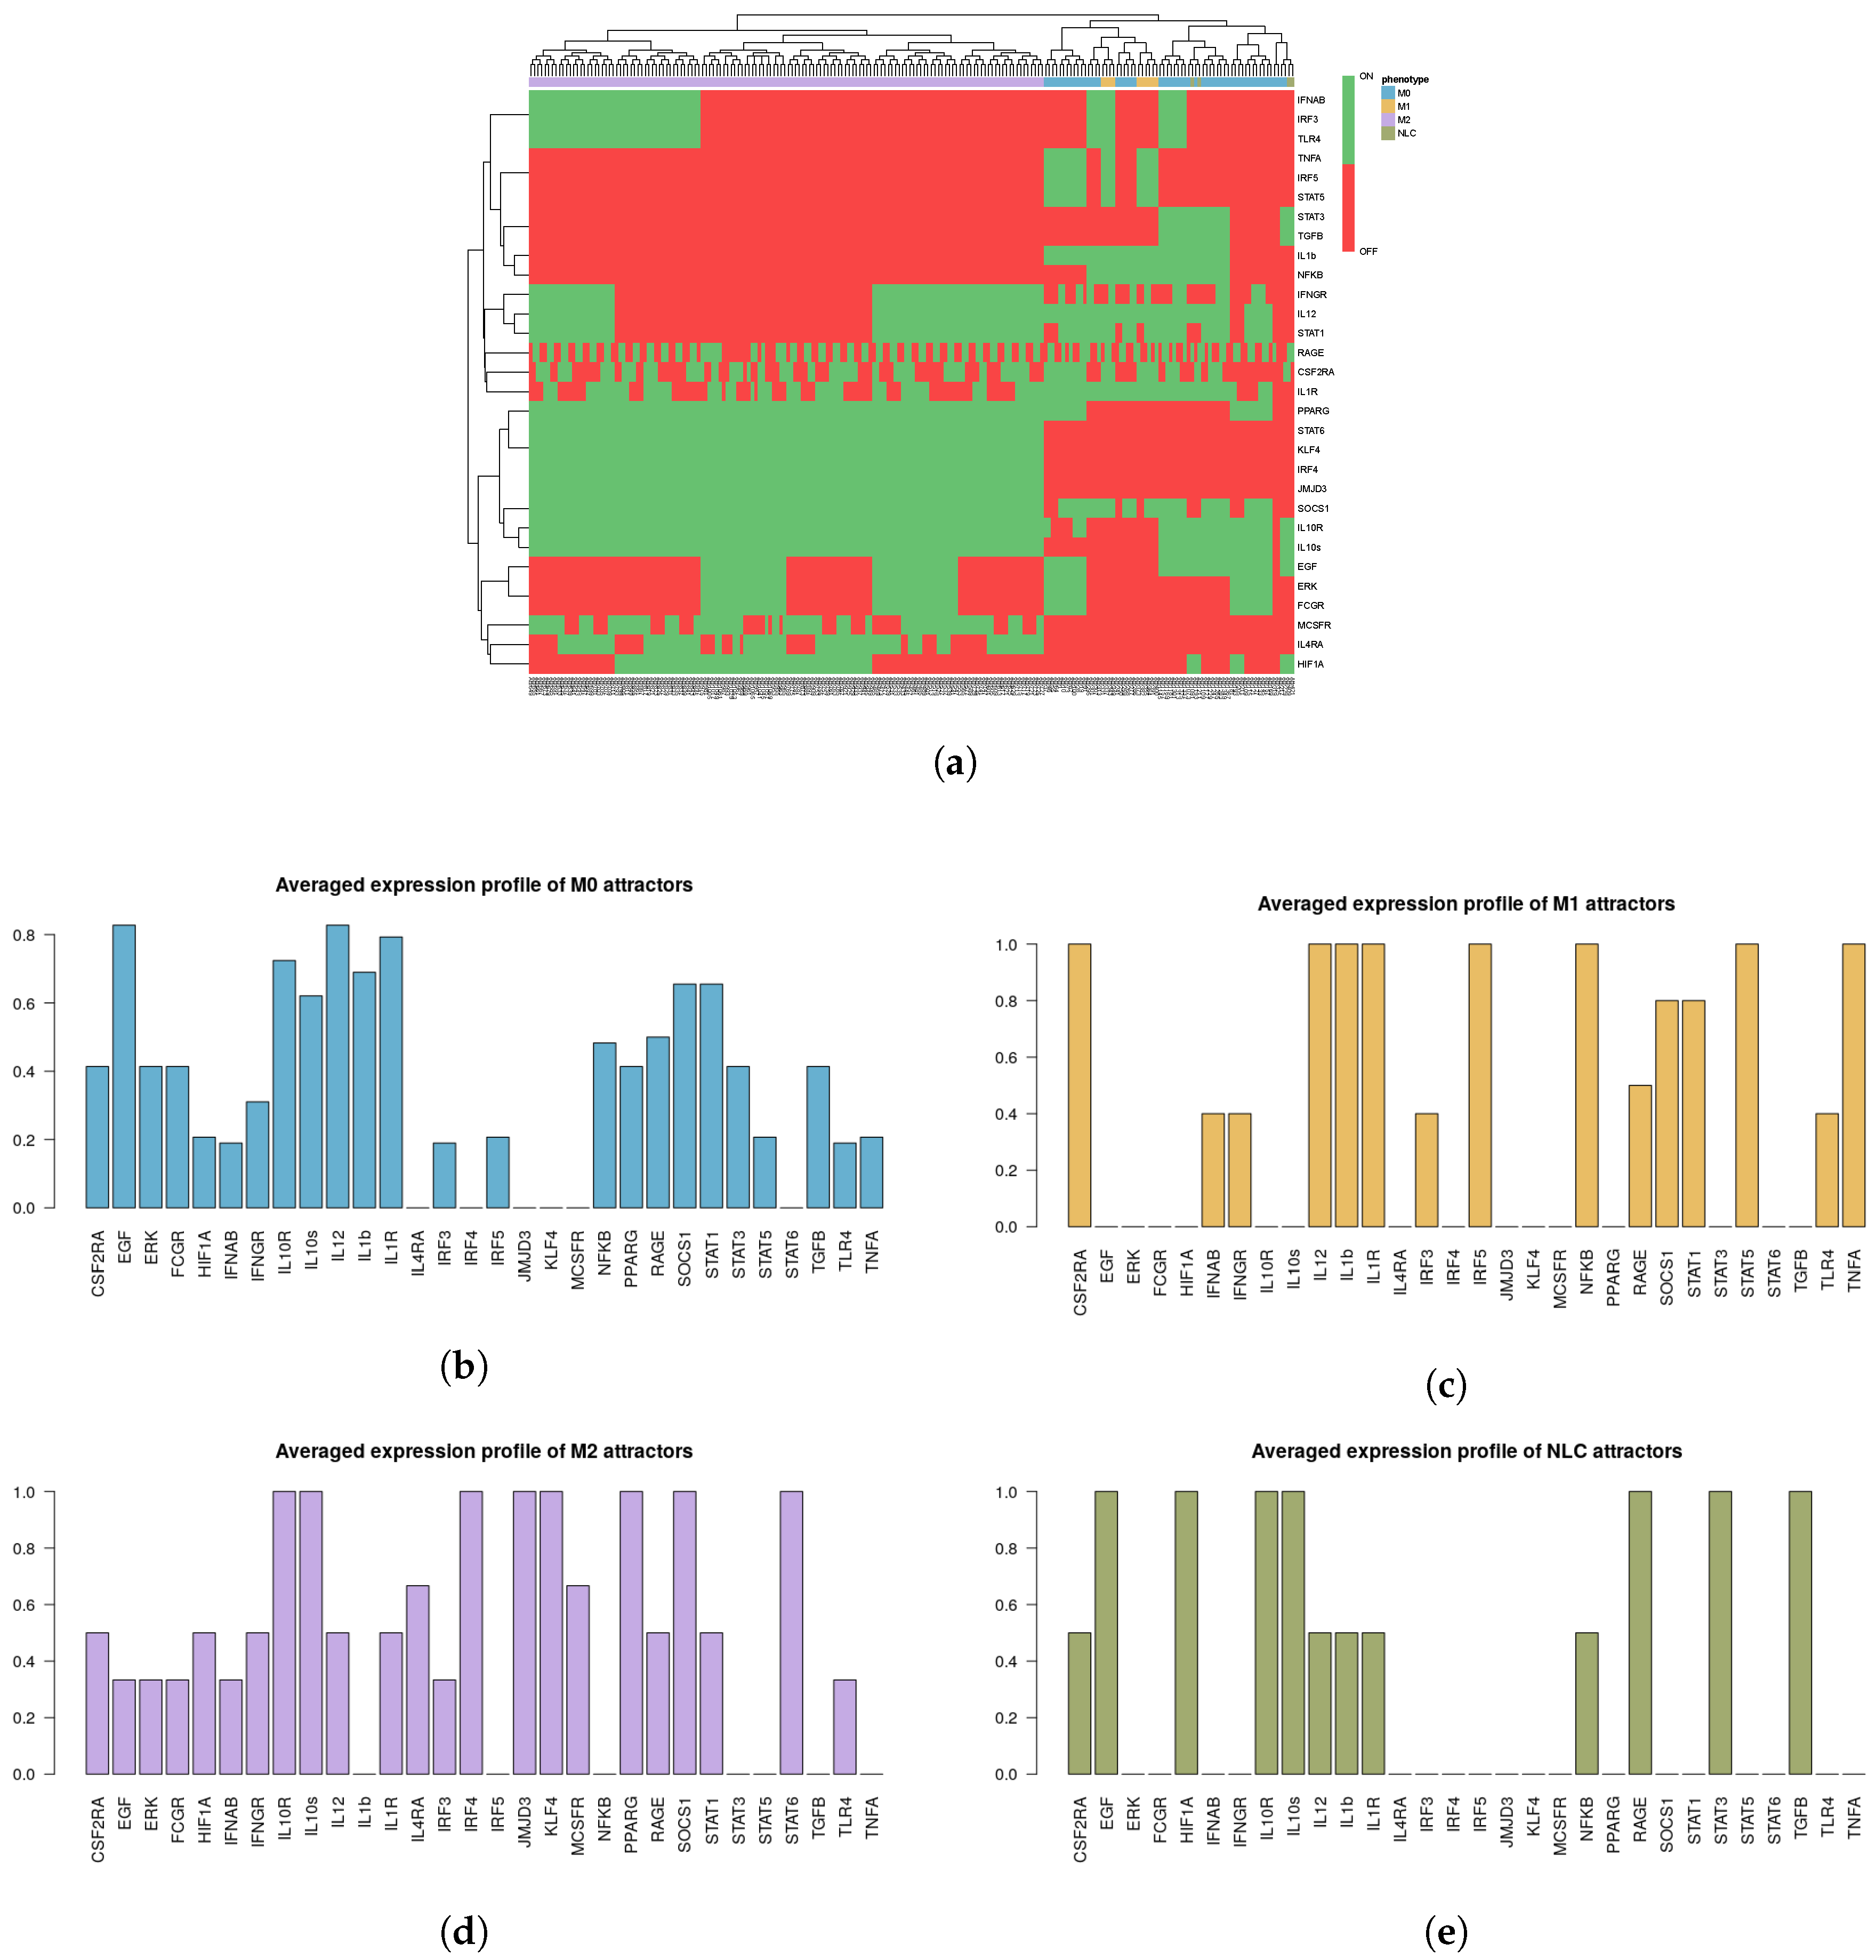
2.3. Phenotype Identification through Interpretation of the Attractors
2.3.1. Interpreting Attractors based on a Supervised Method
- M1: IL-12, NF-B, TNF and STAT1 or STAT5 active;
- M2: IL-10, STAT3 or STAT6, PPAR active;
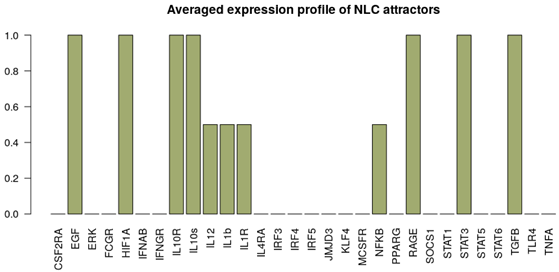
- NLC: TGF, HIF1, EGF, RAGE active;
- M0: M0 attractors + Attractors not falling in any of the above categories.
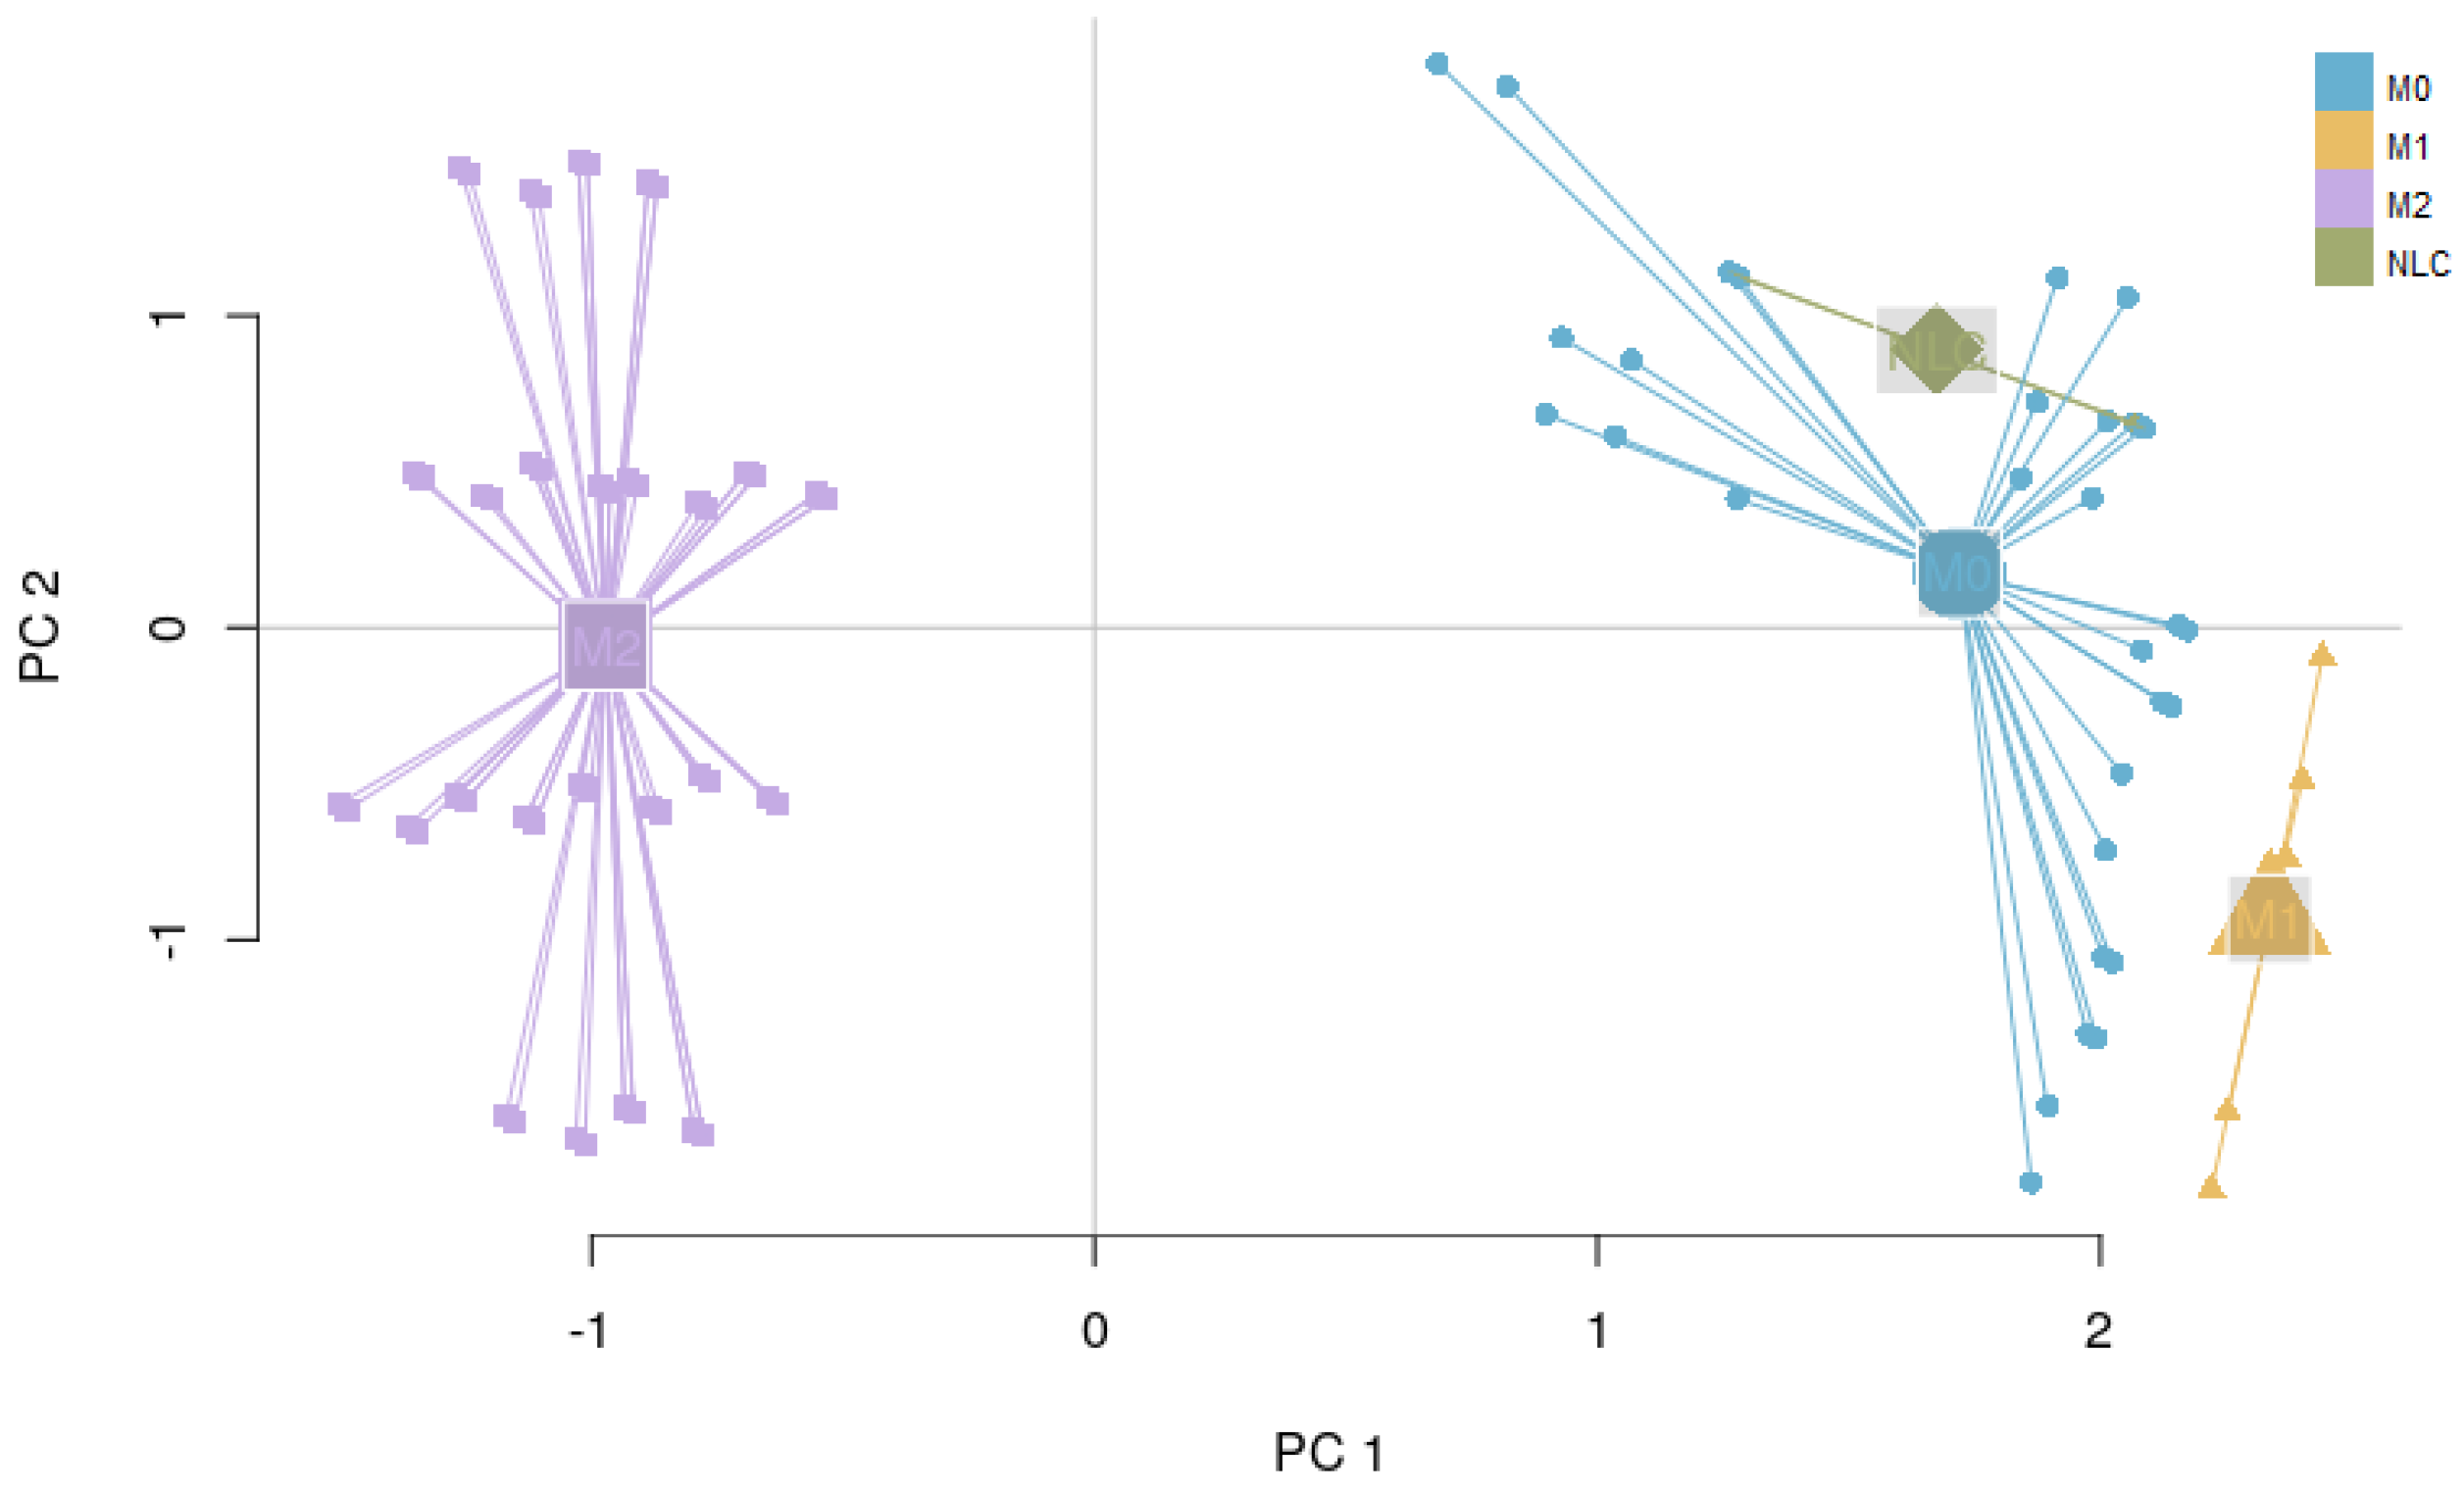
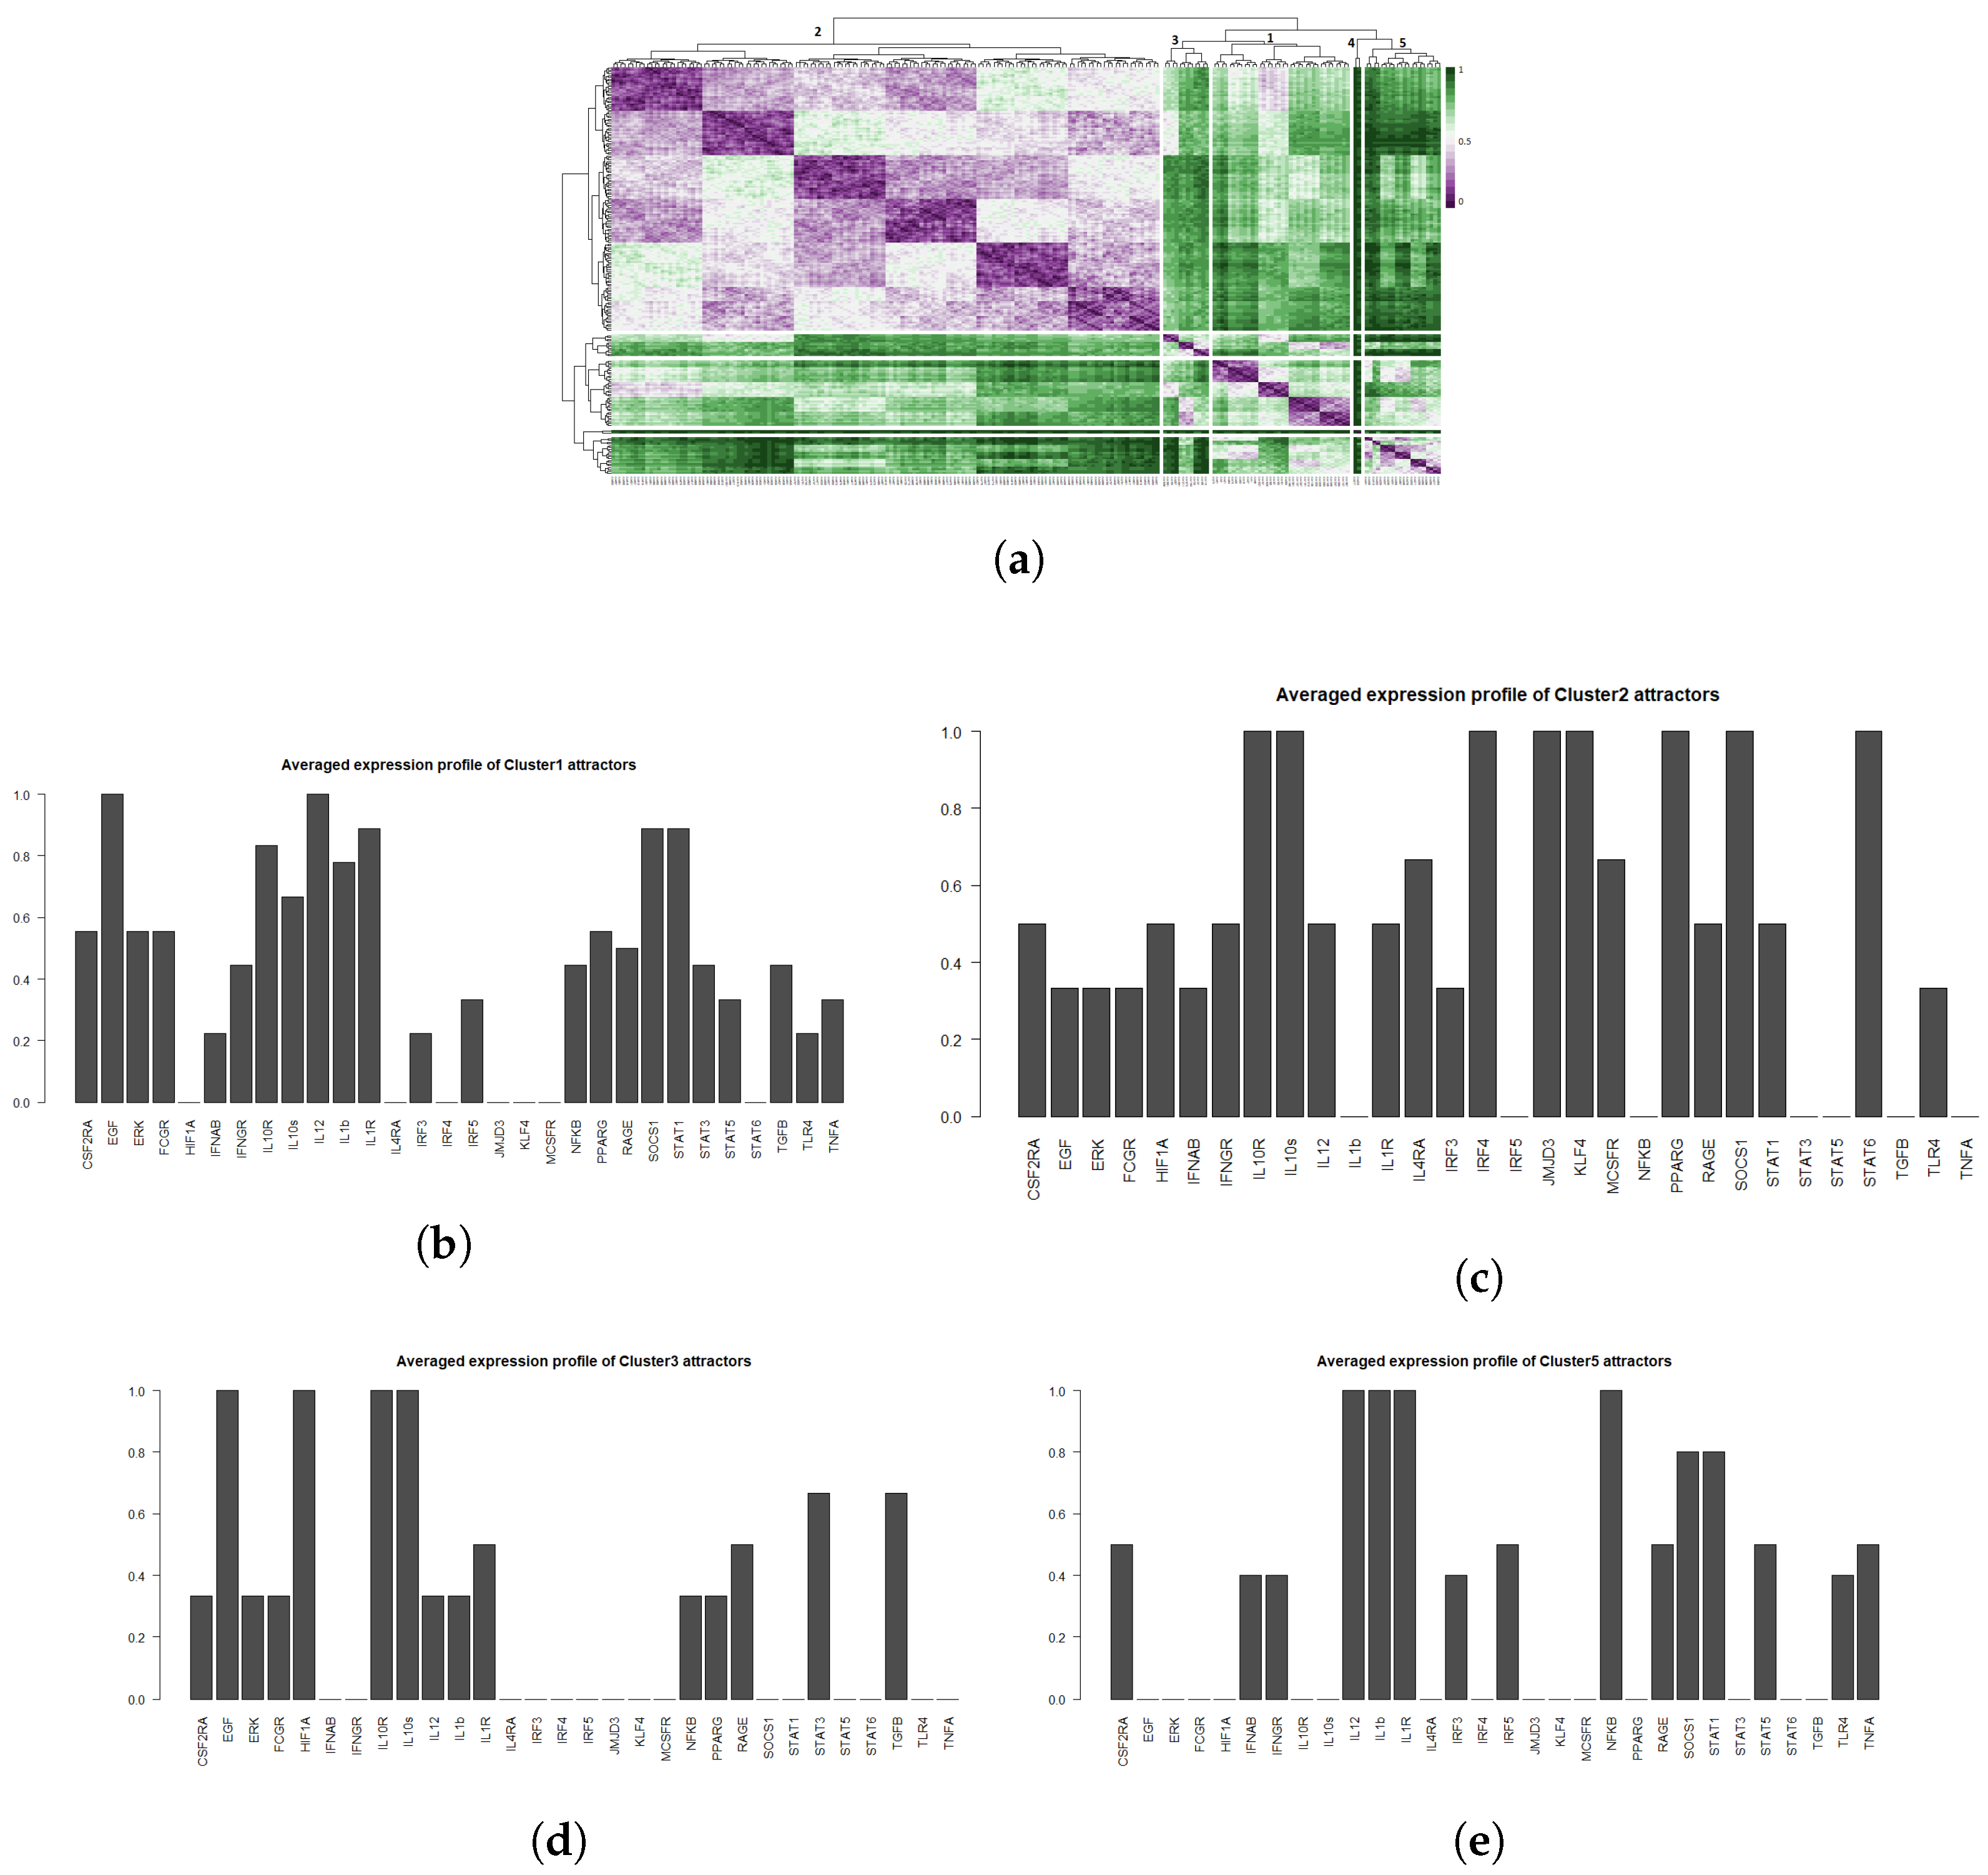
2.3.2. Interpreting Attractors Based on an Unsupervised Method
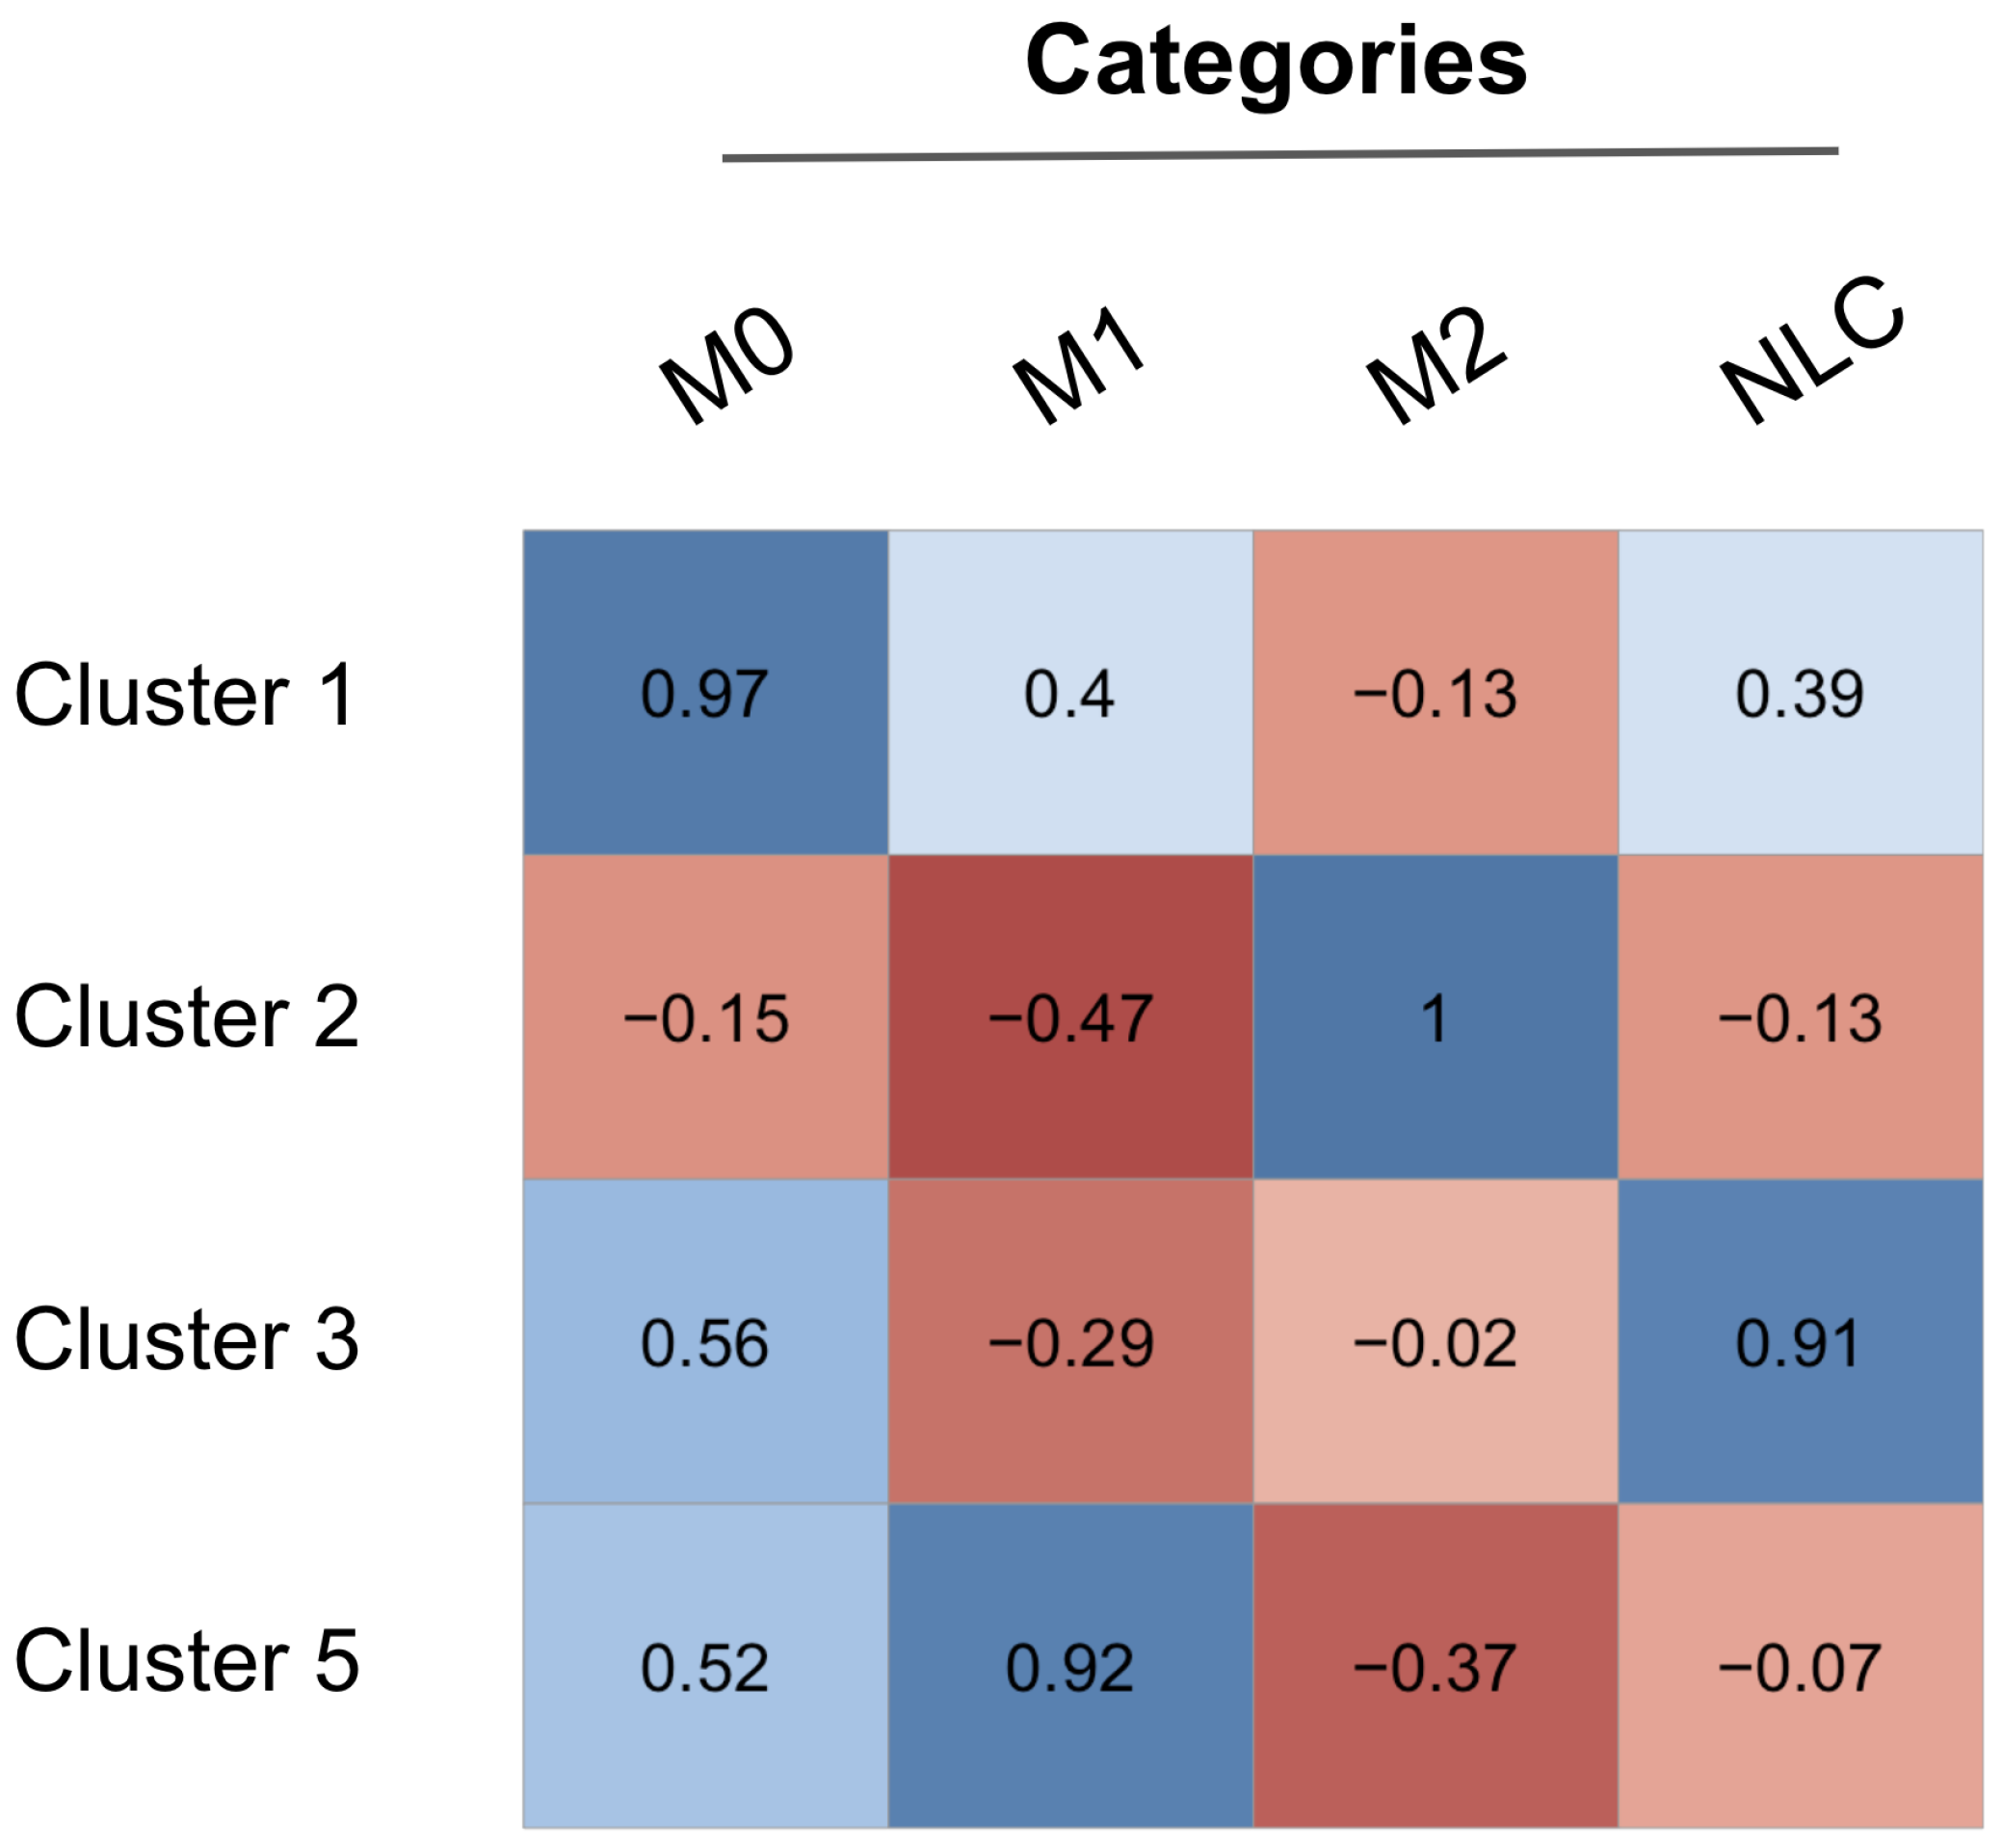
2.3.3. Robustness of Attractor Interpretation Independent of Annotation Method
3. Model Validation through In Silico Perturbations
4. Discussion
5. Methods
5.1. Boolean Model Implementation
- synchronous updating method: at each time step, all the nodes are updated simultaneously, assuming that all the interactions in the system require the same time to occur. Importantly, the state space is characterized by non-overlapping basins of attractions.
- asynchronous updating method: at each time step, the updated nodes are chosen randomly (General Asynchronous, Random Asynchronous) or according to their characteristic updating time, while the system’s state will be characterized by overlapping basins of attractions.
5.2. Calculating the Attractor Similarity Matrix
5.3. Calculating the Transcription Factor Activities
6. Conclusions
Supplementary Materials
Author Contributions
Funding
Acknowledgments
Conflicts of Interest
Appendix A
Appendix A.1. M1 Pathway
Appendix A.2. M2 Pathway
References
- Foey, A.D. Macrophages—Masters of Immune Activation, Suppression and Deviation. Immune Response Act. 2014. [Google Scholar] [CrossRef] [Green Version]
- Martinez, F.O.; Gordon, S. The M1 and M2 paradigm of macrophage activation: Time for reassessment. F1000Prime Rep. 2014, 6, 13. [Google Scholar] [CrossRef] [PubMed] [Green Version]
- Murray, P.J.; Wynn, T.A. Obstacles and opportunities for understanding macrophage polarization. J. Leukoc. Biol. 2011, 89, 557–563. [Google Scholar] [CrossRef] [PubMed]
- Mantovani, A.; Sica, A.; Locati, M. Macrophage polarization comes of age. Immunity 2005, 23, 344–346. [Google Scholar] [CrossRef] [PubMed] [Green Version]
- Mosser, D.M.; Edwards, J.P. Exploring the full spectrum of macrophage activation. Nat. Rev. Immunol. 2008, 8, 958–969. [Google Scholar] [CrossRef] [PubMed]
- Locati, M.; Curtale, G.; Mantovani, A. Diversity, Mechanisms, and Significance of Macrophage Plasticity. Annu. Rev. Pathol. Mech. Dis. 2020, 15, 123–147. [Google Scholar] [CrossRef] [PubMed] [Green Version]
- Gordon, S.; Martinez, F.O. Alternative activation of macrophages: Mechanism and functions. Immunity 2010, 32, 593–604. [Google Scholar] [CrossRef] [Green Version]
- Ivashkiv, L.B. Epigenetic regulation of macrophage polarization and function. Trends Immunol. 2013, 34, 216–223. [Google Scholar] [CrossRef] [Green Version]
- Cai, L.; Michelakos, T.; Deshpande, V.; Arora, K.S.; Yamada, T.; Ting, D.T.; Taylor, M.S.; Fernandez-del Castillo, C.; Warshaw, A.L.; Lillemoe, K.D.; et al. Role of tumor-associated macrophages in the clinical course of pancreatic neuroendocrine tumors (PanNETs). Clin. Cancer Res. 2019, 25, 2644–2655. [Google Scholar] [CrossRef]
- Grossman, J.G.; Nywening, T.M.; Belt, B.A.; Panni, R.Z.; Krasnick, B.A.; DeNardo, D.G.; Hawkins, W.G.; Goedegebuure, S.P.; Linehan, D.C.; Fields, R.C. Recruitment of CCR2+ tumor associated macrophage to sites of liver metastasis confers a poor prognosis in human colorectal cancer. Oncoimmunology 2018, 7, e1470729. [Google Scholar] [CrossRef] [Green Version]
- Wynn, T.A.; Chawla, A.; Pollard, J.W. Macrophage biology in development, homeostasis and disease. Nature 2013, 496, 445–455. [Google Scholar] [CrossRef] [PubMed]
- Bingle, L.; Brown, N.; Lewis, C.E. The role of tumour-associated macrophages in tumour progression: Implications for new anticancer therapies. J. Pathol. A J. Pathol. Soc. Great Br. Irel. 2002, 196, 254–265. [Google Scholar] [CrossRef] [PubMed]
- Mantovani, A.; Marchesi, F.; Malesci, A.; Laghi, L.; Allavena, P. Tumour-associated macrophages as treatment targets in oncology. Nat. Rev. Clin. Oncol. 2017, 14, 399. [Google Scholar] [CrossRef] [PubMed]
- DeNardo, D.G.; Brennan, D.J.; Rexhepaj, E.; Ruffell, B.; Shiao, S.L.; Madden, S.F.; Gallagher, W.M.; Wadhwani, N.; Keil, S.D.; Junaid, S.A.; et al. Leukocyte complexity predicts breast cancer survival and functionally regulates response to chemotherapy. Cancer Discov. 2011, 1, 54–67. [Google Scholar] [CrossRef] [PubMed] [Green Version]
- Doedens, A.L.; Stockmann, C.; Rubinstein, M.P.; Liao, D.; Zhang, N.; DeNardo, D.G.; Coussens, L.M.; Karin, M.; Goldrath, A.W.; Johnson, R.S. Macrophage expression of hypoxia-inducible factor-1α suppresses T-cell function and promotes tumor progression. Cancer Res. 2010, 70, 7465–7475. [Google Scholar] [CrossRef] [PubMed] [Green Version]
- Movahedi, K.; Laoui, D.; Gysemans, C.; Baeten, M.; Stangé, G.; Van den Bossche, J.; Mack, M.; Pipeleers, D.; In’t Veld, P.; De Baetselier, P.; et al. Different tumor microenvironments contain functionally distinct subsets of macrophages derived from Ly6C (high) monocytes. Cancer Res. 2010, 70, 5728–5739. [Google Scholar] [CrossRef] [Green Version]
- Larionova, I.; Kazakova, E.; Patysheva, M.; Kzhyshkowska, J. Transcriptional, Epigenetic and Metabolic Programming of Tumor-Associated Macrophages. Cancers 2020, 12, 1411. [Google Scholar] [CrossRef]
- Ruffell, B.; Chang-Strachan, D.; Chan, V.; Rosenbusch, A.; Ho, C.M.; Pryer, N.; Daniel, D.; Hwang, E.S.; Rugo, H.S.; Coussens, L.M. Macrophage IL-10 blocks CD8+ T cell-dependent responses to chemotherapy by suppressing IL-12 expression in intratumoral dendritic cells. Cancer Cell 2014, 26, 623–637. [Google Scholar] [CrossRef] [Green Version]
- Gatenby, R.A.; Maini, P.K. Mathematical oncology: Cancer summed up. Nature 2003, 421, 321. [Google Scholar] [CrossRef] [Green Version]
- Barabási, A.L.; Gulbahce, N.; Loscalzo, J. Network medicine: A network-based approach to human disease. Nat. Rev. Genet. 2011, 12, 56–68. [Google Scholar] [CrossRef] [Green Version]
- Gulfidan, G.; Turanli, B.; Beklen, H.; Sinha, R.; Arga, K.Y. Pan-cancer mapping of differential protein-protein interactions. Sci. Rep. 2020, 10, 3272. [Google Scholar] [CrossRef] [PubMed]
- Albert, I.; Thakar, J.; Li, S.; Zhang, R.; Albert, R. Boolean network simulations for life scientists. Source Code Biol. Med. 2008, 3, 16. [Google Scholar] [CrossRef] [PubMed] [Green Version]
- Kervizic, G.; Corcos, L. Dynamical modeling of the cholesterol regulatory pathway with Boolean networks. BMC Syst. Biol. 2008, 2, 99. [Google Scholar] [CrossRef] [PubMed] [Green Version]
- Saadatpour, A.; Wang, R.S.; Liao, A.; Liu, X.; Loughran, T.P.; Albert, I.; Albert, R. Dynamical and structural analysis of a t cell survival network identifies novel candidate therapeutic targets for large granular lymphocyte leukemia. PLoS Comput. Biol. 2011, 7. [Google Scholar] [CrossRef] [PubMed] [Green Version]
- Naldi, A.; Carneiro, J.; Chaouiya, C.; Thieffry, D. Diversity and plasticity of Th cell types predicted from regulatory network modelling. PLoS Comput. Biol. 2010, 6, e1000912. [Google Scholar] [CrossRef] [PubMed]
- Abou-Jaoudé, W.; Traynard, P.; Monteiro, P.T.; Saez-Rodriguez, J.; Helikar, T.; Thieffry, D.; Chaouiya, C. Logical modeling and dynamical analysis of cellular networks. Front. Genet. 2016, 7, 94. [Google Scholar] [CrossRef] [PubMed]
- Palma, A.; Jarrah, A.S.; Tieri, P.; Cesareni, G.; Castiglione, F. Gene regulatory network modeling of macrophage differentiation corroborates the continuum hypothesis of polarization states. Front. Physiol. 2018, 9, 1659. [Google Scholar] [CrossRef] [Green Version]
- Kondratova, M.; Czerwinska, U.; Sompairac, N.; Amigorena, S.D.; Soumelis, V.; Barillot, E.; Zinovyev, A.; Kuperstein, I. A multiscale signalling network map of innate immune response in cancer reveals cell heterogeneity signatures. Nat. Commun. 2019, 10, 4808. [Google Scholar] [CrossRef] [Green Version]
- Ramirez, R.; Herrera, A.M.; Ramirez, J.; Qian, C.; Melton, D.W.; Shireman, P.K.; Jin, Y.F. Deriving a Boolean dynamics to reveal macrophage activation with in vitro temporal cytokine expression profiles. BMC Bioinform. 2019, 20, 725. [Google Scholar] [CrossRef] [Green Version]
- Razzaq, M.; Paulevé, L.; Siegel, A.; Saez-Rodriguez, J.; Bourdon, J.; Guziolowski, C. Computational discovery of dynamic cell line specific Boolean networks from multiplex time-course data. PLoS Comput. Biol. 2018, 14, e1006538. [Google Scholar] [CrossRef]
- Martin, S.; Zhang, Z.; Martino, A.; Faulon, J.L. Boolean dynamics of genetic regulatory networks inferred from microarray time series data. Bioinformatics 2007, 23, 866–874. [Google Scholar] [CrossRef] [PubMed] [Green Version]
- Maetschke, S.R.; Madhamshettiwar, P.B.; Davis, M.J.; Ragan, M.A. Supervised, semi-supervised and unsupervised inference of gene regulatory networks. Brief. Bioinform. 2014, 15, 195–211. [Google Scholar] [CrossRef] [PubMed] [Green Version]
- Burger, J.A.; Tsukada, N.; Burger, M.; Zvaifler, N.J.; Dell’Aquila, M.; Kipps, T.J. Blood-derived nurse-like cells protect chronic lymphocytic leukemia B cells from spontaneous apoptosis through stromal cell-derived factor-1. Blood J. Am. Soc. Hematol. 2000, 96, 2655–2663. [Google Scholar]
- Tsukada, N.; Burger, J.A.; Zvaifler, N.J.; Kipps, T.J. Distinctive features of “nurselike” cells that differentiate in the context of chronic lymphocytic leukemia. Blood J. Am. Soc. Hematol. 2002, 99, 1030–1037. [Google Scholar] [CrossRef] [PubMed]
- Boissard, F.; Fournie, J.; Quillet-Mary, A.; Ysebaert, L.; Poupot, M. Nurse-like cells mediate ibrutinib resistance in chronic lymphocytic leukemia patients. Blood Cancer J. 2015, 5, e355. [Google Scholar] [CrossRef] [PubMed] [Green Version]
- Orecchioni, M.; Ghosheh, Y.; Pramod, A.B.; Ley, K. Macrophage polarization: Different gene signatures in M1(Lps+) vs. Classically and M2(LPS-) vs. Alternatively activated macrophages. Front. Immunol. 2019, 10. [Google Scholar] [CrossRef] [PubMed]
- Ten Hacken, E.; Burger, J.A. Microenvironment interactions and B-cell receptor signaling in Chronic Lymphocytic Leukemia: Implications for disease pathogenesis and treatment. Biochim. Biophys. Acta Mol. Cell Res. 2016, 1863, 401–413. [Google Scholar] [CrossRef]
- Guttman, O.; Lewis, C.E. M2-like macrophages and tumor-associated macrophages: Overlapping and distinguishing properties en route to a safe therapeutic potential. Integr. Cancer Sci. Ther. 2016, 3, 554–561. [Google Scholar] [CrossRef]
- Kratochvill, F.; Neale, G.; Haverkamp, J.M.; Van de Velde, L.A.; Smith, A.M.; Kawauchi, D.; McEvoy, J.; Roussel, M.F.; Dyer, M.A.; Qualls, J.E.; et al. TNF counterbalances the emergence of M2 tumor macrophages. Cell Rep. 2015, 12, 1902–1914. [Google Scholar] [CrossRef] [Green Version]
- Gkikas, I.; Palikaras, K.; Tavernarakis, N. The role of mitophagy in innate immunity. Front. Immunol. 2018, 9, 1283. [Google Scholar] [CrossRef]
- Cassetta, L.; Pollard, J.W. Targeting macrophages: Therapeutic approaches in cancer. Nat. Rev. Drug Discov. 2018, 17, 887–904. [Google Scholar] [CrossRef] [PubMed]
- Hao, N.B.; Lü, M.H.; Fan, Y.H.; Cao, Y.L.; Zhang, Z.R.; Yang, S.M. Review Article Macrophages in Tumor Microenvironments and the Progression of Tumors. Clin. Dev. Immunol. 2012, 2012, 11. [Google Scholar] [CrossRef] [PubMed] [Green Version]
- Gao, B.; Wang, Y.; Qiu, Y.; Xia, W.; Meng, X.; Lu, M.; Zhang, W.; Qiao, X.; Zhang, Y.; Xue, D. Bioinformatics screening regarding herbal components that targetedly regulate the function of tumour-associated macrophages. Oncol. Rep. 2014, 32, 309–317. [Google Scholar] [CrossRef] [PubMed]
- Li, Y.; You, M.J.; Yang, Y.; Hu, D.; Tian, C. The Role of Tumor-Associated Macrophages in Leukemia. Acta Haematol. 2020, 143, 112–117. [Google Scholar] [CrossRef] [PubMed]
- Lawrence, T.; Natoli, G. Transcriptional regulation of macrophage polarization: Enabling diversity with identity. Nat. Rev. Immunol. 2011, 11, 750–761. [Google Scholar] [CrossRef] [PubMed]
- Krumsiek, J.; Marr, C.; Schroeder, T.; Theis, F.J. Hierarchical differentiation of myeloid progenitors is encoded in the transcription factor network. PLoS ONE 2011, 6. [Google Scholar] [CrossRef] [Green Version]
- Zañudo, G.T.J.; Steinway, S.N.; Albert, R. Discrete dynamic network modeling of oncogenic signaling: Mechanistic insights for personalized treatment of cancer. Curr. Opin. Syst. Biol. 2018. [Google Scholar] [CrossRef]
- Emmrich, P.M.F.; Roberts, H.E.; Pancaldi, V. A Boolean gene regulatory model of heterosis and speciation. BMC Evol. Biol. 2015, 15, 24. [Google Scholar] [CrossRef]
- Bloomingdale, P.; Niu, J.; Mager, D.E. Boolean network modeling in systems pharmacology. J. Pharmacokinet. Pharmacodyn. 2018, 45, 159–180. [Google Scholar] [CrossRef]
- Davidich, M.I.; Bornholdt, S. Boolean network model predicts cell cycle sequence of fission yeast. PLoS ONE 2008, 3, e1672. [Google Scholar] [CrossRef] [Green Version]
- Martinez, F.O.; Gordon, S.; Locati, M.; Mantovani, A. Transcriptional profiling of the human monocyte-to-macrophage differentiation and polarization: New molecules and patterns of gene expression. J. Immunol. 2006, 177, 7303–7311. [Google Scholar] [CrossRef] [PubMed] [Green Version]
- Solinas, G.; Schiarea, S.; Liguori, M.; Fabbri, M.; Pesce, S.; Zammataro, L.; Pasqualini, F.; Nebuloni, M.; Chiabrando, C.; Mantovani, A.; et al. Tumor-conditioned macrophages secrete migration-stimulating factor: A new marker for M2-polarization, influencing tumor cell motility. J. Immunol. 2010, 185, 642–652. [Google Scholar] [CrossRef] [PubMed] [Green Version]
- Garcia-Alonso, L.; Holland, C.H.; Ibrahim, M.M.; Turei, D.; Saez-Rodriguez, J. Benchmark and integration of resources for the estimation of human transcription factor activities. Genome Res. 2019, 29, 1363–1375. [Google Scholar] [CrossRef] [PubMed] [Green Version]
- Balwierz, P.J.; Pachkov, M.; Arnold, P.; Gruber, A.J.; Zavolan, M.; van Nimwegen, E. ISMARA: Automated modeling of genomic signals as a democracy of regulatory motifs. Genome Res. 2014, 24, 869–884. [Google Scholar] [CrossRef] [PubMed] [Green Version]
- Boissard, F.; Tosolini, M.; Ligat, L.; Quillet-Mary, A.; Lopez, F.; Fournié, J.J.; Ysebaert, L.; Poupot, M. Nurse-like cells promote CLL survival through LFA-3/CD2 interactions. Oncotarget 2017, 8, 52225. [Google Scholar] [CrossRef] [Green Version]
- Schioppa, T.; Uranchimeg, B.; Saccani, A.; Biswas, S.K.; Doni, A.; Rapisarda, A.; Bernasconi, S.; Saccani, S.; Nebuloni, M.; Vago, L.; et al. Regulation of the chemokine receptor CXCR4 by hypoxia. J. Exp. Med. 2003, 198, 1391–1402. [Google Scholar] [CrossRef] [Green Version]
- Murray, P.J.; Allen, J.E.; Biswas, S.K.; Fisher, E.A.; Gilroy, D.W.; Goerdt, S.; Gordon, S.; Hamilton, J.A.; Ivashkiv, L.B.; Lawrence, T.; et al. Macrophage Activation and Polarization: Nomenclature and Experimental Guidelines. Immunity 2014, 41, 14–20. [Google Scholar] [CrossRef] [Green Version]
- Ogata, H.; Goto, S.; Fujibuchi, W.; Kanehisa, M. Computation with the KEGG pathway database. Biosystems 1998, 47, 119–128. [Google Scholar] [CrossRef]
- Starr, R.; Fuchsberger, M.; Lau, L.S.; Uldrich, A.P.; Goradia, A.; Willson, T.A.; Verhagen, A.M.; Alexander, W.S.; Smyth, M.J. SOCS-1 Binding to Tyrosine 441 of IFN-γ Receptor Subunit 1 Contributes to the Attenuation of IFN-γ Signaling In Vivo. J. Immunol. 2009, 183, 4537–4544. [Google Scholar] [CrossRef]
- Ries, C.H.; Cannarile, M.A.; Hoves, S.; Benz, J.; Wartha, K.; Runza, V.; Rey-Giraud, F.; Pradel, L.P.; Feuerhake, F.; Klaman, I.; et al. Targeting tumor-associated macrophages with anti-CSF-1R antibody reveals a strategy for cancer therapy. Cancer Cell 2014, 25, 846–859. [Google Scholar] [CrossRef] [Green Version]
- Ohmori, Y.; Hamilton, T.A. Interleukin-4/STAT6 represses STAT1 and NF-κB-dependent transcription through distinct mechanisms. J. Biol. Chem. 2000, 275, 38095–38103. [Google Scholar] [CrossRef] [PubMed] [Green Version]
- Chawla, A. Control of macrophage activation and function by PPARs. Circ. Res. 2010, 106, 1559–1569. [Google Scholar] [CrossRef] [PubMed]
- Choi, M.Y.; Kashyap, M.K.; Kumar, D. The chronic lymphocytic leukemia microenvironment: Beyond the B-cell receptor. Best Pract. Res. Clin. Haematol. 2016, 29, 40–53. [Google Scholar] [CrossRef] [PubMed]
- Zhong, Z.; Wen, Z.; Darnell, J.E. Stat3: A STAT family member activated by tyrosine phosphorylation in response to epidermal growth factor and interleukin-6. Science 1994, 264, 95–98. [Google Scholar] [CrossRef] [PubMed]
- Park, O.K.; Schaefer, T.S.; Nathans, D. In vitro activation of Stat3 by epidermal growth factor receptor kinase. Proc. Natl. Acad. Sci. USA 1996, 93, 13704–13708. [Google Scholar] [CrossRef] [PubMed] [Green Version]
- Gabrusiewicz, K.; Rodriguez, B.; Wei, J.; Hashimoto, Y.; Healy, L.M.; Maiti, S.N.; Thomas, G.; Zhou, S.; Wang, Q.; Elakkad, A.; et al. Glioblastoma-infiltrated innate immune cells resemble M0 macrophage phenotype. JCI Insight 2016, 1, e85841. [Google Scholar] [CrossRef]
- Zhang, B.; Srihari, S.N. Properties of Binary Vector Dissimilarity Measures. Proc. SPIE 2000, 20. [Google Scholar] [CrossRef]
- De’Broski, R.H.; Hölscher, C.; Mohrs, M.; Arendse, B.; Schwegmann, A.; Radwanska, M.; Leeto, M.; Kirsch, R.; Hall, P.; Mossmann, H.; et al. Alternative macrophage activation is essential for survival during schistosomiasis and downmodulates T helper 1 responses and immunopathology. Immunity 2004, 20, 623–635. [Google Scholar]
- Müssel, C.; Hopfensitz, M.; Kestler, H.A. BoolNet—An R package for generation, reconstruction and analysis of Boolean networks. Bioinformatics 2010, 26, 1378–1380. [Google Scholar] [CrossRef] [Green Version]
- Murray, P.J. Macrophage polarization. Annu. Rev. Physiol. 2017, 79, 541–566. [Google Scholar] [CrossRef]
- Rutschman, R.; Lang, R.; Hesse, M.; Ihle, J.N.; Wynn, T.A.; Murray, P.J. Cutting edge: Stat6-dependent substrate depletion regulates nitric oxide production. J. Immunol. 2001, 166, 2173–2177. [Google Scholar] [CrossRef] [PubMed] [Green Version]
- Vannella, K.M.; Barron, L.; Borthwick, L.A.; Kindrachuk, K.N.; Narasimhan, P.B.; Hart, K.M.; Thompson, R.W.; White, S.; Cheever, A.W.; Ramalingam, T.R.; et al. Incomplete deletion of IL-4Rα by LysM Cre reveals distinct subsets of M2 macrophages controlling inflammation and fibrosis in chronic schistosomiasis. PLoS Pathog. 2014, 10, e1004372. [Google Scholar] [CrossRef] [PubMed]
- Dalmas, E.; Toubal, A.; Alzaid, F.; Blazek, K.; Eames, H.L.; Lebozec, K.; Pini, M.; Hainault, I.; Montastier, E.; Denis, R.G.; et al. Irf5 deficiency in macrophages promotes beneficial adipose tissue expansion and insulin sensitivity during obesity. Nat. Med. 2015, 21, 610–618. [Google Scholar] [CrossRef] [PubMed]
- Friedrich, J.; Heim, L.; Trufa, D.I.; Sirbu, H.; Rieker, R.J.; Chiriac, M.T.; Finotto, S. STAT1 deficiency supports PD-1/PD-L1 signaling resulting in dysfunctional TNFα mediated immune responses in a model of NSCLC. Oncotarget 2018, 9, 37157. [Google Scholar] [CrossRef] [PubMed] [Green Version]
- Satoh, T.; Takeuchi, O.; Vandenbon, A.; Yasuda, K.; Tanaka, Y.; Kumagai, Y.; Miyake, T.; Matsushita, K.; Okazaki, T.; Saitoh, T.; et al. The Jmjd3-Irf4 axis regulates M2 macrophage polarization and host responses against helminth infection. Nat. Immunol. 2010, 11, 936–944. [Google Scholar] [CrossRef] [PubMed]
- Murtagh, F.; Contreras, P. Algorithms for hierarchical clustering: An overview. Wiley Interdiscip. Rev. Data Min. Knowl. Discov. 2012, 2, 86–97. [Google Scholar] [CrossRef]
- McInnes, L.; Healy, J.; Astels, S. hdbscan: Hierarchical density based clustering. J. Open Source Softw. 2017, 2, 205. [Google Scholar] [CrossRef]
- Seneviratne, A.N.; Edsfeldt, A.; Cole, J.E.; Kassiteridi, C.; Swart, M.; Park, I.; Green, P.; Khoyratty, T.; Saliba, D.; Goddard, M.E.; et al. Interferon regulatory factor 5 controls necrotic core formation in atherosclerotic lesions by impairing efferocytosis. Circulation 2017, 136, 1140–1154. [Google Scholar] [CrossRef]
- Eduati, F.; De Las Rivas, J.; Di Camillo, B.; Toffolo, G.; Saez-Rodriguez, J. Integrating literature-constrained and data-driven inference of signalling networks. Bioinformatics 2012, 28, 2311–2317. [Google Scholar] [CrossRef] [Green Version]
- Kulkarni, S.R.; Vandepoele, K. Inference of plant gene regulatory networks using data-driven methods: A practical overview. Biochim. Biophys. Acta (BBA)-Gene Regul. Mech. 2020, 1863, 194447. [Google Scholar] [CrossRef]
- Macklin, P.; Frieboes, H.B.; Sparks, J.L.; Ghaffarizadeh, A.; Friedman, S.H.; Juarez, E.F.; Jonckheere, E.; Mumenthaler, S.M. Progress towards computational 3-d multicellular systems biology. In Systems Biology of Tumor Microenvironment; Springer: Berlin/Heidelberg, Germany, 2016; pp. 225–246. [Google Scholar]
- Margaris, K.; Black, R.A. Modelling the lymphatic system: Challenges and opportunities. J. R. Soc. Interface 2012, 9, 601–612. [Google Scholar] [CrossRef] [PubMed] [Green Version]
- Galle, J.; Aust, G.; Schaller, G.; Beyer, T.; Drasdo, D. Individual cell-based models of the spatial-temporal organization of multicellular systems—Achievements and limitations. Cytom. Part A J. Int. Soc. Anal. Cytol. 2006, 69, 704–710. [Google Scholar] [CrossRef] [PubMed]
- Pines, G.; Köstler, W.J.; Yarden, Y. Oncogenic mutant forms of EGFR: Lessons in signal transduction and targets for cancer therapy. FEBS Lett. 2010, 584, 2699–2706. [Google Scholar] [CrossRef] [PubMed] [Green Version]
- Hastings, K.; Yu, H.; Wei, W.; Sanchez-Vega, F.; DeVeaux, M.; Choi, J.; Rizvi, H.; Lisberg, A.; Truini, A.; Lydon, C.; et al. EGFR mutation subtypes and response to immune checkpoint blockade treatment in non-small-cell lung cancer. Ann. Oncol. 2019, 30, 1311–1320. [Google Scholar] [CrossRef] [Green Version]
- Kauffman, S.; Peterson, C.; Samuelsson, B.; Troein, C. Random Boolean network models and the yeast transcriptional network. Proc. Natl. Acad. Sci. USA 2003, 100, 14796–14799. [Google Scholar] [CrossRef] [Green Version]
- Bornholdt, S. Boolean network models of cellular regulation: Prospects and limitations. J. R. Soc. Interface 2008, 5, S85–S94. [Google Scholar] [CrossRef] [Green Version]
- Robeva, R. Algebraic and Discrete Mathematical Methods for Modern Biology; Academic Press: Cambridge, MA, USA, 2015. [Google Scholar]
- Albert, R.; Robeva, R. Signaling networks: Asynchronous boolean models. In Algebraic and Discrete Mathematical Methods for Modern Biology; Academic Press: Cambridge, MA, USA, 2015; pp. 65–91. [Google Scholar]
- Ihaka, R.; Gentleman, R. R: A language for data analysis and graphics. J. Comput. Graph. Stat. 1996, 5, 299–314. [Google Scholar]
- Geeraerts, X.; Bolli, E.; Fendt, S.M.; Van Ginderachter, J.A. Macrophage metabolism as therapeutic target for cancer, atherosclerosis, and obesity. Front. Immunol. 2017, 8, 289. [Google Scholar] [CrossRef] [Green Version]
- Wang, Z.; Brandt, S.; Medeiros, A.; Wang, S.; Wu, H.; Dent, A.; Serezani, C.H. MicroRNA 21 is a homeostatic regulator of macrophage polarization and prevents prostaglandin E 2-mediated M2 generation. PLoS ONE 2015, 10, e0115855. [Google Scholar] [CrossRef]
- Heusinkveld, M.; van der Burg, S.H. Identification and manipulation of tumor associated macrophages in human cancers. J. Transl. Med. 2011, 9, 216. [Google Scholar] [CrossRef] [Green Version]
- Talbot, H.; Saada, S.; Barthout, E.; Gallet, P.F.; Gachard, N.; Abraham, J.; Jaccard, A.; Troutaud, D.; Lalloué, F.; Naves, T.; et al. BDNF belongs to the nurse-like cell secretome and supports survival of B chronic lymphocytic leukemia cells. Sci. Rep. 2020, 10, 12572. [Google Scholar] [CrossRef] [PubMed]
- Kipps, T.J.; Stevenson, F.K.; Wu, C.J.; Croce, C.M.; Packham, G.; Wierda, W.G.; O’brien, S.; Gribben, J.; Rai, K. Chronic lymphocytic leukaemia. Nat. Rev. Dis. Prim. 2017, 3, 1017–1029. [Google Scholar] [CrossRef] [PubMed] [Green Version]

| M1 | M2 | NLC/TAM | |
|---|---|---|---|
| Activated by | IFN LPS GM-CSF IL-1 | Immune complexes (IC) IL-4 IL-13 IL-10 | Immune complexes (IC) IL-4 IL-13 IL-10 TGF CSF-1 HMGB1 |
| Secrete | Th1 inducing cytokines TNF IL-12 IL-18 IFN IL-1 IL-6 | IL-10 TGF EGF VEGF Polyamine | IL-10 TGF EGF VEGF TNFSF13/TNFSF13B (BAFF/APRIL) chemokines: CXCL12, CXCL13 Polyamine |
| Function | Anti-tumoral activity: releasing nitric oxide (NO); presenting tumor antigens to CD4+ Th1 cells; driving the activity of cytotoxic CD8+ T cells at the tumor site | Anti-infammatory processes: Th2 responses(M2a); Down-regulation of immune response (M2b); matrix deposition and tissue remodelling (M2c) | Promote tumor growth: secretion of soluble immuno- suppressive agents; expression of contact-dependent immuno-suppressive receptors (PD-L1, B7-H4) leading to enhancing CD8 T cell infiltration high levels of HIF1 and HIF2 which leads to expression of genes associated with pro-tumoral activity |
| References | [1,36,37,38,39,40] | [1,2,3,38] | [12,13,17,37,38,41,42,43,44] |
| Node | Boolean Function | References |
|---|---|---|
| IFNGR | IFNG or IFNAB and not (SOCS1) | [27,59] |
| CSF2RA | GMCSF | [27] |
| IL1R | IL1 or IL1b | [27] |
| TLR4 | LPS and not (FCGR) | [27] |
| FCGR | IC and (LPS or IL1) | [27] |
| IL4RA | IL4 and IL13 | [1,2,7] |
| IL10R | IL10 or IL10s (secreted) | [27] |
| MCSFR | MCSF(also known as CSF-1) | [7,12,44,55,60] |
| STAT1 | IFNGR or STAT1 and not (STAT6) | [1,13,45,61] |
| STAT5 | CSF2RA and not (STAT3 or IRF4) | [27] |
| NFKB | (STAT1 or TNFA or TLR4 or IL1R) | [7,27,42,62] |
| and not (STAT6 or FCGR or PPARG or KLF4) | ||
| PPARG | IL4RA or MCSFR or ERK and not (STAT6) | [2,37,62,63] |
| STAT6 | IL4RA or MCSFR | [18,27,37,45,55] |
| JMJD3 | IL4RA or MCSFR | [18,27,37,55] |
| STAT3 | (IL10R or EGF or STAT3) and not (FCGR or PPARG) | [27,62,64,65] |
| IRF3 | TLR4 | [27] |
| ERK | FCGR | [27] |
| KLF4 | STAT6 | [27] |
| SOCS1 | STAT6 or STAT1 | [2,27,59] |
| IRF4 | JMJD3 | [27] |
| IRF5 | STAT5 and not (IRF4) | [1,2,57] |
| IL1b | NFKB or TNFA | [36,38] |
| IFNAB | IRF3 | [27] |
| EGF | ERK or STAT3 | [41,43,44] |
| IL12 | STAT1 or STAT5 or NFKB | [27] |
| IL10s | (PPARG or STAT3) and not (IRF5 or TNFA) | [7,39,42,45] |
| TNFA | IRF5 and not (IL10s) | [39,42] |
| TGFB | STAT3 and (not TNFA) | [7,36,38,41,42,43,44] |
| HIF1A | (STAT3 or IL10s) and (not STAT1) | [38,40,43,44] |
| RAGE | HMGB1 | [37,42,63] |
| Simulations | Attractors | Network Representation |
|---|---|---|
| M1 stimuli ON: IFN, GM-CSF, IL-1, LPS. Attractor category: 18 M0, 5 M1 | 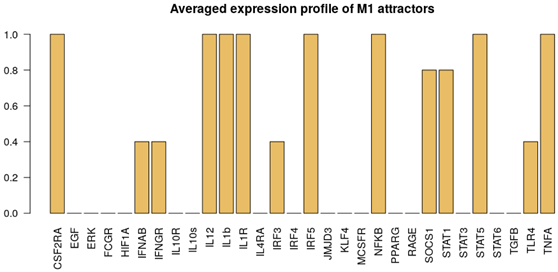 | 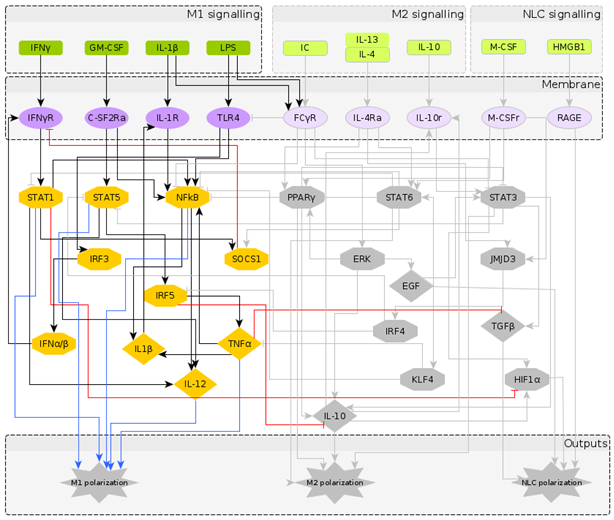 |
| M2 stimuli ON: IC, IL-4, IL-13, IL-10. Attractor category: 6 M0, 1 M2 |  |  |
| NLC stimuli ON: M-CSF, HMGB1. Attractor category: 4 M0, 2 M2, 4 NLC | 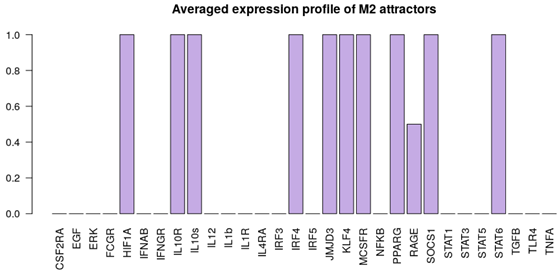 | 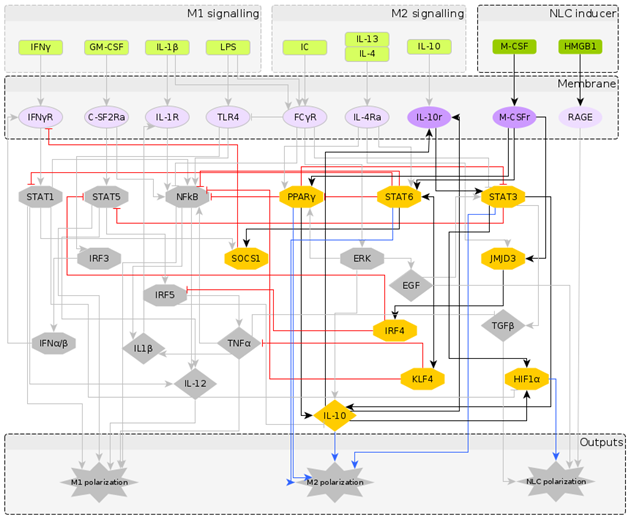 |
 |  |
| Knock-Out | Expected Effect on Polarization | Model Results |
|---|---|---|
| STAT6 | Complete knock-out Loss of M2 [71] | Complete loss of M2 M1 and NLC attractors not affected |
| PPAR | Conditional knock-out Loss of M2 [62] | Decrease number of M2 attractors M1 and NLC attractors not affected |
| IL-4R | Conditional knock-out Loss of M2 [72] | Decrease number of M2 attractors M1 and NLC attractors not affected |
| IRF5 | Complete knock-out Loss of M1 [73] | Complete loss of M1 M2 and NLC attractors not affected |
| STAT5 | Complete knock-out Loss of M1 [74] | Complete loss of M1 M2 and NLC attractors not affected |
| IRF4 - JMJD3 axis | Complete knock-out Loss of M2 [75] | Complete loss of M2 M1 and NLC attractors not affected |
| Predictions | ||
| Node Perturbed | Mutant | Model Result |
| STAT3 | Knock-out | Complete loss of NLC Increase of M1 attractors M2 attractors not affected |
| EGF | Knock-out | Complete loss of NLC M1 and M2 attractors not affected |
| STAT1 | Knock-out | Significant loss of M1 M2 and NLC attractors not affected |
| EGF | Constitutive Activation | Complete loss of M1 M2 and NLC attractors not affected |
Publisher’s Note: MDPI stays neutral with regard to jurisdictional claims in published maps and institutional affiliations. |
© 2020 by the authors. Licensee MDPI, Basel, Switzerland. This article is an open access article distributed under the terms and conditions of the Creative Commons Attribution (CC BY) license (http://creativecommons.org/licenses/by/4.0/).
Share and Cite
Marku, M.; Verstraete, N.; Raynal, F.; Madrid-Mencía, M.; Domagala, M.; Fournié, J.-J.; Ysebaert, L.; Poupot, M.; Pancaldi, V. Insights on TAM Formation from a Boolean Model of Macrophage Polarization Based on In Vitro Studies. Cancers 2020, 12, 3664. https://doi.org/10.3390/cancers12123664
Marku M, Verstraete N, Raynal F, Madrid-Mencía M, Domagala M, Fournié J-J, Ysebaert L, Poupot M, Pancaldi V. Insights on TAM Formation from a Boolean Model of Macrophage Polarization Based on In Vitro Studies. Cancers. 2020; 12(12):3664. https://doi.org/10.3390/cancers12123664
Chicago/Turabian StyleMarku, Malvina, Nina Verstraete, Flavien Raynal, Miguel Madrid-Mencía, Marcin Domagala, Jean-Jacques Fournié, Loïc Ysebaert, Mary Poupot, and Vera Pancaldi. 2020. "Insights on TAM Formation from a Boolean Model of Macrophage Polarization Based on In Vitro Studies" Cancers 12, no. 12: 3664. https://doi.org/10.3390/cancers12123664
APA StyleMarku, M., Verstraete, N., Raynal, F., Madrid-Mencía, M., Domagala, M., Fournié, J.-J., Ysebaert, L., Poupot, M., & Pancaldi, V. (2020). Insights on TAM Formation from a Boolean Model of Macrophage Polarization Based on In Vitro Studies. Cancers, 12(12), 3664. https://doi.org/10.3390/cancers12123664