Advances in Prognostic Methylation Biomarkers for Prostate Cancer


Simple Summary
Abstract
1. Introduction
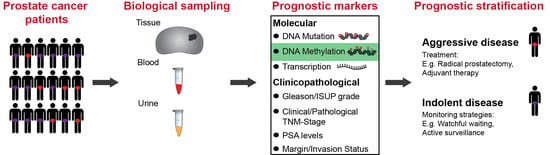
1.1. Current Clinicopathological Prognostic Markers
1.2. Molecular Biomarkers for Prognosis
1.3. DNA Methylation Biomarkers
2. Current State of Prognostic Methylated Biomarkers
2.1. Candidate (A Priori) Markers
2.1.1. GSTP1
2.1.2. APC
2.1.3. RARB
2.1.4. PITX2
2.1.5. CCND2 and PTGS2
2.1.6. Other Candidate Genes
2.2. Genome-Wide Prognostic Biomarker Discovery Studies
2.2.1. Restriction-Based Methylation Sequencing Studies
2.2.2. Capture-Based Methylation Sequencing Studies
2.2.3. DNA Methylation Microarray Studies
Agilent Human CpG Island Microarray
GoldenGate Cancer Panel I Microarray Platform
HM27K Platform
HM450K Platform
3. Non-Invasive Detection of Prognostic DNA Methylation Markers in Liquid Biopsies
3.1. Urine-Based Methylated Biomarkers
3.2. Blood-Based Methylated Prognostic Biomarkers For cfDNA Testing
4. Conclusions and Future Directions
Author Contributions
Funding
Conflicts of Interest
Abbreviations
| AUC | Area Under the Curve |
| BCR | BioChemical Recurrence |
| CAPRA | Cancer of the Prostate Risk Assessment |
| CF | Clinical Failure |
| cfDNA | circulating cell-free DNA |
| COBRAc | COmbined Bisulphite Restriction Analysis |
| ctDNA | circulating tumour DNA |
| ddPCR | Droplet Digital PCR |
| Df | Degrees of freedom |
| DMR | Differentially Methylated Regions |
| ERRBS | Enhanced Reduced Representation Bisulphite Sequencing |
| FFPET | Formalin-Fixed Paraffin-Embedded Tissue |
| GS | Gleason Score |
| HM27K | Infinium HumanMethylation 27K Microarray |
| WGBS | Whole Genome Bisulphite Sequencing |
| HM450K | Infinium HumanMethylation 450K Microarray |
| HR | Hazard Ratio |
| IQR | InterQuartile Range |
| LR | Likelihood Ratio |
| M | Multivariate |
| MBDCap-Seq | Methyl-CpG Binding Domain Capture sequencing |
| MSP | Methylation-Specific PCR |
| PCa | Prostate Cancer |
| PCR | Polymerase Chain Reaction |
| PSA | Prostate-Specific Antigen |
| qMSP | quantitative Methylation-Specific PCR |
| RP | Radical Prostatectomy |
| RRBS | Reduced Representation Bisulphite Sequencing |
| TCGA | The Cancer Genome Atlas |
| TURP | TransUrethral Resection of the Prostate |
| U | Univariate |
References
- Bray, F.; Me, J.F.; Soerjomataram, I.; Siegel, R.; Torre, L.A.; Jemal, A. Global cancer statistics 2018: GLOBOCAN estimates of incidence and mortality worldwide for 36 cancers in 185 countries. CA A Cancer J. Clin. 2018, 68, 394–424. [Google Scholar] [CrossRef] [PubMed]
- WHO. GLOBOCAN 2018 Database. Issued by World Health Organization (WHO). Available online: http://gco.iarc.fr/today (accessed on 1 August 2020).
- Ferlay, J.E.; Lam, F.; Colombet, M.; Mery, L.; Pineros, M.; Znaor, A.; Soerjomataram, I.; Bray, F. Global Cancer Observatory: Cancer Tomorrow. Available online: https://gco.iarc.fr/tomorrow (accessed on 1 August 2020).
- Rawla, P. Epidemiology of Prostate Cancer. World J. Oncol. 2019, 10, 63–89. [Google Scholar] [CrossRef] [PubMed]
- Culp, M.B.; Soerjomataram, I.; Efstathiou, J.A.; Bray, F.; Jemal, A. Recent Global Patterns in Prostate Cancer Incidence and Mortality Rates. Eur. Urol. 2020, 77, 38–52. [Google Scholar] [CrossRef] [PubMed]
- Litwin, M.S.; Tan, H.-J. The Diagnosis and Treatment of Prostate Cancer. JAMA 2017, 317, 2532–2542. [Google Scholar] [CrossRef] [PubMed]
- Shao, Y.-H.; Demissie, K.; Shih, W.; Mehta, A.R.; Stein, M.N.; Roberts, C.B.; DiPaola, R.S.; Lu-Yao, G.L. Contemporary Risk Profile of Prostate Cancer in the United States. J. Natl. Cancer Inst. 2009, 101, 1280–1283. [Google Scholar] [CrossRef] [PubMed]
- Welch, H.G.; Gorski, D.H.; Albertsen, P.C. Trends in Metastatic Breast and Prostate Cancer—Lessons in Cancer Dynamics. N. Engl. J. Med. 2015, 373, 1685–1687. [Google Scholar] [CrossRef] [PubMed]
- Howlader, N.; Krapcho, M.; Miller, D.; Brest, A.; Yu, M.; Ruhl, J.; Tatalovich, Z.; Mariotto, A.; Lewis, D.R.; Chen, H.S.; et al. SEER Cancer Statistics Review, 1975–2016. Available online: https://seer.cancer.gov/csr/1975_2016/ (accessed on 1 August 2020).
- Roehl, K.A.; Han, M.; Ramos, C.G.; Antenor, J.A.V.; Catalona, W.J. Cancer Progression and Survival Rates Following Anatomical Radical Retropubic Prostatectomy in 3478 Consecutive Patients: Long-Term Results. J. Urol. 2004, 172, 910–914. [Google Scholar] [CrossRef] [PubMed]
- Eggener, S.E.; Scardino, P.T.; Walsh, P.C.; Han, M.; Partin, A.W.; Trock, B.J.; Feng, Z.; Wood, D.P.; Eastham, J.A.; Yossepowitch, O.; et al. Predicting 15-Year Prostate Cancer Specific Mortality After Radical Prostatectomy. J. Urol. 2011, 185, 869–875. [Google Scholar] [CrossRef]
- Freedland, S.J.; Humphreys, E.B.; Mangold, L.A.; Eisenberger, M.; Dorey, F.J.; Walsh, P.C.; Partin, A.W. Risk of Prostate Cancer–Specific Mortality Following Biochemical Recurrence After Radical Prostatectomy. JAMA 2005, 294, 433–439. [Google Scholar] [CrossRef]
- Abdollah, F.; Boorjian, S.; Cozzarini, C.; Suardi, N.; Sun, M.; Fiorino, C.; Di Muzio, N.; Karakiewicz, P.I.; Montorsi, F.; Karnes, R.J.; et al. Survival Following Biochemical Recurrence After Radical Prostatectomy and Adjuvant Radiotherapy in Patients With Prostate Cancer: The Impact of Competing Causes of Mortality and Patient Stratification. Eur. Urol. 2013, 64, 557–564. [Google Scholar] [CrossRef]
- Valicenti, R.K.; Thompson, I.; Albertsen, P.; Davis, B.J.; Goldenberg, S.L.; Wolf, J.S.; Sartor, O.; Klein, E.; Hahn, C.; Michalski, J.; et al. Adjuvant and Salvage Radiation Therapy After Prostatectomy: American Society for Radiation Oncology/American Urological Association Guidelines. Int. J. Radiat. Oncol. 2013, 86, 822–828. [Google Scholar] [CrossRef] [PubMed]
- Welch, H.G.; Albertsen, P.C. Prostate Cancer Diagnosis and Treatment after the Introduction of Prostate-Specific Antigen Screening: 1986–2005. J. Natl. Cancer Inst. 2009, 101, 1325–1329. [Google Scholar] [CrossRef]
- Albertsen, P.C.; Hanley, J.A.; Fine, J. 20-Year Outcomes Following Conservative Management of Clinically Localized Prostate Cancer. JAMA 2005, 293, 2095–2101. [Google Scholar] [CrossRef] [PubMed]
- Steineck, G.; Helgesen, F.; Adolfsson, J.; Dickman, P.W.; Johansson, J.-E.; Norlen, B.J.; Holmberg, L. Quality of Life after Radical Prostatectomy or Watchful Waiting. N. Engl. J. Med. 2002, 347, 790–796. [Google Scholar] [CrossRef]
- Wilt, T.J.; Macdonald, R.; Rutks, I.; Shamliyan, T.; Taylor, B.C.; Kane, R.L. Systematic review: Comparative effectiveness and harms of treatments for clinically localized prostate cancer. Ann. Intern. Med. 2008, 148, 435–448. [Google Scholar] [CrossRef] [PubMed]
- Thomsen, F.B.; Brasso, K.; Klotz, L.H.; Røder, M.A.; Berg, K.D.; Iversen, P. Active surveillance for clinically localized prostate cancer--A systematic review. J. Surg. Oncol. 2014, 109, 830–835. [Google Scholar] [CrossRef] [PubMed]
- Cooperberg, M.R.; Carroll, P.R.; Klotz, L. Active Surveillance for Prostate Cancer: Progress and Promise. J. Clin. Oncol. 2011, 29, 3669–3676. [Google Scholar] [CrossRef]
- Klotz, L. Active Surveillance: The Canadian Experience. Manag. Castration Resist. Prostate Cancer 2012, 22, 95–105. [Google Scholar] [CrossRef]
- Welty, C.J.; Cooperberg, M.R.; Carroll, P.R. Meaningful end points and outcomes in men on active surveillance for early-stage prostate cancer. Curr. Opin. Urol. 2014, 24, 288–292. [Google Scholar] [CrossRef]
- Tolkach, Y.; Kristiansen, G. The Heterogeneity of Prostate Cancer: A Practical Approach. Pathobiology 2018, 85, 108–116. [Google Scholar] [CrossRef]
- Prensner, J.R.; Rubin, M.A.; Wei, J.T.; Chinnaiyan, A.M. Beyond PSA: The Next Generation of Prostate Cancer Biomarkers. Sci. Transl. Med. 2012, 4, 127rv3. [Google Scholar] [CrossRef] [PubMed]
- Epstein, J.I.; Walsh, P.C.; Carmichael, M.; Brendler, C.B. Pathologic and clinical findings to predict tumor extent of nonpalpable (stage T1c) prostate cancer. JAMA 1994, 271, 368–374. [Google Scholar] [CrossRef]
- D’Amico, A.V.; Whittington, R.; Malkowicz, S.B.; Schultz, D.; Blank, K.; Broderick, G.A.; Tomaszewski, J.E.; Renshaw, A.A.; Kaplan, I.; Beard, C.; et al. Biochemical Outcome After Radical Prostatectomy, External Beam Radiation Therapy, or Interstitial Radiation Therapy for Clinically Localized Prostate Cancer. JAMA 1998, 280, 969–974. [Google Scholar] [CrossRef]
- Kattan, M.W.; Eastham, J.A.; Wheeler, T.M.; Maru, N.; Scardino, P.T.; Erbersdobler, A.; Graefen, M.; Huland, H.; Koh, H.; Shariat, S.F.; et al. Counseling Men With Prostate Cancer: A Nomogram for Predicting the Presence of Small, Moderately Differentiated, Confined Tumors. J. Urol. 2003, 170, 1792–1797. [Google Scholar] [CrossRef]
- Stephenson, A.J.; Scardino, P.T.; Eastham, J.A.; Jr, F.J.B.; Dotan, Z.A.; Diblasio, C.J.; Reuther, A.; Klein, E.A.; Kattan, M.W. Postoperative Nomogram Predicting the 10-Year Probability of Prostate Cancer Recurrence After Radical Prostatectomy. J. Clin. Oncol. 2005, 23, 7005–7012. [Google Scholar] [CrossRef]
- Chun, F.K.-H.; Haese, A.; Ahyai, S.A.; Walz, J.; Suardi, N.; Capitanio, U.; Graefen, M.; Erbersdobler, A.; Huland, H.; Karakiewicz, P.I. Critical assessment of tools to predict clinically insignificant prostate cancer at radical prostatectomy in contemporary men. Cancer 2008, 113, 701–709. [Google Scholar] [CrossRef] [PubMed]
- Cooperberg, M.R.; Hilton, J.F.; Carroll, P.R. The CAPRA-S score. Cancer 2011, 117, 5039–5046. [Google Scholar] [CrossRef]
- Remmers, S.; Verbeek, J.F.M.; Nieboer, D.; Van Der Kwast, T.; Roobol-Bouts, M. Predicting biochemical recurrence and prostate cancer-specific mortality after radical prostatectomy: Comparison of six prediction models in a cohort of patients with screening- and clinically detected prostate cancer. BJU Int. 2019, 124, 635–642. [Google Scholar] [CrossRef]
- Steyerberg, E.W.; Roobol, M.; Kattan, M.; Van Der Kwast, T.; De Koning, H.; Schröder, F. Prediction of Indolent Prostate Cancer: Validation and Updating of a Prognostic Nomogram. J. Urol. 2007, 177, 107–112. [Google Scholar] [CrossRef]
- Gandaglia, G.; Ploussard, G.; Isbarn, H.; Suardi, N.; De Visschere, P.J.; Fütterer, J.J.; Ghadjar, P.; Massard, C.; Ost, P.; Sooriakumaran, P.; et al. What is the optimal definition of misclassification in patients with very low-risk prostate cancer eligible for active surveillance? Results from a multi-institutional series. Urol. Oncol. Semin. Orig. Investig. 2015, 33, 164.e1–164.e9. [Google Scholar] [CrossRef] [PubMed]
- Ploussard, G.; Epstein, J.I.; Montironi, R.; Carroll, P.R.; Wirth, M.; Grimm, M.-O.; Bjartell, A.S.; Montorsi, F.; Freedland, S.J.; Erbersdobler, A.; et al. The Contemporary Concept of Significant Versus Insignificant Prostate Cancer. Eur. Urol. 2011, 60, 291–303. [Google Scholar] [CrossRef] [PubMed]
- Hughes, C.; Murphy, A.; Martin, C.M.; Sheils, O.; O’Leary, J.J. Molecular pathology of prostate cancer. J. Clin. Pathol. 2005, 58, 673–684. [Google Scholar] [CrossRef] [PubMed]
- Kristiansen, G. Markers of clinical utility in the differential diagnosis and prognosis of prostate cancer. Mod. Pathol. 2018, 31, 143–155. [Google Scholar] [CrossRef]
- Clinton, T.N.; Bagrodia, A.; Lotan, Y.; Margulis, V.; Raj, G.V.; Woldu, S.L. Tissue-based biomarkers in prostate cancer. Expert Rev. Precis. Med. Drug Dev. 2017, 2, 249–260. [Google Scholar] [CrossRef]
- Fraser, M.; Berlin, A.; Bristow, R.G.; Van Der Kwast, T. Genomic, pathological, and clinical heterogeneity as drivers of personalized medicine in prostate cancer. Urol. Oncol. Semin. Orig. Investig. 2015, 33, 85–94. [Google Scholar] [CrossRef]
- He, W.; Bishop, K.S. The potential use of cell-free-circulating-tumor DNA as a biomarker for prostate cancer. Expert Rev. Mol. Diagn. 2016, 16, 839–852. [Google Scholar] [CrossRef] [PubMed]
- Hendriks, R.J.; Van Oort, I.M.; Schalken, J.A. Blood-based and urinary prostate cancer biomarkers: A review and comparison of novel biomarkers for detection and treatment decisions. Prostate Cancer Prostatic Dis. 2016, 20, 12–19. [Google Scholar] [CrossRef] [PubMed]
- Cuzick, J.; Swanson, G.P.; Fisher, G.; Brothman, A.R.; Berney, D.M.; Reid, J.E.; Mesher, D.; Speights, V.; Stankiewicz, E.; Foster, C.S.; et al. Prognostic value of an RNA expression signature derived from cell cycle proliferation genes in patients with prostate cancer: A retrospective study. Lancet Oncol. 2011, 12, 245–255. [Google Scholar] [CrossRef]
- Klein, E.A.; Cooperberg, M.R.; Magi-Galluzzi, C.; Simko, J.P.; Falzarano, S.M.; Maddala, T.; Chan, J.M.; Li, J.; Cowan, J.E.; Tsiatis, A.C.; et al. A 17-gene Assay to Predict Prostate Cancer Aggressiveness in the Context of Gleason Grade Heterogeneity, Tumor Multifocality, and Biopsy Undersampling. Eur. Urol. 2014, 66, 550–560. [Google Scholar] [CrossRef]
- Erho, N.; Crisan, A.; Vergara, I.A.; Mitra, A.P.; Ghadessi, M.; Buerki, C.; Bergstralh, E.J.; Kollmeyer, T.; Fink, S.; Haddad, Z.; et al. Discovery and Validation of a Prostate Cancer Genomic Classifier that Predicts Early Metastasis Following Radical Prostatectomy. PLoS ONE 2013, 8, e66855. [Google Scholar] [CrossRef]
- Chao, C.R.; Chi, M.; Preciado, M.; Black, M.H. Methylation markers for prostate cancer prognosis: A systematic review. Cancer Causes Control 2013, 24, 1615–1641. [Google Scholar] [CrossRef] [PubMed]
- Strand, S.H.; Orntoft, T.F.; Sorensen, K.D. Prognostic DNA Methylation Markers for Prostate Cancer. Int. J. Mol. Sci. 2014, 15, 16544–16576. [Google Scholar] [CrossRef]
- Chiam, K.; Ricciardelli, C.; Bianco-Miotto, T. Epigenetic biomarkers in prostate cancer: Current and future uses. Cancer Lett. 2014, 342, 248–256. [Google Scholar] [CrossRef] [PubMed]
- Chan, M.F.; Liang, G.; Jones, P.A. Relationship between Transcription and DNA Methylation. Future HIV-1 Therapeutics 2000, 249, 75–86. [Google Scholar] [CrossRef]
- Egger, G.; Liang, G.; Aparicio, A.; Jones, P.A. Epigenetics in human disease and prospects for epigenetic therapy. Nat. Cell Biol. 2004, 429, 457–463. [Google Scholar] [CrossRef] [PubMed]
- Baylin, S.B.; Esteller, M.; Rountree, M.R.; Bachman, K.E.; Schuebel, K.; Herman, J.G. Aberrant patterns of DNA methylation, chromatin formation and gene expression in cancer. Hum. Mol. Genet. 2001, 10, 687–692. [Google Scholar] [CrossRef] [PubMed]
- Majumdar, S.; Buckles, E.; Estrada, J.; Koochekpour, S. Aberrant DNA Methylation and Prostate Cancer. Curr. Genom. 2011, 12, 486–505. [Google Scholar] [CrossRef] [PubMed]
- Aryee, M.J.; Liu, W.; Engelmann, J.C.; Nuhn, P.; Gurel, M.; Haffner, M.C.; Esopi, D.; Irizarry, R.A.; Getzenberg, R.H.; Nelson, W.G.; et al. DNA Methylation Alterations Exhibit Intraindividual Stability and Interindividual Heterogeneity in Prostate Cancer Metastases. Sci. Transl. Med. 2013, 5, 169ra10. [Google Scholar] [CrossRef]
- Chan, T.A.; Glöckner, S.; Yi, J.M.; Chen, W.; Van Neste, L.; Cope, L.; Herman, J.G.; Velculescu, V.E.; Schuebel, K.E.; Ahuja, N.; et al. Convergence of Mutation and Epigenetic Alterations Identifies Common Genes in Cancer That Predict for Poor Prognosis. PLoS Med. 2008, 5, e114. [Google Scholar] [CrossRef]
- Paziewska, A.; Dabrowska, M.; Goryca, K.; Antoniewicz, A.; Dobruch, J.; Mikula, M.; Jarosz, D.; Zapala, L.; Borówka, A.; Ostrowski, J. DNA methylation status is more reliable than gene expression at detecting cancer in prostate biopsy. Br. J. Cancer 2014, 111, 781–789. [Google Scholar] [CrossRef]
- Issa, J.-P. DNA Methylation as a Clinical Marker in Oncology. J. Clin. Oncol. 2012, 30, 2566–2568. [Google Scholar] [CrossRef] [PubMed]
- Bock, C.; Halbritter, F.; Carmona, F.J.; Tierling, S.; Datlinger, P.; Assenov, Y.; Berdasco, M.; Bergmann, A.K.; Booher, K.; Busato, F.; et al. Quantitative comparison of DNA methylation assays for biomarker development and clinical applications. Nat. Biotechnol. 2016, 34, 726–737. [Google Scholar] [CrossRef]
- Stewart, G.S.; Van Neste, L.; Delvenne, P.; Delrée, P.; Delga, A.; McNeill, S.A.; O’Donnell, M.; Clark, J.; Van Criekinge, W.; Bigley, J.; et al. Clinical Utility of an Epigenetic Assay to Detect Occult Prostate Cancer in Histopathologically Negative Biopsies: Results of the MATLOC Study. J. Urol. 2013, 189, 1110–1116. [Google Scholar] [CrossRef]
- Ellinger, J.; Müller, S.C.; Stadler, T.C.; Jung, A.; Von Ruecker, A.; Bastian, P.J. The role of cell-free circulating DNA in the diagnosis and prognosis of prostate cancer. Urol. Oncol. Semin. Orig. Investig. 2011, 29, 124–129. [Google Scholar] [CrossRef]
- Rouprêt, M.; Hupertan, V.; Catto, J.W.; Yates, D.R.; Rehman, I.; Proctor, L.M.; Phillips, J.; Meuth, M.; Cussenot, O.; Hamdy, F.C. Promoter hypermethylation in circulating blood cells identifies prostate cancer progression. Int. J. Cancer 2007, 122, 952–956. [Google Scholar] [CrossRef]
- Payne, S.R.; Serth, J.; Schostak, M.; Kamradt, J.; Strauss, A.; Thelen, P.; Model, F.; Day, J.K.; Liebenberg, V.; Morotti, A.; et al. DNA methylation biomarkers of prostate cancer: Confirmation of candidates and evidence urine is the most sensitive body fluid for non-invasive detection. Prostate 2009, 69, 1257–1269. [Google Scholar] [CrossRef]
- Okegawa, T.; Nutahara, K.; Higashihara, E. Association of circulating tumor cells with tumor-related methylated DNA in patients with hormone-refractory prostate cancer. Int. J. Urol. 2010, 17, 466–475. [Google Scholar] [CrossRef]
- Herman, J.G.; Graff, J.R.; Myohanen, S.; Nelkin, B.D.; Baylin, S.B. Methylation-specific PCR: A novel PCR assay for methylation status of CpG islands. Proc. Natl. Acad. Sci. USA 1996, 93, 9821–9826. [Google Scholar] [CrossRef]
- Eads, C.A.; Danenberg, K.D.; Kawakami, K.; Saltz, L.B.; Blake, C.; Shibata, D.; Danenberg, P.V.; Laird, P.W. MethyLight: A high-throughput assay to measure DNA methylation. Nucleic Acids Res. 2000, 28, 32e-00. [Google Scholar] [CrossRef] [PubMed]
- Tost, J.; Gut, I.; Sharon, M. Analysis of Gene-Specific DNA Methylation Patterns by Pyrosequencing® Technology. Pyrosequencing Protoc. 2007, 373, 89–102. [Google Scholar] [CrossRef]
- Tost, J.; Gut, I.G. DNA methylation analysis by pyrosequencing. Nat. Protoc. 2007, 2, 2265–2275. [Google Scholar] [CrossRef] [PubMed]
- Ehrich, M.; Nelson, M.R.; Stanssens, P.; Zabeau, M.; Liloglou, T.; Xinarianos, G.; Cantor, C.R.; Field, J.K.; Boom, D.V.D. Quantitative high-throughput analysis of DNA methylation patterns by base-specific cleavage and mass spectrometry. Proc. Natl. Acad. Sci. USA 2005, 102, 15785–15790. [Google Scholar] [CrossRef] [PubMed]
- Perkins, G.; Lu, H.; Garlan, F.; Taly, V. Droplet-Based Digital PCR. Int. Rev. Cytol. 2017, 79, 43–91. [Google Scholar] [CrossRef]
- Brena, R.M.; Auer, H.; Kornacker, K.; Plass, C. Quantification of DNA methylation in electrofluidics chips (Bio-COBRA). Nat. Protoc. 2006, 1, 52–58. [Google Scholar] [CrossRef]
- Wong, E.M.; Dobrovic, A. Assessing Gene-Specific Methylation Using HRM-Based Analysis. Recent Results Cancer Res. 2010, 687, 207–217. [Google Scholar] [CrossRef]
- Rand, K.N.; Ho, T.; Qu, W.; Mitchell, S.M.; White, R.; Clark, S.J.; Molloy, P.L. Headloop suppression PCR and its application to selective amplification of methylated DNA sequences. Nucleic Acids Res. 2005, 33, e127. [Google Scholar] [CrossRef]
- Devaney, J.; Stirzaker, C.; Qu, W.; Song, J.Z.; Statham, A.L.; Patterson, K.I.; Horvath, L.G.; Tabor, B.; Coolen, M.W.; Hulf, T.; et al. Epigenetic Deregulation Across Chromosome 2q14.2 Differentiates Normal from Prostate Cancer and Provides a Regional Panel of Novel DNA Methylation Cancer Biomarkers. Cancer Epidemiol. Biomark. Prev. 2010, 20, 148–159. [Google Scholar] [CrossRef]
- Montavon, C.; Gloss, B.S.; Warton, K.; Barton, C.A.; Statham, A.L.; Scurry, J.P.; Tabor, B.; Nguyen, T.V.; Qu, W.; Samimi, G.; et al. Prognostic and diagnostic significance of DNA methylation patterns in high grade serous ovarian cancer. Gynecol. Oncol. 2012, 124, 582–588. [Google Scholar] [CrossRef]
- Xie, W.; Regan, M.M.; Buyse, M.; Halabi, S.; Kantoff, P.W.; Sartor, O.; Soule, H.; Clarke, N.W.; Collette, L.; Dignam, J.J.; et al. Metastasis-Free Survival Is a Strong Surrogate of Overall Survival in Localized Prostate Cancer. J. Clin. Oncol. 2017, 35, 3097–3104. [Google Scholar] [CrossRef]
- Zhang, A.; Chiam, K.; Haupt, Y.; Fox, S.; Birch, S.; Tilley, W.; Butler, L.M.; Knudsen, K.; Comstock, C.; Rasiah, K.; et al. An analysis of a multiple biomarker panel to better predict prostate cancer metastasis after radical prostatectomy. Int. J. Cancer 2018, 144, 1151–1159. [Google Scholar] [CrossRef]
- Yegnasubramanian, S.; Kowalski, J.; Gonzalgo, M.L.; Zahurak, M.; Piantadosi, S.; Walsh, P.C.; Bova, G.S.; De Marzo, A.M.; Isaacs, W.B.; Nelson, W.G. Hypermethylation of CpG islands in primary and metastatic human prostate cancer. Cancer Res. 2004, 64, 1975–1986. [Google Scholar] [CrossRef] [PubMed]
- Rosenbaum, E.; Hoque, M.O.; Cohen, Y.; Zahurak, M.; Eisenberger, M.A.; Epstein, J.I.; Partin, A.W.; Sidransky, D. Promoter Hypermethylation as an Independent Prognostic Factor for Relapse in Patients with Prostate Cancer Following Radical Prostatectomy. Clin. Cancer Res. 2005, 11, 8321–8325. [Google Scholar] [CrossRef]
- Woodson, K.; O’Reilly, K.J.; Ward, D.E.; Walter, J.; Hanson, J.; Walk, E.L.; Tangrea, J.A. CD44 and PTGS2 Methylation are Independent Prognostic Markers for Biochemical Recurrence Among Prostate Cancer Patients with Clinically Localized Disease. Epigenetics 2006, 1, 183–186. [Google Scholar] [CrossRef] [PubMed]
- Henrique, R.; Ribeiro, F.R.; Fonseca, D.; Hoque, M.O.; Carvalho, A.L.; Costa, V.L.; Pinto, M.; Oliveira, J.; Teixeira, M.R.; Sidransky, D.; et al. High Promoter Methylation Levels of APC Predict Poor Prognosis in Sextant Biopsies from Prostate Cancer Patients. Clin. Cancer Res. 2007, 13, 6122–6129. [Google Scholar] [CrossRef]
- Ellinger, J.; Bastian, P.J.; Jurgan, T.; Biermann, K.; Kahl, P.; Heukamp, L.; Wernert, N.; Müller, S.; Von Ruecker, A. CpG Island Hypermethylation at Multiple Gene Sites in Diagnosis and Prognosis of Prostate Cancer. Urol. 2008, 71, 161–167. [Google Scholar] [CrossRef] [PubMed]
- Alumkal, J.J.; Zhang, Z.; Humphreys, E.B.; Bennett, C.; Mangold, L.A.; Carducci, M.A.; Partin, A.W.; Garrett-Mayer, E.; DeMarzo, A.M.; Herman, J.G. Effect of DNA Methylation on Identification of Aggressive Prostate Cancer. Urology 2008, 72, 1234–1239. [Google Scholar] [CrossRef] [PubMed]
- Weiss, G.; Cottrell, S.; Distler, J.; Schatz, P.; Kristiansen, G.; Ittmann, M.; Haefliger, C.; Lesche, R.; Hartmann, A.; Corman, J.; et al. DNA Methylation of the PITX2 Gene Promoter Region is a Strong Independent Prognostic Marker of Biochemical Recurrence in Patients With Prostate Cancer After Radical Prostatectomy. J. Urol. 2009, 181, 1678–1685. [Google Scholar] [CrossRef] [PubMed]
- Vanaja, D.K.; Ehrich, M.; Boom, D.V.D.; Cheville, J.C.; Karnes, R.J.; Tindall, D.J.; Cantor, C.R.; Young, C.Y. Hypermethylation of Genes for Diagnosis and Risk Stratification of Prostate Cancer. Cancer Investig. 2009, 27, 549–560. [Google Scholar] [CrossRef]
- Richiardi, L.; Fiano, V.; Vizzini, L.; De Marco, L.; Delsedime, L.; Akre, O.; Tos, A.G.; Merletti, F. Promoter Methylation in APC, RUNX3, and GSTP1 and Mortality in Prostate Cancer Patients. J. Clin. Oncol. 2009, 27, 3161–3168. [Google Scholar] [CrossRef]
- Bañez, L.L.; Sun, L.; Van Leenders, G.J.; Wheeler, T.M.; Bangma, C.H.; Freedland, S.J.; Ittmann, M.M.; Lark, A.L.; Madden, J.F.; Hartman, A.; et al. Multicenter Clinical Validation of PITX2 Methylation as a Prostate Specific Antigen Recurrence Predictor in Patients With Post-Radical Prostatectomy Prostate Cancer. J. Urol. 2010, 184, 149–156. [Google Scholar] [CrossRef]
- Vasiljevic, N.; Wu, K.; Brentnall, A.R.; Kim, D.C.; Thorat, M.A.; Kudahetti, S.C.; Mao, X.; Xue, L.; Yu, Y.; Shaw, G.L.; et al. Absolute quantitation of DNA methylation of 28 candidate genes in prostate cancer using pyrosequencing. Dis. Markers 2011, 30, 151–161. [Google Scholar] [CrossRef] [PubMed]
- Rosenbaum, E.; Begum, S.; Brait, M.; Zahurak, M.; Maldonado, L.; Mangold, L.A.; Eisenberger, M.A.; Epstein, J.I.; Partin, A.W.; Sidransky, D.; et al. AIM1 promoter hypermethylation as a predictor of decreased risk of recurrence following radical prostatectomy. Prostate 2011, 72, 1133–1139. [Google Scholar] [CrossRef] [PubMed]
- Vasiljević, N.; Ahmad, A.S.; Beesley, C.; Thorat, M.A.; Fisher, G.; Berney, D.M.; Moller, H.; Yu, Y.; Lu, Y.-J.; Cuzick, J.; et al. Association between DNA methylation of HSPB1 and death in low Gleason score prostate cancer. Prostate Cancer Prostatic Dis. 2012, 16, 35–40. [Google Scholar] [CrossRef]
- Dietrich, D.; Hasinger, O.; Bañez, L.L.; Sun, L.; Van Leenders, G.J.; Wheeler, T.M.; Bangma, C.H.; Wernert, N.; Perner, S.; Freedland, S.J.; et al. Development and Clinical Validation of a Real-Time PCR Assay for PITX2 DNA Methylation to Predict Prostate-Specific Antigen Recurrence in Prostate Cancer Patients Following Radical Prostatectomy. J. Mol. Diagn. 2013, 15, 270–279. [Google Scholar] [CrossRef] [PubMed]
- Richiardi, L.; Fiano, V.; Grasso, C.; Zugna, D.; Delsedime, L.; Gillio-Tos, A.; Merletti, F. Methylation of APC and GSTP1 in Non-Neoplastic Tissue Adjacent to Prostate Tumour and Mortality from Prostate Cancer. PLoS ONE 2013, 8, e68162. [Google Scholar] [CrossRef]
- Moritz, R.; Ellinger, J.; Nuhn, P.; Haese, A.; Müller, S.; Graefen, M.; Schlomm, T.; Bastian, P.-D.D.M.P.J. DNA hypermethylation as a predictor of PSA recurrence in patients with low- and intermediate-grade prostate cancer. Anticancer. Res. 2013, 33, 5249–5254. [Google Scholar]
- Vasiljević, N.; Ahmad, A.S.; Thorat, M.A.; Fisher, G.; Berney, D.M.; Moller, H.; Foster, C.S.; Cuzick, J.; Lorincz, A.T. DNA methylation gene-based models indicating independent poor outcome in prostate cancer. BMC Cancer 2014, 14, 655. [Google Scholar] [CrossRef]
- Vasiljević, N.; Ahmad, A.S.; Carter, P.D.; Fisher, G.; Berney, D.M.; Foster, C.S.; Cuzick, J.; Lorincz, A.T. DNA methylation ofPITX2predicts poor survival in men with prostate cancer. Biomark. Med. 2014, 8, 1143–1150. [Google Scholar] [CrossRef]
- Maldonado, L.; Brait, M.; Loyo, M.; Sullenberger, L.; Wang, K.; Peskoe, S.B.; Rosenbaum, E.; Howard, R.; Toubaji, A.; Albadine, R.; et al. GSTP1Promoter Methylation is Associated with Recurrence in Early Stage Prostate Cancer. J. Urol. 2014, 192, 1542–1548. [Google Scholar] [CrossRef]
- Daniunaite, K.; Jarmalaite, S.; Kalinauskaite, N.; Petroska, D.; Laurinavicius, A.; Lazutka, J.R.; Jankevicius, F. Prognostic Value of RASSF1 Promoter Methylation in Prostate Cancer. J. Urol. 2014, 192, 1849–1855. [Google Scholar] [CrossRef]
- Litovkin, K.; Van Eynde, A.; Joniau, S.; Lerut, E.; Laenen, A.; Gevaert, T.; Gevaert, O.; Spahn, M.; Kneitz, B.; Gramme, P.; et al. DNA Methylation-Guided Prediction of Clinical Failure in High-Risk Prostate Cancer. PLoS ONE 2015, 10, e0130651. [Google Scholar] [CrossRef] [PubMed]
- Carozzi, F.M.; Tamburrino, L.; Bisanzi, S.; Marchiani, S.; Paglierani, M.; Di Lollo, S.; Crocetti, E.; Buzzoni, C.; Burroni, E.; Greco, L.; et al. Are biomarkers evaluated in biopsy specimens predictive of prostate cancer aggressiveness? J. Cancer Res. Clin. Oncol. 2015, 142, 201–212. [Google Scholar] [CrossRef] [PubMed]
- Rybicki, B.A.; Rundle, A.; Kryvenko, O.N.; Mitrache, N.; Do, K.C.; Jankowski, M.; Chitale, D.; Trudeau, S.; Belinsky, S.A.; Tang, D. Methylation in benign prostate and risk of disease progression in men subsequently diagnosed with prostate cancer. Int. J. Cancer 2016, 138, 2884–2893. [Google Scholar] [CrossRef]
- Holmes, E.E.; Goltz, D.; Sailer, V.; Jung, M.; Meller, S.; Uhl, B.; Dietrich, J.; Röhler, M.; Ellinger, J.; Kristiansen, G.; et al. PITX3 promoter methylation is a prognostic biomarker for biochemical recurrence-free survival in prostate cancer patients after radical prostatectomy. Clin. Epigenetics 2016, 8, 104. [Google Scholar] [CrossRef] [PubMed]
- Ahmad, A.S.; Vasiljević, N.; Carter, P.; Berney, D.M.; Moller, H.; Foster, C.S.; Cuzick, J.; Lorincz, A.T. A novel DNA methylation score accurately predicts death from prostate cancer in men with low to intermediate clinical risk factors. Oncotarget 2016, 7, 71833–71840. [Google Scholar] [CrossRef] [PubMed]
- Uhl, B.; Gevensleben, H.; Tolkach, Y.; Sailer, V.; Majores, M.; Jung, M.; Meller, S.; Stein, J.; Ellinger, J.; Dietrich, D.; et al. PITX2 DNA Methylation as Biomarker for Individualized Risk Assessment of Prostate Cancer in Core Biopsies. J. Mol. Diagn. 2017, 19, 107–114. [Google Scholar] [CrossRef] [PubMed]
- Van Neste, L.; Herman, J.G.; Otto, G.; Bigley, J.W.; Epstein, J.I.; Van Criekinge, W. The Epigenetic promise for prostate cancer diagnosis. Prostate 2011, 72, 1248–1261. [Google Scholar] [CrossRef] [PubMed]
- Tew, K.D.; Manevich, Y.; Grek, C.; Xiong, Y.; Uys, J.; Townsend, D.M. The role of glutathione S-transferase P in signaling pathways and S-glutathionylation in cancer. Free. Radic. Biol. Med. 2011, 51, 299–313. [Google Scholar] [CrossRef]
- Henrique, R.; Jerónimo, C. Molecular Detection of Prostate Cancer: A Role for GSTP1 Hypermethylation. Eur. Urol. 2004, 46, 660–669. [Google Scholar] [CrossRef]
- Aoki, K.; Taketo, M.M. Adenomatous polyposis coli (APC): A multi-functional tumor suppressor gene. J. Cell Sci. 2007, 120, 3327–3335. [Google Scholar] [CrossRef]
- Chen, Y.; Li, J.; Yu, X.; Li, S.; Zhang, X.; Mo, Z.; Hu, Y. APC gene hypermethylation and prostate cancer: A systematic review and meta-analysis. Eur. J. Hum. Genet. 2013, 21, 929–935. [Google Scholar] [CrossRef] [PubMed]
- Moison, C.; Assemat, F.; Daunay, A.; Tost, J.; Guieysse-Peugeot, A.-L.; Arimondo, P.B. Synergistic chromatin repression of the tumor suppressor gene RARB in human prostate cancers. Epigenetics 2014, 9, 477–482. [Google Scholar] [CrossRef] [PubMed]
- Kioussi, C.; Briata, P.; Baek, S.H.; Rose, D.W.; Hamblet, N.S.; Herman, T.; Ohgi, K.A.; Lin, C.; Gleiberman, A.; Wang, J.; et al. Identification of a Wnt/Dvl/β-Catenin → Pitx2 Pathway Mediating Cell-Type-Specific Proliferation during Development. Cell 2002, 111, 673–685. [Google Scholar] [CrossRef]
- Harbeck, N.; Nimmrich, I.; Hartmann, A.; Ross, J.S.; Cufer, T.; Grützmann, R.; Kristiansen, G.; Paradiso, A.; Hartmann, O.; Margossian, A.; et al. Multicenter Study Using Paraffin-Embedded Tumor Tissue Testing PITX2 DNA Methylation As a Marker for Outcome Prediction in Tamoxifen-Treated, Node-Negative Breast Cancer Patients. J. Clin. Oncol. 2008, 26, 5036–5042. [Google Scholar] [CrossRef] [PubMed]
- Goltz, D.; Holmes, E.E.; Gevensleben, H.; Sailer, V.; Dietrich, J.; Jung, M.; Röhler, M.; Meller, S.; Ellinger, J.; Kristiansen, G.; et al. CXCL12 promoter methylation and PD-L1 expression as prognostic biomarkers in prostate cancer patients. Oncotarget 2016, 7, 53309–53320. [Google Scholar] [CrossRef]
- Gevensleben, H.; Holmes, E.E.; Goltz, D.; Dietrich, J.; Sailer, V.; Ellinger, J.; Dietrich, D.; Kristiansen, G. PD-L1 promoter methylation is a prognostic biomarker for biochemical recurrence-free survival in prostate cancer patients following radical prostatectomy. Oncotarget 2016, 7, 79943–79955. [Google Scholar] [CrossRef]
- Meller, S.; Zipfel, L.; Gevensleben, H.; Dietrich, J.; Ellinger, J.; Majores, M.; Stein, J.; Sailer, V.; Jung, M.; Kristiansen, G.; et al. CDO1 promoter methylation is associated with gene silencing and is a prognostic biomarker for biochemical recurrence-free survival in prostate cancer patients. Epigenetics 2016, 11, 871–880. [Google Scholar] [CrossRef]
- Nørgaard, M.; Haldrup, C.; Storebjerg, T.M.; Vestergaard, E.M.; Wild, P.J.; Høyer, S.; Borre, M.; Ørntoft, T.; Sørensen, K.D. Comprehensive Evaluation of TFF3 Promoter Hypomethylation and Molecular Biomarker Potential for Prostate Cancer Diagnosis and Prognosis. Int. J. Mol. Sci. 2017, 18, 2017. [Google Scholar] [CrossRef]
- Haldrup, C.; Pedersen, A.L.; Ogaard, N.; Strand, S.H.; Hoyer, S.; Borre, M.; Orntoft, T.F.; Sorensen, K.D. Biomarker potential of ST6G ALNAC3 and ZNF660 promoter hypermethylation in prostate cancer tissue and liquid biopsies. Mol. Oncol. 2018, 12, 545–560. [Google Scholar] [CrossRef]
- Haldrup, C.; Mundbjerg, K.; Vestergaard, E.M.; Lamy, P.; Wild, P.; Schulz, W.A.; Arsov, C.; Visakorpi, T.; Borre, M.; Høyer, S.; et al. DNA Methylation Signatures for Prediction of Biochemical Recurrence After Radical Prostatectomy of Clinically Localized Prostate Cancer. J. Clin. Oncol. 2013, 31, 3250–3258. [Google Scholar] [CrossRef]
- Torres-Ferreira, J.; Ramalho-Carvalho, J.; Gomez, A.; Menezes, F.D.; Freitas, R.; Oliveira, J.; Antunes, L.; Bento, M.J.; Esteller, M.; Henrique, R.; et al. MiR1-93b promoter methylation accurately detects prostate cancer in urine sediments and miR3-4b/c or miR1-29-2 promoter methylation define subsets of clinically aggressive tumors. Mol. Cancer 2017, 16, 26. [Google Scholar] [CrossRef] [PubMed]
- Daniunaite, K.; Dubikaityte, M.; Gibas, P.; Bakavicius, A.; Lazutka, J.R.; Ulys, A.; Jankevicius, F.; Jarmalaite, S. Clinical significance of miRNA host gene promoter methylation in prostate cancer. Hum. Mol. Genet. 2017, 26, 2451–2461. [Google Scholar] [CrossRef] [PubMed]
- Strand, S.H.; świtnicki, M.; Moller, M.; Haldrup, C.; Storebjerg, T.M.; Hedegaard, J.; Nordentoft, I.; Hoyer, S.; Borre, M.; Pedersen, J.S.; et al. RHCG and TCAF1 promoter hypermethylation predicts biochemical recurrence in prostate cancer patients treated by radical prostatectomy. Oncotarget 2016, 8, 5774–5788. [Google Scholar] [CrossRef]
- Bjerre, M.T.; Strand, S.H.; Nørgaard, M.; Kristensen, H.; Rasmussen, A.K.; Mortensen, M.M.; Fredsøe, J.; Mouritzen, P.; Ulhøi, B.; Ørntoft, T.; et al. Aberrant DOCK2, GRASP, HIF3A and PKFP Hypermethylation has Potential as a Prognostic Biomarker for Prostate Cancer. Int. J. Mol. Sci. 2019, 20, 1173. [Google Scholar] [CrossRef]
- Li, X.; Zhang, W.; Song, J.; Zhang, X.; Ran, L.; He, Y. SLCO4C1 promoter methylation is a potential biomarker for prognosis associated with biochemical recurrence-free survival after radical prostatectomy. Clin. Epigenetics 2019, 11, 99. [Google Scholar] [CrossRef]
- Nørgaard, M.; Haldrup, C.; Bjerre, M.T.; Høyer, S.; Ulhøi, B.P.; Borre, M.; Sorensen, K.D. Epigenetic silencing of MEIS2 in prostate cancer recurrence. Clin. Epigenetics 2019, 11, 147. [Google Scholar] [CrossRef]
- Cottrell, S.; Jung, K.; Kristiansen, G.; Eltze, E.; Semjonow, A.; Ittmann, M.; Hartmann, A.; Stamey, T.; Haefliger, C.; Weiss, G. Discovery and Validation of 3 Novel DNA Methylation Markers of Prostate Cancer Prognosis. J. Urol. 2007, 177, 1753–1758. [Google Scholar] [CrossRef]
- Lin, P.-C.; Giannopoulou, E.G.; Park, K.; Mosquera, J.M.; Sboner, A.; Tewari, A.K.; Garraway, L.A.; Beltran, H.; Rubin, M.A.; Elemento, O. Epigenomic Alterations in Localized and Advanced Prostate Cancer. Neoplasia 2013, 15, 373-IN5. [Google Scholar] [CrossRef]
- Bhasin, J.M.; Lee, B.H.; Matkin, L.; Taylor, M.G.; Hu, B.; Xu, Y.; Magi-Galluzzi, C.; Klein, E.A.; Ting, A.H. Methylome-wide Sequencing Detects DNA Hypermethylation Distinguishing Indolent from Aggressive Prostate Cancer. Cell Rep. 2015, 13, 2135–2146. [Google Scholar] [CrossRef]
- Kron, K.; Pethe, V.; Briollais, L.; Sadikovic, B.; Ozcelik, H.; Sunderji, A.; Venkateswaran, V.; Pinthus, J.; Fleshner, N.; Van Der Kwast, T.; et al. Discovery of Novel Hypermethylated Genes in Prostate Cancer Using Genomic CpG Island Microarrays. PLoS ONE 2009, 4, e4830. [Google Scholar] [CrossRef]
- Kron, K.J.; Liu, L.; Pethe, V.V.; Demetrashvili, N.; Nesbitt, M.E.; Trachtenberg, J.; Ozcelik, H.; Fleshner, N.E.; Briollais, L.; Van Der Kwast, T.H.; et al. DNA methylation of HOXD3 as a marker of prostate cancer progression. Lab. Investig. 2010, 90, 1060–1067. [Google Scholar] [CrossRef] [PubMed]
- Liu, L.; Kron, K.J.; Pethe, V.V.; Demetrashvili, N.; Nesbitt, M.; Trachtenberg, J.; Ozcelik, H.; Fleshner, N.E.; Briollais, L.; Van Der Kwast, T.H.; et al. Association of tissue promoter methylation levels of APC, TGFβ2, HOXD3 and RASSF1A with prostate cancer progression. Int. J. Cancer 2011, 129, 2454–2462. [Google Scholar] [CrossRef] [PubMed]
- Jeyapala, R.; Savio, A.J.; Olkhov-Mitsel, E.; Kamdar, S.; Zhao, F.; Cuizon, C.; Liu, R.S.; Zlotta, A.; Fleshner, N.; Van Der Kwast, T.; et al. GBX2 Methylation Is a Novel Prognostic Biomarker and Improves Prediction of Biochemical Recurrence Among Patients with Prostate Cancer Negative for Intraductal Carcinoma and Cribriform Architecture. Eur. Urol. Oncol. 2019, 2, 231–238. [Google Scholar] [CrossRef] [PubMed]
- Jeyapala, R.; Kamdar, S.; Olkhov-Mitsel, E.; Savio, A.J.; Zhao, F.; Cuizon, C.; Liu, R.S.; Zlotta, A.; Fleshner, N.; Van Der Kwast, T.; et al. An integrative DNA methylation model for improved prognostication of postsurgery recurrence and therapy in prostate cancer patients. Urol. Oncol. Semin. Orig. Investig. 2020, 38, 39.e1–39.e9. [Google Scholar] [CrossRef]
- Savio, A.J.; Kamdar, S.; Jeyapala, R.; Olkhov-Mitsel, E.; Cuizon, C.; Finelli, A.; Zlotta, A.R.; Toi, A.; Fleshner, N.E.; Van Der Kwast, T.; et al. Methylation Markers in Prostate Biopsies Are Prognosticators for Late Biochemical Recurrence and Therapy after Surgery in Prostate Cancer Patients. J. Mol. Diagn. 2019, 22, 30–39. [Google Scholar] [CrossRef]
- Goh, L.-K.; Liem, N.; Vijayaraghavan, A.; Chen, G.; Lim, P.L.; Tay, K.J.; Chang, M.; Low, J.S.W.; Joshi, A.; Huang, H.H.; et al. Diagnostic and Prognostic Utility of a DNA Hypermethylated Gene Signature in Prostate Cancer. PLoS ONE 2014, 9, e91666. [Google Scholar] [CrossRef]
- Angulo, J.; López, J.I.; Dorado, J.F.; Sanchez-Chapado, M.; Colas, B.; Ropero, S. A DNA Hypermethylation Profile Independently Predicts Biochemical Recurrence Following Radical Prostatectomy. Urol. Int. 2016, 97, 16–25. [Google Scholar] [CrossRef]
- Kobayashi, Y.; Absher, D.M.; Gulzar, Z.G.; Young, S.R.; McKenney, J.K.; Peehl, D.M.; Brooks, J.D.; Myers, R.M.; Sherlock, G. DNA methylation profiling reveals novel biomarkers and important roles for DNA methyltransferases in prostate cancer. Genome Res. 2011, 21, 1017–1027. [Google Scholar] [CrossRef]
- Mahapatra, S.; Klee, E.W.; Young, C.Y.F.; Sun, Z.; Jimenez, R.E.; Klee, G.G.; Tindall, D.J.; Donkena, K.V. Global Methylation Profiling for Risk Prediction of Prostate Cancer. Clin. Cancer Res. 2012, 18, 2882–2895. [Google Scholar] [CrossRef]
- Geybels, M.S.; Wright, J.L.; Bibikova, M.; Klotzle, B.; Fan, J.-B.; Zhao, S.; Feng, Z.; Ostrander, E.A.; Lin, D.; Nelson, P.S.; et al. Epigenetic signature of Gleason score and prostate cancer recurrence after radical prostatectomy. Clin. Epigenetics 2016, 8, 97. [Google Scholar] [CrossRef]
- Zhao, S.; Geybels, M.S.; Leonardson, A.; Rubicz, R.; Kolb, S.; Yan, Q.; Klotzle, B.; Bibikova, M.; Hurtado-Coll, A.; Troyer, D.; et al. Epigenome-Wide Tumor DNA Methylation Profiling Identifies Novel Prognostic Biomarkers of Metastatic-Lethal Progression in Men Diagnosed with Clinically Localized Prostate Cancer. Clin. Cancer Res. 2016, 23, 311–319. [Google Scholar] [CrossRef] [PubMed]
- Zhao, S.; Leonardson, A.; Geybels, M.S.; McDaniel, A.S.; Yu, M.; Kolb, S.; Zong, H.; Carter, K.; Siddiqui, J.; Cheng, A.; et al. A five-CpG DNA methylation score to predict metastatic-lethal outcomes in men treated with radical prostatectomy for localized prostate cancer. Prostate 2018, 78, 1084–1091. [Google Scholar] [CrossRef] [PubMed]
- Mundbjerg, K.; Chopra, S.; Alemozaffar, M.; Duymich, C.; Lakshminarasimhan, R.; Nichols, P.W.; Aron, M.; Siegmund, K.D.; Ukimura, O.; Aron, M.; et al. Identifying aggressive prostate cancer foci using a DNA methylation classifier. Genome Biol. 2017, 18, 3. [Google Scholar] [CrossRef] [PubMed]
- Toth, R.; Schiffmann, H.; Hube-Magg, C.; Büscheck, F.; Höflmayer, D.; Weidemann, S.; Lebok, P.; Fraune, C.; Minner, S.; Schlomm, T.; et al. Random forest-based modelling to detect biomarkers for prostate cancer progression. Clin. Epigenetics 2019, 11, 148. [Google Scholar] [CrossRef]
- Gerhauser, C.; Favero, F.; Risch, T.; Simon, R.; Feuerbach, L.; Assenov, Y.; Heckmann, D.; Sidiropoulos, N.; Waszak, S.M.; Hübschmann, D.; et al. Molecular Evolution of Early-Onset Prostate Cancer Identifies Molecular Risk Markers and Clinical Trajectories. Cancer Cell 2018, 34, 996–1011. [Google Scholar] [CrossRef]
- Liang, G.; Gonzalgo, M.L.; Salem, C.; Jones, P.A. Identification of DNA methylation differences during tumorigenesis by methylation-sensitive arbitrarily primed polymerase chain reaction. Methods 2002, 27, 150–155. [Google Scholar] [CrossRef]
- Toyota, M.; Issa, J.-P.J.; Mills, K.I.; Ramsahoye, B.H. Methylated CpG Island Amplification for Methylation Analysis and Cloning Differentially Methylated Sequences. DNA Methylation Protoc. 2003, 200, 101–110. [Google Scholar] [CrossRef]
- Stott-Miller, M.; Zhao, S.; Wright, J.L.; Kolb, S.; Bibikova, M.; Klotzle, B.; Ostrander, E.A.; Fan, J.-B.; Feng, Z.; Stanford, J.L. Validation study of genes with hypermethylated promoter regions associated with prostate cancer recurrence. Cancer Epidemiol. Biomark. Prev. 2014, 23, 1331–1339. [Google Scholar] [CrossRef]
- Altuna, A.; Garrett-Bakelman, F.E.; Kormaksson, M.; Busuttil, J.; Zhang, L.; Khrebtukova, I.; Milne, T.A.; Huang, Y.; Biswas, D.; Hess, J.L.; et al. Base-Pair Resolution DNA Methylation Sequencing Reveals Profoundly Divergent Epigenetic Landscapes in Acute Myeloid Leukemia. PLoS Genet. 2012, 8, e1002781. [Google Scholar] [CrossRef]
- Garrett-Bakelman, F.; Sheridan, C.K.; Kacmarczyk, T.J.; Ishii, J.; Betel, R.; Alonso, A.; Mason, C.E.; Figueroa, M.E.; Melnick, A.M. Enhanced reduced representation bisulfite sequencing for assessment of DNA methylation at base pair resolution. J. Vis. Exp. 2015, 10, e52246. [Google Scholar] [CrossRef]
- Hopkins, T.G.; Burns, P.A.; Routledge, M. DNA Methylation of GSTP1 as Biomarker in Diagnosis of Prostate Cancer. Urol. 2007, 69, 11–16. [Google Scholar] [CrossRef] [PubMed]
- Stirzaker, C.; Taberlay, P.C.; Statham, A.L.; Clark, S.J. Mining cancer methylomes: Prospects and challenges. Trends Genet. 2014, 30, 75–84. [Google Scholar] [CrossRef] [PubMed]
- Serre, D.; Lee, B.H.; Ting, A.H. MBD-isolated Genome Sequencing provides a high-throughput and comprehensive survey of DNA methylation in the human genome. Nucleic Acids Res. 2009, 38, 391–399. [Google Scholar] [CrossRef] [PubMed]
- Abeshouse, A.; Ahn, J.; Akbani, R.; Ally, A.; Amin, S.; Andry, C.D.; Annala, M.; Aprikian, A.; Armenia, J.; Arora, A.; et al. The Molecular Taxonomy of Primary Prostate Cancer. Cell 2015, 163, 1011–1025. [Google Scholar] [CrossRef] [PubMed]
- Agilent. Human CpG Island Microarray. Available online: https://www.agilent.com/en/product/methylation-chip-on-chip-microarray-platform/epigenetic-specialty-microarrays/dna-methylation-microarrays/human-cpg-island-microarray2−28444#:~:text=Human%20CpG%20microarrays%20enable%20comprehensive,correlated%20to%20key%20biological%20processes.&text=237%2C220%20unique%20probes%20in%20or,genome%20in%20a%20single%20experiment (accessed on 11 September 2020).
- Illumina. High-Throughput DNA Methylation Profiling with Illumina GoldenGate Technology. Available online: https://sapac.illumina.com/content/dam/illumina-marketing/documents/products/datasheets/datasheet_goldengate_methylation.pdf (accessed on 11 September 2020).
- Bibikova, M.; Barnes, B.; Tsan, C.; Ho, V.; Klotzle, B.; Le, J.M.; Delano, D.; Zhang, L.; Schroth, G.P.; Gunderson, K.L.; et al. High density DNA methylation array with single CpG site resolution. Genomics 2011, 98, 288–295. [Google Scholar] [CrossRef] [PubMed]
- Pidsley, R.; Zotenko, E.; Peters, T.J.; Lawrence, M.G.; Risbridger, G.P.; Molloy, P.; Van Djik, S.; Muhlhausler, B.S.; Stirzaker, C.; Clark, S.J. Critical evaluation of the Illumina MethylationEPIC BeadChip microarray for whole-genome DNA methylation profiling. Genome Biol. 2016, 17, 208. [Google Scholar] [CrossRef]
- Lister, R.; Pelizzola, M.; Dowen, R.H.; Hawkins, R.D.; Hon, G.; Tonti-Filippini, J.; Nery, J.R.; Lee, L.; Ye, Z.; Ngo, Q.-M.; et al. Human DNA methylomes at base resolution show widespread epigenomic differences. Nat. Cell Biol. 2009, 462, 315–322. [Google Scholar] [CrossRef]
- Shen, S.Y.; Singhania, R.; Fehringer, G.; Chakravarthy, A.; Roehrl, M.H.A.; Chadwick, D.; Zuzarte, P.C.; Borgida, A.; Wang, T.T.; Li, T.; et al. Sensitive tumour detection and classification using plasma cell-free DNA methylomes. Nat. Cell Biol. 2018, 563, 579–583. [Google Scholar] [CrossRef]
- Lee, T.-H.; Montalvo, L.; Chrebtow, V.; Busch, M.P. Quantitation of genomic DNA in plasma and serum samples: Higher concentrations of genomic DNA found in serum than in plasma. Transfusion 2001, 41, 276–282. [Google Scholar] [CrossRef]
- Schwarzenbach, H.; Hoon, D.S.B.; Pantel, K. Cell-free nucleic acids as biomarkers in cancer patients. Nat. Rev. Cancer 2011, 11, 426–437. [Google Scholar] [CrossRef]
- Wu, T.; Giovannucci, E.; Welge, J.; Mallick, P.; Tang, W.-Y.; Ho, S.-M. Measurement of GSTP1 promoter methylation in body fluids may complement PSA screening: A meta-analysis. Br. J. Cancer 2011, 105, 65–73. [Google Scholar] [CrossRef]
- Cairns, P.; Esteller, M.; Herman, J.G.; Schoenberg, M.; Jeronimo, C.; Sanchez-Cespedes, M.; Chow, N.H.; Grasso, M.; Wu, L.; Westra, W.B.; et al. Molecular detection of prostate cancer in urine by GSTP1 hypermethylation. Clin. Cancer Res. 2001, 7, 2727–2730. [Google Scholar]
- Baden, J.; Adams, S.; Astacio, T.; Jones, J.; Markiewicz, J.; Painter, J.; Trust, C.; Wang, Y.; Green, G. Predicting Prostate Biopsy Result in Men With Prostate Specific Antigen 2.0 to 10.0 ng/mL Using an Investigational Prostate Cancer Methylation Assay. J. Urol. 2011, 186, 2101–2106. [Google Scholar] [CrossRef] [PubMed]
- O’Reilly, E.; Tuzova, A.V.; Walsh, A.L.; Russell, N.M.; O’Brien, O.; Kelly, S.; Ni Dhomhnallain, O.; DeBarra, L.; Dale, C.M.; Brugman, R.; et al. epiCaPture: A Urine DNA Methylation Test for Early Detection of Aggressive Prostate Cancer. JCO Precis. Oncol. 2019, 2019, 1–18. [Google Scholar] [CrossRef]
- Cooperberg, M.R.; Pasta, D.J.; Elkin, E.P.; Litwin, M.S.; Latini, D.M.; Du Chane, J.; Carroll, P.R. The University of California, San Francisco Cancer of the Prostate Risk Assessment Score: A Straightforward and Reliable Preoperative Predictor of Disease Recurrence after Radical Prostatectomy. J. Urol. 2005, 173, 1938–1942. [Google Scholar] [CrossRef]
- Zhao, F.; Jeyapala, R.; Olkhov-Mitsel, E.; Vesprini, D.; Fleshner, N.E.; Bapat, B. Re: Urinary DNA Methylation Biomarkers for Noninvasive Prediction of Aggressive Disease in Patients with Prostate Cancer on Active Surveillance. J. Urol. 2018, 199, 1354–1355. [Google Scholar] [CrossRef]
- Moreira-Barbosa, C.; Barros-Silva, D.; Costa-Pinheiro, P.; Torres-Ferreira, J.; Constâncio, V.; Freitas, R.; Oliveira, J.; Antunes, L.; Henrique, R.; Jerónimo, C. Comparing diagnostic and prognostic performance of two-gene promoter methylation panels in tissue biopsies and urines of prostate cancer patients. Clin. Epigenetics 2018, 10, 132. [Google Scholar] [CrossRef] [PubMed]
- Bastian, P.J.; Palapattu, G.S.; Lin, X.; Yegnasubramanian, S.; Mangold, L.A.; Trock, B.; Eisenberger, M.A.; Partin, A.W.; Nelson, W.G. Preoperative Serum DNA GSTP1 CpG Island Hypermethylation and the Risk of Early Prostate-Specific Antigen Recurrence Following Radical Prostatectomy. Clin. Cancer Res. 2005, 11, 4037–4043. [Google Scholar] [CrossRef]
- Mahon, K.L.; Qu, W.; Devaney, J.; Paul, C.; Castillo, L.; Wykes, R.J.; Chatfield, M.D.; Boyer, M.J.; Stockler, M.R.; Marx, G.; et al. Methylated Glutathione S-transferase 1 (mGSTP1) is a potential plasma free DNA epigenetic marker of prognosis and response to chemotherapy in castrate-resistant prostate cancer. Br. J. Cancer 2014, 111, 1802–1809. [Google Scholar] [CrossRef]
- Reibenwein, J.; Pils, D.; Horak, P.; Tomicek, B.; Goldner, G.; Worel, N.; Elandt, K.; Krainer, M. Promoter hypermethylation of GSTP1, AR, and 14-3-3σ in serum of prostate cancer patients and its clinical relevance. Prostate 2007, 67, 427–432. [Google Scholar] [CrossRef]
- Hendriks, R.J.; Dijkstra, S.; Smit, F.P.; Vandersmissen, J.; Van De Voorde, H.; Mulders, P.F.A.; Van Oort, I.M.; Van Criekinge, W.; Schalken, J. Epigenetic markers in circulating cell-free DNA as prognostic markers for survival of castration-resistant prostate cancer patients. Prostate 2018, 78, 336–342. [Google Scholar] [CrossRef] [PubMed]
- Sunami, E.; Shinozaki, M.; Higano, C.S.; Wollman, R.; Dorff, T.B.; Tucker, S.J.; Martinez, S.R.; Singer, F.R.; Hoon, D.S. Multimarker Circulating DNA Assay for Assessing Blood of Prostate Cancer Patients. Clin. Chem. 2009, 55, 559–567. [Google Scholar] [CrossRef]
- Horning, A.M.; Awe, J.A.; Wang, C.-M.; Liu, J.; Lai, Z.; Wang, V.Y.; Jadhav, R.R.; Louie, A.D.; Lin, C.-L.; Kroczak, T.; et al. DNA methylation screening of primary prostate tumors identifies SRD5A2 and CYP11A1 as candidate markers for assessing risk of biochemical recurrence. Prostate 2015, 75, 1790–1801. [Google Scholar] [CrossRef]
- Lin, Y.-L.; Li, Y.-L.; Ma, J.-G. Aberrant Promoter Methylation of Protocadherin8 (PCDH8) in Serum is a Potential Prognostic Marker for Low Gleason Score Prostate Cancer. Med Sci. Monit. 2017, 23, 4895–4900. [Google Scholar] [CrossRef]
- Sung, J.; Wang, Y.; Chandrasekaran, S.; Witten, D.M.; Price, N.D. Molecular signatures from omics data: From chaos to consensus. Biotechnol. J. 2012, 7, 946–957. [Google Scholar] [CrossRef]
- Peters, T.J.; Buckley, M.J.; Statham, A.L.; Pidsley, R.; Samaras, K.; Lord, R.V.; Clark, S.J.; Molloy, P.L. De novo identification of differentially methylated regions in the human genome. Epigenetics Chromatin 2015, 8, 6. [Google Scholar] [CrossRef] [PubMed]
- Yosefian, I.; Farkhani, E.M.; Baneshi, M.M. Application of Random Forest Survival Models to Increase Generalizability of Decision Trees: A Case Study in Acute Myocardial Infarction. Comput. Math. Methods Med. 2015, 2015, 576413. [Google Scholar] [CrossRef]
- Liu, C.; Wang, X.; Genchev, G.Z.; Lu, H. Multi-omics facilitated variable selection in Cox-regression model for cancer prognosis prediction. Methods 2017, 124, 100–107. [Google Scholar] [CrossRef]
- Kvamme, H.; Borgan, Ø.; Scheel, I. Time-to-Event Prediction with Neural Networks and Cox Regression. J. Mach. Learn. Res. 2019, 20, 1–30. [Google Scholar]
- Sanz, H.; Reverter, F.; Valim, C. Enhancing SVM for survival data using local invariances and weighting. BMC Bioinform. 2020, 21, 193. [Google Scholar] [CrossRef]
- Li, J.; Xu, C.; Lee, H.J.; Ren, S.; Zi, X.; Zhang, Z.; Wang, H.; Yu, Y.; Yang, C.; Gao, X.; et al. A genomic and epigenomic atlas of prostate cancer in Asian populations. Nat. Cell Biol. 2020, 580, 93–99. [Google Scholar] [CrossRef] [PubMed]
- González-Billalabeitia, E.; Conteduca, V.; Wetterskog, D.; Jayaram, A.; Attard, G. Circulating tumor DNA in advanced prostate cancer: Transitioning from discovery to a clinically implemented test. Prostate Cancer Prostatic Dis. 2018, 22, 195–205. [Google Scholar] [CrossRef] [PubMed]
- Korbie, D.; Lin, E.; Wall, D.; Nair, S.S.; Stirzaker, C.; Clark, S.J.; Trau, M. Multiplex bisulfite PCR resequencing of clinical FFPE DNA. Clin. Epigenetics 2015, 7, 28. [Google Scholar] [CrossRef]
- Lam, D.; Luu, P.-L.; Song, J.Z.; Qu, W.; Risbridger, G.P.; Lawrence, M.G.; Lu, J.; Trau, M.; Korbie, D.; Clark, S.J.; et al. Comprehensive evaluation of targeted multiplex bisulphite PCR sequencing for validation of DNA methylation biomarker panels. Clin. Epigenetics 2020, 12, 1–16. [Google Scholar] [CrossRef]


| Study [Ref] a | Primary Outcomes Examined | Total COHORT SIZE | Additional COHORT DETAILS | Follow-Up (Years) | Method | Genes Examined | Genes Validated b,c,d,e | Results g |
|---|---|---|---|---|---|---|---|---|
| Yegnasubramanian et al. [74] | BCR | n = 36 | n = ns BCR | Range: 8–13 | qMSP | GSTP1, APC, RASSF1, PTGS2, MDR1, HIC1, EDNRB, ESR1, CDKN2a, CDKN2b, p14/QRF, MGMT, hMLH1, TIMP3, DAPK1, CDH1 | U: PTGS2 M: PTGS2 [+ GS + pathological T-stage] | U: HR 2.82 (1.07–7.44), p = 0.04 M: HR 4.26 (1.36–13.36), p = 0.01 |
| Rosenbaum et al. [75] | Primary: Progression Secondary: Metastatic relapse and/or PCa death | n = 74 | n = 37 no progression, n = 37 progression (n = 14 BCR, n = 16 metastatic relapse, n = 7 PCa death) [all GS 7 (3 + 4)] | Min: 7, Median: 9 | qMSP | APC, CCND2, GSTP1, TIG1, RASSF1, RARB | Progression: U: GSTP1 M: [+ age > 60] (1) GSTP1 + APC; (2) GSTP1 + APC and/or CCND2 Metastatic relapse and/or PCa death: U: None M: None | Progression: U: HR 0.34 (0.13–0.88), p = 0.03 M: (1) GSTP1 [HR 0.23 (0.09–0.64), p = 0.004], APC [HR 3.0 (1.42–6.32), p = 0.0004; (2) GSTP1 [HR 0.29 (0.11–0.77), p = 0.01], APC or CCND2 methylated: [HR 1.84 (0.92–3.72), p = 0.09], APC + CCND2 [HR 4.33 (1.52–12.33), p = 0.01] Metastatic relapse and/or PCa death: U: non-sig; M: non-sig |
| Woodson et al. [76] | BCR | n = 60 | n = 49 no BCR, n = 11 BCR | Mean (SD): No BCR-6.5 (3.2) BCR-4.7 (2.8) | qMSP | GSTP1, RARB, CD44, PTGS2 | U: (1) CD44; (2) PTGS2 M: CD44 + PTGS2 [+ GS] | U: (1) OR 6.83 (1.67–27.99), p = 0.008; (2) OR 4.38 (1.13–17.40), p = 0.04 M: CD44 + PTGS2 [OR 8.87 (1.85–42.56), p = 0.006] |
| Henrique et al. [77] | Primary: PCa death Secondary: BCR | n = 83 | n = 15 PCa death, n = 37 BCR [Sextant biopsy cores] | Median (range): 3.7 (0.5–5) | qMSP | APC, CCND2, GSTP1, RARB, RASSF1 | PCa death: U: APC M: APC [+ Clinical T-stage] BCR: U: (1) APC; (2) GSTP1; (3) RASSF1 M: APC [+ Clinical T-stage] | PCa death: U: Log-rank p = 0.010 M: OR 3.51 (1.23–9.96), p = 0.018 BCR: U: Log-rank (1) p = 0.002; (2) p = 0.047; (3) p = 0.019 M: OR 2.58 (1.29–5.16), p = 0.008 |
| Ellinger et al. [78] | BCR | n = 41 | n = 28 no BCR, n = 13 BCR | Mean; median (range): 2.3; 1.7 (0.5–6) | qMSP | Annexin2, APC, EDNRB, GSTP1, PTGS2, MDR1, RARB, Reprimo, TIG1 | U: (1) APC + Reprimo, (2) > 5 genes hypermethylated together M: None | U: Log-rank (1) p = 0.0078; (2) p = 0.0074 M: non-sig |
| Alumkal et al. [79] | BCR | n = 151 | n = 104 no BCR, n = 47 BCR | At least 5 years | Nested MSP | GSTP1, MGMT, ASC, CDKN2A, EDNRB, CDH13, CD44, TIMP3, RUNX3, APC, WIF1− | U: CDKN2A M: CDH13 and/or ASC [+ GS + extra capsular penetration + seminal vesicle involvement +margin status] | U: OR 0.43 (0.19–0.98), p = 0.05 M: CDH13 [OR 5.51 (1.34–22.67), p = 0.02], CDH13 and/or ASC [OR 5.64 (1.47–21.7), p = 0.01, sensitivity = 72.3%, specificity = 48%] |
| Weiss et al. [80] | BCR | n = 605 | n = 540 no BCR, n = 65 BCR | Median: 5.5 | qMSP | ABHD9, Chr3-EST, GPR7, HIST2H 2B F, CCND2, PITX2 | U: (1) ABHD9; (2) Chr3-EST; (3) GPR7; (4) HIST2H 2B F; (5) PITX2 (also in GS7 only and GS8 only patients) M: PITX2 [+ GS + pathological T-stage] | U: (1) HR 1.9 (1.1–3.1), p = 0.02; (2) HR 2.1 (12–3.5), p = 0.007; (3) HR 2.3 (1.4–3.9), p = 0.002; (4) HR 1.9 (1.1–3.1), p = 0.018; (5) HR 3.4 (1.9–6.0), p < 0.001, GS7 log-rank p = 0.007, GS8 log-rank p = 0.023 M: HR 2.5 (1.1–5.8), p = 0.032 |
| Vanaja et al. [81] | Recurrence within 5 years | n = 64 | n = 32 no recurrence, n = 32 recurrence (n = 10 BCR, n = 10 local, n = 12 metastatic relapse) | Range: 0–5 | MassARRAY EpiTYPER | FLNC, EFS, ECRG4, RARB, PITX2, GSTP1, PDLIM4, KCNMA1 | U: (1) FLNC (6 CpG units), (2) GSTP1 (3 CpG units), (3) PITX2 (1 CpG unit), (4) EFS (1 CpG unit) (5) Methylation score: top 11 CpG units from FLNC, EFS, PITX2, PDLIM4, KCNMA1 (also subgroups of patients with local recurrence, metastatic relapse and BCR) M: Methylation score [+p re-op PSA + GPSM prognostic score using weighted sum of GS, PSA, seminal vesicle involvement and marginal status] | U: (1) Sensitivity = 71.43–78.57%/Specificity = 62.52–75.12%; (2) 63.33–76.92%/72.73–81.82%; (3) 66.67%/64.29%; (4) 62.50%/60.02%; (5) 71.12%/71.90%; local recurrence only: 80.32%/81.2%; metastatic relapse only: 72.72%/75.14%; BCR: 60.26%/59.42% M: Sensitivity = 80%, Specificity = 81.2%, AUC 0.852 |
| Richiardi et al. [82] | PCa death | 1980s cohort: n = 216 1990s cohort: n = 243 | 1980s cohort: n = 95 no PCa death, n = 121 PCa death 1990s cohort: n = 167 no PCa death n = 76 PCa death | Median (range): 1980s cohort—3.1 (0–14) 1990s cohort—6.3 (0–14) | MSP | APC, RUNX3, GSTP1 | 1980s cohort: U: APC M: APC [+ source of tumour tissue + GS + follow-up duration] 1990s cohort: U: (1) APC, (2) RUNX3 M: [+ source of tumour tissue + GS + follow-up duration] (1) APC; (2) APC (GS < 8 only); (3) RUNX3; (4) RUNX3 (GS < 8 only) | (p-values not specified in this study) 1980s cohort: U: HR 1.46 M: HR 1.42 (0.98–2.07) 1990s cohort: U: (1) HR 1.99; (2) HR 1.74 M: (1) HR 1.57 (0.95–2.62); (2) HR 2.09 (1.02–4.28); (3) HR 1.56 (0.95–2.56); (4) HR 2.40 (1.18–4.91) |
| Banez et al. [83] | BCR | n = 476 | n = 370 no BCR, n = 106 BCR | ns | qMSP | PITX2 | U: PITX2 (also in GS7 patients only) M: PITX2 [+ GS + pathological T-stage + margin status] (also in GS7 patients only) | U: HR 2.99 (1.99–4.48), p < 0.001; GS7 only: HR 2.0 (1.2–3.3), p = 0.005; M: HR 2.39 (1.45–3.94), p < 0.001, C-index = 0.77; GS7 only: HR 1.87 (1.1–3.1), p = 0.02 |
| Vasiljevis et al. [84] | Low vs. High GS | n = 48 | n = 9 GS6, n = 23 GS7, n = 7 GS8, n = 9 GS9–10 | NA | Pyro sequencing | RARB, GSTP1, HIN1, APC, BCL2, CCND2, CDH13, EGFR5, NKX2–5, RASSF1, DPYS, MDR1, PTGS2, EDNRB, MAL, PDLIM4, HLAa, TIG1, ESR1, SLIT2, CDKN2A, MCAM, SFN, THRB, CDH1, TWIST1 | U: SFN, SLIT2, SERPINB5 (pairwise measures) M: Not conducted | U: SFN + SERPINB5: correctly classified 81% of high GS; SFN + SLIT2: 62%; SERPINB5 + SLIT2: 62% M: NA |
| Rosenbaum et al. [85] | Primary: Progression Secondary: Metastatic relapse and/or PCa death | n = 95 | n = 47 no progression, n = 48 progression (n = 22 BCR only, n = 17 metastatic relapse, n = 9 PCa death) [all GS 7 (3 + 4)] | All: At least 8 years No progression (Median (range))—10 (8–14) Progression (Median)—8 | qMSP | RBM6, MT1G, CDH1, AIM1, KIF1A, PAK3 | Progression: U: AIM1 M: AIM1 [+ age at diagnosis + lymph node status] Metastatic relapse and/or PCa death: U: None M: None | Progression: U: HR 0.4 (0.18–0.89), p = 0.02 M: HR = 0.45 (0.2–1.0), p = 0.05 Metastatic relapse and/or PCa death: U: non-sig M: non-sig |
| Vasiljevic et al. [86] | PCa death | n = 349 | n = 258 no PCa death, n = 91 PCa death | Median (max): 9.5 (20) | Pyro sequencing | HSPB1 | U: HSPB1 (in all samples and in subgroup of GS < 7) M: HSPB1 [+ GS + extent of disease (proportion of TURP) + PSA + HSPB1 × GS interaction term] | U: HR 1.77 (per 50% increase) (1.13–2.79), p = 0.02; GS < 7: p = 0.028 M: HSPB1 [HR 1.18 (per 10% increase) (0.98–1.41), p = 0.075], HSPB1 × GS [0.98 (0.97–0.99), p = 0.014]; model with HSPB1 vs. clinical variables only: Δχ2 = 6.673, df = 2, p = 0.036 |
| Dietrich et al. [87] | BCR | Training cohort: n =157 Testing cohort: n = 523 | Training cohort: n = ns BCR Testing cohort: n = 414 no BCR, n = 109 BCR (same cohort as Banez et al. [83]) | ns | qMSP | PITX2 | Training cohort: U: PITX2 M: Not conducted Testing cohort: U: PITX2, (2) PITX2 (subgroup of ≥ 75% tumour content), (3) PITX2 (subgroup of GS7 and ≥ 75% tumour content) M: (1) PITX2 [+ GS + pathological T-stage + PSA + surgical margins]; (2) PITX2 [+ tumour cell content + pathological T-stage] | Training cohort: U: 3.479 (1.2599¨C.614), p-value not given M: NA Testing cohort: U: HR 2.614 (1.79–53.807), p < 0.001; (2) log-rank p < 0.001; (3) log-rank p = 0.003 M: (1) HR 1.814 (1.232–2.673), p = 0.003; (2) HR 1.889 (1.259–2.832), p = 0.002 |
| Richiardi et al. [88] | PCa death | n = 157 | n = 114 no PCa death, n = 43 PCa death [Non-neoplastic tissue adjacent to prostate tumour] [nested in the 2 cohorts of Richiardi et al. [82]] | Median (range): 6.8 (0.03–24.1) | qMSP | APC, GSTP1 | U: (1) APC, (2) GSTP1 M: APC + GSTP1 [+ age at diagnosis + year of diagnosis + source of tumour tissue + methylation in prostate tumour tissue + GS] (also in restricted analyses of first 5 years of follow-up) | U: (1) HR 2.38 (1.23–4.61), p-value not given; (2) HR 2.92 (1.49–5.74), p-value not given M: APC + GSTP1 [HR 2.40 (1.15–5.01), p = 0.032]; first 5 yrs follow-up: HR 3.29 (1.27–8.52), p = 0.019 |
| Moritz et al. [89] | BCR | n = 84 | n = 31 no BCR, n = 53 BCR [GS 5–7] | Mean; median (range): 4; 1.8 (0–10.9) | qMSP | APC, GSTP1, PTGS2, RARB, TIG1 | U: RARB M: None | U: HR 2.686 (1.147–6.291), p = 0.023 M: non-sig |
| Vasiljevic et al. [90] | PCa death | n = 367 | n = 268 no PCa death, n = 99 PCa death [TURP tissues of men who chose not to be treated for at least 6 months following diagnosis—TAPG cohort] | Median (range): 9.5 (0.7–19.6) | Pyro sequencing | GSTP1, APC, RARB, CCND2, SLIT2, SFN, SERPINB5, MAL, DPYS, TIG1, HIN1, PDLIM4 and HSPB1 | U: (1) GSTP1; (2) APC; (3) RARB; (4) CCND2; (5) SLIT2; (6) SFN; (7) MAL; (8) DPYS; (9) TIG1; (10) HIN1; (11) PDLIM4; and (12) HSPB1 M: DPYS + HSPB1 + CCND2 [+ GS, PSA + HSPB1 × GS interaction term] | U: All genes had an HR (per 10% increment) between 1.09 and 1.28, and p between 2.9 × 10⁻⁶ and 0.029. M: DPYS [HR 1.13 (1.03–1.25), p = 0.012], HSPB1 [HR 2.39 (1.15–4.97), p = 0.019], CCND2 [HR 0.86 (0.75–0.98), p = 0.024], HSPB1 × GS [HR 0.89 (0.81–0.97), p = 0.012], C-index = 0.83 (vs. 0.74 for GS + PSA only) |
| Vasiljevic et al. [91] | PCa death | n = 135 | n = 90 no PCa death, n = 45 PCa death [all GS ≤ 7] [subset of cohort from Vasiljevic et al. [90]] | No PCa death (Mean)—7.8 PCa death (Median (max))—15.3 (20) | Pyro sequencing | PITX2, WNT5A, SPARC, EPB4L 1L 3 and TPM4 | U: PITX2 (FDR adjustment = 5%) M: not conducted | U: OR 1.56 (per 10% increment) (1.17–2.08), adjusted p = 0.005 M: NA |
| Maldonado et al. [92] | Progression | n = 452 | n = 193 no progression, n = 259 progression | Range: 3–11 | qMSP | AIM1, APC, CCND2, GPX3, GSTP1, MCAM, RARB, SSBP2, TIMP3 | U: GSTP1 M: GSTP1 [+ age at surgery + pre-op PSA + positive surgical margins + surgery year + pathological T-stage + GS] (organ confined disease only) | U: Wilcoxon rank sum test p = 0.01 M: OR 1.73 (1.00–3.02), p = 0.05 |
| Daniunaite et al. [93] | BCR | n = 149 | n = ns BCR | No BCR (Median (range))—3.4 (0.2–5.5) | qMSP | RARB, GSTP1, RASSF1, MGMT, DAPK1, p16 and p14 | U: (1) RASSF1; (2) DAPK; (3) RASSF1 +/or DAPK1 M: RASSF1 [+pT] (GS6 only) | U: (1) HR 2.27 (1.12–4.63), p = 0.019; (2) HR 2.55 (1.11–5.84), p = 0.045; (3) HR 2.20 (1.06–4.54), p = 0.027 M: HR 5.81 (1.08–31.22), p = 0.042 |
| Litovkin et al. [94] | Clinical Failure | Training cohort: n = 147 Validation cohort: n = 71 | Training cohort: n = 117 no CF n = 30 CF Validation cohort: n = 58 no CF n = 13 CF [High-risk PCa patients: Clinical stage ≥ T3a, GS 8–10 and/or PSA > 20 ng/mL] | Median (range): Training cohort—6.8 (0.1–12.8) Validation cohort—11.5 (1.4–18.8) | Multiplex qMSP | APC, CCND2, GSTP1, PTGS2 and RARB | Training cohort: U: (1) GSTP1 (trichotomized); PTGS2 M: [+ pathological T-stage + GS + pre-op PSA] (1) GSTP1 (trichotomized); (2) PTGS2 Validation cohort: U: (1) GSTP1 (trichotomized); (2) CCND2; (3) RARB M: [+ pathological T-stage + GS + pre-op PSA] (1) GSTP1 (trichotomized); (2); (3) RARB | Training cohort: U: (1) HR 2.96 (1.38–6.36), p = 0.005; (2) HR 0.39 (0.18–0.81), p = 0.013 M: (1) HR 3.65 (1.65–8.07), p = 0.001, C-index = 0.72 (vs. 0.68 for stage + GS + PSA only); (2) HR 0.21 (0.09–0.50), p < 0.001 Validation cohort: U: (1) HR 3.34 (1.38–4.87), p = 0.003; (2) HR 0.21 (0.07–0.65), p = 0.007; (3) HR 3.45 (1.09–10.87), p = 0.035 M: (1)HR 4.27 (1.03–17.72), p = 0.046, C-index = 0.80 (vs. 0.75 for stage + GS + PSA only); (2) HR 0.19 (0.05–0.79), p = 0.022; (3) HR 3.81 (1.09–13.34), p = 0.036 |
| Carozzi et al. [95] | PCa death (within 10 yrs of diagnosis) | n = 129 | n = 91 alive > 10 yrs, n = 38 died ≤ 10 years [Needle biopsy specimens] | ns | Pyro sequencing | APC, SFN, SERPINB5, SLIT2, PITX2, AR | U: SERPINB5 f M: None | U: 2nd quartile [OR 1.54 (0.56–4.23)], 3rd quartile [HR 2.42 (0.91–6.49); p = 0.0474 M: non-sig |
| Rybicki et al. [96] | BCR | n = 353 | n = 262 no BCR, n = 91 BCR (White: n = 152 no BCR, n = 54 BCR African American: n = 110 no BCR, n = 37 BCR) [Benign prostate specimens—patients who eventually developed PCa] | Median (range): No BCR-6.3 (1–19) BCR-1.9 (0.2–14) | Nested MSP | RARB, APC, CTNND2, RASSF1 and MGMT | U: APC (White patients) M: (1) APC (White patients) [+ age at diagnosis + tumour stage + GS + pre-op PSA, treatment type]; (2) APC (White patients) [+ no other gene methylated + low PSA at cohort entry + inflammation was present]; (3) RARB (African American patients) [+ another gene methylated + absence of inflammation] | U: HR 2.07 (1.15–3.74), p = 0.02 M: (1) HR 2.26 (1.23–4.16), p = 0.01; (2) HR 3.28 (1.33–8.11), p = 0.01; (3) HR = 3.80 (1.07–13.53), p = 0.04 |
| Holmes et al. [97] | BCR | Cohort 1 (TCGA): n = 498 Cohort 2: n = 300 | Cohort 1: n = ns BCR Cohort 2: n = ns BCR | Mean; median: Cohort 1—1.83; 1.3 Cohort 2—5.5; 5.2 | Cohort 1—HM450K Microarray Cohort 2—qMSP | PITX3, PITX2 | Cohort 1: U: (1) PITX3; (2) PITX3 + PITX2 M: Not conducted Cohort 2: U: (1) PITX3; (2) PITX2; (3) PITX3 + PITX2 M: Not conducted | Cohort 1 U: (1) HR 1.83 (1.07–3.11), p = 0.027; (2) HR 2.20 (1.25–3.87), p = 0.006; (3) LR = 12.70, log-rank p = 0.002 M: NA Cohort 2: U: (1) HR 2.56 (1.44–4.54), p = 0.001; (2) see Reference 99; (3) LR = 12.14, log-rank p = 0.002 M: NA |
| Ahmad et al. [98] | PCa death | n = 385 | n = 328 no PCa death, n = 57 PCa death [low (0–2) to intermediate (3–5) risk CAPRA scores] [from TAPG cohort in Vasiljevic et al. [90]] | Median (IQR): 11.36 (6.20–14.72) | Pyro sequencing | HSPB1, CCND2, TIG1, DPYS, PITX2, MAL | Methylation score: HSPB1 + CCND2 + TIG1 + NPYS + PITX2 + MAL + CCND2 · HSPB1 interaction term. U: Methylation score M: Methylation score [+ CAPRA] | U: HR 2.72 (1.933.8), p < 10−8 M: HR 2.02 (1.402.92), p < 10−3, C-index of full model = 0.74 Sensitivity = 83%, Specificity = 44% (vs. CAPRA only: 68%/44%) At 10 yr follow-up: AUC = 0.74 (vs. CAPRA only: 0.62) |
| Uhl et al. [99] | Cohort 1: BCR Cohort 2: ISUP grade group (as surrogate for survival) | n = 206 | Cohort 1: n = 208 no BCR, n = 52 BCR [same cohort as Cohort 2 in Holmes et al. [97]] Cohort 2: n = 32 [core needle biopsy specimens] | Cohort 1 (Mean; median (range))—5.5; 5.2 (0–12.1) Cohort 2—NA | qMSP | PITX2 | Cohort 1: U: PITX2 M: None Cohort 2: U: PITX2 (median, mean and maximum levels) M: Not conducted | Cohort 1: U: HR 1.77 (1.01–3.10), p = 0.046 M: non-sig Cohort 2: U: median [r = 0.456, p = 0.010]; mean [r = 0.478, p = 0.007]; maximum [r = 0.495; p = 0.005] M: NA |
| Study [Ref] a | Approach (Discovery) | Cohort Size (Discovery) | Follow-Up (Discovery) [Years] | Approach (Validation) | Cohort Size (Validation) | Method (Validation) | Follow-Up (Validation) [Years] | Final Markers Identified (Validation) c,d,e,f | Key Results (Validation) g |
|---|---|---|---|---|---|---|---|---|---|
| Restriction-based methylation sequencing platforms h | |||||||||
| 1. Methylation sensitive arbitrarily primed PCR and methylated CpG island amplification | |||||||||
| Cottrell et al. [120] | Low GS (2–6 with no grade 4 or 5 patterns) vs. High GS (8–10) Early BCR (< 2 yrs post-RP) vs. no early BCR (> 4 yrs) | n = 5 Low GS, n = 5 High GS, n = 5 no early BCR, n = 5 early BCR | Range: 2–4 | Low GS vs. High GS Early BCR vs. no early BCR | Cohort 1: n = 304 (130 low GS, 96 high GS; 88 no BCR, 63 BCR) Cohort 2: n = 233 (28 low GS, 27 high GS; 134 no BCR, 59 BCR) | 1. Custom methylation oligonucleotide microarray 2. MethyLight (qMSP) b | Range: 2–4 | Low GS vs. High GS: Cohort 1—U: (1) ABDH9, (2) Chr3-EST, (3) GPR7, (4) NOTCH, (5) KBTBD6; M: not conducted Cohort 2—U: (1) ABDH9, (2) Chr3-EST; M: not conducted Early BCR vs. no early BCR: Cohort 1—U: (1) ABDH9, (2) ABDH9 (intermediate GS 6, 7 patients only) (3) Chr3-EST, (4) Chr3-EST (intermediate GS), (5) GPR7, (6) GPR7 (intermediate GS); M: not conducted Cohort 2—U: (1) ABDH9, (2) ABDH9 (intermediate GS), (3) Chr3-EST, (4) Chr3-EST (intermediate GS); M: (1) ABDH9 [ + GS + pathological T-stage + margin status], (2) Chr3-EST [ + GS + pathological T-stage + margin status] | Low GS vs. High GS: Cohort 1—U: AUC (all Wilcoxon’s p < 0.001) (1) 0.71, (2) 0.70, (3) 0.72, (4) 0.71, (5) 0.71; M: NA Cohort 2—U: AUC (all Wilcoxon’s p < 0.001) (1) 0.77, (2) 0.79; M: NA Early BCR vs. no early BCR: Cohort 1—U: AUC (Wilcoxon’s) (1) 0.71 (p = 0.002), (2) 0.63 (p = 0.072), (3) 0.66 (p = 0.05), (4) 0.72 (p = 0.002), (5) 0.72 (p = 0.0002), (6) 0.70 (p = 0.005); M: NA Cohort 2—U: AUC (Wilcoxon’s) (1) 0.65 (p < 0.001), (2) 0.66 (p < 0.01), (3) 0.67 (p < 0.001), (4) 0.67 (p < 0.01); M: Logistic regression (1) p = 0.016; (2) p = 0.043, AUC = 0.81 & 0.79 (vs. 0.75 of GS + stage + margin status only) |
| 2. Enhanced Reduced Representation Bisulphite Sequencing | |||||||||
| Lin et al. [121] | Indolent (localised disease, no recurrence) vs. Advanced (aggressive CRPC) PCa | n = 7 indolent, n = 6 advanced | Indolent (range) 5–6 years | Indolent vs. aggressive PCa | n = 16 indolent, n = 8 advanced | MassARRAY EpiTYPER | Indolent 3–7 years | Panel of 13 CpG islands: KCNC2, ZDHHC1, TBX1, CAPG, RARRES2, GRASP, SAC3D1, TPM4, GSTP1, NKX2–1, FAM107A, SLC13A3, FILIP1L U: Panel M: Not conducted | U: AUC = 0.975 (Sensitivity = 95%; Specificity = 95%) M: NA |
| Capture-based methylation sequencing platforms | |||||||||
| MBD (methyl-CpG binding domain)-isolated genome sequencing (MiGS) | |||||||||
| Bhasin et al. [122] | Low GS (6) vs. High GS (8–10) | n = 6 Low GS, n = 9 High GS | NA | Low GS vs. High GS | n = 46 Low GS, n = 203 High GS (TCGA) | HM450K Microarray | NA | U: 101 DMRs including at CD14, PCDHGA11, EYA1, CCDC8, HOXC4; M: not conducted | U: LIMMA p = 2.81 × 1028–0.05 (range) M: NA |
| Microarray-based platforms | |||||||||
| 1. Agilent Human CpG Island Microarray | |||||||||
| Kron et al. [123] | Low GS (6 (3 + 3)) vs. High GS (8 (4 + 4)) | n = 10 Low GS, n = 10 High GS | NA | 1. Low GS vs. High GS | n = 20 low GS vs. n = 19 high GS (MethyLight) | MethyLight | NA | U: HOXD3 (detected in n = 2 GS6 vs. n = 6 GS8); M: not conducted | Sample size too low for statistical U: 17.3% difference in methylation M: NA |
| 2. Kron et al. [124] GS ≤ 6 vs. GS7 BCR | n = 232 (n = 101 GS ≤ 6, n = 107 GS 7, n = 147 no BCR, n = 85 BCR) | MethyLight | Mean (range): 4.4 (0.2–9.5) | GS ≤ 6 vs. GS7-U: HOXD3; M: not conducted BCR-U: HOXD3; M: HOXD3 x pathological T-stage interaction term [+ GS + pathological T-stage + margin status] | GS ≤ 6 vs. GS7-U: 10.1% difference in av. PMR values, Mann-Whitney U test p < 0.001; M: NA BCR-U: Log-rank p = 0.043; M: HOXD3 x pT3a [HR 3.78 (1.09–13.17), p = 0.037], HOXD3 x pT3b/pT4 [HR 5.23 (1.31–20.96), p = 0.019] | ||||
| 3. Liu et al. [125] GS≤6 vs. GS7 BCR | n = 219 (n = 138 GS ≤6, n = 98 GS 7, n = ns BCR) (reduced cohort from Kron et al. [124]) | MethyLight | ns | GS ≤ 6 vs. GS7-U: (1) APC, (2) TGFβ2; M: not conducted BCR-U: (1) APC, (2) HOXD3 + TGFβ2 + APC; M: (1) HOXD3 + TGFβ2 + APC [+ pathological T-stage + GS (7 and ≥8 groups)], (2) HOXD3 + TGFβ2 + APC [+ pathological T-stage + GS (7 (3 + 4), 7 (4 + 3) and ≥ 8 groups)] | GS ≤ 6 vs. GS7-U: Mann-Whitney U test (1) p = 0.018, (2) p = 0.028; M: NA BCR-U: Log-rank (1) p = 0.028, (2) p < 0.001; M: (1) HR 2.01 (1.14–3.57), p = 0.017, (2) HR 2.068 (1.155–3.704), p = 0.014 | ||||
| 4. Jeyapala et al. [126] BCR | Cohort 1: n = 435, n = 43 BCR | Cohort 1: HM450K Microarray (TCGA) | Mean (range): Cohort 1: 1.9 (0–12.6) | Cohort 1—U: GBX2; M: not conducted | Cohort 1—U: Mann-Whitney Test cg09094860 [p = 0.003], cg00302494 [p = 0.01]; M: not conducted | ||||
| Cohort 2: n = 254 (n = 202, n = 52 BCR, n = 58 IDC/C-positive, n = 196 IDC/C-negative) | Cohort 2: MethyLight | Cohort 2: 5.7 (0.1–12.3) | Cohort 2—U: GBX2 (and in IDC/C-negative patients only); M: (1) GBX2 [+ GS + Pathological T-stage + pre-op PSA], 2) GBX2 [+ pre-op PSA] | Cohort 2—U: Mann-Whitney Test p = 0.0001, IDC/C-negative patients: Log-rank p = 0.002; M: (1) HR 1.02 (1.006–1.034), p = 0.004, (2) C-index 0.78 (vs. 0.71 for PSA alone) | |||||
| 5. Jeyapala et al. [127] BCR salvage RT/hormone therapy | Cohort 1: n = 254 (n = 202 no BCR, n = 52 BCR, n = 205 no salvage RT, n = 42 salvage RT, n = 226 no hormone therapy, n = 21 hormone therapy) Cohort 2: n = 199 (n = 159 no BCR, n = 40 BCR, n = 180 no salvage RT, n = 19 salvage RT, n = 177 no hormone therapy, n = 22 hormone therapy) | MethyLight | Median (range): Cohort 1: 6.7 (0.1–12.8); Cohort 2: 6.7 (0.2–18.6) | 4-G model: HOXD3, TGFβ2, CRIP3, APC (candidate) Cohort 1 BCR-U: 4-G model; M: Integrative model = 4-G model [+ CAPRA-S] Salvage RT/hormone therapy: U: 4-G model; M: Integrative model Cohort 2 BCR-U: 4-G model; M: Integrative model Salvage RT/hormone therapy: U: 4-G model; M: Integrative model | Cohort 1 BCR-U: HR 2.72 (1.77–4.17), p < 0.001, Sensitivity = 90.9%, Specificity = 35.2%, AUC = 0.740; M: HR 1.49 (1.12–1.99), p = 0.006, Sensitivity = 92.9%, Specificity = 43.4%, AUC = 0.846 Salvage RT/hormone therapy: U: HR 2.20 (1.48–3.29), p < 0.001;M: HR 1.34 (1.03–1.75), p = 0.027 Cohort 2 BCR-U: HR 2.48 (1.59–3.86), p < 0.001, Sensitivity = 95.0%, Specificity = 27.5%, AUC = 0.670; M: HR 1.62 (1.17–2.24), p = 0.004, Sensitivity = 89.5%, Specificity = 37.3%, AUC = 0.726 (vs. 0.698 for CAPRA-S alone) Salvage RT/hormone therapy-U: HR 1.97 (1.21–3.21), p < 0.001, Sensitivity = 91.2%, Specificity = 27.4%, AUC = 0.636; M: HR 1.17 (0.79–1.72), p = 0.441, AUC = 0.731 (vs. 0.723 for CAPRA-S alone) | ||||
| 6. Savio et al. [128] BCR; Late BCR (5 and 7 yrs post-RP) salvage RT/hormone therapy [Biopsy specimens pre-RP] | n = 86 (n = 61 no BCR, n = 25 BCR, n = 75 no salvage RT, n = 11 salvage RT, n = 70 no hormone therapy, n = 15 hormone therapy) | MethyLight | Median (range): 5.1 (0.1–16) | BCR-U: none; M: 4-G model [+ pre-op PSA] Late BCR-U: none; M: (1) 4-G model [+ pre-op PSA] (5 yrs), (2) 4-G model [+ pre-op PSA] (7 yrs) Salvage RT/hormone therapy: U: 4-G model; M: (1) 4-G model [+ pre-op PSA], (2) 4-G model [+ CAPRA] | BCR: U: non-sig; M: Sensitivity = 78.6%, Specificity = 64.7%, AUC = 0.714 Late BCR: U: non-sig; M: (1) Sensitivity = 80%, Specificity = 60.5%, AUC = 0.705 (vs. 0.667 for PSA alone), (2) Sensitivity = 76.9%, Specificity = 62.9%, AUC = 0.688 (vs. 0.6 for PSA alone) Salvage RT/hormone therapy-U: Sensitivity = 66.7%, Specificity = 75%, AUC = 0.699; M: (1) Sensitivity = 75%, Specificity = 61.1%, AUC = 0.699, (2) Sensitivity = 76.9%, Specificity = 58.3%, AUC = 0.797 | ||||
| 2. Illumina GoldenGate Methylation Microarrays | |||||||||
| Goh et al. [129] | Low GS (6) vs. High GS (8–10) Overall survival | n = 87 (n = 19 GS6, n = 48 GS8–10, n = ns death) | Median (range): 4 (0–11.8) | GS (6–9) BCR | n = 59 (n = 23 GS 6, n = 22 GS 7, n = 13 GS 8–10, n = 18 for BCR analysis) | GoldenGate | No BCR-5 (1–13) | “PHYMA” signature: 55 probes targeting CpG loci of 46 genes, including at ALOX12, PDGFRB which were selected for functional validation GS: U: PHYMA (GS 6–8) M: not conducted BCR: U: none M: not conducted | GS: U: Logistic regression β-coefficient = 2.28, p = 0.2 (trend) M: NA BCR: U: non-sig M: NA |
| Angulo et al. 2016 Urol Int [130] | • BCR • PCa death | n = 26 no BCR, n = 32 BCR | Mean ± SD (range): 6.3 ± 3 (0.8–13.8) | No validation | NA | NA | NA | Discovery only: BCR: U: (1) Gene hypermethylation profile of cluster 3 patients (including at GSTM2, GSTP1, RARB, ALOX12, APC, PDGFRB, SCGB3A1, CFTR, MT1A, PENK, NEU1, CCNA1, MET, KLK10, RARA, MFAP4, TERT, TBX1, TAL, MYCL2, (2) MT1A, (3) ALOX12, (4) GSTM2, (5) APC, (6) MYCL2, (7) RARB, (8) GSTM2 + MCLY2 M: (1) Gene hypermethylation profile [+ D’Amico classification]; (2) GSTM2 [+ ns]; (3) MCLY2 [+ ns] PCa Death: U: GSTM2 + MYCL2 M: not conducted | Discovery only: BCR-U: (1) Log-rank p = 0.0054, Cluster 3 vs. 1 [HR 8.4 (1.86–38.46), 3 vs. 2 [HR 2.69 (1.13–5.95), 3 vs. 4 [HR 2.26 (0.89–5.72)]; (2) HR 2.14 (1.06–4.33), log-rank p = 0.029; (3) HR 2.21 (1.06–4.55), log-rank p = 0.025; (4) HR 4.59 (1.38–15.15), log-rank p = 0.0062; (5) HR 1.96 (0.97–3.97), log-rank p = 0.05; (6) HR 3.58 (1.6–8), log-rank p = 0.0009; (7) HR 2.5 (1.21–5.18), log-rank p = 0.01; (8) log-rank p = 0.0009; M: (1) Cox regression p = 0.064, Cluster 3 vs. 1 [HR 4.37 (0.94–20.41], 3 vs. 2 [HR 2.56 (1.11–5.88)], 3 vs. 4 [HR 2.26 (0.89–5.72)], C-index = 0.708 (vs. 0.679 for D’Amico alone); (2) HR 3.789 (1.11–12.83), p = 0.03;(3) HR 2.71 (1.21–6.09), p = 0.016 PCa death-U: HR 10.82 (1.96–59.67); log-rank p = 0.006; M: NA |
| 3. Illumina Infinium HumanMethylation 27K Microarray | |||||||||
| Kobayashi et al. [131] | BCR | n = 86 | Range: 0–5.5 | No validation | NA | NA | NA | Discovery only: U: KCNK4, WDR86, OAS2, TMEM179 (FDR ≤ 1%; hypermethylated) M: not conducted | Discovery only: U: ns M: |
| Mahapatra et al. [132] | Indolent vs. aggressive disease: No recurrence vs. recurrence BCR vs. clinical recurrence Local recurrence vs. metastatic relapse | n = 75 no recurrence, n = 123 recurrence n = 43 BCR, n = 80 clinical recurrence n = 44 local recurrence, n = 36 metastatic relapse | (Mean ± SD): No recurrence 6.2 ± 1.5 BCR: 5.9 ± 1.4 Local recurrence: 4.2 ± 1.7 Metastatic relapse: 4.4 ± 4.0 | Indolent vs. aggressive disease: No recurrence vs. recurrence BCR vs. clinical recurrence Local recurrence vs. metastatic relapse | n = 20 no recurrence, n = 20 BCR, n = 20 local recurrence, n = 20 metastatic relapse | Pyro sequencing | (Mean ± SD) No recurrence-6.5 ± 1.6 BCR-5.45 ± 1.3 Local recurrence-4.5 ± 1.9 Metastatic relapse-3.5 ± 1.9 | No recurrence vs. recurrence: U: (1) CRIP1; (2) RUNX3; (3) HS3ST2; (4) FLNC; (5) RASGRF2 M: Not conducted BCR vs. clinical recurrence: U: (1) PHILDA3; (2) TNFRSF10D; (3) RASGRF2 M: Not conducted Local vs. metastatic relapse: U: (1) BCL11B; (2) POU3F3; (3) RASGRF2 M: Not conducted | No recurrence vs. recurrence: U: Sensitivity/Specificity, AUC, t-test (1) 65.0%/65.6%, 0.727, p = 0.0139; (2) 70.4%/75.3%, 0.788, p = 0.0018; (3) 65.0%/60.0%, 0.773, p = 0.0115; (4) 70.3%/60.4%, 0.660, p = 0.0835; (5) 75.7%/55.2%, 0.682, p = 0.0515 M: NA BCR vs. clinical recurrence: U: Sensitivity/Specificity, AUC, t-test (1) 65.6%/65.0%, 0.73, p = 0.0129; (2) 60.8%/75.6%, 0.692, p = 0.0373; (3) 75.4%/60.3%, 0.761, p = 0.0047 M: NA Local recurrence vs. metastatic relapse: U: Sensitivity/Specificity, AUC, t-test (1) 75.2%/60.0%, 0.741, p = 0.0091; (2) 65.5%/70.7%, 0.701, p = 0.0295; (3) 70.6%/75.4%, 0.748, p = 0.0071; M: NA |
| 4. Illumina Infinium HumanMethylation 450K (HM450K) Microarray | |||||||||
| Geybels et al. [133] | Low GS (≤6) vs. High GS (8–10) | n = 65 Low GS, n = 88 High GS (TCGA) | NA | Progression | n = 323 no progression, n = 108 progression | HM450K Microarray | Mean (SD): 8.0 (4.2) years | Signature consisting of 52 CpG sites (32 unique genes) including at RRM2, VWA3B, MFSD9, ANO7, GALNTL2, SEMA3F, ATXN7, SLC15A2, MME, USP17, KIAA0922, FOXI1, URGCP, PTPRN2, RP1, MRPS28, MKI67, CPT1A, KCNMB4, TMEM132D. U: (1) Signature; (2) Signature (GS7 only); (3) Signature (GS7 (3 + 4) only) M: [+ GS+ pathological T-stage + pre-op PSA] (1) Signature; (2) Signature (GS7 only); (3) Signature (GS7 (3 + 4) only) | U: (1) HR 1.78 (per 25% increase) (1.48–2.16), p = 2.05 × 10⁻⁹; (2) HR 1.81 (1.42–2.31), p = 1.38 × 10⁻³; (3) HR 1.83 (1.36–2.45), p = 5.64 × 10⁻⁵ M: (1) HR 1.48 (1.21–1.81), p = 1.38 × 10⁻⁴, AUC = 0.78 (vs. 0.73 for GS + pathological T-stage + pre-op PSA only); (2) HR 1.59 (1.24–2.05), p = 1.38 × 10⁻⁶, AUC = 0.76 (vs. 0.64); (3) HR 1.65 (121–2.25), p = 1.54 × 10⁻³, AUC = 0.70 (vs. 0.62) |
| Zhao et al. [134] | Metastatic-lethal progression | n = 304 no progression vs. n = 24 metastatic-lethal | Mean: Metastatic relapse-8.1 Survival-12.2 | 1. Metastatic-lethal progression | n = 41 no progression, n = 24 metastatic-lethal | HM450K Microarray | Mean: 9 | U: (1) ALKBH5; (2) ATP11A; (3) FHAD1; (4) KLHL8; (5) PI15; (6) Intergenic region (chr1); (7) Intergenic (chr16); (8) Intergenic (chr17) M: [ + GS] (1) ALKBH5; (2) FHAD1; (3) KLHL8; (4) PI15 | U: Mean β difference (t-test), AUC, pAUC (1)—5% (p = 0.037), 0.66 (p = 0.035), 0.001 (p = 0.566); (2)—6% (p = 0.049), 0.66 (p = 0.03), 0.009 (p = 0.022); (3)—6% (p = 0.007), 0.71 (p = 0.003), 0.004 (p = 0.159); (4)—10% (p = 0.002), 0.75 (p = 0.0004), 0.002 (p = 0.359); (5)—7% (p = 0.029), 0.68 (p = 0.014), 0.006 (p = 0.074); M: AUC, pAUC, p (from likelihood ratio test comparing with model with GS alone: AUC = 0.816, pAUC = 0.010) (1) 0.87, 0.024, p = 0.030; (2) 0.86, 0.013, p = 0.038; (3) 0.89, 0.008, p = 0.014; (4) 0.89, 0.006, p = 0.026 |
| 2. Zhao et al. [135] Metastatic-lethal progression | Training dataset (from Zhao et al. [134]): n = 344 no recurrence, n = 48 metastatic-lethal; Testing dataset: n = 11 no recurrence, 23 metastatic-lethal | Pyro sequencing | Training (Mean (minimum))—8 (5) Testing At least 5 years | Methylation score: ALKBH5 + ATP11A + FHAD1 + KLHL8 + PI15 [+ GS] Training-U: not conducted; M: Methylation score Testing-U: not conducted; M: Methylation score | Training-U: NA; M: Logistic regression β-coefficient-ALKBH5 [−0.75], ATP11A [−0.7], FHAD1 [−9.72], KLHL8 [−0.33], PI15 [0.70], GS [1.13] Testing-U: NA; M: Mean difference = 2.49 (p = 6.8 × 10⁻⁶), OR 4.0 (1.8–14.3), p = 0.006, AUC = 0.91 (vs. 0.87 for GS alone), pAUC = 0.037 (vs. 0.025 for GS alone), sensitivity at 95% specificity= 74% (vs. 53% for GS alone) | ||||
| Mundbjerg et al. [136] | Aggressiveness (individual PCa foci vs. matched lymph node metastasis) | n = 14 (n = 92 samples: multiple tumour foci, adjacent normal tissue, lymph node metastases and normal lymph nodes) | NA | Aggressive (lymph node metastases and pathological stage T3 tumours) vs. non-aggressive | n = 351 (TCGA) | HM450K Microarray | Mean: 3.2 years | Aggressiveness classifier: 25 probes, including in NXPH2, NCAPH, TRIB1, PCDHA1-PCDHA8, C3orf37, C9orf3, CPN1, TCF7L2, ROBO1, GFPT2, FBXQ47, SKI, HDAC9, CARS, SLC6A17, BCAT1, GAS1, RAI1 U: Aggressiveness classifier M: Not conducted | U: Specificity = 97.4%, Sensitivity = 96.2%, Negative predictive value = 76%, Positive predictive value = 99.7%, Lymph node metastases [Fishers exact test p = 9.2 × 10⁻⁵], pathological stage T3 [Fishers exact test p = 2.2 × 10⁻⁷] M: NA |
| Toth et al. [137] | Good prognosis vs. Poor prognosis | n = 35 good prognosis, n = 35 poor prognosis (80% training set, 20% testing set) | Range: 3–5 | Good prognosis vs. poor prognosis (Cohort 1, 2) BCR (Cohort 1, 2, 3) | Cohort 1: n = 222 (n = 63 for prognosis analysis, n = ns BCR) (ICGC cohort [138]) Cohort 2: n = 477 (n = 27 good prognosis, 57 poor prognosis, n = ns BCR) (TCGA) Cohort 3: n = 12,581 (n = 3612 BCR) (for ZIC2 immunostaining analysis only) | HM450K Microarray | Cohort 1 & 2 At least 5 years Cohort 3 (Median (range)) 4 (0.08–20.08) | Signature consisting of 598 CpG sites. Top 20: CCT8L2, NOP56, FCRL1, OR5W2, ZFP36L2, PRMT8, SLC1A6, DOK5, CCT8L2, ZFP36L2, MMP16, ESR1, ZIC2, GPR137B, NANOS1, LCE3A, C11orf87, PEG3, ZIM2, CTSC Good prognosis vs. good prognosis: Cohort 1—U: (1) Signature, M: not conducted Cohort 2—U: Signature; M: not conducted BCR: Cohort 1—U: Signature, M: not conducted Cohort 2—U: Signature; M: Signature [+ GS] Cohort 3—U: ZIC2 protein; M: ZIC2 protein [+ GS + pathological T-stage + nodal stage + PSA] | Good vs. poor prognosis: Cohort 1—U: AUC = 0.997; M: NA Cohort 2—U: AUC = 0.775; M: NA BCR: Cohort 1—U: Log-rank p < 0.0001, M: NA Cohort 2—U: Log-rank p < 0.0001; M: Cox regression p = 0.011 Cohort 3—U: Log-rank p < 0.0001; M: ns |
Publisher’s Note: MDPI stays neutral with regard to jurisdictional claims in published maps and institutional affiliations. |
© 2020 by the authors. Licensee MDPI, Basel, Switzerland. This article is an open access article distributed under the terms and conditions of the Creative Commons Attribution (CC BY) license (http://creativecommons.org/licenses/by/4.0/).
Share and Cite
Lam, D.; Clark, S.; Stirzaker, C.; Pidsley, R. Advances in Prognostic Methylation Biomarkers for Prostate Cancer. Cancers 2020, 12, 2993. https://doi.org/10.3390/cancers12102993
Lam D, Clark S, Stirzaker C, Pidsley R. Advances in Prognostic Methylation Biomarkers for Prostate Cancer. Cancers. 2020; 12(10):2993. https://doi.org/10.3390/cancers12102993
Chicago/Turabian StyleLam, Dilys, Susan Clark, Clare Stirzaker, and Ruth Pidsley. 2020. "Advances in Prognostic Methylation Biomarkers for Prostate Cancer" Cancers 12, no. 10: 2993. https://doi.org/10.3390/cancers12102993
APA StyleLam, D., Clark, S., Stirzaker, C., & Pidsley, R. (2020). Advances in Prognostic Methylation Biomarkers for Prostate Cancer. Cancers, 12(10), 2993. https://doi.org/10.3390/cancers12102993