Integrated Multiparametric Radiomics and Informatics System for Characterizing Breast Tumor Characteristics with the OncotypeDX Gene Assay

 ,
,
Abstract
Simple Summary
Abstract
1. Introduction
2. Methods
2.1. Clinical Subjects
2.2. Histological Phenotyping
2.3. Integrated Radiomics Informatics System (IRIS)
2.3.1. Multi-Subspace Embedding and Clustering
2.3.2. Feature Importance
2.3.3. Complex Network Analysis of Informatics Parameters
- First, a correlation coefficient, ri between the values, yi spanned by the parameter, i across all the patients and corresponding OncotypeDX scores are calculated.
- Second, the range of clinical and imaging parameter values across all the patients are normalized from zero to one according to the following formula (3):
2.3.4. Construction of Network Model of Informatics Parameters
2.3.5. Statistics and Topological Characteristics of the Complex Network
2.3.6. Multiparametric and Single Radiomics
The Multiparametric Radiomic Tissue Signature Model
Radiomic Parameters
- Binning for FOS = 64.
- Gray level quantization for GLCM, GLRLM and NGTDM = 64.
- The distance d for GLCM was set to one voxel.
- Both GLCM and GLRLM were evaluated in all the four directions— Rotational invariance was achieved by extracting the radiomic features from GLCM and GLRLM averaged across all the directions.
2.3.7. Patient Classification
- Low vs. intermediate risk group.
- Low vs. high-risk group.
- Intermediate vs. high-risk group.
- Low vs. intermediate and high-risk groups combined.
2.4. Multiparametric Breast Imaging
2.4.1. Proton MRI Imaging
2.4.2. Pharmacokinetic Dynamic Contrast-Enhanced MRI
2.4.3. High-Resolution Dynamic Contrast-Enhanced MRI
2.4.4. Diffusion Weighted Imaging
2.5. MRI Data Analysis
2.5.1. Clinical Breast Lesion Classification Methods
2.5.2. Pharmacokinetic Contrast Enhancement Metrics
2.5.3. ADC Mapping
2.6. Statistical Analysis
3. Results
3.1. Clinical Demographics
3.2. Radiological Findings
3.3. Single and Multiparametric Radiomics
3.4. Integrated Radiomics Informatic System (IRIS) Model
4. Discussion
5. Conclusions
6. Patents
Author Contributions
Funding
Conflicts of Interest
Appendix A
Appendix A.1. Theoretical Graph Metrics
Appendix A.1.1. Clustering Coefficient
Appendix A.1.2. Degree Distribution
Appendix A.2. Centrality Measures
Appendix A.2.1. Betweenness Centrality
Appendix A.2.2. Harmonic Centrality
Appendix A.2.3. Degree Centrality
Appendix A.2.4. Integrated Centrality
References
- Sparano, J.A.; Gray, R.J.; Makower, D.F.; Pritchard, K.I.; Albain, K.S.; Hayes, D.F.; Geyer, C.E.; Dees, E.C.; Perez, E.A.; Olson, J.A.; et al. Prospective Validation of a 21-Gene Expression Assay in Breast Cancer. N. Engl. J. Med. 2015, 373, 2005–2014. [Google Scholar] [CrossRef] [PubMed]
- Sparano, J.A.; Gray, R.J.; Makower, D.F.; Pritchard, K.I.; Albain, K.S.; Hayes, D.F.; Geyer, C.E.; Dees, E.C.; Goetz, M.P.; Olson, J.A.; et al. Adjuvant Chemotherapy Guided by a 21-Gene Expression Assay in Breast Cancer. N. Engl. J. Med. 2018, 379, 111–121. [Google Scholar] [CrossRef] [PubMed]
- Sparano, J.A.; Gray, R.J.; Ravdin, P.M.; Makower, D.F.; Pritchard, K.I.; Albain, K.S.; Hayes, D.F.; Geyer, C.E.; Dees, E.C.; Goetz, M.P.; et al. Clinical and Genomic Risk to Guide the Use of Adjuvant Therapy for Breast Cancer. N. Engl. J. Med. 2019, 380, 2395–2405. [Google Scholar] [CrossRef] [PubMed]
- Paik, S.; Shak, S.; Tang, G.; Kim, C.; Baker, J.; Cronin, M.; Baehner, F.L.; Walker, M.G.; Watson, D.; Park, T.; et al. A multigene assay to predict recurrence of tamoxifen-treated, node-negative breast cancer. N. Engl. J. Med. 2004, 351, 2817–2826. [Google Scholar] [CrossRef]
- Simon, R. Development and Evaluation of Therapeutically Relevant Predictive Classifiers Using Gene Expression Profiling. J. Natl. Cancer Inst. 2006, 98, 1169–1171. [Google Scholar] [CrossRef][Green Version]
- Paik, S.; Tang, G.; Shak, S.; Kim, C.; Baker, J.; Kim, W.; Cronin, M.; Baehner, F.L.; Watson, D.; Bryant, J.; et al. Gene expression and benefit of chemotherapy in women with node-negative, estrogen receptor-positive breast cancer. J. Clin. Oncol. 2006, 24, 3726–3734. [Google Scholar] [CrossRef]
- Simon, R.M.; Paik, S.; Hayes, D.F. Use of archived specimens in evaluation of prognostic and predictive biomarkers. J. Natl. Cancer Inst. 2009, 101, 1446–1452. [Google Scholar] [CrossRef]
- Partin, J.F.; Mamounas, E.P. Impact of the 21-gene recurrence score assay compared with standard clinicopathologic guidelines in adjuvant therapy selection for node-negative, estrogen receptor-positive breast cancer. Ann. Surg. Oncol. 2011, 18, 3399–3406. [Google Scholar] [CrossRef]
- Kim, H.S.; Umbricht, C.B.; Illei, P.B.; Cimino-Mathews, A.; Cho, S.; Chowdhury, N.; Figueroa-Magalhaes, M.C.; Pesce, C.; Jeter, S.C.; Mylander, C.; et al. Optimizing the Use of Gene Expression Profiling in Early-Stage Breast Cancer. J. Clin. Oncol. 2016, 34, 4390–4397. [Google Scholar] [CrossRef]
- Turner, B.M.; Gimenez-Sanders, M.A.; Soukiazian, A.; Breaux, A.C.; Skinner, K.; Shayne, M.; Soukiazian, N.; Ling, M.; Hicks, D.G. Risk stratification of ER-positive breast cancer patients: A multi-institutional validation and outcome study of the Rochester Modified Magee algorithm (RoMMa) and prediction of an Oncotype DX((R)) recurrence score <26. Cancer Med. 2019, 8, 4176–4188. [Google Scholar] [CrossRef]
- Ei Khouli, R.H.; Macura, K.J.; Kamel, I.R.; Jacobs, M.A.; Bluemke, D.A. 3 Tesla Dynamic Contrast Enhanced Magnetic Resonance Imaging of the Breast: Pharmacokinetic Parameters versus Conventional Kinetic Curve Analysis. Am. J. Roentgenol. 2011, 197, 1498–1505. [Google Scholar] [CrossRef] [PubMed]
- Partridge, S.; Rahbar, H.; Murthy, R.; Chai, X.; Kurland, B.; DeMartini, W.; Lehman, C. Improved diagnostic accuracy of breast MRI through combined apparent diffusion coefficients and dynamic contrast-enhanced kinetics. Magn. Reson. Med. 2011, 65, 1759–1767. [Google Scholar] [CrossRef] [PubMed]
- Jacobs, M.A.; Wolff, A.C.; Macura, K.J.; Stearns, V.; Ouwerkerk, R.; El Khouli, R.; Bluemke, D.A.; Wahl, R. Multiparametric and Multimodality Functional Radiological Imaging for Breast Cancer Diagnosis and Early Treatment Response Assessment. J. Natl. Cancer Inst. Monogr. 2015, 2015, 40–46. [Google Scholar] [CrossRef] [PubMed]
- Rahbar, H.; Partridge, S.C. Multiparametric MR Imaging of Breast Cancer. Magn. Reson. Imaging Clin. N. Am. 2016, 24, 223–238. [Google Scholar] [CrossRef] [PubMed]
- Tofts, P.S.; Kermode, A.G. Measurement of the blood-brain barrier permeability and leakage space using dynamic MR imaging. 1. Fundamental concepts. Magn. Reson. Med. 1991, 17, 357–367. [Google Scholar] [CrossRef] [PubMed]
- El Khouli, R.H.; Macura, K.J.; Barker, P.B.; Habba, M.R.; Jacobs, M.A.; Bluemke, D.A. Relationship of temporal resolution to diagnostic performance for dynamic contrast enhanced MRI of the breast. J. Magn. Reson. Imaging 2009, 30, 999–1004. [Google Scholar] [CrossRef] [PubMed]
- Wang, T.C.; Huang, Y.H.; Huang, C.S.; Chen, J.H.; Huang, G.Y.; Chang, Y.C.; Chang, R.F. Computer-aided diagnosis of breast DCE-MRI using pharmacokinetic model and 3-D morphology analysis. Magn. Reson. Imaging 2014, 32, 197–205. [Google Scholar] [CrossRef]
- Pineda, F.D.; Easley, T.O.; Karczmar, G.S. Dynamic field-of-view imaging to increase temporal resolution in the early phase of contrast media uptake in breast DCE-MRI: A feasibility study. Med. Phys. 2018, 45, 1050–1058. [Google Scholar] [CrossRef]
- Mann, R.M.; Kuhl, C.K.; Moy, L. Contrast-enhanced MRI for breast cancer screening. J. Magn. Reson. Imaging 2019, 50, 377–390. [Google Scholar] [CrossRef]
- Le Bihan, D.; Breton, E.; Lallemand, D.; Grenier, P.; Cabanis, E.; Laval Jeantet, M. MR imaging of intravoxel incoherent motions: Application to diffusion and perfusion in neurologic disorders. Radiology 1986, 161, 401–407. [Google Scholar] [CrossRef]
- Le Bihan, D.; Breton, E.; Lallemand, D.; Aubin, M.L.; Vignaud, J.; Laval-Jeantet, M. Separation of diffusion and perfusion in intravoxel incoherent motion MR imaging. Radiology 1988, 168, 497–505. [Google Scholar] [CrossRef] [PubMed]
- Chenevert, T.L.; Stegman, L.D.; Taylor, J.M.; Robertson, P.L.; Greenberg, H.S.; Rehemtulla, A.; Ross, B.D. Diffusion magnetic resonance imaging: An early surrogate marker of therapeutic efficacy in brain tumors. J. Natl. Cancer Inst. 2000, 92, 2029–2036. [Google Scholar] [CrossRef] [PubMed]
- EI Khouli, R.H.; Jacobs, M.A.; Mezban, S.D.; Huang, P.; Kamel, I.R.; Macura, K.J.; Bluemke, D.A. Diffusion-weighted imaging improves the diagnostic accuracy of conventional 3.0-T breast MR imaging. Radiology 2010, 256, 64–73. [Google Scholar] [CrossRef] [PubMed]
- Subhawong, T.K.; Durand, D.J.; Thawait, G.K.; Jacobs, M.A.; Fayad, L.M. Characterization of soft tissue masses: Can quantitative diffusion weighted imaging reliably distinguish cysts from solid masses? Skelet. Radiol. 2013, 42, 1583–1592. [Google Scholar] [CrossRef] [PubMed]
- Parekh, V.S.; Jacobs, M.A. Multiparametric radiomics methods for breast cancer tissue characterization using radiological imaging. Breast Cancer Res. Treat. 2020, 180, 407–421. [Google Scholar] [CrossRef] [PubMed]
- Gibbs, P.; Turnbull, L.W. Textural analysis of contrast-enhanced MR images of the breast. Magn. Reson. Med. 2003, 50, 92–98. [Google Scholar] [CrossRef]
- Castellano, G.; Bonilha, L.; Li, L.; Cendes, F. Texture analysis of medical images. Clin. Radiol. 2004, 59, 1061–1069. [Google Scholar] [CrossRef]
- Holli, K.; Lääperi, A.-L.; Harrison, L.; Luukkaala, T.; Toivonen, T.; Ryymin, P.; Dastidar, P.; Soimakallio, S.; Eskola, H. Characterization of breast cancer types by texture analysis of magnetic resonance images. Acad. Radiol. 2010, 17, 135–141. [Google Scholar] [CrossRef]
- Lambin, P.; Rios-Velazquez, E.; Leijenaar, R.; Carvalho, S.; van Stiphout, R.G.; Granton, P.; Zegers, C.M.; Gillies, R.; Boellard, R.; Dekker, A.; et al. Radiomics: Extracting more information from medical images using advanced feature analysis. Eur. J. Cancer 2012, 48, 441–446. [Google Scholar] [CrossRef]
- Coroller, T.P.; Grossmann, P.; Hou, Y.; Velazquez, E.R.; Leijenaar, R.T.; Hermann, G.; Lambin, P.; Haibe-Kains, B.; Mak, R.H.; Aerts, H.J. CT-based radiomic signature predicts distant metastasis in lung adenocarcinoma. Radiother. Oncol. 2015, 114, 345–350. [Google Scholar] [CrossRef]
- Parekh, V.; Jacobs, M.A. Radiomics: A new application from established techniques. Expert Rev. Precis. Med. Drug Dev. 2016, 1, 207–226. [Google Scholar] [PubMed]
- Parekh, V.S.; Jacobs, M.A. Integrated radiomic framework for breast cancer and tumor biology using advanced machine learning and multiparametric MRI. NPJ Breast Cancer 2017, 3, 43. [Google Scholar] [CrossRef] [PubMed]
- Parekh, V.S.; Jacobs, M.A. Deep learning and radiomics in precision medicine. Expert Rev. Precis. Med. Drug Dev. 2019, 4, 59–72. [Google Scholar] [PubMed]
- Li, H.; Zhu, Y.; Burnside, E.S.; Drukker, K.; Hoadley, K.A.; Fan, C.; Conzen, S.D.; Whitman, G.J.; Sutton, E.J.; Net, J.M. MR imaging radiomics signatures for predicting the risk of breast cancer recurrence as given by research versions of MammaPrint, Oncotype DX, and PAM50 gene assays. Radiology 2016, 281, 382–391. [Google Scholar] [CrossRef] [PubMed]
- Jacobs, M.A.; Umbricht, C.B.; Parekh, V.; El Khouli, R.; Macura, K.J.; Harvey, S.; Wolff, A.C. Advanced machine learning informatics modeling using clinical and radiological imaging metrics for characterizing breast tumor characteristics with the OncotypeDX gene array. In Proceedings of the Radiological Society of North America 2015 Scientific Assembly and Annual Meeting, Chicago, IL, USA, 29 November–4 December 2015; p. SSQ01-04. [Google Scholar]
- Jacobs, M.A.; Parekh, V.S. (IRIS):Integrated Radiomic Informatic System: A Novel Informatics Radiomics Method for the Integration of Many Types of Data for Classification into Different Groups. U.S. Patent Application 20,170,112,459, 27 April 2017. [Google Scholar]
- Jacobs, M.A.; Umbricht, C.B.; Parekh, V.; El Khouli, R.; Cope, L.; Macura, K.J.; Harvey, S.; Wolff, A.C. Advanced machine learning informatics modeling using clinical and radiological imaging metrics for characterizing breast tumor characteristics with the OncotypeDX gene array. arXiv 2018, arXiv:1811.03218. [Google Scholar]
- Jacobs, M.A.; Akhbardeh, A. Advanced Treatment Response Prediction Using Clinical Parameters and Advanced Unsupervised Machine Learning: The Contribution Scattergram. U.S. Patent 10,388,017 B2, 20 August 2019. [Google Scholar]
- Akhbardeh, A.; Jacobs, M.A. Comparative analysis of nonlinear dimensionality reduction techniques for breast MRI segmentation. Med. Phys. 2012, 39, 2275–2289. [Google Scholar] [CrossRef] [PubMed]
- Tenenbaum, J.B.; De Silva, V.; Langford, J.C. A global geometric framework for nonlinear dimensionality reduction. Science 2000, 290, 2319–2323. [Google Scholar] [CrossRef]
- Watts, D.J.; Strogatz, S.H. Collective dynamics of ‘small-world’networks. Nature 1998, 393, 440–442. [Google Scholar] [CrossRef]
- Barabási, A.-L.; Albert, R. Emergence of scaling in random networks. Science 1999, 286, 509–512. [Google Scholar] [CrossRef]
- Freeman, L.C. A set of measures of centrality based on betweenness. Sociometry 1977, 40, 35–41. [Google Scholar] [CrossRef]
- Freeman, L.C. Centrality in social networks conceptual clarification. Soc. Netw. 1978, 1, 215–239. [Google Scholar] [CrossRef]
- Haralick, R.M.; Shanmugam, K.; Dinstein, I.H. Textural features for image classification. Syst. Man Cybern. IEEE Trans. 1973, 610–621. [Google Scholar] [CrossRef]
- Galloway, M.M. Texture analysis using gray level run lengths. Comput. Graph. Image Process. 1975, 4, 172–179. [Google Scholar] [CrossRef]
- Laws, K.I. Rapid texture identification. In Proc. SPIE 0238, Image Processing for Missile Guidance; SPIE: San Diego, CA, USA, 1980; pp. 376–381. [Google Scholar]
- Mandelbrot, B.B. The Fractal Geometry of Nature; W. H. Freeman and Company: New York, NY, USA, 1983; Volume 173. [Google Scholar]
- Amadasun, M.; King, R. Textural features corresponding to textural properties. Syst. Man Cybern. IEEE Trans. 1989, 19, 1264–1274. [Google Scholar] [CrossRef]
- Cortes, C.; Vapnik, V. Support-vector networks. Mach. Learn. 1995, 20, 273–297. [Google Scholar] [CrossRef]
- Elkan, C. The foundations of cost-sensitive learning. In Proceedings of the International Joint Conference on Artificial Intelligence, Seattle, WA, USA, 4–10 August 2001; pp. 973–978. [Google Scholar]
- Ikeda, D.M.; Hylton, N.M.; Kinkel, K.; Hochman, M.G.; Kuhl, C.K.; Kaiser, W.A.; Weinreb, J.C.; Smazal, S.F.; Degani, H.; Viehweg, P. Development, standardization, and testing of a lexicon for reporting contrast-enhanced breast magnetic resonance imaging studies. J. Magn. Reson. Imaging Off. J. Int. Soc. Magn. Reson. Med. 2001, 13, 889–895. [Google Scholar] [CrossRef]
- D’Orsi, C.; Sickles, E.; Morris, E. ACR BI-RADS Atlas: Breast Imaging Re-porting and Data System; American College of Radiology: Reston, VA, USA, 2013; Volume 5, pp. 1–689. [Google Scholar]
- Brix, G.; Semmler, W.; Port, R.; Schad, L.R.; Layer, G.; Lorenz, W.J. Pharmacokinetic parameters in CNS Gd-DTPA enhanced MR imaging. J. Comput. Assist. Tomogr. 1991, 15, 621–628. [Google Scholar] [CrossRef]
- Radjenovic, A.; Dall, B.; Ridgway, J.; Smith, M. Measurement of pharmacokinetic parameters in histologically graded invasive breast tumours using dynamic contrast-enhanced MRI. Br. J. Radiol. 2008, 81, 120–128. [Google Scholar] [CrossRef]
- El Khouli, R.H.; Jacobs, M.A.; Bluemke, D.A. Magnetic resonance imaging of the breast. Semin. Roentgenol. 2008, 43, 265–281. [Google Scholar] [CrossRef]
- El Khouli, R.H.; Macura, K.J.; Jacobs, M.A.; Khalil, T.; Kamel, I.; Dwyer, A.; Bluemke, D.A. Dynamic contrast-enhanced MRI of the breast: Quantitative method for kinetic curve type assessment. AJR 2009, 193, W295–W300. [Google Scholar] [CrossRef]
- El Khouli, R.H.; Macura, K.J.; Kamel, I.R.; Bluemke, D.A.; Jacobs, M.A. The effects of applying breast compression in dynamic contrast material-enhanced MR imaging. Radiology 2014, 272, 79–90. [Google Scholar] [CrossRef] [PubMed]
- Ravdin, P.M.; Siminoff, L.A.; Davis, G.J.; Mercer, M.B.; Hewlett, J.; Gerson, N.; Parker, H.L. Computer program to assist in making decisions about adjuvant therapy for women with early breast cancer. J. Clin. Oncol. 2001, 19, 980–991. [Google Scholar] [CrossRef] [PubMed]
- Harris, L.; Fritsche, H.; Mennel, R.; Norton, L.; Ravdin, P.; Taube, S.; Somerfield, M.R.; Hayes, D.F.; Bast, R.C., Jr. American Society of Clinical Oncology 2007 update of recommendations for the use of tumor markers in breast cancer. J. Clin. Oncol. 2007, 25, 5287–5312. [Google Scholar] [CrossRef]
- Carlson, R.W.; Allred, D.C.; Anderson, B.O.; Burstein, H.J.; Carter, W.B.; Edge, S.B.; Erban, J.K.; Farrar, W.B.; Goldstein, L.J.; Gradishar, W.J. Breast cancer. J. Natl. Compr. Cancer Netw. 2009, 7, 122–192. [Google Scholar] [CrossRef] [PubMed]
- Goldhirsch, A.; Ingle, J.N.; Gelber, R.; Coates, A.; Thürlimann, B.; Senn, H.-J.; Members, P. Thresholds for therapies: Highlights of the St Gallen International Expert Consensus on the primary therapy of early breast cancer 2009. Ann. Oncol. 2009, 20, 1319–1329. [Google Scholar] [CrossRef] [PubMed]
- El Khouli, R.H.; Jacobs, M.A.; Macura, K.J. Breast MRI for Diagnosis and Staging of Breast Cancer. In Breast Cancer Screening and Diagnosis: A Synopsis; Shetty, M.K., Ed.; Springer: New York, NY, USA, 2015; pp. 181–200. [Google Scholar] [CrossRef]
- Bluemke, D.A.; Gatsonis, C.A.; Chen, M.H.; DeAngelis, G.A.; DeBruhl, N.; Harms, S.; Heywang-Köbrunner, S.H.; Hylton, N.; Kuhl, C.K.; Lehman, C. Magnetic resonance imaging of the breast prior to biopsy. JAMA 2004, 292, 2735–2742. [Google Scholar] [CrossRef]
- Van Goethem, M.; Tjalma, W.; Schelfout, K.; Verslegers, I.; Biltjes, I.; Parizel, P. Magnetic resonance imaging in breast cancer. Eur. J. Surg. Oncol. (Ejso) 2006, 32, 901–910. [Google Scholar] [CrossRef]
- Sung, J.S.; Stamler, S.; Brooks, J.; Kaplan, J.; Huang, T.; Dershaw, D.D.; Lee, C.H.; Morris, E.A.; Comstock, C.E. Breast cancers detected at screening MR imaging and mammography in patients at high risk: Method of detection reflects tumor histopathologic results. Radiology 2016, 280, 716–722. [Google Scholar] [CrossRef]
- Sutton, E.J.; Oh, J.H.; Dashevsky, B.Z.; Veeraraghavan, H.; Apte, A.P.; Thakur, S.B.; Deasy, J.O.; Morris, E.A. Breast cancer subtype intertumor heterogeneity: MRI-based features predict results of a genomic assay. J. Magn. Reson. Imaging 2015, 42, 1398–1406. [Google Scholar] [CrossRef]
- Thakur, S.B.; Durando, M.; Milans, S.; Cho, G.Y.; Gennaro, L.; Sutton, E.J.; Giri, D.; Morris, E.A. Apparent diffusion coefficient in estrogen receptor-positive and lymph node-negative invasive breast cancers at 3.0 T DW-MRI: A potential predictor for an oncotype Dx test recurrence score. J. Magn. Reson. Imaging 2018, 47, 401–409. [Google Scholar] [CrossRef]
- Saha, A.; Harowicz, M.R.; Wang, W.; Mazurowski, M.A. A study of association of Oncotype DX recurrence score with DCE-MRI characteristics using multivariate machine learning models. J. Cancer Res. Clin. Oncol. 2018, 144, 799–807. [Google Scholar] [CrossRef] [PubMed]
- Bavelas, A. Communication Patterns in Task-Oriented Groups. J. Acoust. Soc. Am. 1950, 725–730. [Google Scholar] [CrossRef]


| Clinical Information | Mean ± SD |
|---|---|
| Patient Age | 53 ± 10 |
| Tumor Grade (Elson) | |
| 1 | 8 |
| 2 | 60 |
| 3 | 12 |
| Ki67 (%) | 29 ± 16 |
| ER+ | 80 |
| PR+ | 74 |
| * HER2-neu+ | 0 |
| Triple Negative | 0 |
| ODX Score | |
| Low (≤17%) | 19 |
| Intermediate (18–30%) | 49 |
| High (≥31%) | 12 |
| Radiomic Features | Low Risk | Intermediate Risk | High Risk | p-Value * |
|---|---|---|---|---|
| mpRad FOS Energy | 1359 ± 223 | 1346.45 ± 171 | 3332 ± 900 | 0.03 |
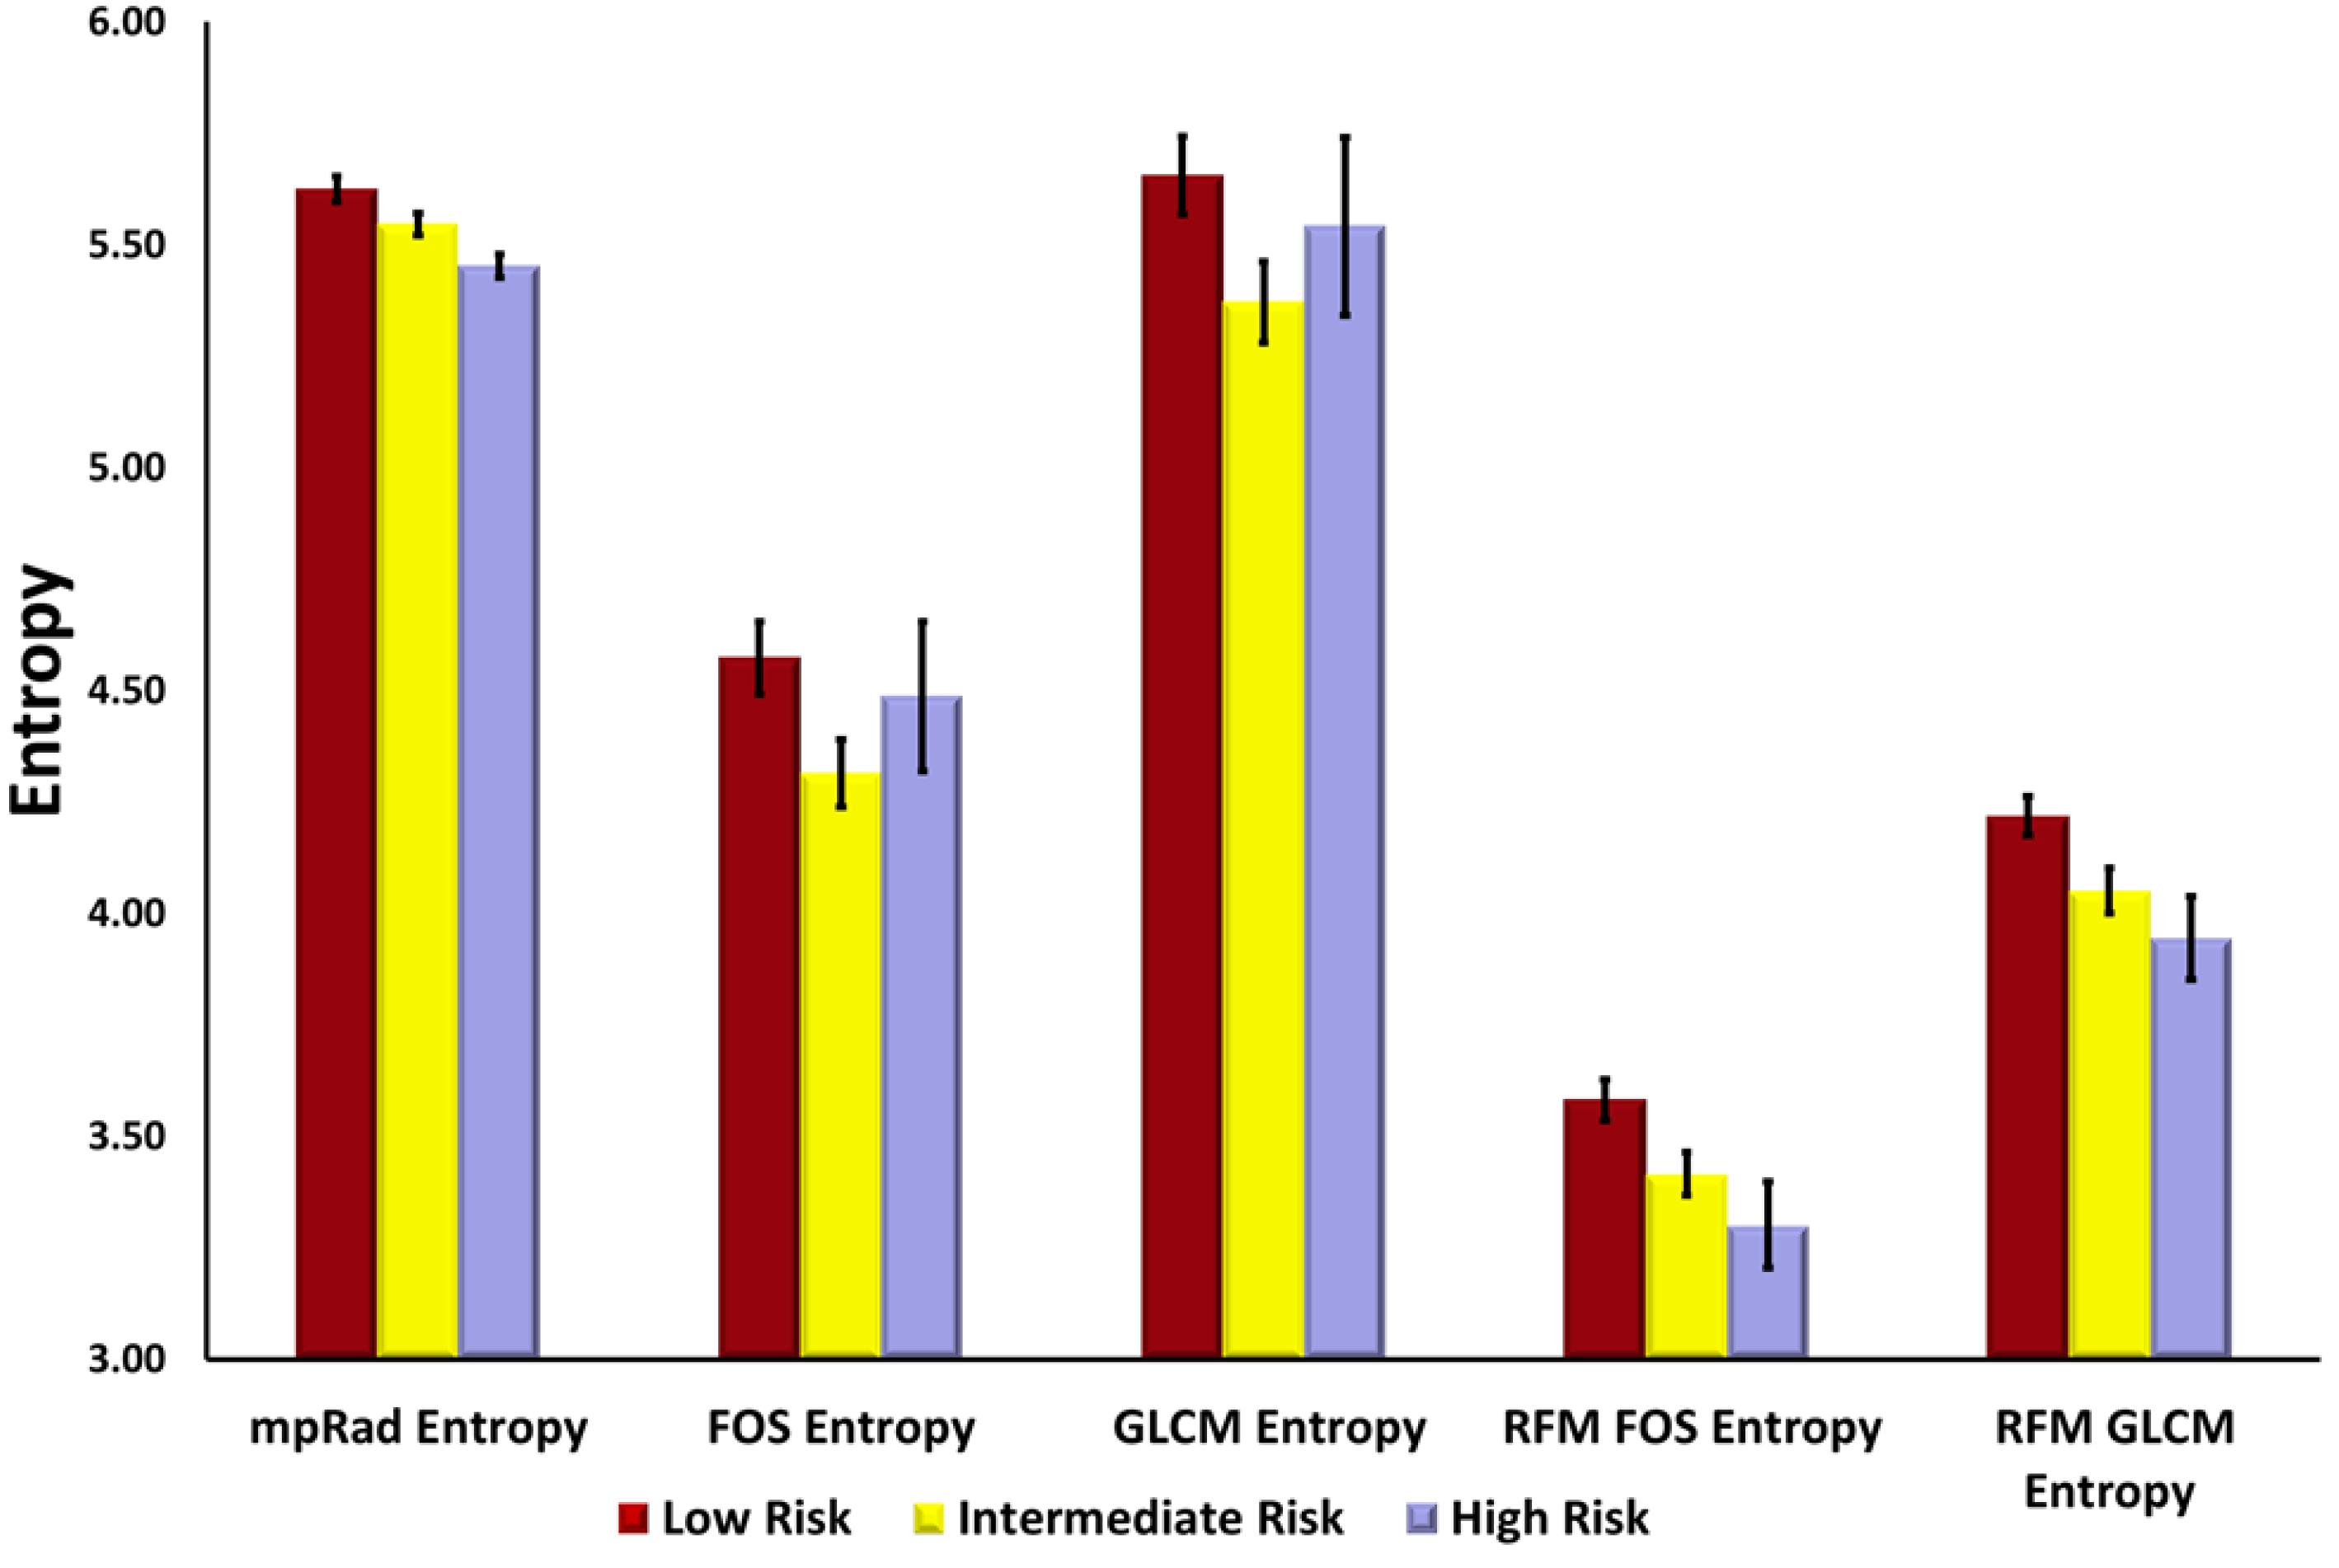
| mpRad FOS Entropy | 5.62 ± 0.03 | 5.55 ± 0.02 | 5.45 ± 0.03 | 0.009 |
| mpRad FOS Uniformity | 0.02 ± 0.001 | 0.03 ± 0.001 | 0.03 ± 0.001 | 0.004 |
| FOS Entropy | 4.57 ± 0.09 | 4.32 ± 0.08 | 4.49 ± 0.17 | 0.06 |
| FOS Uniformity | 0.05 ± 0.003 | 0.06 ± 0.003 | 0.06 ± 0.007 | 0.01 |
| GLCM Entropy | 5.67 ± 0.10 | 5.37 ± 0.09 | 5.54 ± 0.20 | 0.04 |
| GLCM Energy | 0.01 ± 0.000 | 0.01 ± 0.001 | 0.01 ± 0.002 | 0.002 |
| RFM FOS Entropy | 3.58 ± 0.05 | 3.42 ± 0.05 | 3.30 ± 0.10 | 0.006 |
| RFM FOS Uniformity | 0.10 ± 0.004 | 0.12 ± 0.005 | 0.13 ± 0.009 | 0.004 |
| RFM GLCM Entropy | 4.23 ± 0.05 | 4.05 ± 0.05 | 3.95 ± 0.09 | 0.004 |
| RFM GLCM Energy | 0.02 ± 0.001 | 0.03 ± 0.003 | 0.03 ± 0.003 | 0.003 |
| Parameter | Rank |
|---|---|
| Ki-67 | 1 |
| Ratio Lesion/Glandular Tissue | 2 |
| Lesion ADC | 3 |
| %initial enhancement | 4 |
| RFM FOS kurtosis | 5 |
| Perm-Mean | 6 |
| NGTDM Busyness | 7 |
| GLCM Correlation | 8 |
| GLRLM GLN | 9 |
| GLRLM RLN | 10 |
| RFM Laplacian | 10 |
| RFM LoG | 10 |
| Parameter | Rank |
|---|---|
| Ratio L/GT | 1 |
| Lesion ADC | 2 |
| %initial enhancement | 3 |
| TSFOS Energy | 4 |
| TSFOS Kurtosis | 5 |
| TSPM Multidimensional uniformity | 6 |
| TSFOS Minimum | 7 |
| TSCM Dissimilarity1 | 8 |
| TSCM Inverse Difference Normalized1 | 9 |
| TSCM Inverse variance1 | 10 |
| TSCM Sum variance1 | 10 |
| IRIS Parameter | Betweenness Centrality | Degree Centrality | Harmonic Centrality | Integrated Centrality |
|---|---|---|---|---|
| GLCM Variance | 246 | 5 | 347.84 | 0.58 |
| GLCM Autocorrelation | 167 | 4 | 357.07 | 0.53 |
| RFM FOS uniformity | 886 | 7 | 3.55 | 0.53 |
| NGTDM Contrast | 1115 | 5 | 0.82 | 0.52 |
| GLCM Energy | 1084 | 5 | 1.35 | 0.51 |
| RFM GLCM entropy | 763 | 7 | 4.86 | 0.49 |
| GLCM Maximum probability | 975 | 5 | 1.32 | 0.48 |
| GLCM Homogeneity 2 | 860 | 5 | 10.34 | 0.45 |
| GLCM Correlation | 747 | 6 | 0.83 | 0.45 |
| kinetic curve type | 371 | 9 | 0.66 | 0.44 |
| IRIS parameter | Betweenness Centrality | Degree Centrality | Harmonic Centrality | Integrated Centrality |
|---|---|---|---|---|
| TSCM Contrast I | 406.00 | 5.00 | 150.18 | 0.72 |
| TSCM Autocorrelation I | 238.00 | 5.00 | 210.53 | 0.68 |
| TSCM Inverse Difference Moment Normalized1 | 367.00 | 4.00 | 150.18 | 0.66 |
| TSCM Variance I | 195.00 | 4.00 | 210.52 | 0.61 |
| kinetic curve type | 280.00 | 11.00 | 0.84 | 0.56 |
| TSCM Inverse Difference Normalized1 | 358.00 | 6.00 | 21.24 | 0.51 |
| TSCM Dissimilarity I | 357.00 | 5.00 | 21.25 | 0.48 |
| Green % | 399.00 | 4.00 | 0.77 | 0.45 |
| TSCM Homogeneity II | 202.00 | 7.00 | 15.00 | 0.40 |
| TSPM uniformity | 330.00 | 4.00 | 0.99 | 0.39 |
© 2020 by the authors. Licensee MDPI, Basel, Switzerland. This article is an open access article distributed under the terms and conditions of the Creative Commons Attribution (CC BY) license (http://creativecommons.org/licenses/by/4.0/).
Share and Cite
Jacobs, M.A.; Umbricht, C.B.; Parekh, V.S.; El Khouli, R.H.; Cope, L.; Macura, K.J.; Harvey, S.; Wolff, A.C. Integrated Multiparametric Radiomics and Informatics System for Characterizing Breast Tumor Characteristics with the OncotypeDX Gene Assay. Cancers 2020, 12, 2772. https://doi.org/10.3390/cancers12102772
Jacobs MA, Umbricht CB, Parekh VS, El Khouli RH, Cope L, Macura KJ, Harvey S, Wolff AC. Integrated Multiparametric Radiomics and Informatics System for Characterizing Breast Tumor Characteristics with the OncotypeDX Gene Assay. Cancers. 2020; 12(10):2772. https://doi.org/10.3390/cancers12102772
Chicago/Turabian StyleJacobs, Michael A., Christopher B. Umbricht, Vishwa S. Parekh, Riham H. El Khouli, Leslie Cope, Katarzyna J. Macura, Susan Harvey, and Antonio C. Wolff. 2020. "Integrated Multiparametric Radiomics and Informatics System for Characterizing Breast Tumor Characteristics with the OncotypeDX Gene Assay" Cancers 12, no. 10: 2772. https://doi.org/10.3390/cancers12102772
APA StyleJacobs, M. A., Umbricht, C. B., Parekh, V. S., El Khouli, R. H., Cope, L., Macura, K. J., Harvey, S., & Wolff, A. C. (2020). Integrated Multiparametric Radiomics and Informatics System for Characterizing Breast Tumor Characteristics with the OncotypeDX Gene Assay. Cancers, 12(10), 2772. https://doi.org/10.3390/cancers12102772