HDAC9 Is Preferentially Expressed in Dedifferentiated Hepatocellular Carcinoma Cells and Is Involved in an Anchorage-Independent Growth


Simple Summary
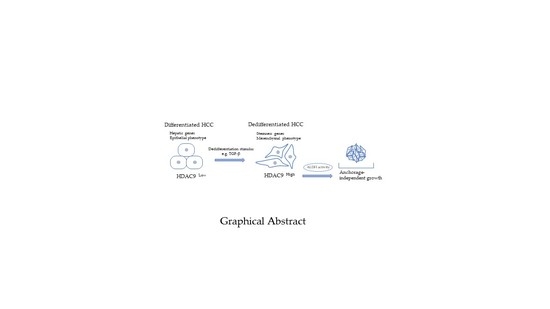
Abstract
1. Introduction
2. Results
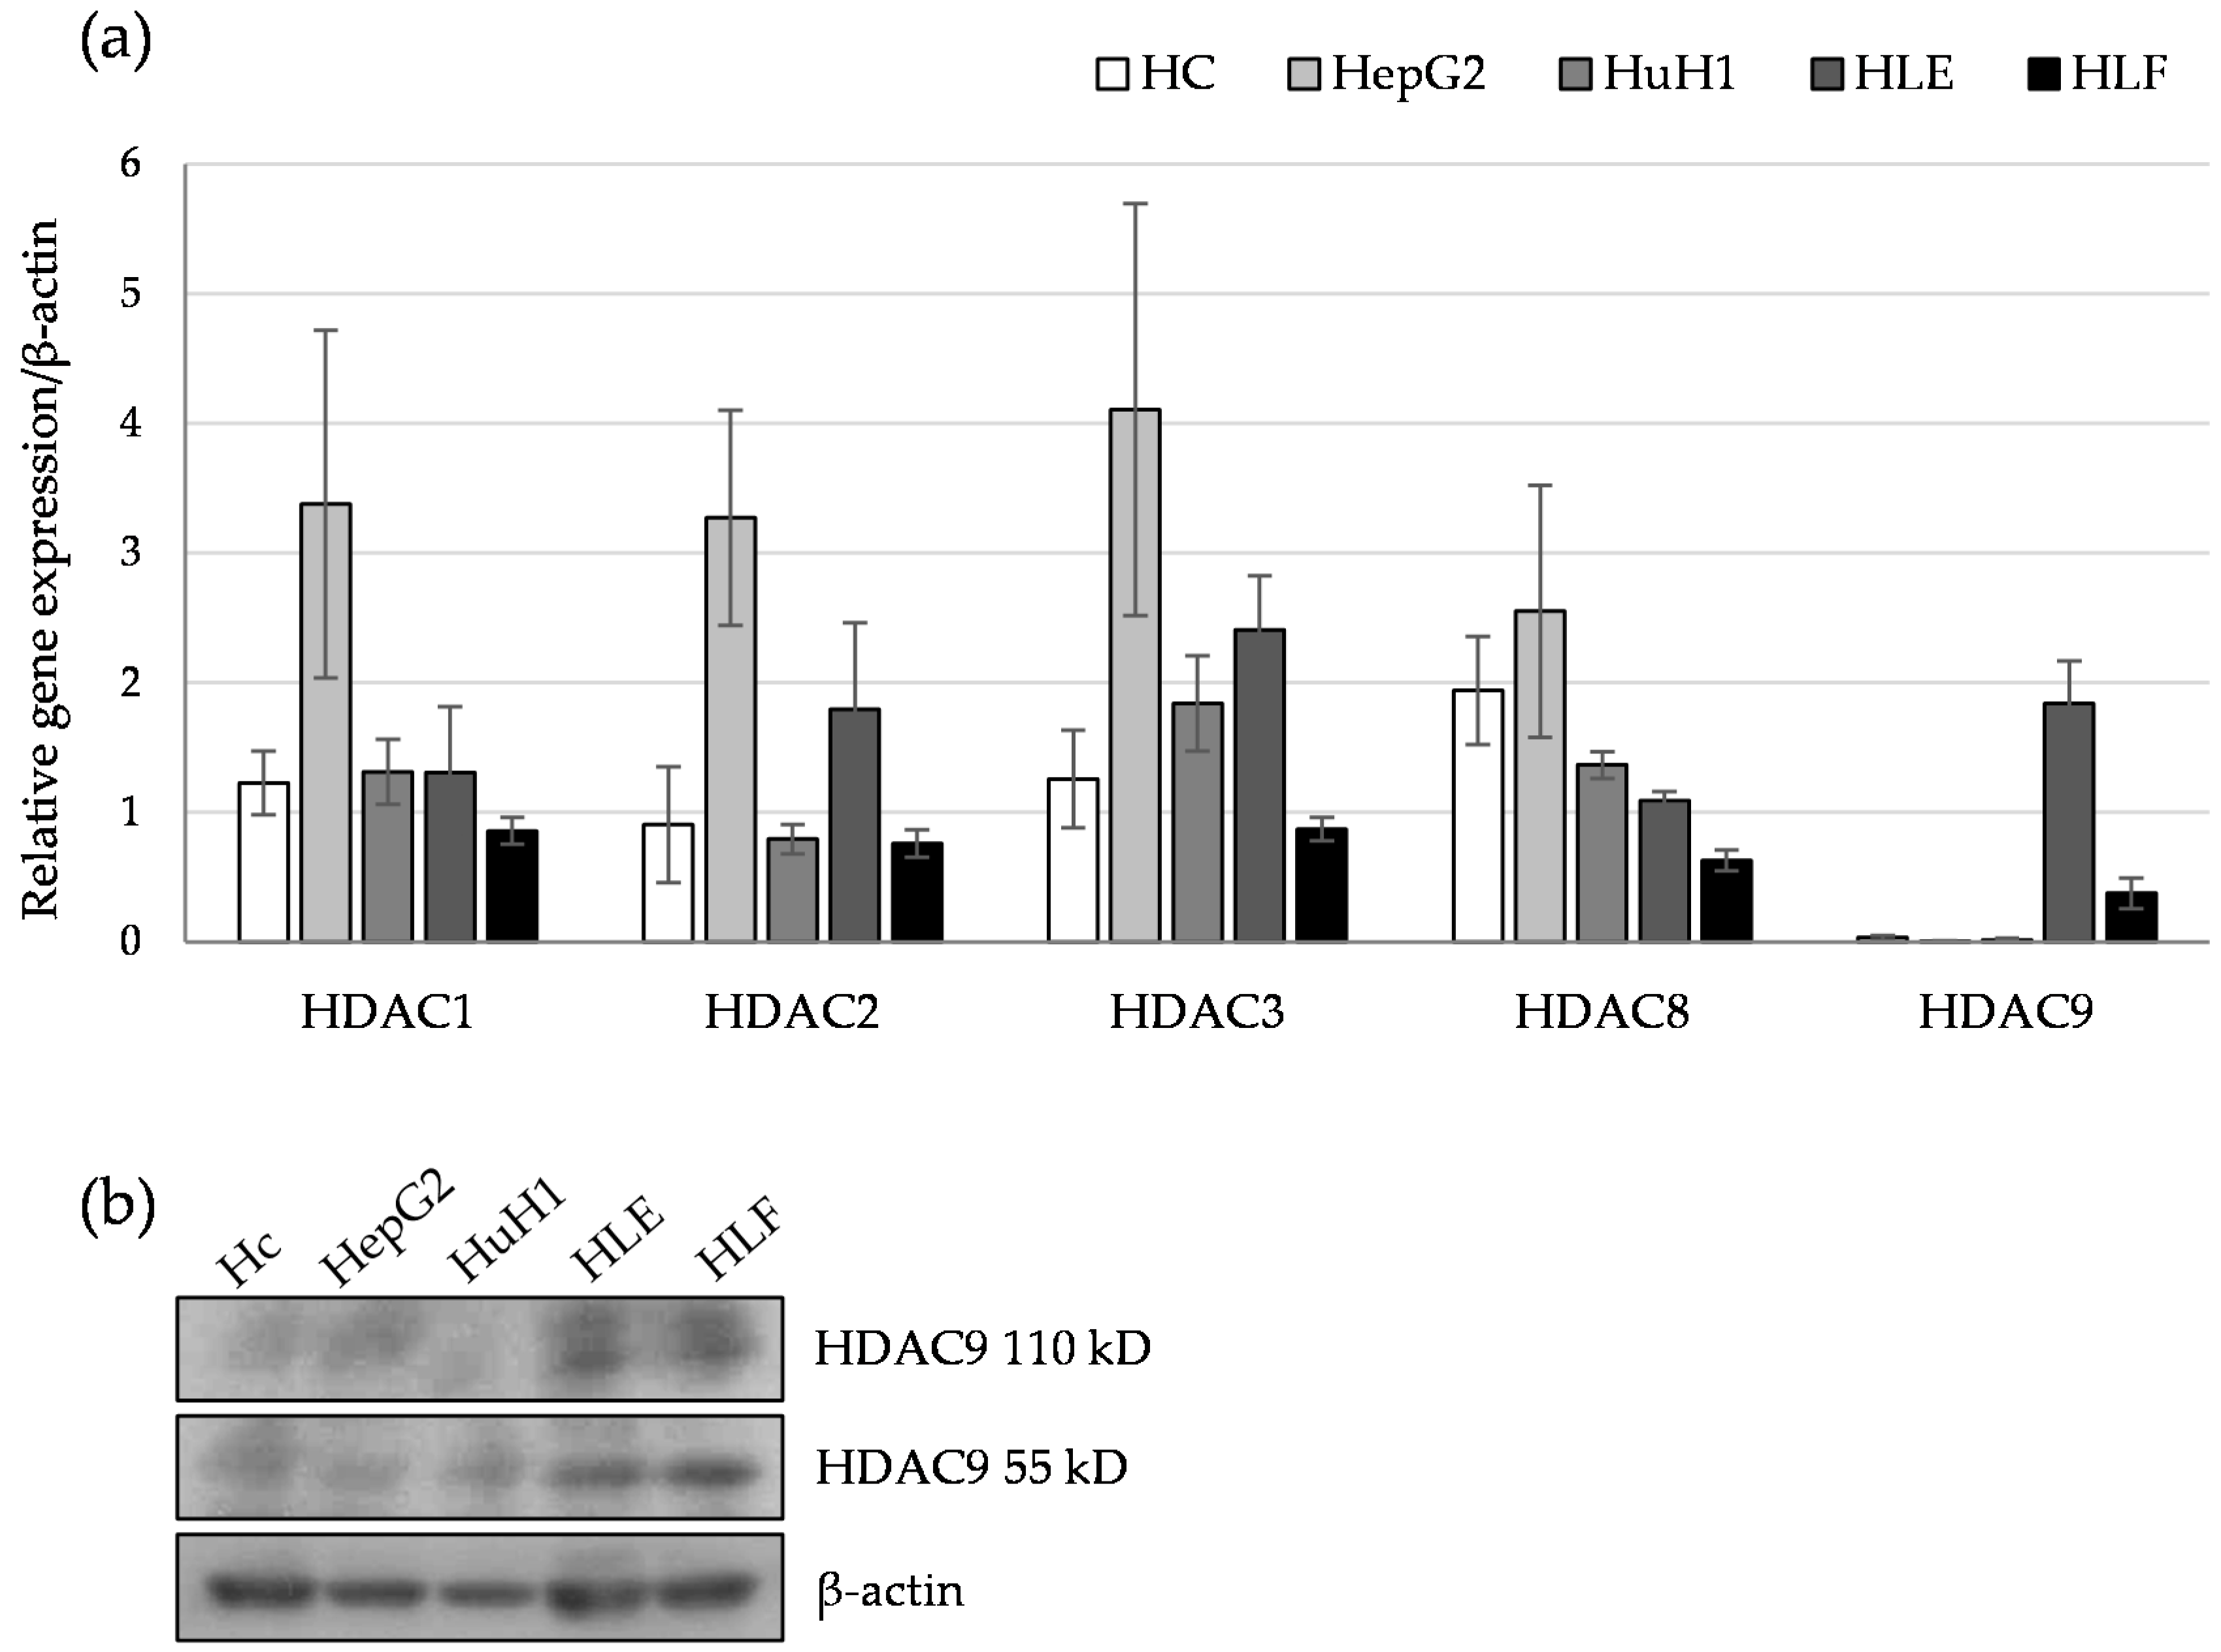
2.1. HDAC9 Gene Expression Correlates with a Dedifferentiated Phenotype of HCC Cells
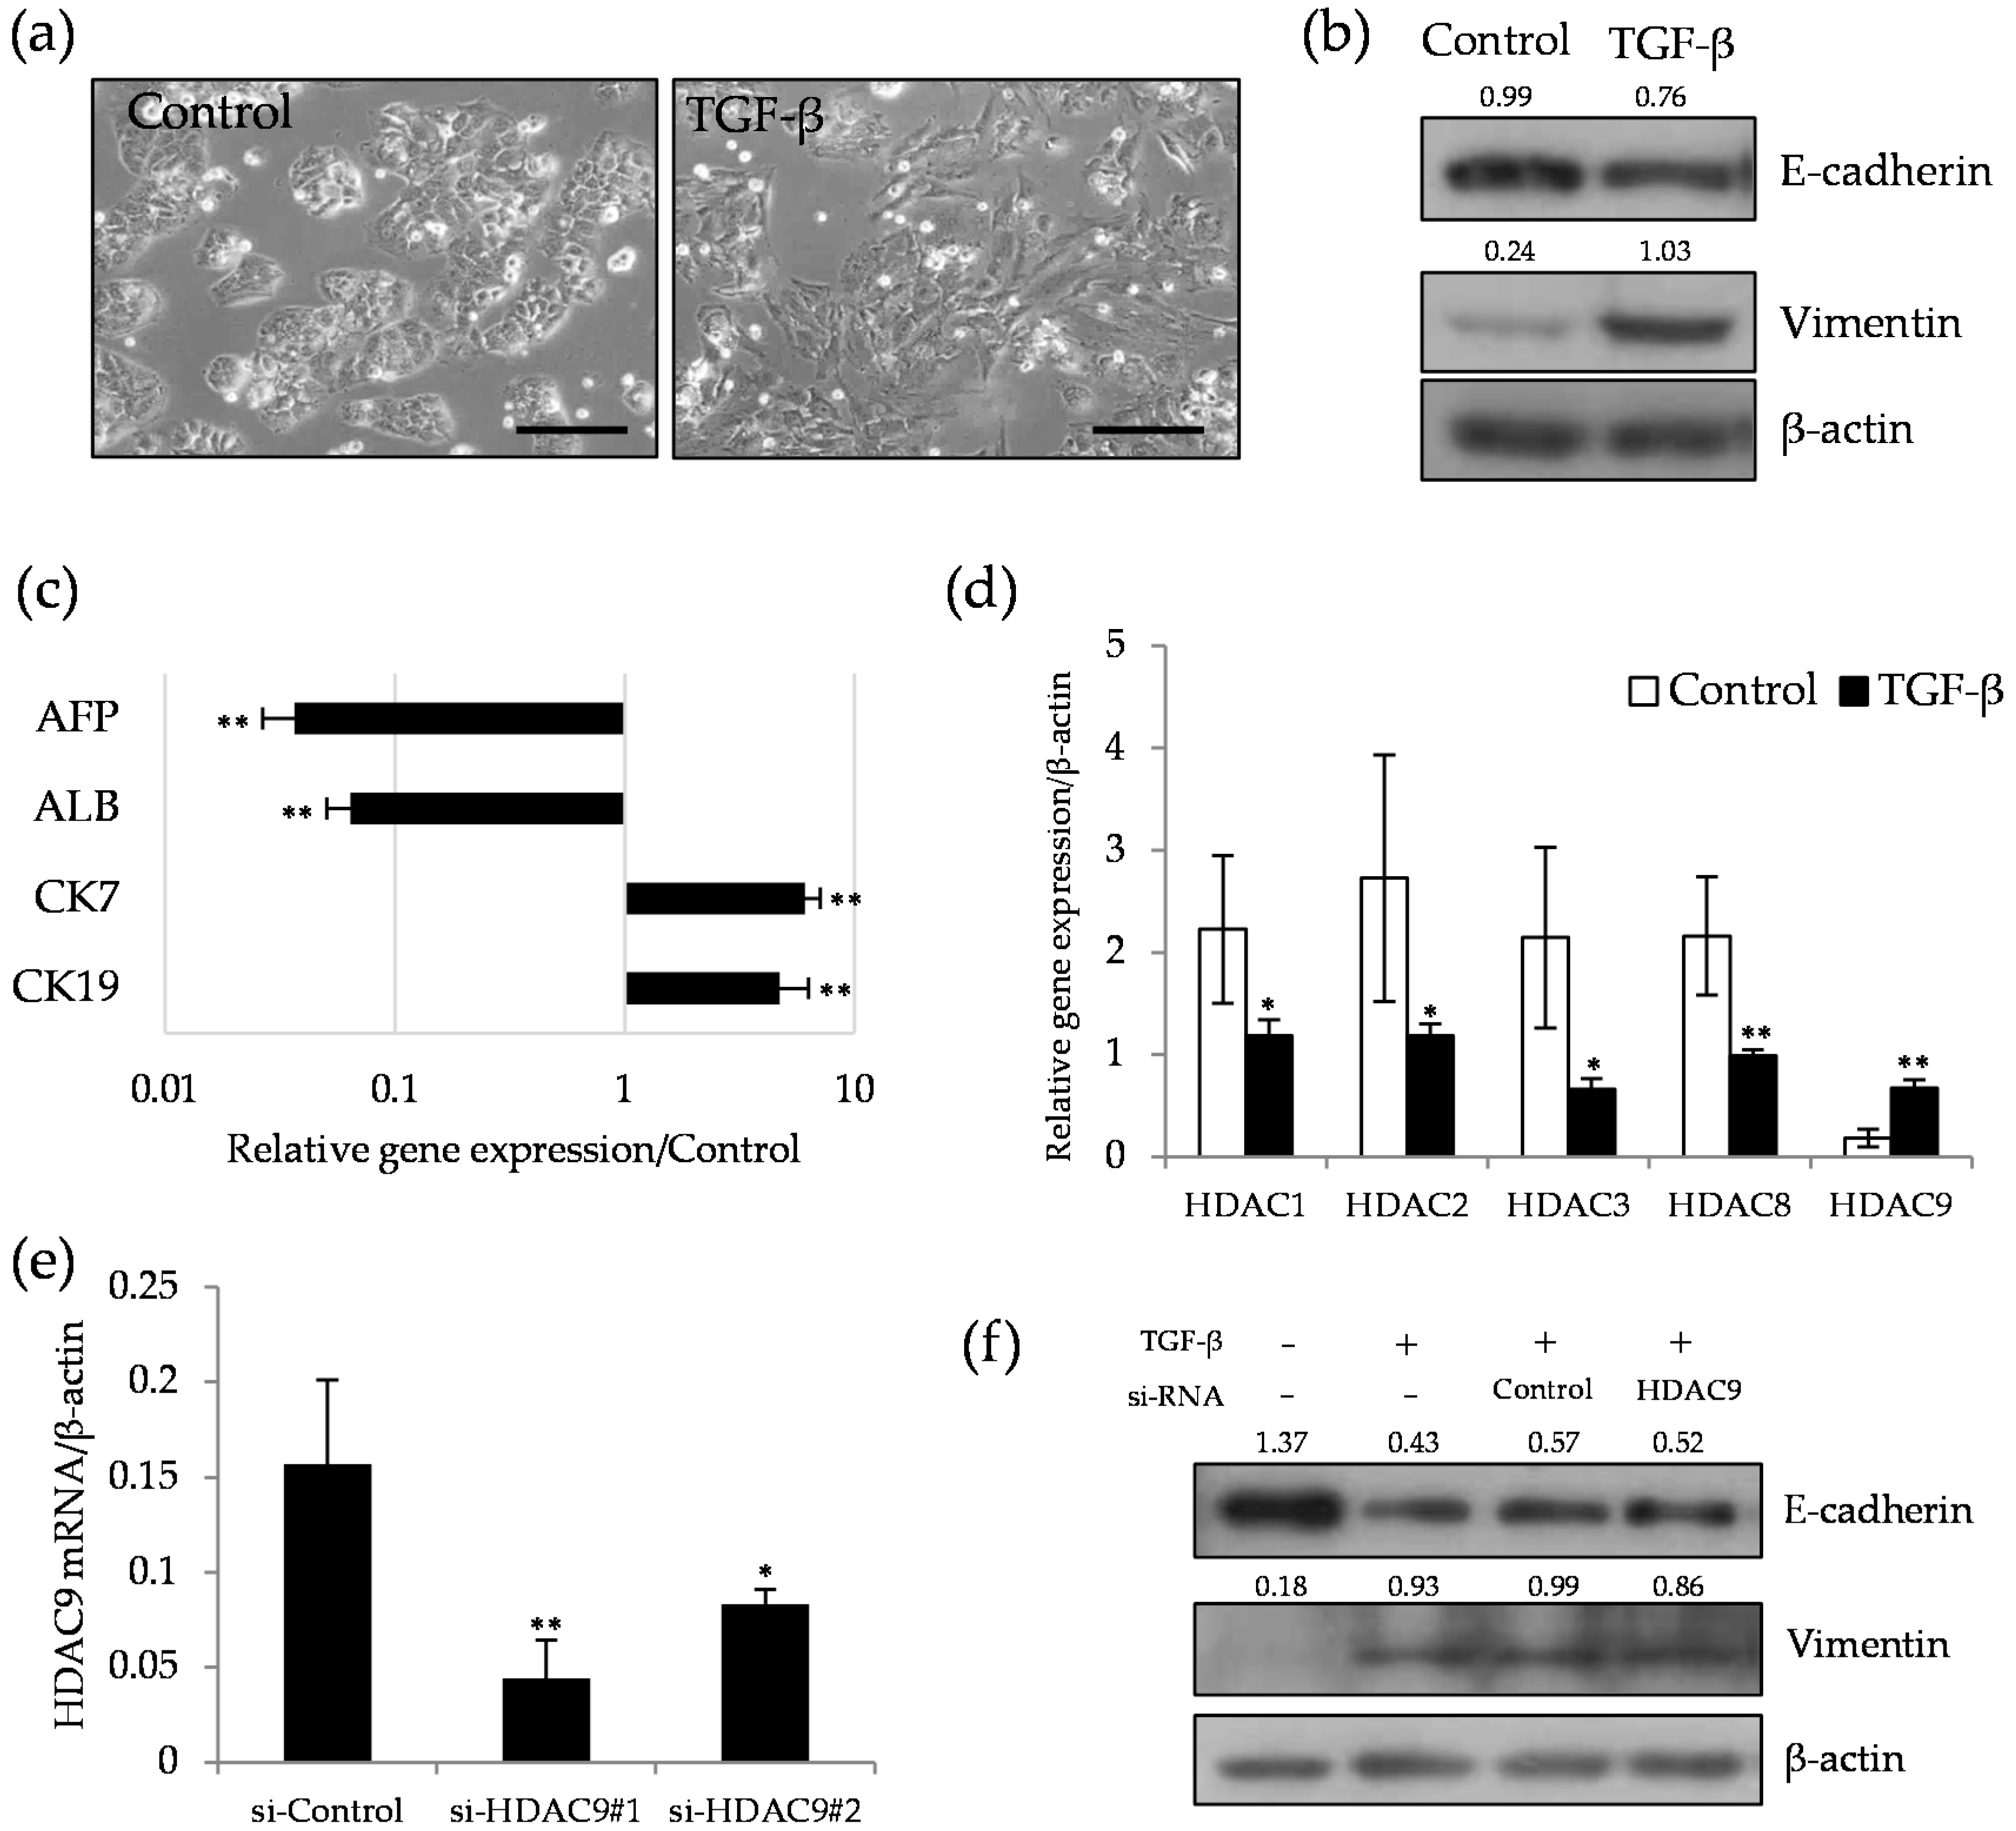
2.2. HDAC9 is Induced during the Dedifferentiation Process of EMT Induced by TGF-β
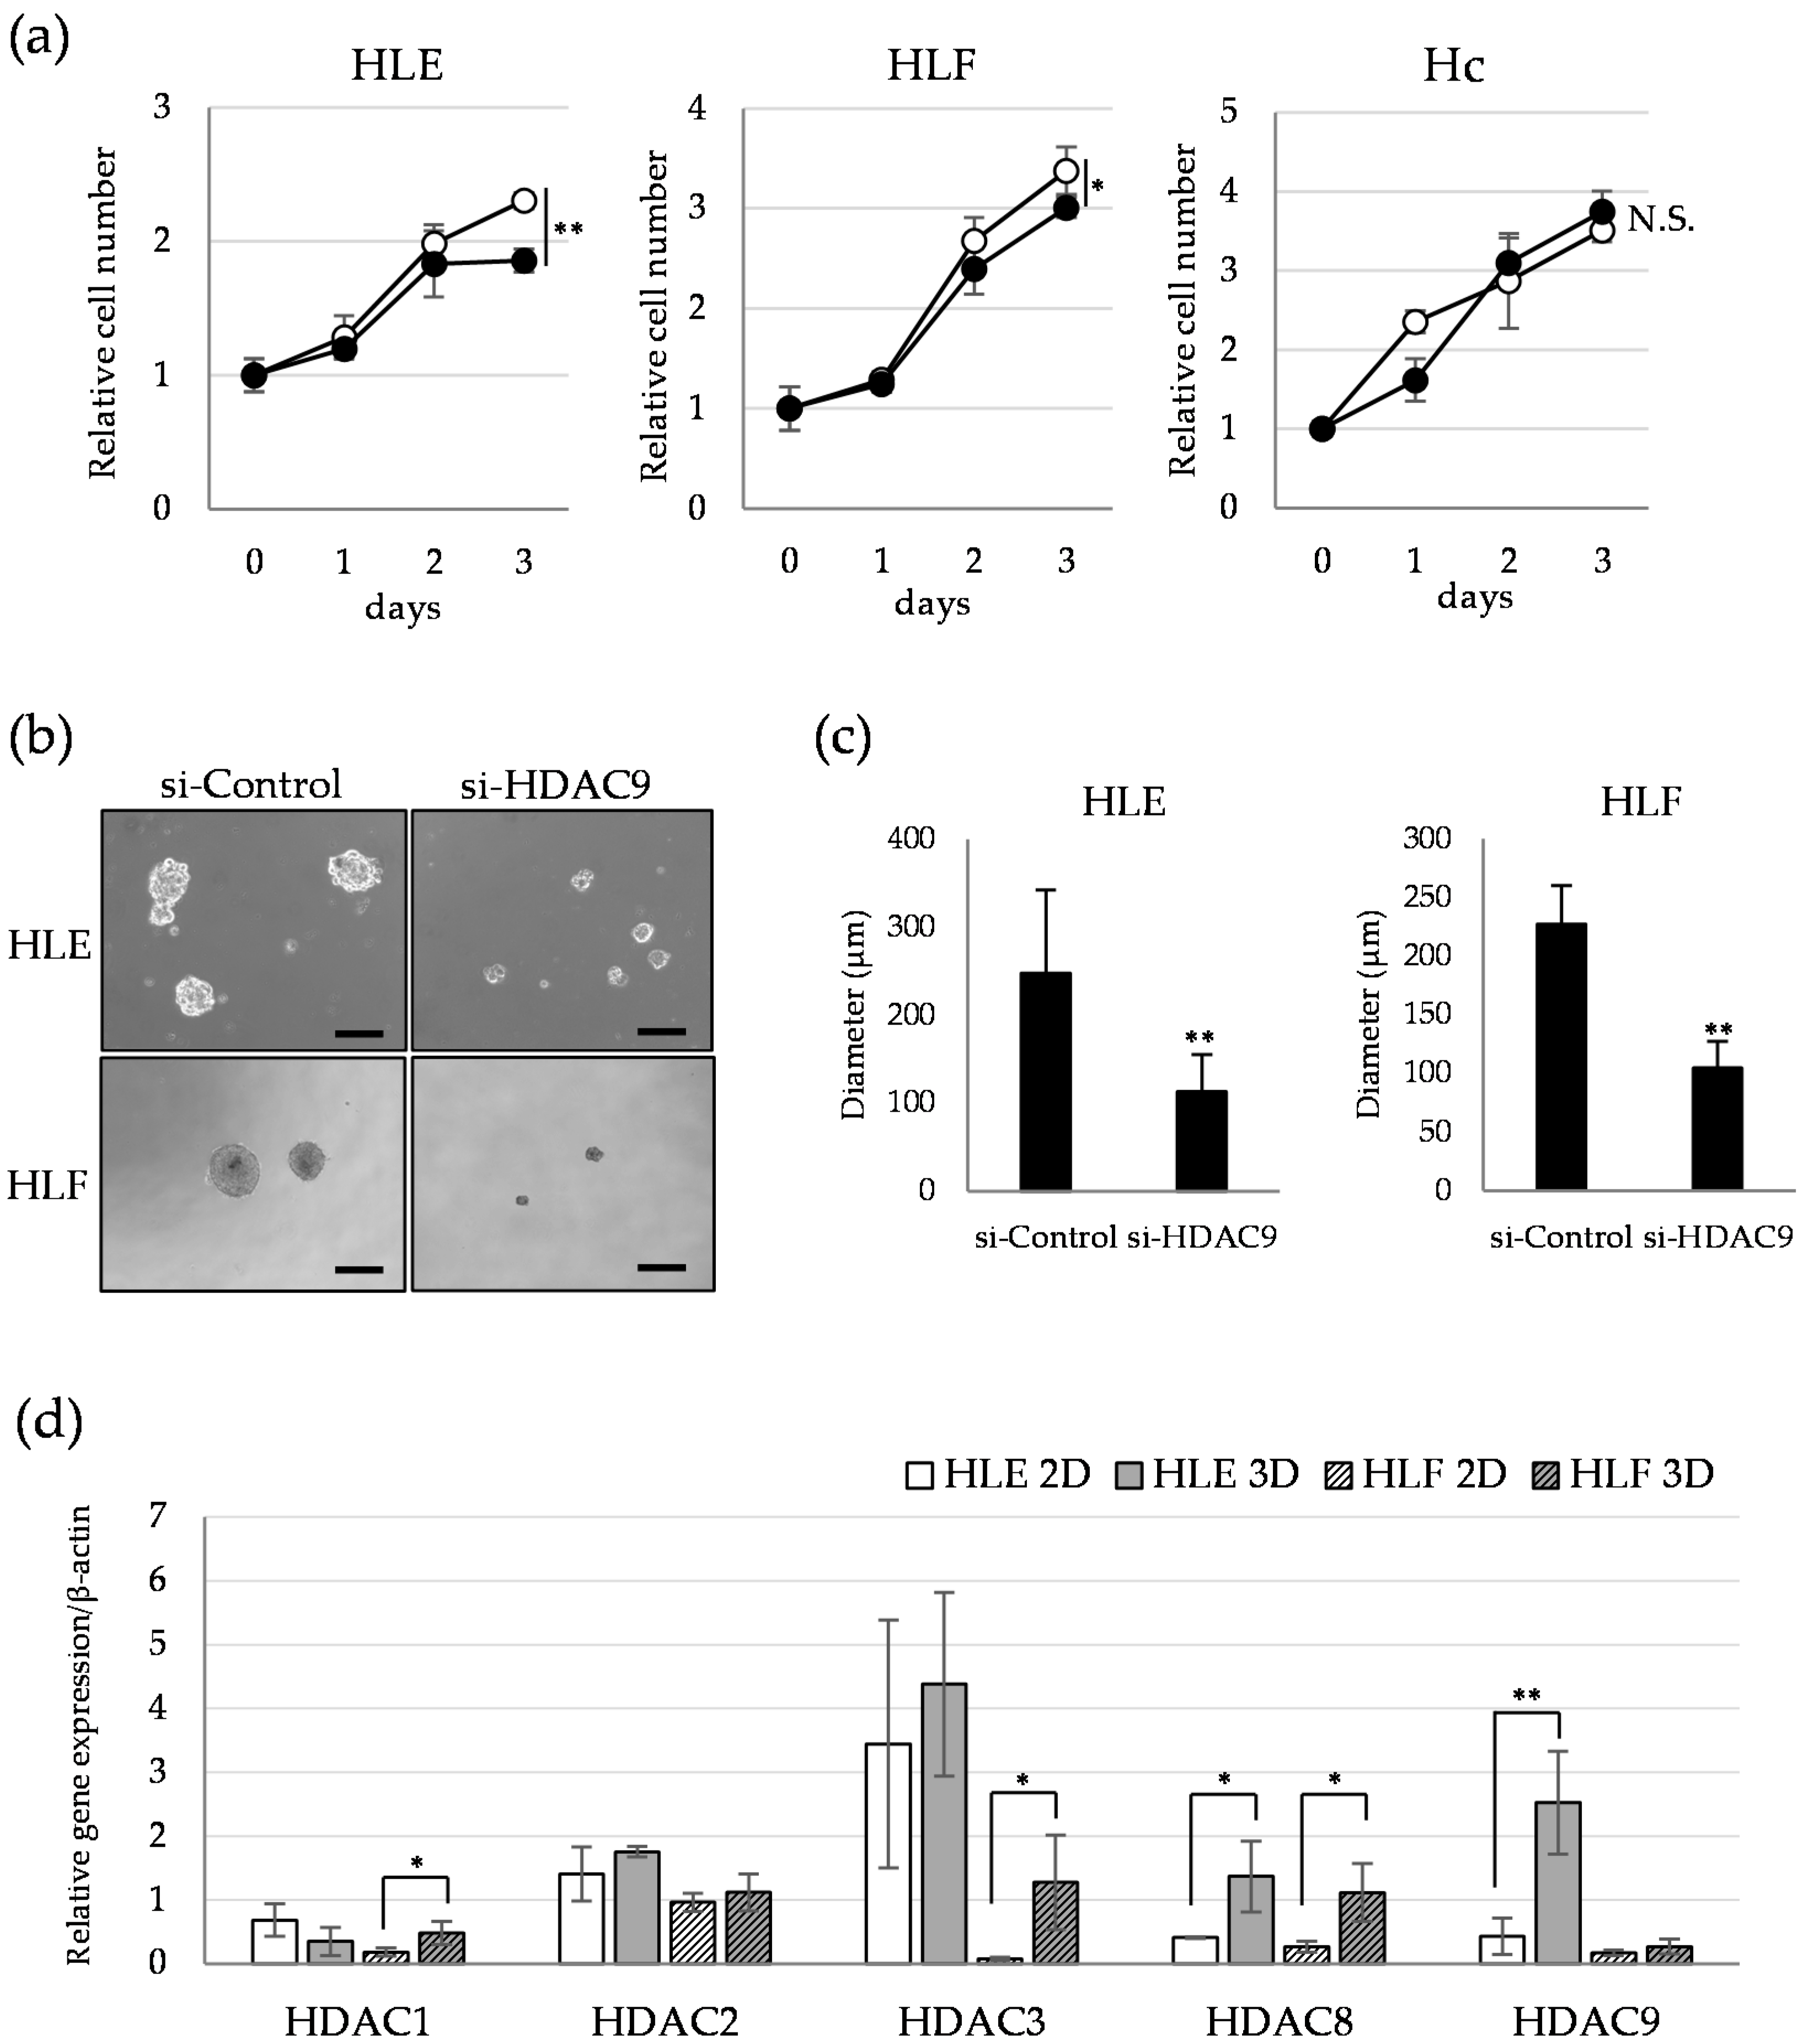
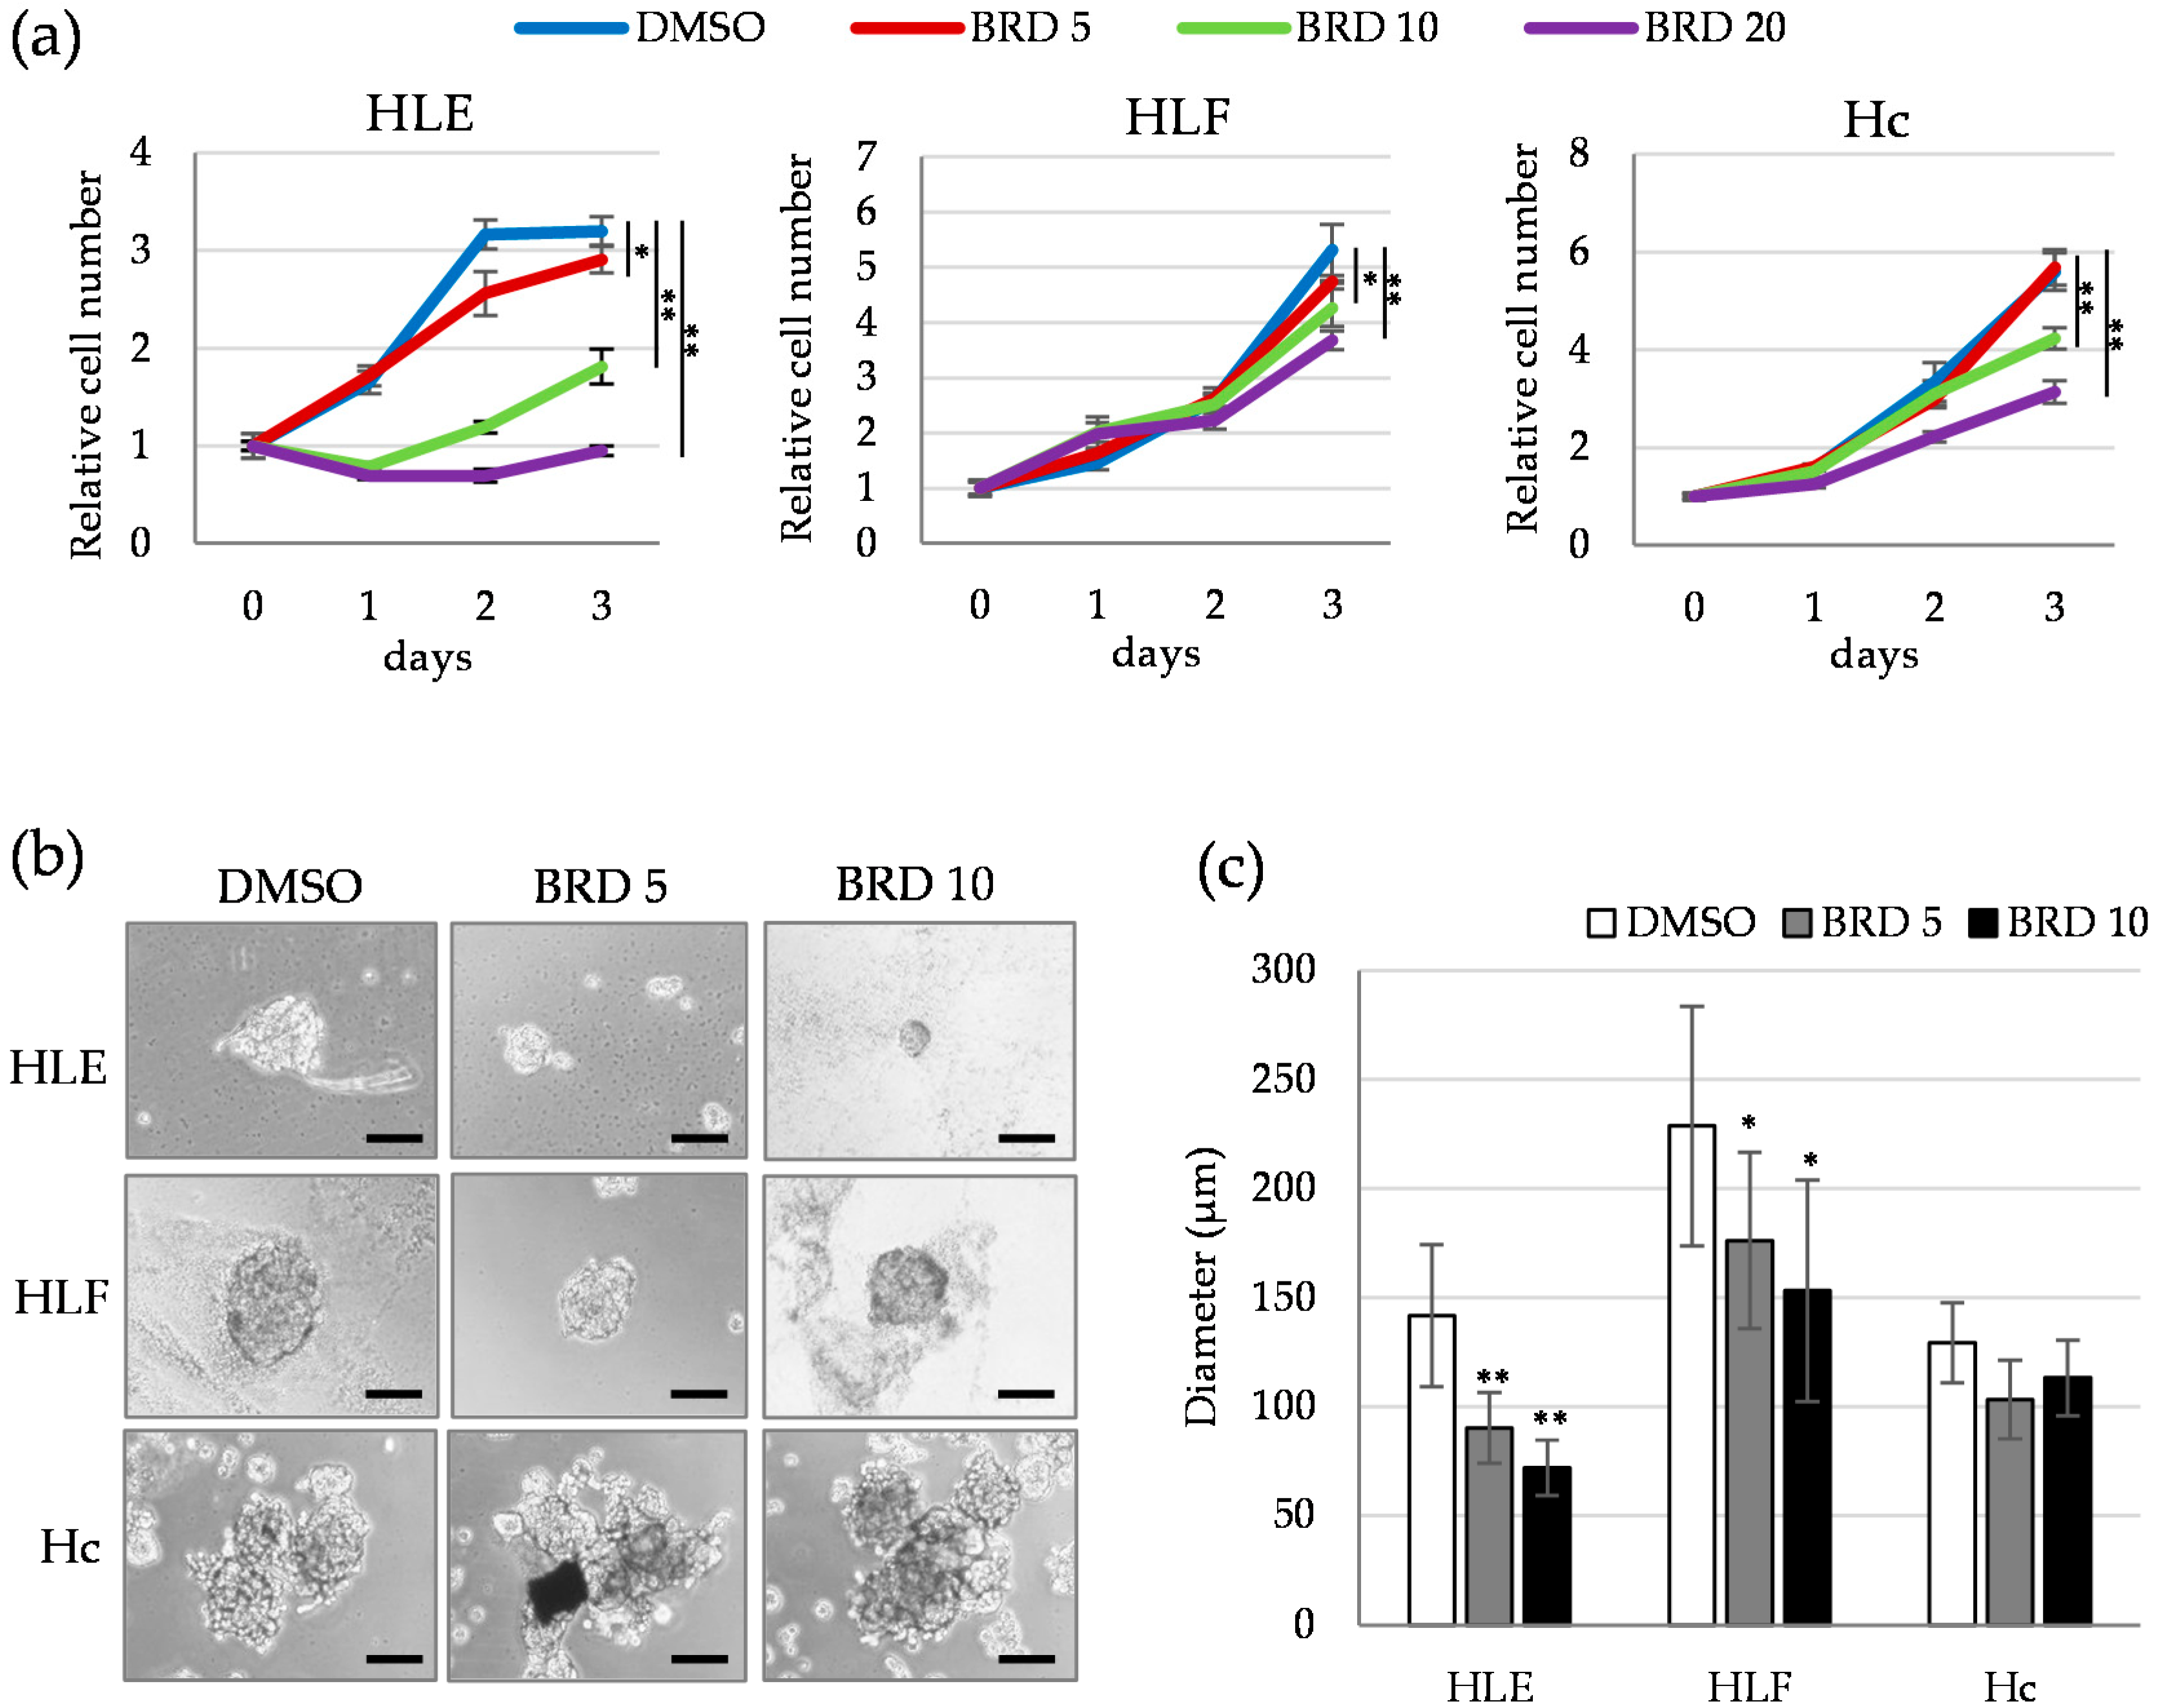
2.3. HDAC9 is Involved in the Sphere Formation Capacity of Undifferentiated HCC Cells
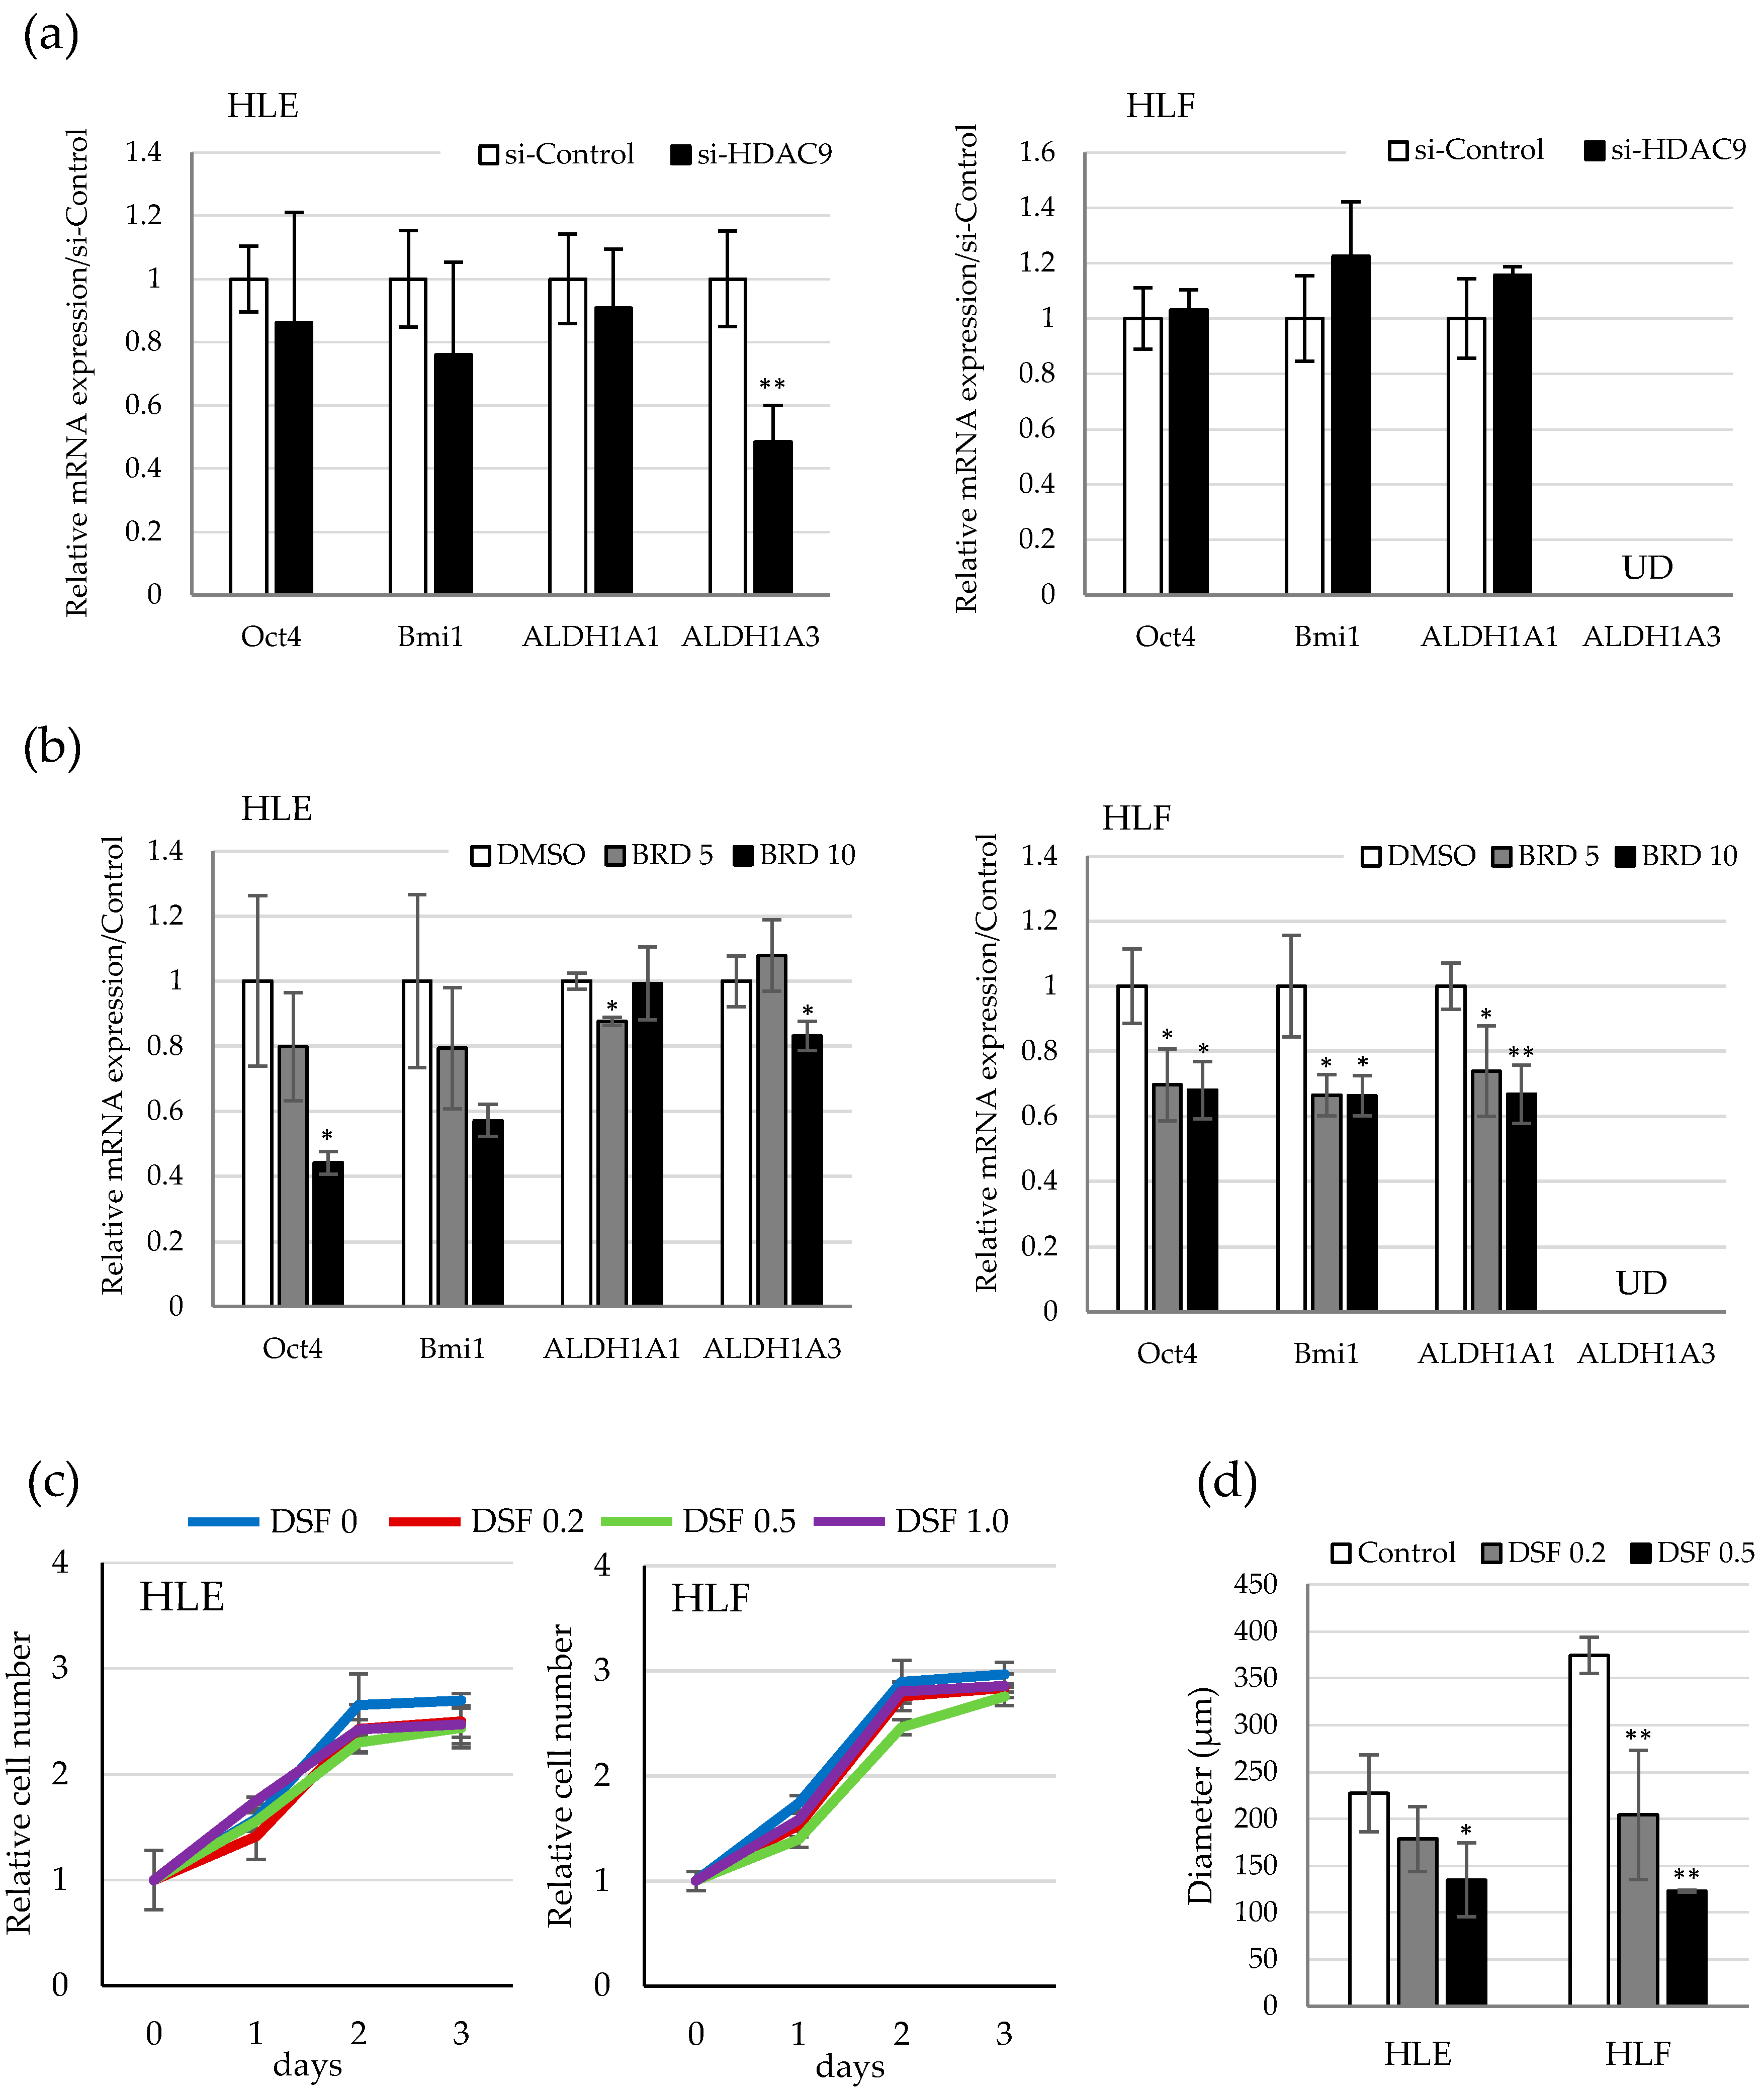
2.4. Involvement of ALDH Activity in the Sphere Formation Capacity of HDAC9-Expressing Undifferentiated HCC Cells
3. Discussion
4. Materials and Methods
4.1. Cell Culture and Reagents
4.2. Cell Proliferation Assays
4.3. Gene Expression Analysis
4.4. Western Blot Analysis
4.5. Small-Interference RNA Experiment
4.6. Sphere-Forming Assay
4.7. Statistical Analysis
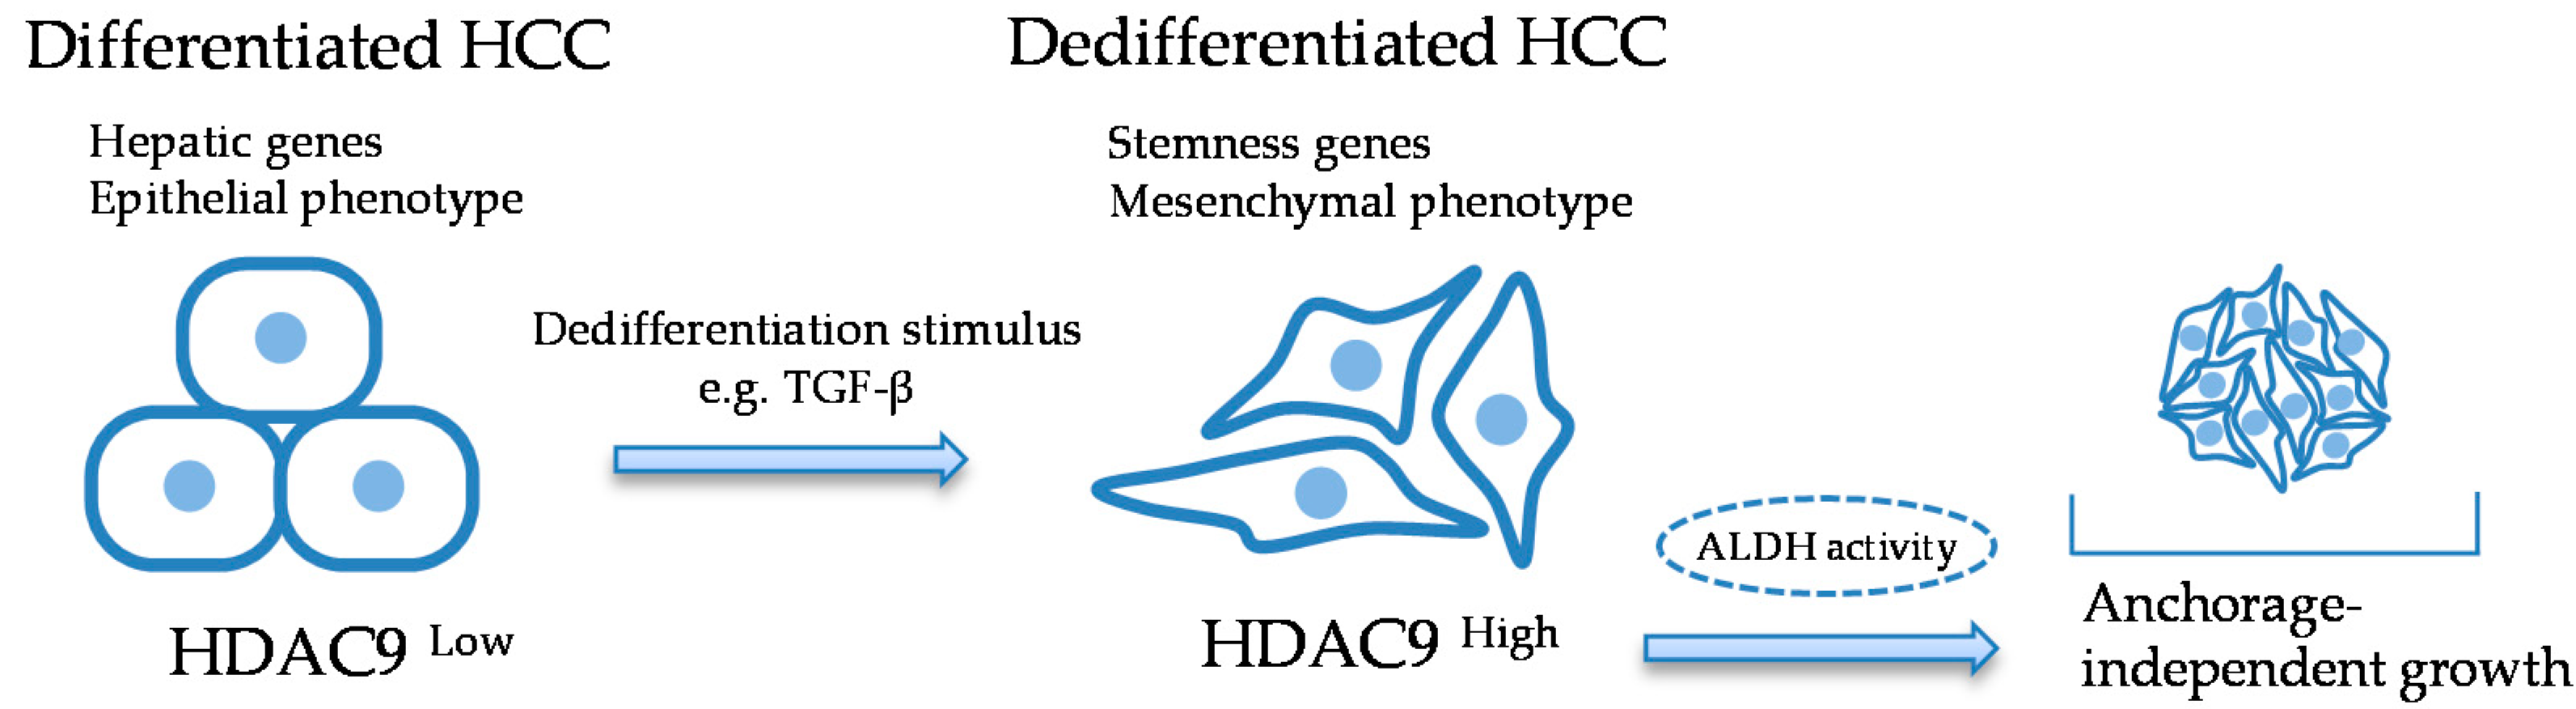
5. Conclusions
Supplementary Materials
Author Contributions
Funding
Acknowledgments
Conflicts of Interest
References
- Csordas, A. On the biological role of histone acetylation. Biochem. J. 1990, 265, 23–38. [Google Scholar] [CrossRef] [PubMed]
- Barneda-Zahonero, B.; Parra, M. Histone deacetylases and cancer. Mol. Oncol. 2012, 6, 579–589. [Google Scholar] [CrossRef] [PubMed]
- Subramanian, S.; Bates, S.E.; Wright, J.J.; Espinoza-Delgado, I.; Piekarz, R.L. Clinical toxicities of histone deacetylase Inhibitors. Pharmaceuticals 2010, 3, 2751–2767. [Google Scholar] [CrossRef]
- Yang, J.D.; Hainaut, P.; Gores, G.J.; Amadou, A.; Plymoth, A.; Roberts, L.R. A global view of hepatocellular carcinoma: Trends, risk, prevention and management. Nat. Rev. Gastroenterol. Hepatol. 2019, 16, 589–604. [Google Scholar] [CrossRef] [PubMed]
- Gupta, P.B.; Pastushenko, I.; Skibinski, A.; Blanpain, C.; Kuperwasser, C. Phenotypic Plasticity: Driver of Cancer Initiation, Progression, and Therapy Resistance. Cell Stem Cell 2019, 24, 65–78. [Google Scholar] [CrossRef] [PubMed]
- Flores-Téllez, T.N.; Villa-Treviño, S.; Piña-Vázquez, C. Road to stemness in hepatocellular carcinoma. World J. Gastroenterol. 2017, 23, 6750–6776. [Google Scholar] [CrossRef]
- Lee, Y.H.; Seo, D.; Choi, K.J.; Andersen, J.B.; Won, M.A.; Kitade, M.; Gómez-Quiroz, L.E.; Judge, A.D.; Marquardt, J.U.; Raggi, C.; et al. Antitumor effects in hepatocarcinoma of isoform-selective inhibition of HDAC2. Cancer Res. 2014, 74, 4752–4761. [Google Scholar] [CrossRef]
- Ler, S.Y.; Leung, C.H.; Khin, L.W.; Lu, G.D.; Salto-Tellez, M.; Hartman, M.; Iau, P.T.; Yap, C.T.; Hooi, S.C. HDAC1 and HDAC2 independently predict mortality in hepatocellular carcinoma by a competing risk regression model in a Southeast Asian population. Oncol. Rep. 2015, 34, 2238–2250. [Google Scholar] [CrossRef]
- Tsai, C.L.; Liu, W.L.; Hsu, F.M.; Yang, P.S.; Yen, R.F.; Tzen, K.Y.; Cheng, A.L.; Chen, P.J.; Cheng, J.C. Targeting histone deacetylase 4/ubiquitin-conjugating enzyme 9 impairs DNA repair for radiosensitization of hepatocellular carcinoma cells in mice. Hepatology 2018, 67, 586–599. [Google Scholar] [CrossRef]
- Zhang, M.; Pan, Y.; Dorfman, R.G.; Chen, Z.; Liu, F.; Zhou, Q.; Huang, S.; Zhang, J.; Yang, D.; Liu, J. AR-42 induces apoptosis in human hepatocellular carcinoma cells via HDAC5 inhibition. Oncotarget 2016, 7, 22285–22294. [Google Scholar] [CrossRef]
- Kanki, K.; Watanabe, R.; Le, N.T.; Zhao, C.H.; Naito, K.; (Department of Biomedical Engineering, Faculty of Engineering, Okayama University of Science, Okayama, Japan). Personal communication/observation, 2019.
- Zhou, X.; Marks, P.A.; Rifkind, R.A.; Richon, V.M. Cloning and characterization of a histone deacetylase, HDAC9. Proc. Natl. Acad. Sci. USA 2001, 98, 10572–10577. [Google Scholar] [CrossRef] [PubMed]
- Zhou, X.; Richon, V.M.; Rifkind, R.A.; Marks, P.A. Identification of a transcriptional repressor related to the noncatalytic domain of histone deacetylases 4 and 5. Proc. Natl. Acad. Sci. USA 2000, 97, 1056–1061. [Google Scholar] [CrossRef] [PubMed]
- Okabe, H.; Ishimoto, T.; Mima, K.; Nakagawa, S.; Hayashi, H.; Kuroki, H.; Imai, K.; Nitta, H.; Saito, S.; Hashimoto, D.; et al. CD44s signals the acquisition of the mesenchymal phenotype required for anchorage-independent cell survival in hepatocellular carcinoma. Br. J. Cancer 2014, 110, 958–966. [Google Scholar] [CrossRef] [PubMed]
- Mima, K.; Okabe, H.; Ishimoto, T.; Hayashi, H.; Nakagawa, S.; Kuroki, H.; Watanabe, M.; Beppu, T.; Tamada, M.; Nagano, O.; et al. CD44s regulates the TGF-beta-mediated mesenchymal phenotype and is associated with poor prognosis in patients with hepatocellular carcinoma. Cancer Res. 2012, 72, 3414–3423. [Google Scholar] [CrossRef]
- Harada, K.; Ohashi, R.; Naito, K.; Kanki, K. Hedgehog Signal Inhibitor GANT61 Inhibits the Malignant Behavior of Undifferentiated Hepatocellular Carcinoma Cells by Targeting Non-Canonical GLI Signaling. Int. J. Mol. Sci. 2020, 21, 3126. [Google Scholar] [CrossRef]
- Freese, K.; Seitz, T.; Dietrich, P.; Lee, S.M.L.; Thasler, W.E.; Bosserhoff, A.; Hellerbrand, C. Histone Deacetylase Expressions in Hepatocellular Carcinoma and Functional Effects of Histone Deacetylase Inhibitors on Liver Cancer Cells In Vitro. Cancers 2019, 11, 1587. [Google Scholar] [CrossRef]
- Hu, Y.; Sun, L.; Tao, S.; Dai, M.; Wang, Y.; Li, Y.; Wu, J. Clinical significance of HDAC9 in hepatocellular carcinoma. Cell. Mol. Biol. 2019, 65, 23–28. [Google Scholar] [CrossRef]
- Hao, Y.; Baker, D.; Ten Dijke, P. TGF-β-Mediated Epithelial-Mesenchymal Transition and Cancer Metastasis. Int. J. Mol. Sci. 2019, 20, 2767. [Google Scholar] [CrossRef]
- Li, H.; Li, X.; Lin, H.; Gong, J. High HDAC9 is associated with poor prognosis and promotes malignant progression in pancreatic ductal adenocarcinoma. Mol. Med. Rep. 2020, 21, 822–832. [Google Scholar] [CrossRef]
- Xu, L.; Li, W.; Shi, Q.; Wang, M.; Li, H.; Yang, X.; Zhang, J. MicroRNA-936 inhibits the malignant phenotype of retinoblastoma by directly targeting HDAC9 and deactivating the PI3K/AKT pathway. Oncol. Rep. 2020, 43, 635–645. [Google Scholar] [CrossRef]
- Huang, Y.; Jian, W.; Zhao, J.; Wang, G. Overexpression of HDAC9 is associated with poor prognosis and tumor progression of breast cancer in Chinese females. Onco Targets Ther. 2018, 11, 2177–2184. [Google Scholar] [CrossRef] [PubMed]
- Rastogi, B.; Kumar, A.; Raut, S.K.; Panda, N.K.; Rattan, V.; Joshi, N.; Khullar, M. Downregulation of miR-377 Promotes Oral Squamous Cell Carcinoma Growth and Migration by Targeting HDAC9. Cancer Investig. 2017, 35, 152–162. [Google Scholar] [CrossRef] [PubMed]
- Gore, J.; Craven, K.E.; Wilson, J.L.; Cote, G.A.; Cheng, M.; Nguyen, H.V.; Cramer, H.M.; Sherman, S.; Korc, M. TCGA data and patient-derived orthotopic xenografts highlight pancreatic cancer-associated angiogenesis. Oncotarget 2015, 6, 7504–7521. [Google Scholar] [CrossRef] [PubMed]
- Liang, Z.; Feng, A.; Shim, H. MicroRNA-30c-regulated HDAC9 mediates chemoresistance of breast cancer. Cancer Chemother. Pharmacol. 2020, 85, 413–423. [Google Scholar] [CrossRef] [PubMed]
- Xu, G.; Li, N.; Zhang, Y.; Zhang, J.; Xu, R.; Wu, Y. MicroRNA-383-5p inhibits the progression of gastric carcinoma via targeting HDAC9 expression. Braz. J. Med. Biol. Res. 2019, 52, e8341. [Google Scholar] [CrossRef]
- Xiong, K.; Zhang, H.; Du, Y.; Tian, J.; Ding, S. Identification of HDAC9 as a viable therapeutic target for the treatment of gastric cancer. Exp. Mol. Med. 2019, 51, 1–15. [Google Scholar] [CrossRef]
- Rodriguez-Torres, M.; Allan, A.L. Aldehyde dehydrogenase as a marker and functional mediator of metastasis in solid tumors. Clin. Exp. Metastasis 2016, 33, 97–113. [Google Scholar] [CrossRef]
- Ma, S.; Chan, K.W.; Lee, T.K.; Tang, K.H.; Wo, J.Y.; Zheng, B.J.; Guan, X.Y. Aldehyde dehydrogenase discriminates the CD133 liver cancer stem cell populations. Mol. Cancer Res. 2008, 6, 1146–1153. [Google Scholar] [CrossRef]
- Pequerul, R.; Vera, J.; Giménez-Dejoz, J.; Crespo, I.; Coines, J.; Porté, S.; Rovira, C.; Parés, X.; Farrés, J. Structural and kinetic features of aldehyde dehydrogenase 1A (ALDH1A) subfamily members, cancer stem cell markers active in retinoic acid biosynthesis. Arch. Biochem. Biophys. 2020, 681, 108256. [Google Scholar] [CrossRef]
- Puttini, S.; Plaisance, I.; Barile, L.; Cervio, E.; Milano, G.; Marcato, P.; Pedrazzini, T.; Vassalli, G. ALDH1A3 Is the Key Isoform That Contributes to Aldehyde Dehydrogenase Activity and Affects in Vitro Proliferation in Cardiac Atrial Appendage Progenitor Cells. Front. Cardiovasc. Med. 2018, 5, 90. [Google Scholar] [CrossRef]
- Croker, A.K.; Rodriguez-Torres, M.; Xia, Y.; Pardhan, S.; Leong, H.S.; Lewis, J.D.; Allan, A.L. Differential Functional Roles of ALDH1A1 and ALDH1A3 in Mediating Metastatic Behavior and Therapy Resistance of Human Breast Cancer Cells. Int. J. Mol. Sci. 2017, 18, 2039. [Google Scholar] [CrossRef] [PubMed]
- Marcato, P.; Dean, C.A.; Pan, D.; Araslanova, R.; Gillis, M.; Joshi, M.; Helyer, L.; Pan, L.; Leidal, A.; Gujar, S.; et al. Aldehyde dehydrogenase activity of breast cancer stem cells is primarily due to isoform ALDH1A3 and its expression is predictive of metastasis. Stem Cells 2011, 29, 32–45. [Google Scholar] [CrossRef] [PubMed]
- Chen, M.H.; Weng, J.J.; Cheng, C.T.; Wu, R.C.; Huang, S.C.; Wu, C.E.; Chung, Y.H.; Liu, C.Y.; Chang, M.H.; Chen, M.H.; et al. ALDH1A3, the Major Aldehyde Dehydrogenase Isoform in Human Cholangiocarcinoma Cells, Affects Prognosis and Gemcitabine Resistance in Cholangiocarcinoma Patients. Clin. Cancer Res. 2016, 22, 4225–4235. [Google Scholar] [CrossRef] [PubMed]
- Boskovic, Z.V.; Kemp, M.M.; Freedy, A.M.; Viswanathan, V.S.; Pop, M.S.; Fuller, J.H.; Martinez, N.M.; Figueroa, Lazú, S.O.; Hong, J.A.; Lewis, T.A.; et al. Inhibition of Zinc-Dependent Histone Deacetylases with a Chemically Triggered Electrophile. ACS Chem. Biol. 2016, 11, 1844–1851. [Google Scholar] [CrossRef]
- Zhao, D.; Mo, Y.; Li, M.T.; Zou, S.W.; Cheng, Z.L.; Sun, Y.P.; Xiong, Y.; Guan, K.L.; Lei, Q.Y. NOTCH-induced aldehyde dehydrogenase 1A1 deacetylation promotes breast cancer stem cells. J. Clin. Investig. 2014, 124, 5453–5465. [Google Scholar] [CrossRef]
- Sullivan, J.P.; Spinola, M.; Dodge, M.; Raso, M.G.; Behrens, C.; Gao, B.; Schuster, K.; Shao, C.; Larsen, J.E.; Sullivan, L.A.; et al. Aldehyde dehydrogenase activity selects for lung adenocarcinoma stem cells dependent on notch signaling. Cancer Res. 2010, 70, 9937–9948. [Google Scholar] [CrossRef] [PubMed]
- Petrie, K.; Guidez, F.; Howell, L.; Healy, L.; Waxman, S.; Greaves, M.; Zelent, A. The histone deacetylase 9 gene encodes multiple protein isoforms. J. Biol. Chem. 2003, 278, 16059–16072. [Google Scholar] [CrossRef]
- Azuma, K.; Urano, T.; Horie-Inoue, K.; Hayashi, S.; Sakai, R.; Ouchi, Y.; Inoue, S. Association of estrogen receptor alpha and histone deacetylase 6 causes rapid deacetylation of tubulin in breast cancer cells. Cancer Res. 2009, 69, 2935–2940. [Google Scholar] [CrossRef]
- Yuan, Z.; Peng, L.; Radhakrishnan, R.; Seto, E. Histone deacetylase 9 (HDAC9) regulates the functions of the ATDC (TRIM29) protein. J. Biol. Chem. 2010, 285, 39329–39338. [Google Scholar] [CrossRef]
- Chen, S.; Yin, C.; Lao, T.; Liang, D.; He, D.; Wang, C.; Sang, N. AMPK-HDAC5 pathway facilitates nuclear accumulation of HIF-1α and functional activation of HIF-1 by deacetylating Hsp70 in the cytosol. Cell Cycle 2015, 14, 2520–2536. [Google Scholar] [CrossRef]


| Correlated Gene | Positive or Negative | Spearman’s Correlation | p-Value 1 |
|---|---|---|---|
| Mesenchymal markers | |||
| VIM | positive | 0.616 | 2.35 × 10−40 |
| SNAI1 | positive | 0.473 | 3.82 × 10⁻²² |
| TWIST1 | positive | 0.452 | 3.42 × 10⁻²⁰ |
| ZEB1 | positive | 0.318 | 3.21 × 10⁻¹⁰ |
| ZEB2 | positive | 0.727 | 1.34 × 10−62 |
| Stemness markers | |||
| CD44 | positive | 0.417 | 4.03 × 10⁻¹⁷ |
| ALDH1L2 | positive | 0.624 | 1.42 × 10−41 |
| ALDH1A3 | positive | 0.424 | 1.04 × 10⁻¹⁷ |
| KRT19 | positive | 0.411 | 1.14 × 10⁻¹⁶ |
| Proliferation marker | |||
| CCND2 | positive | 0.634 | 2.41 × 10−43 |
| Hepatic markers | |||
| HNF1A | negative | −0.421 | 1.93 × 10⁻¹⁷ |
| HNF4A | negative | −0.299 | 3.88 × 10⁻⁹ |
| FOXA2 | negative | −0.38 | 2.84 × 10⁻¹⁴ |
© 2020 by the authors. Licensee MDPI, Basel, Switzerland. This article is an open access article distributed under the terms and conditions of the Creative Commons Attribution (CC BY) license (http://creativecommons.org/licenses/by/4.0/).
Share and Cite
Kanki, K.; Watanabe, R.; Nguyen Thai, L.; Zhao, C.-H.; Naito, K. HDAC9 Is Preferentially Expressed in Dedifferentiated Hepatocellular Carcinoma Cells and Is Involved in an Anchorage-Independent Growth. Cancers 2020, 12, 2734. https://doi.org/10.3390/cancers12102734
Kanki K, Watanabe R, Nguyen Thai L, Zhao C-H, Naito K. HDAC9 Is Preferentially Expressed in Dedifferentiated Hepatocellular Carcinoma Cells and Is Involved in an Anchorage-Independent Growth. Cancers. 2020; 12(10):2734. https://doi.org/10.3390/cancers12102734
Chicago/Turabian StyleKanki, Keita, Ryota Watanabe, Le Nguyen Thai, Chun-Hao Zhao, and Kyoko Naito. 2020. "HDAC9 Is Preferentially Expressed in Dedifferentiated Hepatocellular Carcinoma Cells and Is Involved in an Anchorage-Independent Growth" Cancers 12, no. 10: 2734. https://doi.org/10.3390/cancers12102734
APA StyleKanki, K., Watanabe, R., Nguyen Thai, L., Zhao, C.-H., & Naito, K. (2020). HDAC9 Is Preferentially Expressed in Dedifferentiated Hepatocellular Carcinoma Cells and Is Involved in an Anchorage-Independent Growth. Cancers, 12(10), 2734. https://doi.org/10.3390/cancers12102734