Inflammation Associated Pancreatic Tumorigenesis: Upregulation of Succinate Dehydrogenase (Subunit B) Reduces Cell Growth of Pancreatic Ductal Epithelial Cells

 ,
,  and
and 
Abstract
1. Introduction
2. Results
2.1. Elevated SDHB Expression in Ducts of Chronically Inflamed Pancreata
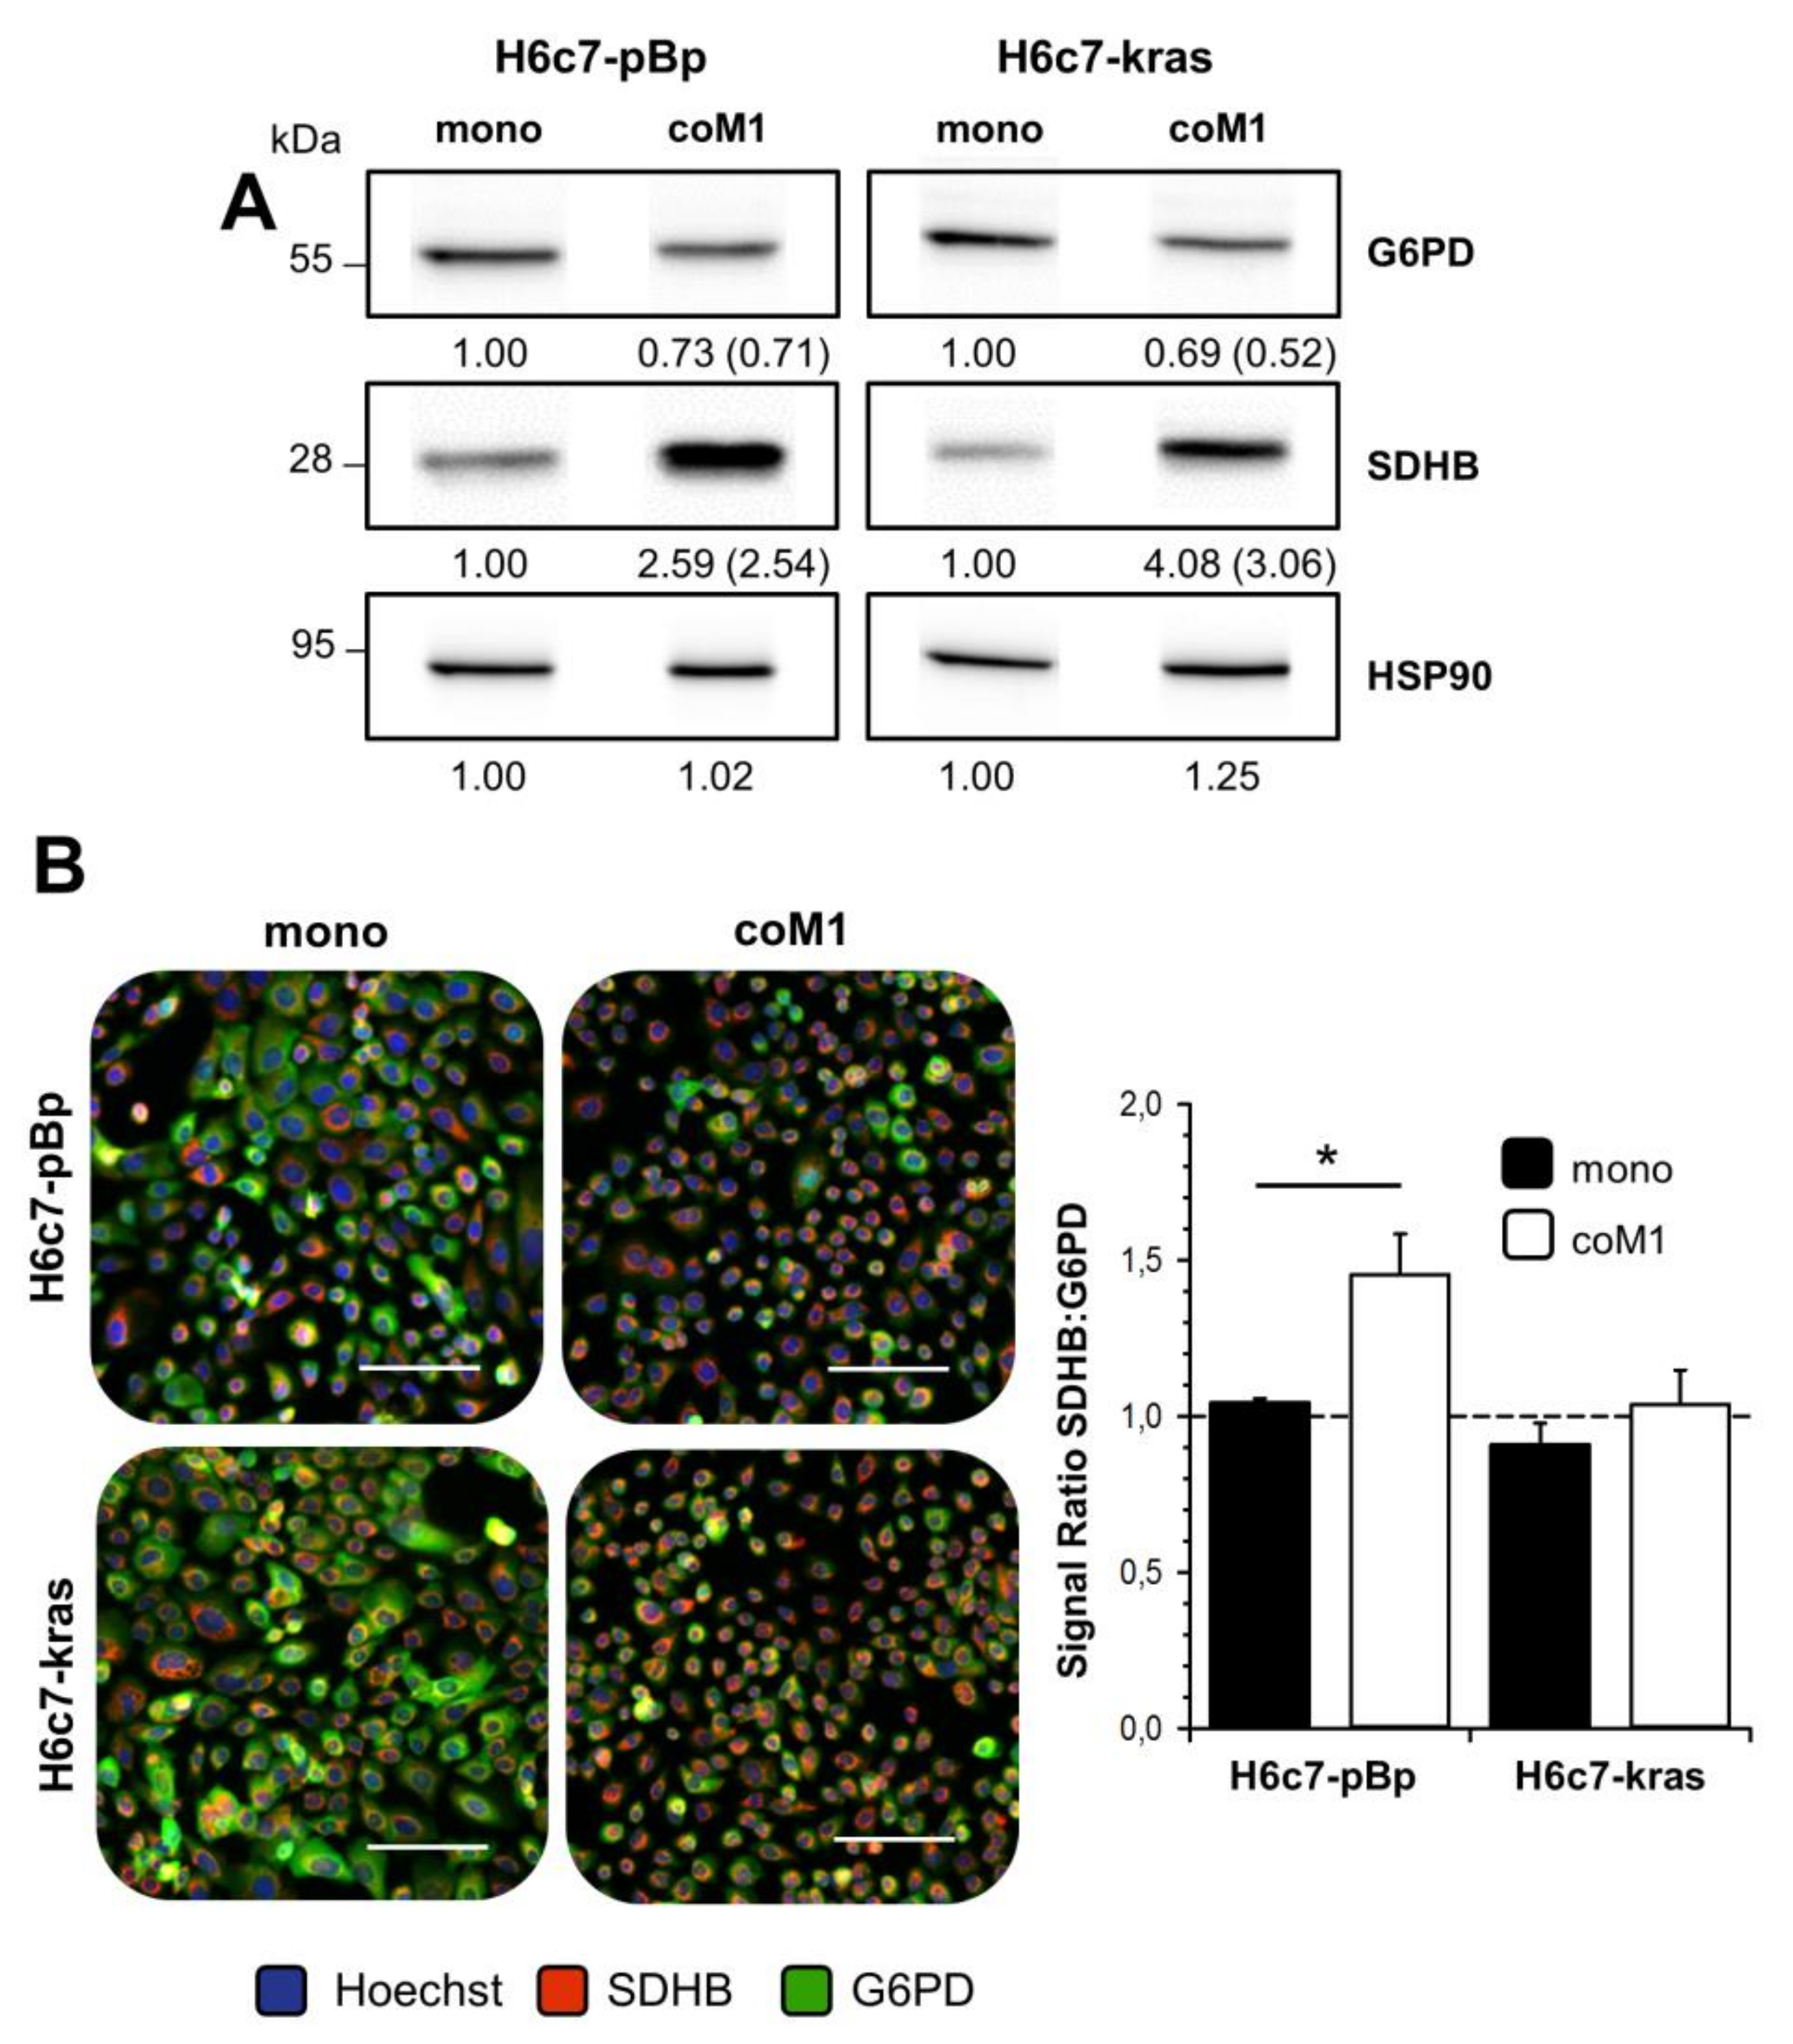
2.2. Co-culture with M1-macrophages Increases SDHB Expression in H6c7-pBp and H6c7-kras Cells
2.3. siRNA Mediated Downregulation of SDHB Expression Diminishes SDH Activity in H6c7-pBp and H6c7-kras cells after Mono- and Co-culture with M1-macrophages
2.4. Impact of Paracrine Interaction with M1-macrophages and SDHB Knockdown on Uptake of Glucose and Lactate in H6c7-pBp and H6c7-kras Cells
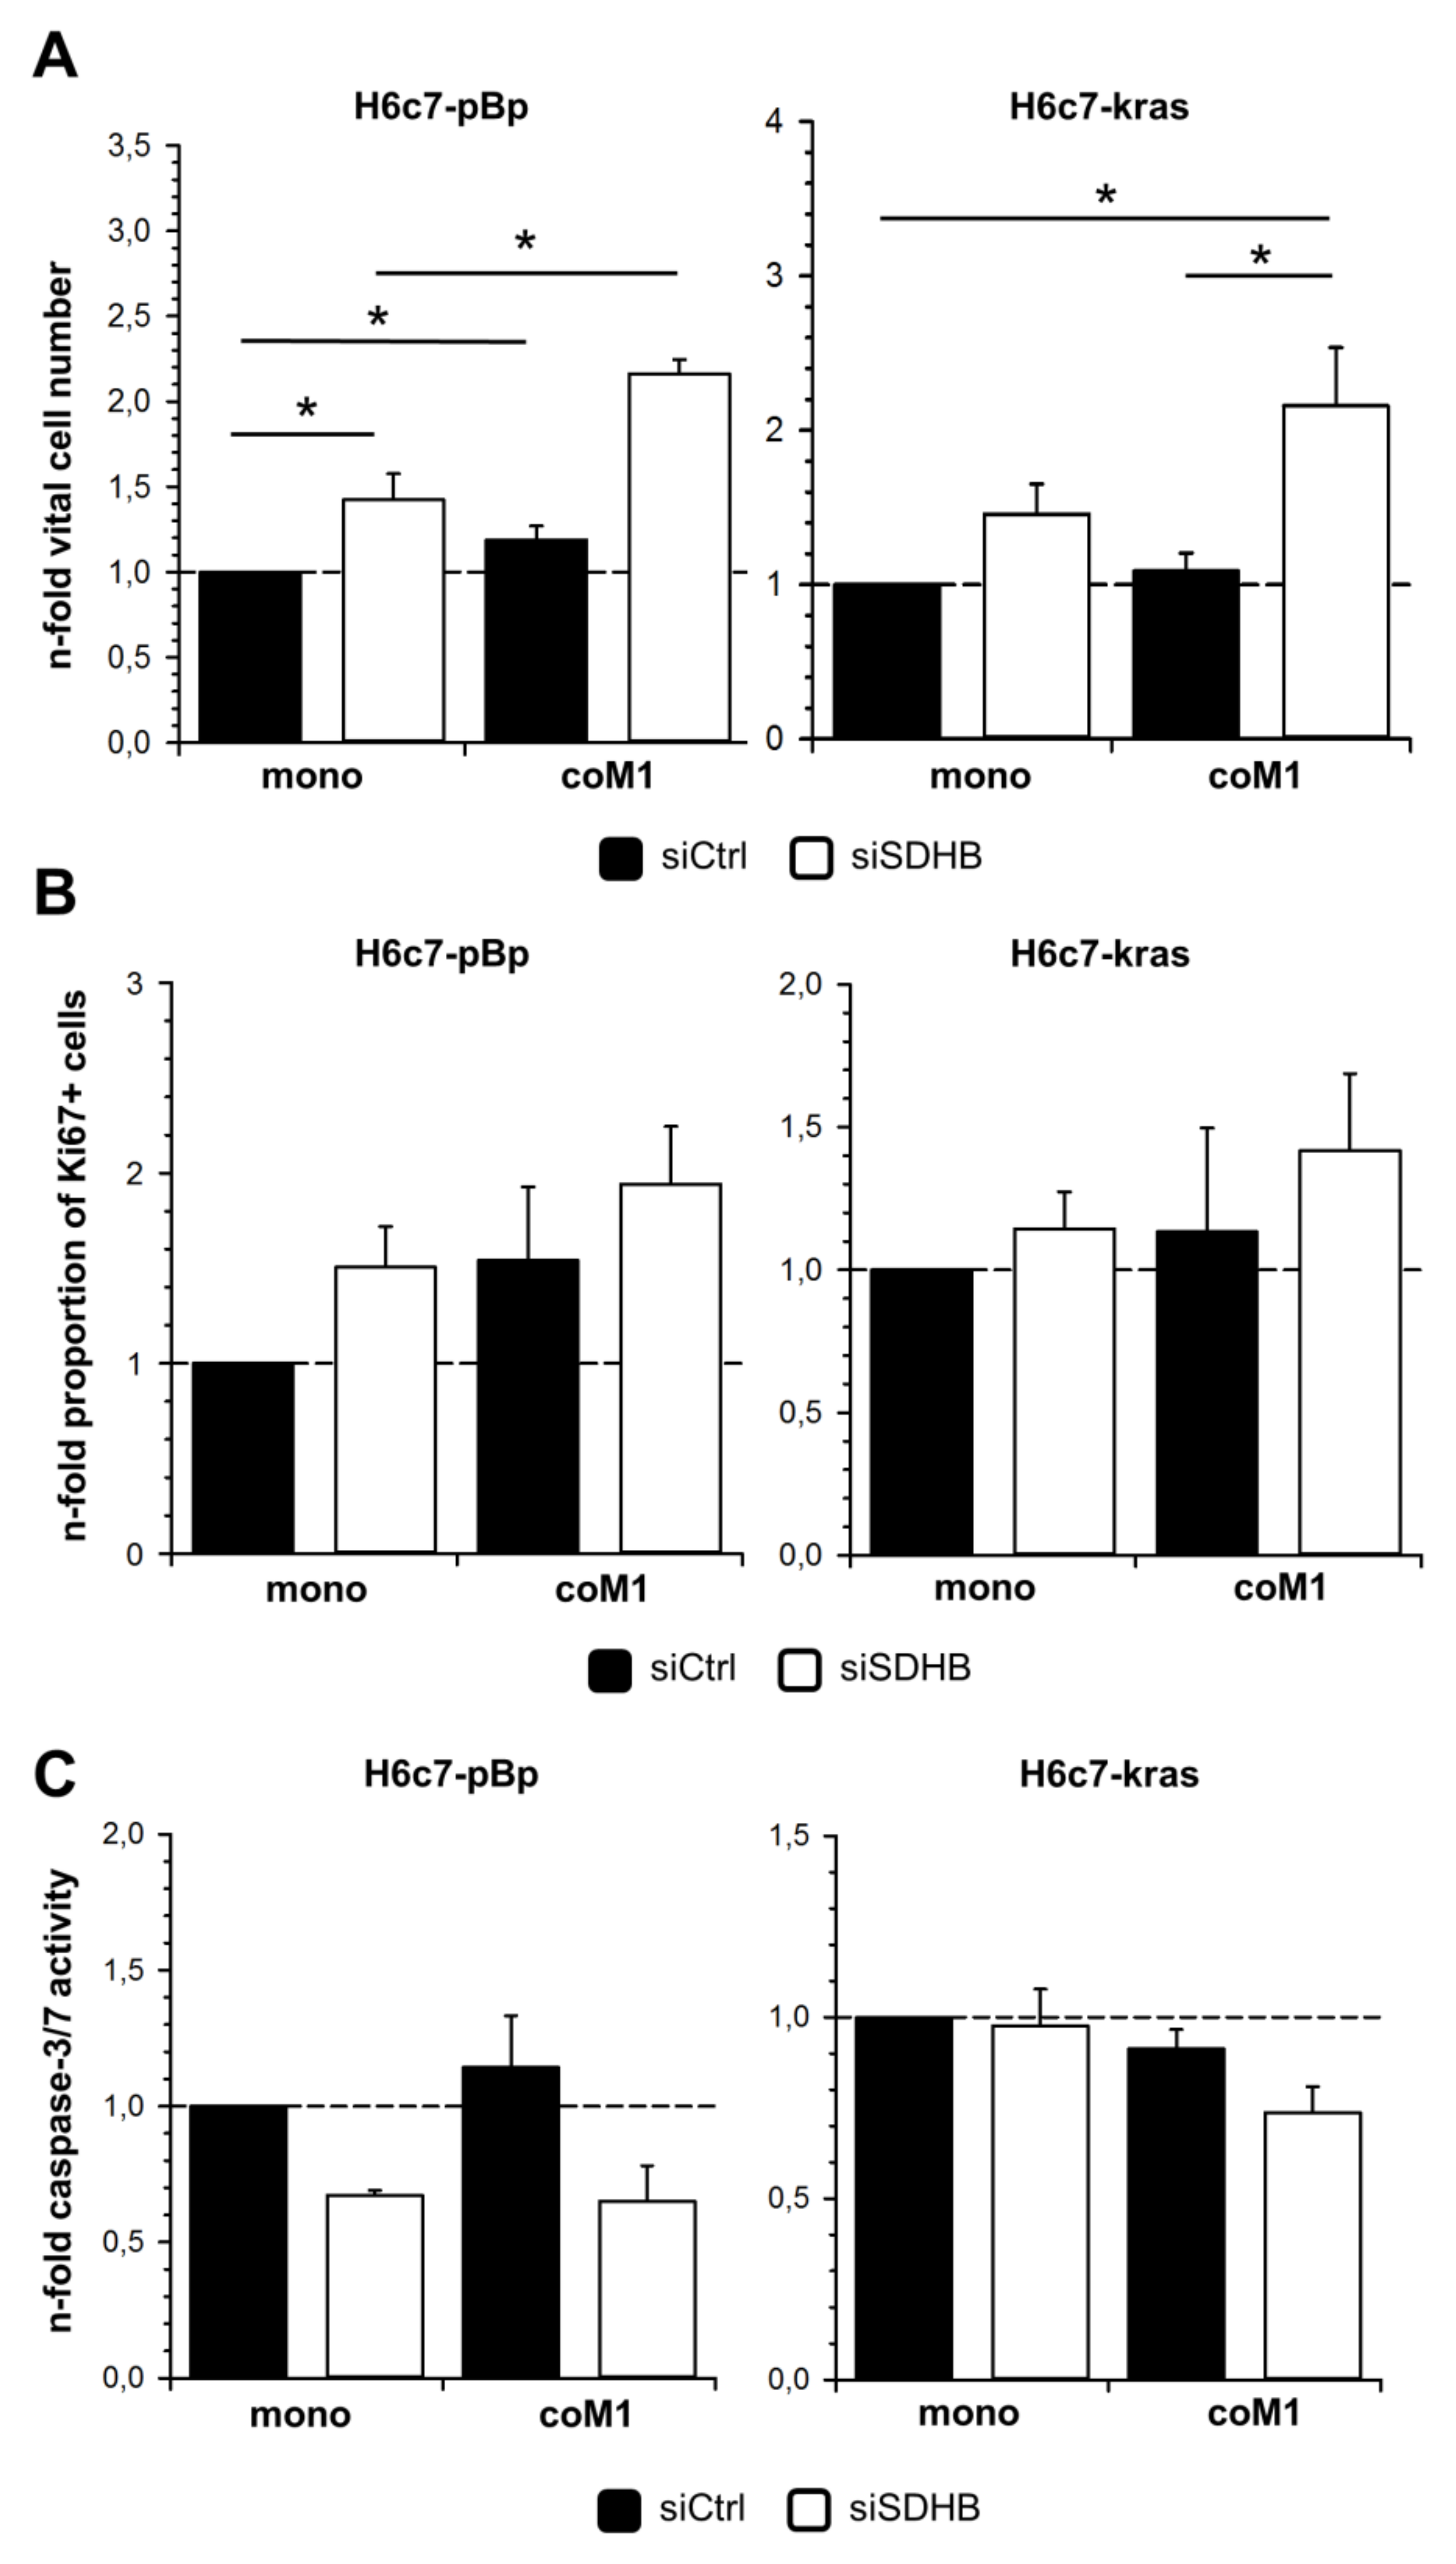
2.5. Elevated Cell Growth of H6c7-pBp and H6c7-kras Cells in the Presence of M1-macrophages is Further Enhanced by Downregulation of SDHB Expression
3. Discussion
4. Materials and Methods
4.1. Immunohistochemical Staining of SDHB in Human Pancreatic Tissues
4.2. Pancreatic Ductal Epithelial Cell Lines
4.3. Isolation and Generation of Pro-inflammatory M1-like Polarized Macrophages
4.4. Indirect Co-cultures of PDECs and M1-macrophages
4.5. siRNA-mediated Knockdown of SDHB Expression
4.6. Immunofluorescence Staining of SDHB and Ki67
4.7. Western Blotting
4.8. Determination of vital cell numbers
4.9. Measurement of Caspase-3/7 Activity
4.10. Glucose Uptake Assay
4.11. Lactate uptake assay
4.12. Determination of Succinate Dehydrogenase Activity
4.13. Seahorse Analysis
4.14. Statistical Analysis
5. Conclusions
Author Contributions
Funding
Acknowledgments
Conflicts of Interest
Abbreviations
| 2-NBDG | 2-(N-(7-Nitrobenz-2-oxa-1.3-diazol-4-yl)-Amino)-2-Deoxyglucose |
| CP | Chronic pancreatitis |
| EMT | Epithelial-Mesenchymal-Transition |
| G6PD | Glucose-6-phosphate dehydrogenase |
| GM-CSF | Granulocyte macrophage-colony stimulating factor |
| HIF-1 | Hypoxia-inducible factor-1 |
| LDHA/B | Lactate dehydrogenase subunit A/B |
| OXPHOS | Oxidative phosphorylation |
| PanIN | Pancreatic intraepithelial neoplasia |
| PDAC | Pancreatic ductal adenocarcinoma |
| PDECs | Pancreatic ductal epithelial cells |
| PPP | Pentose phosphate pathway |
| ROS | Reactive oxygen species |
| SDH | Succinate dehydrogenase |
| SDHA/B | Succinate dehydrogenase subunit A/B |
| TCA | Tricarboxylic acid |
| TNF-α | Tumor Necrosis Factor-alpha |
Appendix A

References
- Siegel, R.L.; Miller, K.D.; Jemal, A. Cancer statistics, 2019. CA Cancer J. Clin. 2019, 69, 7–34. [Google Scholar] [CrossRef]
- Becker, A.E.; Hernandez, Y.G.; Frucht, H.; Lucas, A.L. Pancreatic ductal adenocarcinoma: Risk factors, screening, and early detection. World J. Gastroenterol. 2014, 20, 11182. [Google Scholar] [CrossRef]
- Hezel, A.F.; Kimmelman, A.C.; Stanger, B.Z.; Bardeesy, N.; Depinho, R.A. Genetics and biology of pancreatic ductal adenocarcinoma. Genes Dev. 2006, 1, 1218–1249. [Google Scholar] [CrossRef]
- Schneider, G.; Siveke, J.T.; Eckel, F.; Schmid, R.M.; Isikdogan, A.; Demirkazik, A.; Onur, H.; Cay, F.; Buyukcelik, A.; Yalcin, B.; et al. Pancreatic Cancer: Basic and Clinical Aspects. Gastroenterology 2005, 128, 1606–1625. [Google Scholar] [CrossRef]
- Raimondi, S.; Lowenfels, A.B.; Morselli-Labate, A.M.; Maisonneuve, P.; Pezzilli, R. Pancreatic cancer in chronic pancreatitis; Aetiology, incidence, and early detection. Best Pract. Res. Clin. Gastroenterol. 2010, 24, 349–358. [Google Scholar] [CrossRef] [PubMed]
- Iodice, S.; Gandini, S.; Maisonneuve, P.; Lowenfels, A.B. Tobacco and the risk of pancreatic cancer: A review and meta-analysis. Langenbecks Arch. Surg. 2008, 393, 535–545. [Google Scholar] [CrossRef] [PubMed]
- Pinho, A.V.; Chantrill, L.; Rooman, I. Chronic pancreatitis: A path to pancreatic cancer. Cancer Lett. 2014, 345, 203–209. [Google Scholar] [CrossRef] [PubMed]
- Farrow, B.; Evers, B.M. Inflammation and the development of pancreatic cancer. Surg. Oncol. 2002, 10, 153–169. [Google Scholar] [CrossRef]
- Lüttges, J.; Klöppel, G. Pancreatic ductal adenocarcinoma and its precursors. Pathologe 2005, 26, 12–17. [Google Scholar] [CrossRef]
- Kleeff, J.; Beckhove, P.; Esposito, I.; Herzig, S.; Huber, P.E.; Löhr, J.M.; Friess, H. Pancreatic cancer microenvironment. Int. J. Cancer 2007, 121, 699–705. [Google Scholar] [CrossRef]
- Murray, P.J.; Allen, J.E.; Biswas, S.K.; Fisher, E.A.; Gilroy, D.W.; Goerdt, S.; Gordon, S.; Hamilton, J.A.; Ivashkiv, L.B.; Lawrence, T.; et al. Macrophage Activation and Polarization: Nomenclature and Experimental Guidelines. Immunity 2014, 41, 14–20. [Google Scholar] [CrossRef] [PubMed]
- Ambarus, C.A.; Krausz, S.; van Eijk, M.; Hamann, J.; Radstake, T.R.D.J.; Reedquist, K.A.; Tak, P.P.; Baeten, D.L.P. Systematic validation of specific phenotypic markers for in vitro polarized human macrophages. J. Immunol. Methods 2012, 375, 196–206. [Google Scholar] [CrossRef] [PubMed]
- Helm, O.; Held-Feindt, J.; Grage-Griebenow, E.; Reiling, N.; Ungefroren, H.; Vogel, I.; Krüger, U.; Becker, T.; Ebsen, M.; Röcken, C.; et al. Tumor-associated macrophages exhibit pro- and anti-inflammatory properties by which they impact on pancreatic tumorigenesis. Int. J. Cancer 2014, 135, 843–861. [Google Scholar] [CrossRef] [PubMed]
- Helm, O.; Mennrich, R.; Petrick, D.; Goebel, L.; Freitag-Wolf, S.; Röder, C.; Kalthoff, H.; Röcken, C.; Sipos, B.; Kabelitz, D.; et al. Comparative characterization of stroma cells and ductal epithelium in chronic pancreatitis and pancreatic ductal adenocarcinoma. PLoS ONE 2014, 9, e94357. [Google Scholar] [CrossRef]
- Mantovani, A.; Sozzani, S.; Locati, M.; Allavena, P.; Sica, A. Macrophage polarization: Tumor-associated macrophages as a paradigm for polarized M2 mononuclear phagocytes. Trends Immunol. 2002, 23, 549–555. [Google Scholar] [CrossRef]
- Xiang, J.; Liu, L.; Wang, W.; Xu, H.; Wu, C.; Xu, J.; Liu, C.; Long, J.; Ni, Q.; Yu, X. Metabolic tumor burden: A new promising way to reach precise personalized therapy in PDAC. Cancer Lett. 2015, 359, 165–168. [Google Scholar] [CrossRef]
- Cohen, R.; Neuzillet, C.; Tijeras-Raballand, A.; Faivre, S.; de Gramont, A.; Raymond, E. Targeting cancer cell metabolism in pancreatic adenocarcinoma. Oncotarget 2015, 6, 16832. [Google Scholar] [CrossRef]
- Hanahan, D.; Weinberg, R.A. Hallmarks of cancer: The next generation. Cell 2011, 144, 646–674. [Google Scholar] [CrossRef]
- Hay, N. Reprogramming glucose metabolism in cancer: Can it be exploited for cancer therapy? Nat. Rev. Cancer 2016, 16, 635. [Google Scholar] [CrossRef]
- Warburg, O. On the origin of cancer cells. Science 1956, 123, 309–314. [Google Scholar] [CrossRef]
- Lucarelli, G.; Galleggiante, V.; Rutigliano, M.; Sanguedolce, F.; Cagiano, S.; Bufo, P.; Lastilla, G.; Maiorano, E.; Ribatti, D.; Giglio, A.; et al. Metabolomic profile of glycolysis and the pentose phosphate pathway identifies the central role of glucose-6-phosphate dehydrogenase in clear cell-renal cell carcinoma. Oncotarget 2015, 6, 13371. [Google Scholar] [CrossRef] [PubMed]
- Koppenol, W.H.; Bounds, P.L.; Dang, C.V. Otto Warburg’s contributions to current concepts of cancer metabolism. Nat. Rev. Cancer 2011, 11, 325. [Google Scholar] [CrossRef] [PubMed]
- Whitaker-Menezes, D.; Martinez-Outschoorn, U.E.; Lin, Z.; Ertel, A.; Flomenberg, N.; Witkiewicz, A.K.; Birbe, R.C.; Howell, A.; Pavlides, S.; Gandara, R.; et al. Evidence for a stromal-epithelial “lactate shuttle” in human tumors: MCT4 is a marker of oxidative stress in cancer-associated fibroblasts. Cell Cycle 2011, 10, 1772–1783. [Google Scholar] [CrossRef] [PubMed]
- Guido, C.; Whitaker-Menezes, D.; Capparelli, C.; Balliet, R.; Lin, Z.; Pestell, R.G.; Howell, A.; Aquila, S.; Ando, S.; Martinez-Outschoorn, U.; et al. Metabolic reprogramming of cancer-associated fibroblasts by TGF-β drives tumor growth: Connecting TGF-β signaling with “Warburg-like” cancer metabolism and L-lactate production. Cell Cycle 2012, 11, 3019–3035. [Google Scholar] [CrossRef] [PubMed]
- Carmona-Fontaine, C.; Bucci, V.; Akkari, L.; Deforet, M.; Joyce, J.A.; Xavier, J.B. Emergence of spatial structure in the tumor microenvironment due to the Warburg effect. Proc. Natl. Acad. Sci. USA 2013, 110, 19402–19407. [Google Scholar] [CrossRef]
- Valencia, T.; Kim, J.Y.; Abu-Baker, S.; Moscat-Pardos, J.; Ahn, C.S.; Reina-Campos, M.; Duran, A.; Castilla, E.A.; Metallo, C.M.; Diaz-Meco, M.T.; et al. Metabolic Reprogramming of Stromal Fibroblasts through p62-mTORC1 Signaling Promotes Inflammation and Tumorigenesis. Cancer Cell 2014, 26, 121–135. [Google Scholar] [CrossRef]
- Robertson-Tessi, M.; Gillies, R.J.; Gatenby, R.A.; Anderson, A.R.A. Impact of metabolic heterogeneity on tumor growth, invasion, and treatment outcomes. Cancer Res. 2015, 75, 1567–1579. [Google Scholar] [CrossRef]
- Diehl, K.; Dinges, L.A.; Helm, O.; Ammar, N.; Plundrich, D.; Arlt, A.; Röcken, C.; Sebens, S.; Schäfer, H. Nuclear factor E2-related factor-2 has a differential impact on MCT1 and MCT4 lactate carrier expression in colonic epithelial cells: A condition favoring metabolic symbiosis between colorectal cancer and stromal cells. Oncogene 2018, 37, 39. [Google Scholar] [CrossRef]
- Bardella, C.; Pollard, P.J.; Tomlinson, I. SDH mutations in cancer. Biochim. Biophys. Acta Bioenerg. 2011, 1807, 1432–1443. [Google Scholar] [CrossRef]
- King, A.; Selak, M.A.; Gottlieb, E. Succinate dehydrogenase and fumarate hydratase: Linking mitochondrial dysfunction and cancer. Oncogene 2006, 25, 4675. [Google Scholar] [CrossRef]
- Gill, A.J.; Toon, C.W.; Clarkson, A.; Sioson, L.; Chou, A.; Winship, I.; Robinson, B.G.; Benn, D.E.; Clifton-Bligh, R.J.; Dwight, T. Succinate dehydrogenase deficiency is rare in pituitary adenomas. Am. J. Surg. Pathol. 2014, 38, 560. [Google Scholar] [CrossRef] [PubMed]
- Yang, C.; Matro, J.C.; Huntoon, K.M.; Ye, D.Y.; Huynh, T.T.; Fliedner, S.M.J.; Breza, J.; Zhuang, Z.; Pacak, K. Missense mutations in the human SDHB gene increase protein degradation without altering intrinsic enzymatic function. FASEB J. 2012, 26, 4506–4516. [Google Scholar] [CrossRef] [PubMed]
- Guillaumond, F.; Iovanna, J.L.; Vasseur, S. Pancreatic tumor cell metabolism: Focus on glycolysis and its connected metabolic pathways. Arch. Biochem. Biophys. 2014, 545, 69–73. [Google Scholar] [CrossRef] [PubMed]
- Nielsen, M.F.B.; Mortensen, M.B.; Detlefsen, S. Key players in pancreatic cancer-stroma interaction: Cancer-associated fibroblasts, endothelial and inflammatory cells. World J. Gastroenterol. 2016, 22, 2678. [Google Scholar] [CrossRef]
- Guzy, R.D.; Sharma, B.; Bell, E.; Chandel, N.S.; Schumacker, P.T. Loss of the SdhB, but Not the SdhA, Subunit of Complex II Triggers Reactive Oxygen Species-Dependent Hypoxia-Inducible Factor Activation and Tumorigenesis. Mol. Cell. Biol. 2008, 28, 718–731. [Google Scholar] [CrossRef]
- Gottlieb, E.; Tomlinson, I.P.M. Mitochondrial tumour suppressors: A genetic and biochemical update. Nat. Rev. Cancer 2005, 5, 857. [Google Scholar] [CrossRef]
- Xiao, Z.; Liu, S.; Ai, F.; Chen, X.; Li, X.; Liu, R.; Ren, W.; Zhang, X.; Shu, P.; Zhang, D. SDHB downregulation facilitates the proliferation and invasion of colorectal cancer through AMPK functions excluding those involved in the modulation of aerobic glycolysis. Exp. Ther. Med. 2018, 15, 864–872. [Google Scholar] [CrossRef]
- Chen, L.; Liu, T.; Zhang, S.; Zhou, J.; Wang, Y.; Di, W. Succinate dehydrogenase subunit B inhibits the AMPK-HIF-1α pathway in human ovarian cancer in vitro. J. Ovarian Res. 2014, 7, 115. [Google Scholar] [CrossRef]
- Fabian, A.; Stegner, S.; Miarka, L.; Zimmermann, J.; Lenk, L.; Rahn, S.; Buttlar, J.; Viol, F.; Knaack, H.; Esser, D.; et al. Metastasis of pancreatic cancer: An uninflamed liver micromilieu controls cell growth and cancer stem cell properties by oxidative phosphorylation in pancreatic ductal epithelial cells. Cancer Lett. 2019, 453, 95–106. [Google Scholar] [CrossRef]
- Peterkofsky, B.; Prather, W. Correlation Between the Rates of Aerobic Glycolysis and Glucose Transport, Unrelated to Neoplastic Transformation, in a Series of BALB 3T3-Derived Cell Lines. Cancer Res. 1982, 42, 1809–1816. [Google Scholar]
- Vander Heiden, M.G.; Cantley, L.C.; Thompson, C.B. Understanding the Warburg effect: The metabolic requirements of cell proliferation. Science 2009, 324, 1029–1033. [Google Scholar] [CrossRef] [PubMed]
- Pavlides, S.; Whitaker-Menezes, D.; Castello-Cros, R.; Flomenberg, N.; Witkiewicz, A.K.; Frank, P.G.; Casimiro, M.C.; Wang, C.; Fortina, P.; Addya, S.; et al. The reverse Warburg effect: Aerobic glycolysis in cancer associated fibroblasts and the tumor stroma. Cell Cycle 2009, 8, 3984–4001. [Google Scholar] [CrossRef] [PubMed]
- Xu, X.D.; Shao, S.X.; Jiang, H.P.; Cao, Y.W.; Wang, Y.H.; Yang, X.C.; Wang, Y.L.; Wang, X.S.; Niu, H.T. Warburg effect or reverse warburg effect? A review of cancer metabolism. Oncol. Res. Treat. 2015, 38, 117–122. [Google Scholar] [CrossRef] [PubMed]
- Fu, Y.; Liu, S.; Yin, S.; Niu, W.; Xiong, W.; Tan, M.; Li, G.; Zhou, M. The reverse Warburg effect is likely to be an Achilles’ heel of cancer that can be exploited for cancer therapy. Oncotarget 2017, 8, 57813. [Google Scholar] [CrossRef]
- Moreno-Sánchez, R.; Gallardo-Pérez, J.C.; Rodríguez-Enríquez, S.; Saavedra, E.; Marín-Hernández, Á. Control of the NADPH supply for oxidative stress handling in cancer cells. Free Radic. Biol. Med. 2017, 112, 149–161. [Google Scholar] [CrossRef]
- Yankovskaya, V.; Horsefield, R.; Törnroth, S.; Luna-Chavez, C.; Miyoshi, H.; Léger, C.; Byrne, B.; Cecchini, G.; Iwata, S. Architecture of succinate dehydrogenase and reactive oxygen species generation. Science 2003, 299, 700–704. [Google Scholar] [CrossRef]
- Aspuria, P.J.P.; Lunt, S.Y.; Väremo, L.; Vergnes, L.; Gozo, M.; Beach, J.A.; Salumbides, B.; Reue, K.; Wiedemeyer, W.R.; Nielsen, J.; et al. Succinate dehydrogenase inhibition leads to epithelial-mesenchymal transition and reprogrammed carbon metabolism. Cancer Metab. 2014, 2, 21. [Google Scholar] [CrossRef]
- Roszer, T. Understanding the mysterious M2 macrophage through activation markers and effector mechanisms. Mediators Inflamm. 2015, 2015, 1–16. [Google Scholar] [CrossRef]
- Schütze, S.; Wiegmann, K.; Machleidt, T.; Krönke, M. TNF-Induced Activation of NF-κB. Immunobiology 1995, 193, 193–203. [Google Scholar] [CrossRef]
- Karin, M. Nuclear factor-κB in cancer development and progression. Nature 2006, 441, 431. [Google Scholar] [CrossRef]
- Liu, X.; Kelm, R.J.; Strauch, A.R. Transforming growth factor β1-mediated activation of the smooth muscle α-actin gene in human pulmonary myofibroblasts is inhibited by tumor necrosis factor-α via Mitogen-activated protein kinase kinase 1-dependent induction of the egr-1 transcriptional repressor. Mol. Biol. Cell 2009, 20, 2174–2185. [Google Scholar] [PubMed]
- Matsumoto, S.; Uchiumi, T.; Tanamachi, H.; Saito, T.; Yagi, M.; Takazaki, S.; Kanki, T.; Kang, D. Ribonucleoprotein Y-box-binding protein-1 regulates mitochondrial oxidative phosphorylation (OXPHOS) protein expression after serum stimulation through binding to OXPHOS mRNA. Biochem. J. 2012, 443, 573–584. [Google Scholar] [CrossRef] [PubMed]
- Grimm, S. Respiratory chain complex II as general sensor for apoptosis. Biochim. Biophys. Acta Bioenerg. 2013, 1827, 565–572. [Google Scholar] [CrossRef] [PubMed]
- Balkwill, F.; Mantovani, A. Inflammation and cancer: Back to Virchow? Lancet 2001, 357, 539–545. [Google Scholar] [CrossRef]
- Eferl, R.; Wagner, E.F. AP-1: A double-edged sword in tumorigenesis. Nat. Rev. Cancer 2003, 3, 859–868. [Google Scholar] [CrossRef]
- Furukawa, T.; Duguid, W.P.; Rosenberg, L.; Viallet, J.; Galloway, D.A.; Tsao, M.S. Long-term culture and immortalization of epithelial cells from normal adult human pancreatic ducts transfected by the E6E7 gene of human papilloma virus 16. Am. J. Pathol. 1996, 148, 1763. [Google Scholar]
- Liu, N.; Furukawa, T.; Kobari, M.; Tsao, M.S. Comparative phenotypic studies of duct epithelial cell lines derived from normal human pancreas and pancreatic carcinoma. Am. J. Pathol. 1998, 153, 263–269. [Google Scholar] [CrossRef]
- Qian, J.; Niu, J.; Li, M.; Chiao, P.J.; Tsao, M.S. In vitro modeling of human pancreatic duct epithelial cell transformation defines gene expression changes induced by K-ras oncogenic activation in pancreatic carcinogenesis. Cancer Res. 2005, 65, 5045–5053. [Google Scholar] [CrossRef]
- Müerköster, S.S.; Werbing, V.; Sipos, B.; Debus, M.; Witt, M.; Gromann, M.; Leisner, D.; Koteritzsch, J.; Kappes, H.; Klopel, G.; et al. Drug-induced expression of the cellular adhesion molecule L1CAM confers anti-apoptotic protection and chemoresistance in pancreatic ductal adenocarcinoma cells. Oncogene 2007, 26, 2759–2768. [Google Scholar] [CrossRef]
- Selak, M.A.; Armour, S.M.; MacKenzie, E.D.; Boulahbel, H.; Watson, D.G.; Mansfield, K.D.; Pan, Y.; Simon, M.C.; Thompson, C.B.; Gottlieb, E. Succinate links TCA cycle dysfunction to oncogenesis by inhibiting HIF-α prolyl hydroxylase. Cancer Cell 2005, 7, 77–85. [Google Scholar] [CrossRef]
- Curry, J.M.; Tuluc, M.; Whitaker-Menezes, D.; Ames, J.A.; Anantharaman, A.; Butera, A.; Leiby, B.; Cognetti, D.; Sotgia, F.; Lisanti, M.P.; et al. Cancer metabolism, stemness and tumor recurrence: MCT1 and MCT4 are functional biomarkers of metabolic symbiosis in head and neck cancer. Cell Cycle 2013, 12, 1371–1384. [Google Scholar] [CrossRef] [PubMed]


© 2019 by the authors. Licensee MDPI, Basel, Switzerland. This article is an open access article distributed under the terms and conditions of the Creative Commons Attribution (CC BY) license (http://creativecommons.org/licenses/by/4.0/).
Share and Cite
Rahn, S.; Dänzer Barbosa, P.; Möller, J.L.; Ammar, N.; Demetrowitsch, T.; Helm, O.; Wesch, D.; Sipos, B.; Röcken, C.; Schwarz, K.; et al. Inflammation Associated Pancreatic Tumorigenesis: Upregulation of Succinate Dehydrogenase (Subunit B) Reduces Cell Growth of Pancreatic Ductal Epithelial Cells. Cancers 2020, 12, 42. https://doi.org/10.3390/cancers12010042
Rahn S, Dänzer Barbosa P, Möller JL, Ammar N, Demetrowitsch T, Helm O, Wesch D, Sipos B, Röcken C, Schwarz K, et al. Inflammation Associated Pancreatic Tumorigenesis: Upregulation of Succinate Dehydrogenase (Subunit B) Reduces Cell Growth of Pancreatic Ductal Epithelial Cells. Cancers. 2020; 12(1):42. https://doi.org/10.3390/cancers12010042
Chicago/Turabian StyleRahn, Sascha, Philippe Dänzer Barbosa, Julia Luisa Möller, Nourhane Ammar, Tobias Demetrowitsch, Ole Helm, Daniela Wesch, Bence Sipos, Christoph Röcken, Karin Schwarz, and et al. 2020. "Inflammation Associated Pancreatic Tumorigenesis: Upregulation of Succinate Dehydrogenase (Subunit B) Reduces Cell Growth of Pancreatic Ductal Epithelial Cells" Cancers 12, no. 1: 42. https://doi.org/10.3390/cancers12010042
APA StyleRahn, S., Dänzer Barbosa, P., Möller, J. L., Ammar, N., Demetrowitsch, T., Helm, O., Wesch, D., Sipos, B., Röcken, C., Schwarz, K., Schäfer, H., & Sebens, S. (2020). Inflammation Associated Pancreatic Tumorigenesis: Upregulation of Succinate Dehydrogenase (Subunit B) Reduces Cell Growth of Pancreatic Ductal Epithelial Cells. Cancers, 12(1), 42. https://doi.org/10.3390/cancers12010042