Does the Site of Origin of the Microcarcinoma with Respect to the Thyroid Surface Matter? A Multicenter Pathologic and Clinical Study for Risk Stratification

 , ,
, ,  , , , , ,
Abstract
:1. Introduction
2. Results
3. Discussion
4. Materials and Methods
4.1. Case Selection
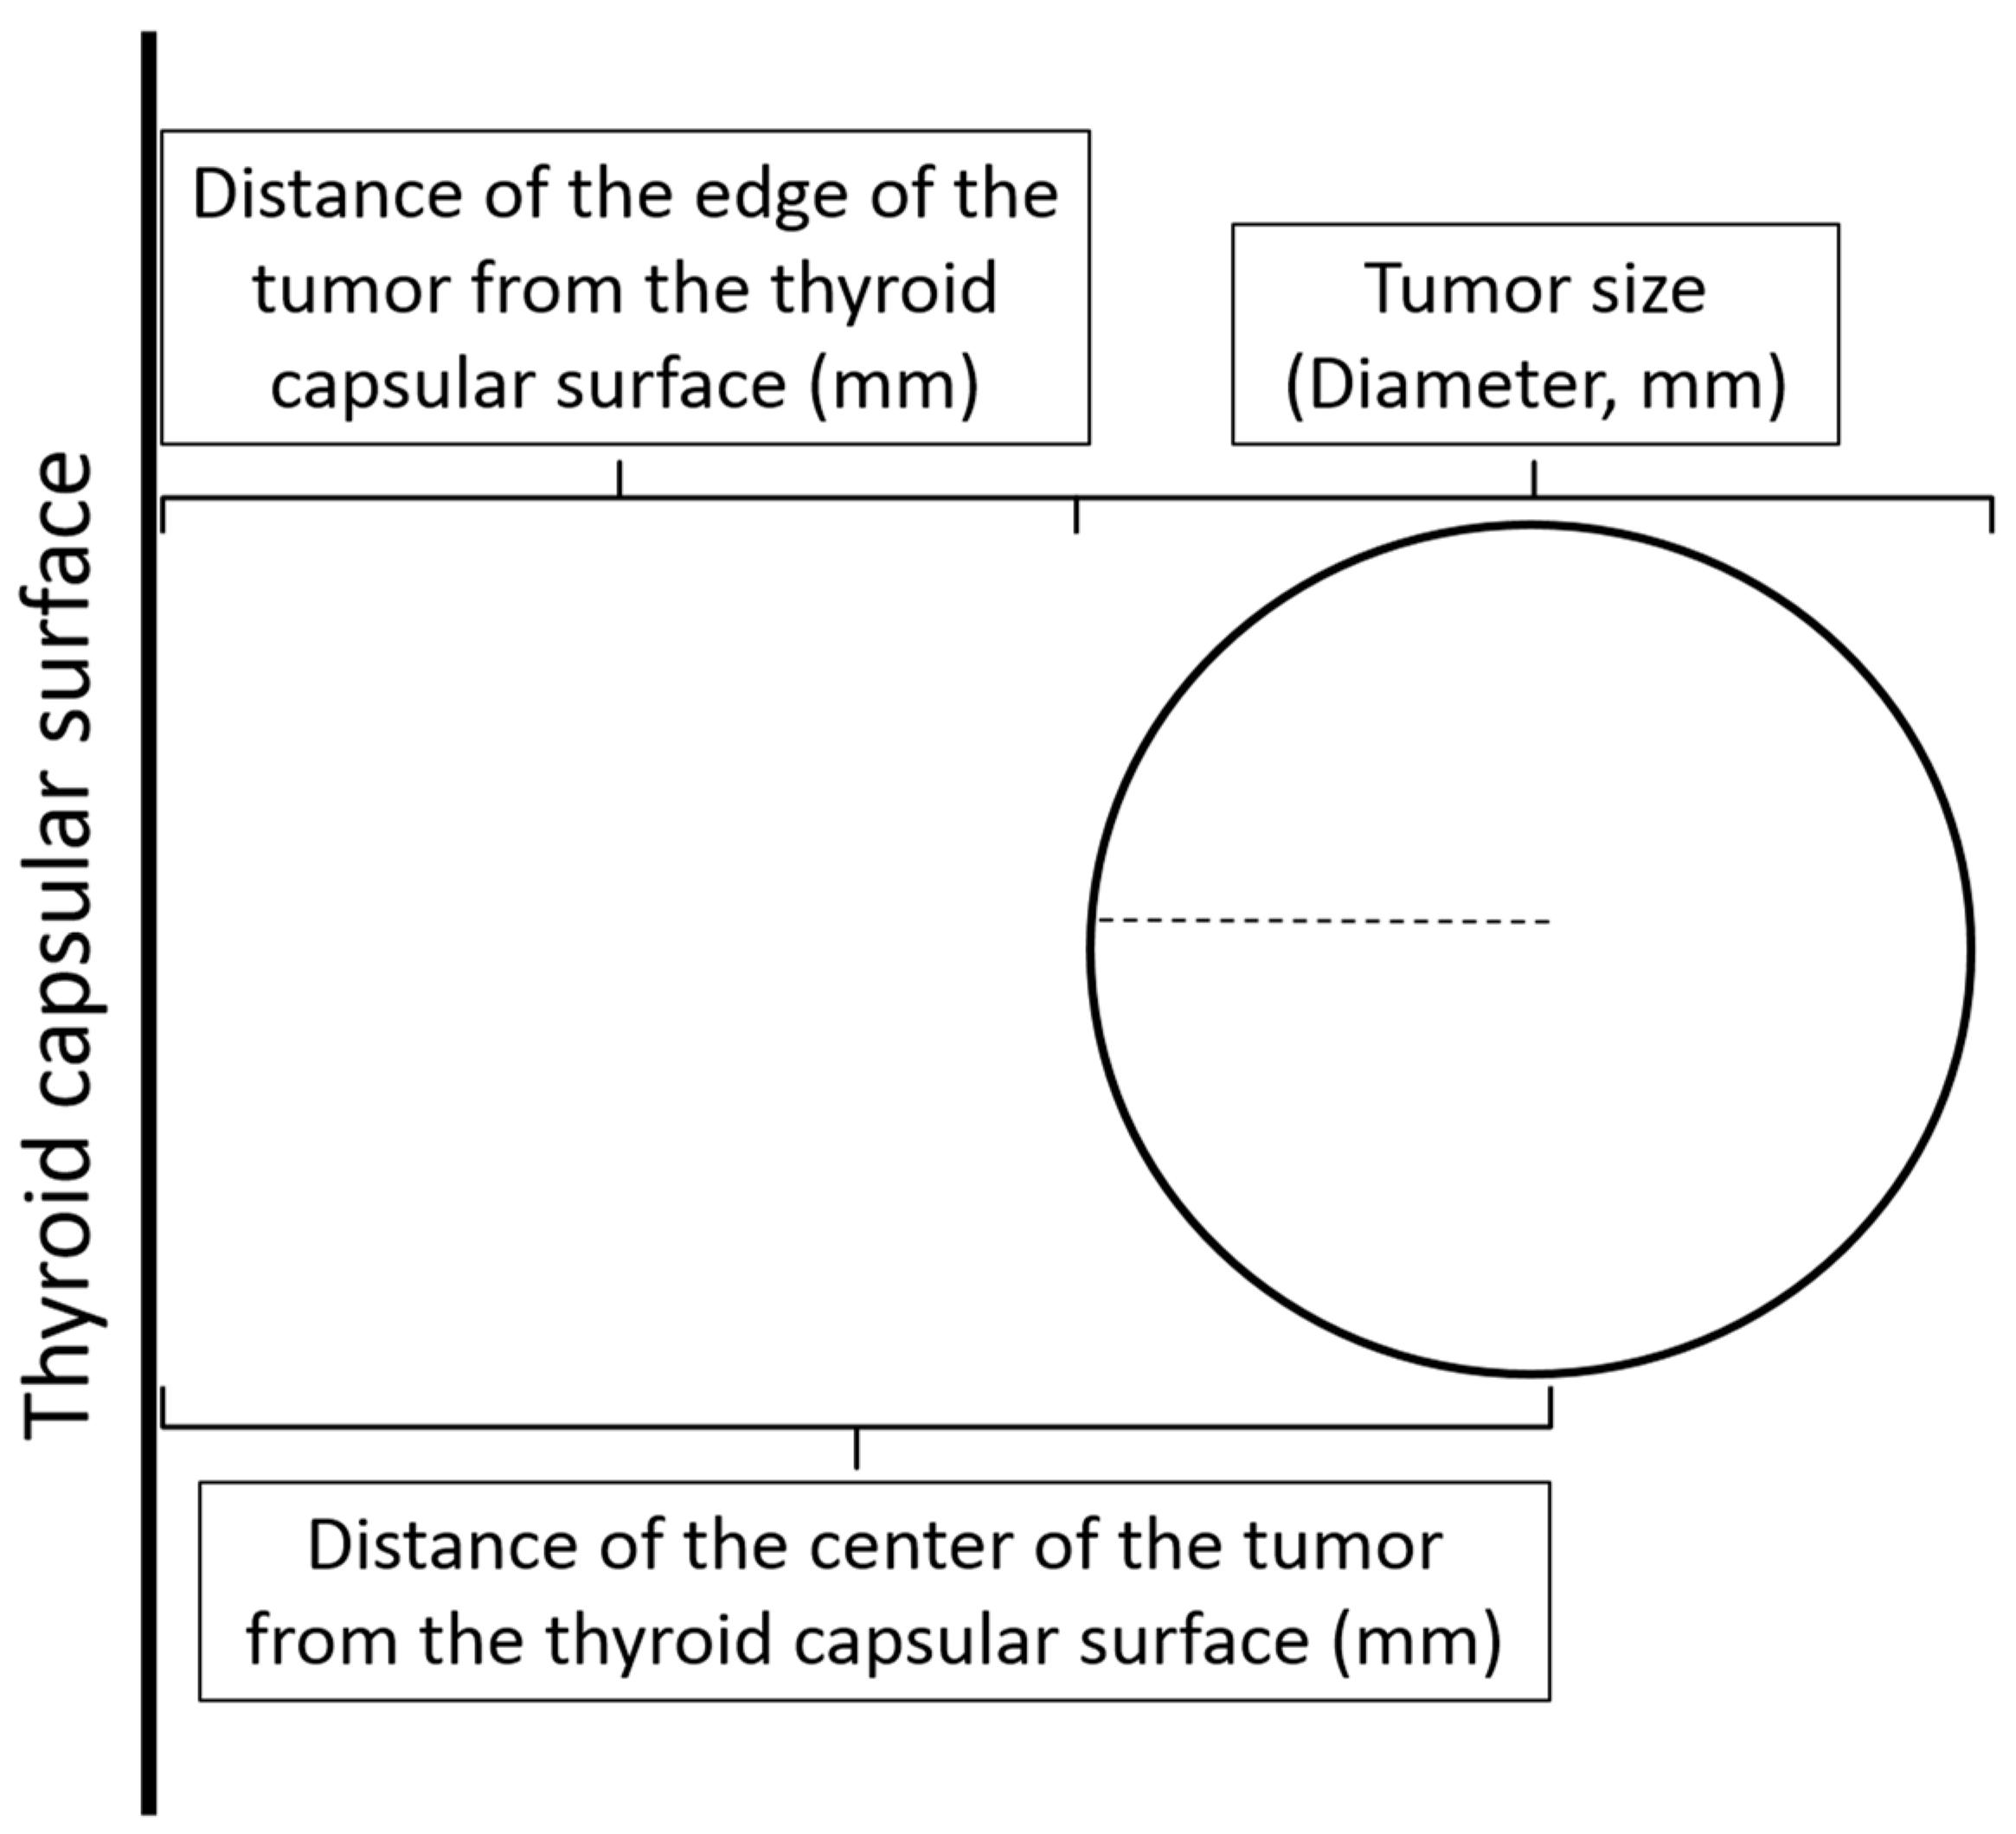
4.2. Location of the Microcarcinoma within the Thyroid
4.3. Clinical and Pathologic Data
4.3.1. Clinical Data
4.3.2. Tumor Subtype
4.3.3. Characteristics of Tumor Growth
4.3.4. Microscopic Appearance of the Tumor
4.4. Immunohistochemistry
4.5. BRAF V600E Mutation Analysis
4.6. Statistical Analysis
5. Conclusions
Supplementary Materials
Author Contributions
Funding
Acknowledgments
Conflicts of Interest
References
- Ahn, H.S.; Kim, H.J.; Welch, H.G. Korea’s thyroid-cancer “epidemic”—Screening and overdiagnosis. N. Engl. J. Med. 2014, 371, 1765–1767. [Google Scholar] [CrossRef] [PubMed]
- Davies, L.; Welch, H.G. Current thyroid cancer trends in the United States. JAMA Otolaryngol. Head Neck Surg. 2014, 140, 317–322. [Google Scholar] [CrossRef] [PubMed] [Green Version]
- Rosai, J.; LiVolsi, V.A.; Sobrinho-Simoes, M.; Williams, E.D. Renaming papillary microcarcinoma of the thyroid gland: The Porto proposal. Int. J. Surg. Pathol. 2003, 11, 249–251. [Google Scholar] [CrossRef] [PubMed]
- Nikiforov, Y.E.; Seethala, R.R.; Tallini, G.; Baloch, Z.W.; Basolo, F.; Thompson, L.D.; Barletta, J.A.; Wenig, B.M.; Al Ghuzlan, A.; Kakudo, K.; et al. Nomenclature Revision for Encapsulated Follicular Variant of Papillary Thyroid Carcinoma: A Paradigm Shift to Reduce Overtreatment of Indolent Tumors. JAMA Oncol. 2016, 2, 1023–1029. [Google Scholar] [CrossRef] [Green Version]
- Xu, B.; Farhat, N.; Barletta, J.A.; Hung, Y.P.; Biase, D.; Casadei, G.P.; Onenerk, A.M.; Tuttle, R.M.; Roman, B.R.; Katabi, N.; et al. Should subcentimeter non-invasive encapsulated, follicular variant of papillary thyroid carcinoma be included in the noninvasive follicular thyroid neoplasm with papillary-like nuclear features category? Endocrine 2018, 59, 143–150. [Google Scholar] [CrossRef]
- Rosai, J.; DeLellis, R.A.; Carcangiu, M.L.; Frabel, W.J.; Tallini, G. Tumors of the Thyroid and Parathyroid Glands; Pathology, A.R.O., Ed.; American Registry of Pathology: Silver Spring, MD, USA, 2014; Volume Fascicle 21. [Google Scholar]
- Graham, A. The malignant thyroid. Proc. Inter-State Post-Grad. MC Assem. N. Am. 1928, 3, 264–269. [Google Scholar]
- Hazard, J.B.; Crile, G.; Dempsey, W.S. Nonencapsulated sclerosing tumors of the thyroid. J. Clin. Endocrinol. Metab. 1949, 9, 1216–1231. [Google Scholar] [CrossRef]
- Klinck, G.H.; Winship, T. Occult sclerosing carcinoma of the thyroid. Cancer 1955, 8, 701–706. [Google Scholar] [CrossRef]
- Hazard, J.B. Small papillary carcinoma of the thyroid. A study with special reference to so-called nonencapsulated sclerosing tumor. Lab. Investig. 1960, 9, 86–97. [Google Scholar]
- Lamartina, L.; Durante, C.; Lucisano, G.; Grani, G.; Bellantone, R.; Lombardi, C.P.; Pontecorvi, A.; Arvat, E.; Felicetti, F.; Zatelli, M.C.; et al. Are Evidence-Based Guidelines Reflected in Clinical Practice? An Analysis of Prospectively Collected Data of the Italian Thyroid Cancer Observatory. Thyroid 2017, 27, 1490–1497. [Google Scholar] [CrossRef]
- Malandrino, P.; Pellegriti, G.; Attard, M.; Violi, M.A.; Giordano, C.; Sciacca, L.; Regalbuto, C.; Squatrito, S.; Vigneri, R. Papillary thyroid microcarcinomas: A comparative study of the characteristics and risk factors at presentation in two cancer registries. J. Clin. Endocrinol. Metab. 2013, 98, 1427–1434. [Google Scholar] [CrossRef] [PubMed] [Green Version]
- Tallini, G.; de Biase, D.; Durante, C.; Acquaviva, G.; Bisceglia, M.; Bruno, R.; Bacchi Reggiani, M.L.; Casadei, G.P.; Costante, G.; Cremonini, N.; et al. BRAF V600E and risk stratification of thyroid microcarcinoma: A multicenter pathological and clinical study. Mod. Pathol. 2015, 28, 1343–1359. [Google Scholar] [CrossRef] [PubMed] [Green Version]
- Durante, C.; Attard, M.; Torlontano, M.; Ronga, G.; Monzani, F.; Costante, G.; Ferdeghini, M.; Tumino, S.; Meringolo, D.; Bruno, R.; et al. Identification and optimal postsurgical follow-up of patients with very low-risk papillary thyroid microcarcinomas. J. Clin. Endocrinol. Metab. 2010, 95, 4882–4888. [Google Scholar] [CrossRef] [Green Version]
- Mazzaferri, E.L. Management of low-risk differentiated thyroid cancer. Endocr. Pract. 2007, 13, 498–512. [Google Scholar] [CrossRef]
- Lamartina, L.; Grani, G.; Durante, C.; Filetti, S. Recent advances in managing differentiated thyroid cancer. F1000Research 2018, 7, 86. [Google Scholar] [CrossRef] [PubMed] [Green Version]
- Brito, J.P.; Ito, Y.; Miyauchi, A.; Tuttle, R.M. A Clinical Framework to Facilitate Risk Stratification When Considering an Active Surveillance Alternative to Immediate Biopsy and Surgery in Papillary Microcarcinoma. Thyroid 2016, 26, 144–149. [Google Scholar] [CrossRef] [PubMed] [Green Version]
- Russ, G.; Bonnema, S.J.; Erdogan, M.F.; Durante, C.; Ngu, R.; Leenhardt, L. European Thyroid Association Guidelines for Ultrasound Malignancy Risk Stratification of Thyroid Nodules in Adults: The EU-TIRADS. Eur. Thyroid J. 2017, 6, 225–237. [Google Scholar] [CrossRef] [Green Version]
- Lee, W.K.; Lee, J.; Kim, H.; Lee, S.G.; Choi, S.H.; Jeong, S.; Kwon, H.J.; Jung, S.G.; Jo, Y.S. Peripheral location and infiltrative margin predict invasive features of papillary thyroid microcarcinoma. Eur. J. Endocrinol. 2019. [Google Scholar] [CrossRef]
- Pellegriti, G.; Scollo, C.; Lumera, G.; Regalbuto, C.; Vigneri, R.; Belfiore, A. Clinical behavior and outcome of papillary thyroid cancers smaller than 1.5 cm in diameter: Study of 299 cases. J. Clin. Endocrinol. Metab. 2004, 89, 3713–3720. [Google Scholar] [CrossRef] [Green Version]
- Rassael, H.; Thompson, L.D.; Heffess, C.S. A rationale for conservative management of microscopic papillary carcinoma of the thyroid gland: A clinicopathologic correlation of 90 cases. Eur. Arch. Otorhinolaryngol. 1998, 255, 462–467. [Google Scholar] [CrossRef]
- Roti, E.; degli Uberti, E.C.; Bondanelli, M.; Braverman, L.E. Thyroid papillary microcarcinoma: A descriptive and meta-analysis study. Eur. J. Endocrinol. 2008, 159, 659–673. [Google Scholar] [CrossRef] [PubMed] [Green Version]
- Frasca, F.; Nucera, C.; Pellegriti, G.; Gangemi, P.; Attard, M.; Stella, M.; Loda, M.; Vella, V.; Giordano, C.; Trimarchi, F.; et al. BRAF (V600E) mutation and the biology of papillary thyroid cancer. Endocr. Relat. Cancer 2008, 15, 191–205. [Google Scholar] [CrossRef]
- Kwak, J.Y.; Kim, E.K.; Chung, W.Y.; Moon, H.J.; Kim, M.J.; Choi, J.R. Association of BRAF V600E mutation with poor clinical prognostic factors and US features in Korean patients with papillary thyroid microcarcinoma. Radiology 2009, 253, 854–860. [Google Scholar] [CrossRef]
- Lee, X.; Gao, M.; Ji, Y.; Yu, Y.; Feng, Y.; Li, Y.; Zhang, Y.; Cheng, W.; Zhao, W. Analysis of differential BRAF (V600E) mutational status in high aggressive papillary thyroid microcarcinoma. Ann. Surg. Oncol. 2009, 16, 240–245. [Google Scholar] [CrossRef] [PubMed]
- Lin, K.L.; Wang, O.C.; Zhang, X.H.; Dai, X.X.; Hu, X.Q.; Qu, J.M. The BRAF mutation is predictive of aggressive clinicopathological characteristics in papillary thyroid microcarcinoma. Ann. Surg. Oncol. 2010, 17, 3294–3300. [Google Scholar] [CrossRef] [PubMed]
- Xing, M. BRAF mutation in papillary thyroid cancer: Pathogenic role, molecular bases, and clinical implications. Endocr. Rev. 2007, 28, 742–762. [Google Scholar] [CrossRef] [PubMed]
- de Biase, D.; Gandolfi, G.; Ragazzi, M.; Eszlinger, M.; Sancisi, V.; Gugnoni, M.; Visani, M.; Pession, A.; Casadei, G.; Durante, C.; et al. TERT Promoter Mutations in Papillary Thyroid Microcarcinomas. Thyroid 2015, 25, 1013–1019. [Google Scholar] [CrossRef]
- Niemeier, L.A.; Kuffner Akatsu, H.; Song, C.; Carty, S.E.; Hodak, S.P.; Yip, L.; Ferris, R.L.; Tseng, G.C.; Seethala, R.R.; Lebeau, S.O.; et al. A combined molecular-pathologic score improves risk stratification of thyroid papillary microcarcinoma. Cancer 2012, 118, 2069–2077. [Google Scholar] [CrossRef] [Green Version]
- Castagna, M.G.; Forleo, R.; Maino, F.; Fralassi, N.; Barbato, F.; Palmitesta, P.; Pilli, T.; Capezzone, M.; Brilli, L.; Ciuoli, C.; et al. Small papillary thyroid carcinoma with minimal extrathyroidal extension should be managed as ATA low-risk tumor. J. Endocrinol. Investig. 2018, 41, 1029–1035. [Google Scholar] [CrossRef]
- Chereau, N.; Dauzier, E.; Godiris-Petit, G.; Noullet, S.; Brocheriou, I.; Leenhardt, L.; Buffet, C.; Menegaux, F. Risk of recurrence in a homogeneously managed pT3-differentiated thyroid carcinoma population. Langenbecks Arch. Surg. 2018, 403, 325–332. [Google Scholar] [CrossRef]
- Tavarelli, M.; Sarfati, J.; Chereau, N.; Tissier, F.; Golmard, J.L.; Ghander, C.; Lussey-Lepoutre, C.; Trésallet, C.; Menegaux, F.; Leenhardt, L.; et al. Heterogeneous Prognoses for pT3 Papillary Thyroid Carcinomas and Impact of Delayed Risk Stratification. Thyroid 2017, 27, 778–786. [Google Scholar] [CrossRef] [PubMed]
- Tuttle, R.M.; Tala, H.; Shah, J.; Leboeuf, R.; Ghossein, R.; Gonen, M.; Brokhin, M.; Omry, G.; Fagin, J.A.; Shaha, A. Estimating risk of recurrence in differentiated thyroid cancer after total thyroidectomy and radioactive iodine remnant ablation: Using response to therapy variables to modify the initial risk estimates predicted by the new American Thyroid Association staging system. Thyroid 2010, 20, 1341–1349. [Google Scholar] [CrossRef]
- Tuttle, M.; Morris, L.F.; Haugen, B.; Shah, J.; Sosa, J.A.; Rohren, E.; Subramaniam, R.M.; Hunt, J.L.; Perrier, N.D. Thyroid-differentiated and anaplastic carcinoma (Chapter 73). In AJCC Cancer Staging Manual, 8th ed.; Amin, M.B., Edge, S.B., Greene, F., Byrd, D., Brookland, R.K., Washington, M.K., Compton, C.C., Hess, K.R., Sullivan, D.C., Jessup, J.M., et al., Eds.; Springer International Publishing: New York, NY, USA, 2017; pp. 873–890. [Google Scholar]
- Tuttle, R.M.; Haugen, B.; Perrier, N.D. Updated American Joint Committee on Cancer/Tumor-Node-Metastasis Staging System for Differentiated and Anaplastic Thyroid Cancer (Eighth Edition): What Changed and Why? Thyroid 2017, 27, 751–756. [Google Scholar] [CrossRef] [PubMed]
- Cai, Y.F.; Wang, Q.X.; Ni, C.J.; Zhang, X.J.; Chen, E.D.; Dong, S.Y.; Zheng, H.M.; Zhang, X.H.; Li, Q. A scoring system is an effective tool for predicting central lymph node metastasis in papillary thyroid microcarcinoma: A case-control study. World J. Surg. Oncol. 2016, 14, 45. [Google Scholar] [CrossRef] [Green Version]
- Luo, Y.; Zhao, Y.; Chen, K.; Shen, J.; Shi, J.; Lu, S.; Lei, J.; Li, Z.; Luo, D. Clinical analysis of cervical lymph node metastasis risk factors in patients with papillary thyroid microcarcinoma. J. Endocrinol. Investig. 2019, 42, 227–236. [Google Scholar] [CrossRef] [Green Version]
- Gharib, H.; Papini, E.; Garber, J.R.; Duick, D.S.; Harrell, R.M.; Hegedüs, L.; Paschke, R.; Valcavi, R.; Vitti, P.; AACE/ACE/AME Task Force on Thyroid Nodules. American association of clinical endocrinologists, american college of endocrinology, and associazione medici endocrinologi medical guidelines for clinical practice for the diagnosis and management of thyroid nodules—2016 update. Endocr. Pract. 2016, 22, 622–639. [Google Scholar] [CrossRef] [PubMed] [Green Version]
- Haugen, B.R.; Alexander, E.K.; Bible, K.C.; Doherty, G.M.; Mandel, S.J.; Nikiforov, Y.E.; Pacini, F.; Randolph, G.W.; Sawka, A.M.; Schlumberger, M.; et al. 2015 American Thyroid Association Management Guidelines for Adult Patients with Thyroid Nodules and Differentiated Thyroid Cancer: The American Thyroid Association Guidelines Task Force on Thyroid Nodules and Differentiated Thyroid Cancer. Thyroid 2016, 26, 1–133. [Google Scholar] [CrossRef] [Green Version]
- Rosai, J.; Albores Saavedra, J.; Asioli, S.; Baloch, Z.W.; Bogdanova, T.; Chen, H.; DeLellis, R.A.; Erickson, L.A.; Fagin, J.A.; Franssila, K.O.; et al. Papillary thyroid carcinoma. In WHO Classification of Tumours of Endocrine Organs, 4th ed.; Lloyd, R.V., Osamura, R.Y., Klöppel, G., Rosai, J., Eds.; IARC Press: Lyon, France, 2017; Volume 10, pp. 81–91. [Google Scholar]
- Durante, C.; Tallini, G.; Puxeddu, E.; Sponziello, M.; Moretti, S.; Ligorio, C.; Cavaliere, A.; Rhoden, K.J.; Verrienti, A.; Maranghi, M.; et al. BRAF (V600E) mutation and expression of proangiogenic molecular markers in papillary thyroid carcinomas. Eur. J. Endocrinol. 2011, 165, 455–463. [Google Scholar] [CrossRef] [Green Version]
- Morandi, L.; de Biase, D.; Visani, M.; Cesari, V.; De Maglio, G.; Pizzolitto, S.; Pession, A.; Tallini, G. Allele specific locked nucleic acid quantitative PCR (ASLNAqPCR): An accurate and cost-effective assay to diagnose and quantify KRAS and BRAF mutation. PLoS ONE 2012, 7, e36084. [Google Scholar] [CrossRef]


| Age (years) | 50.2 ± 13 a |
| Female sex | 218 (76.2%) |
| Tumor diagnosis | |
| Follicular variant | 124 (43.4%) |
| Classic variant | 110 (38.5%) |
| Tall cell variant | 36 (12.6%) |
| Other histotypes | 16 (5.6%) |
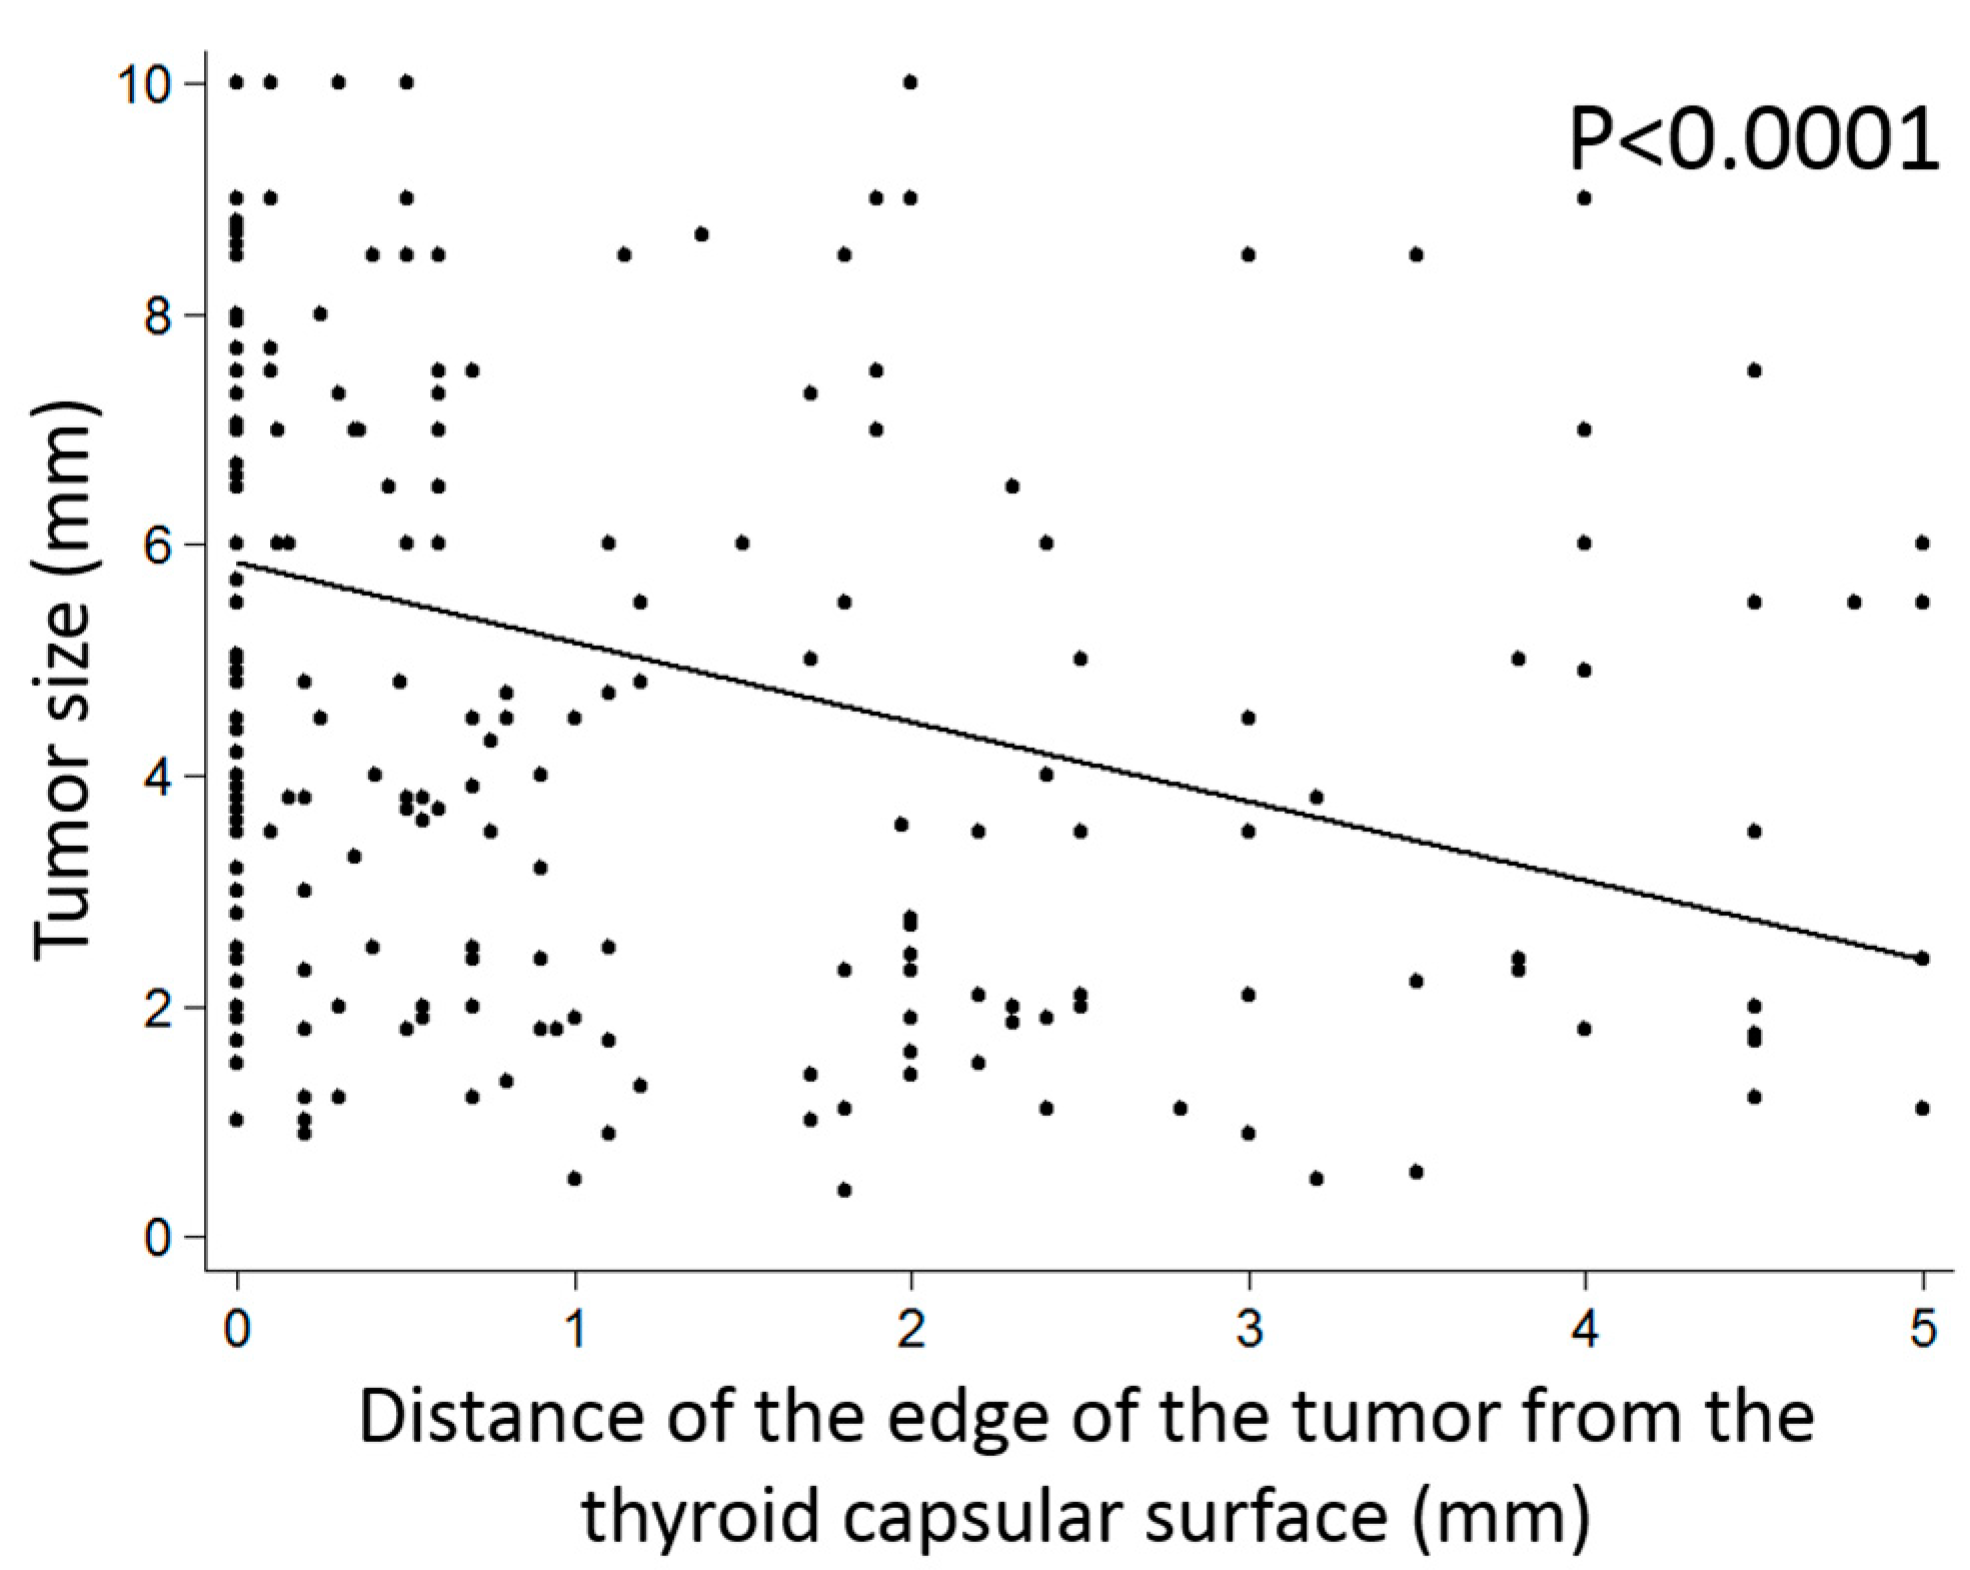
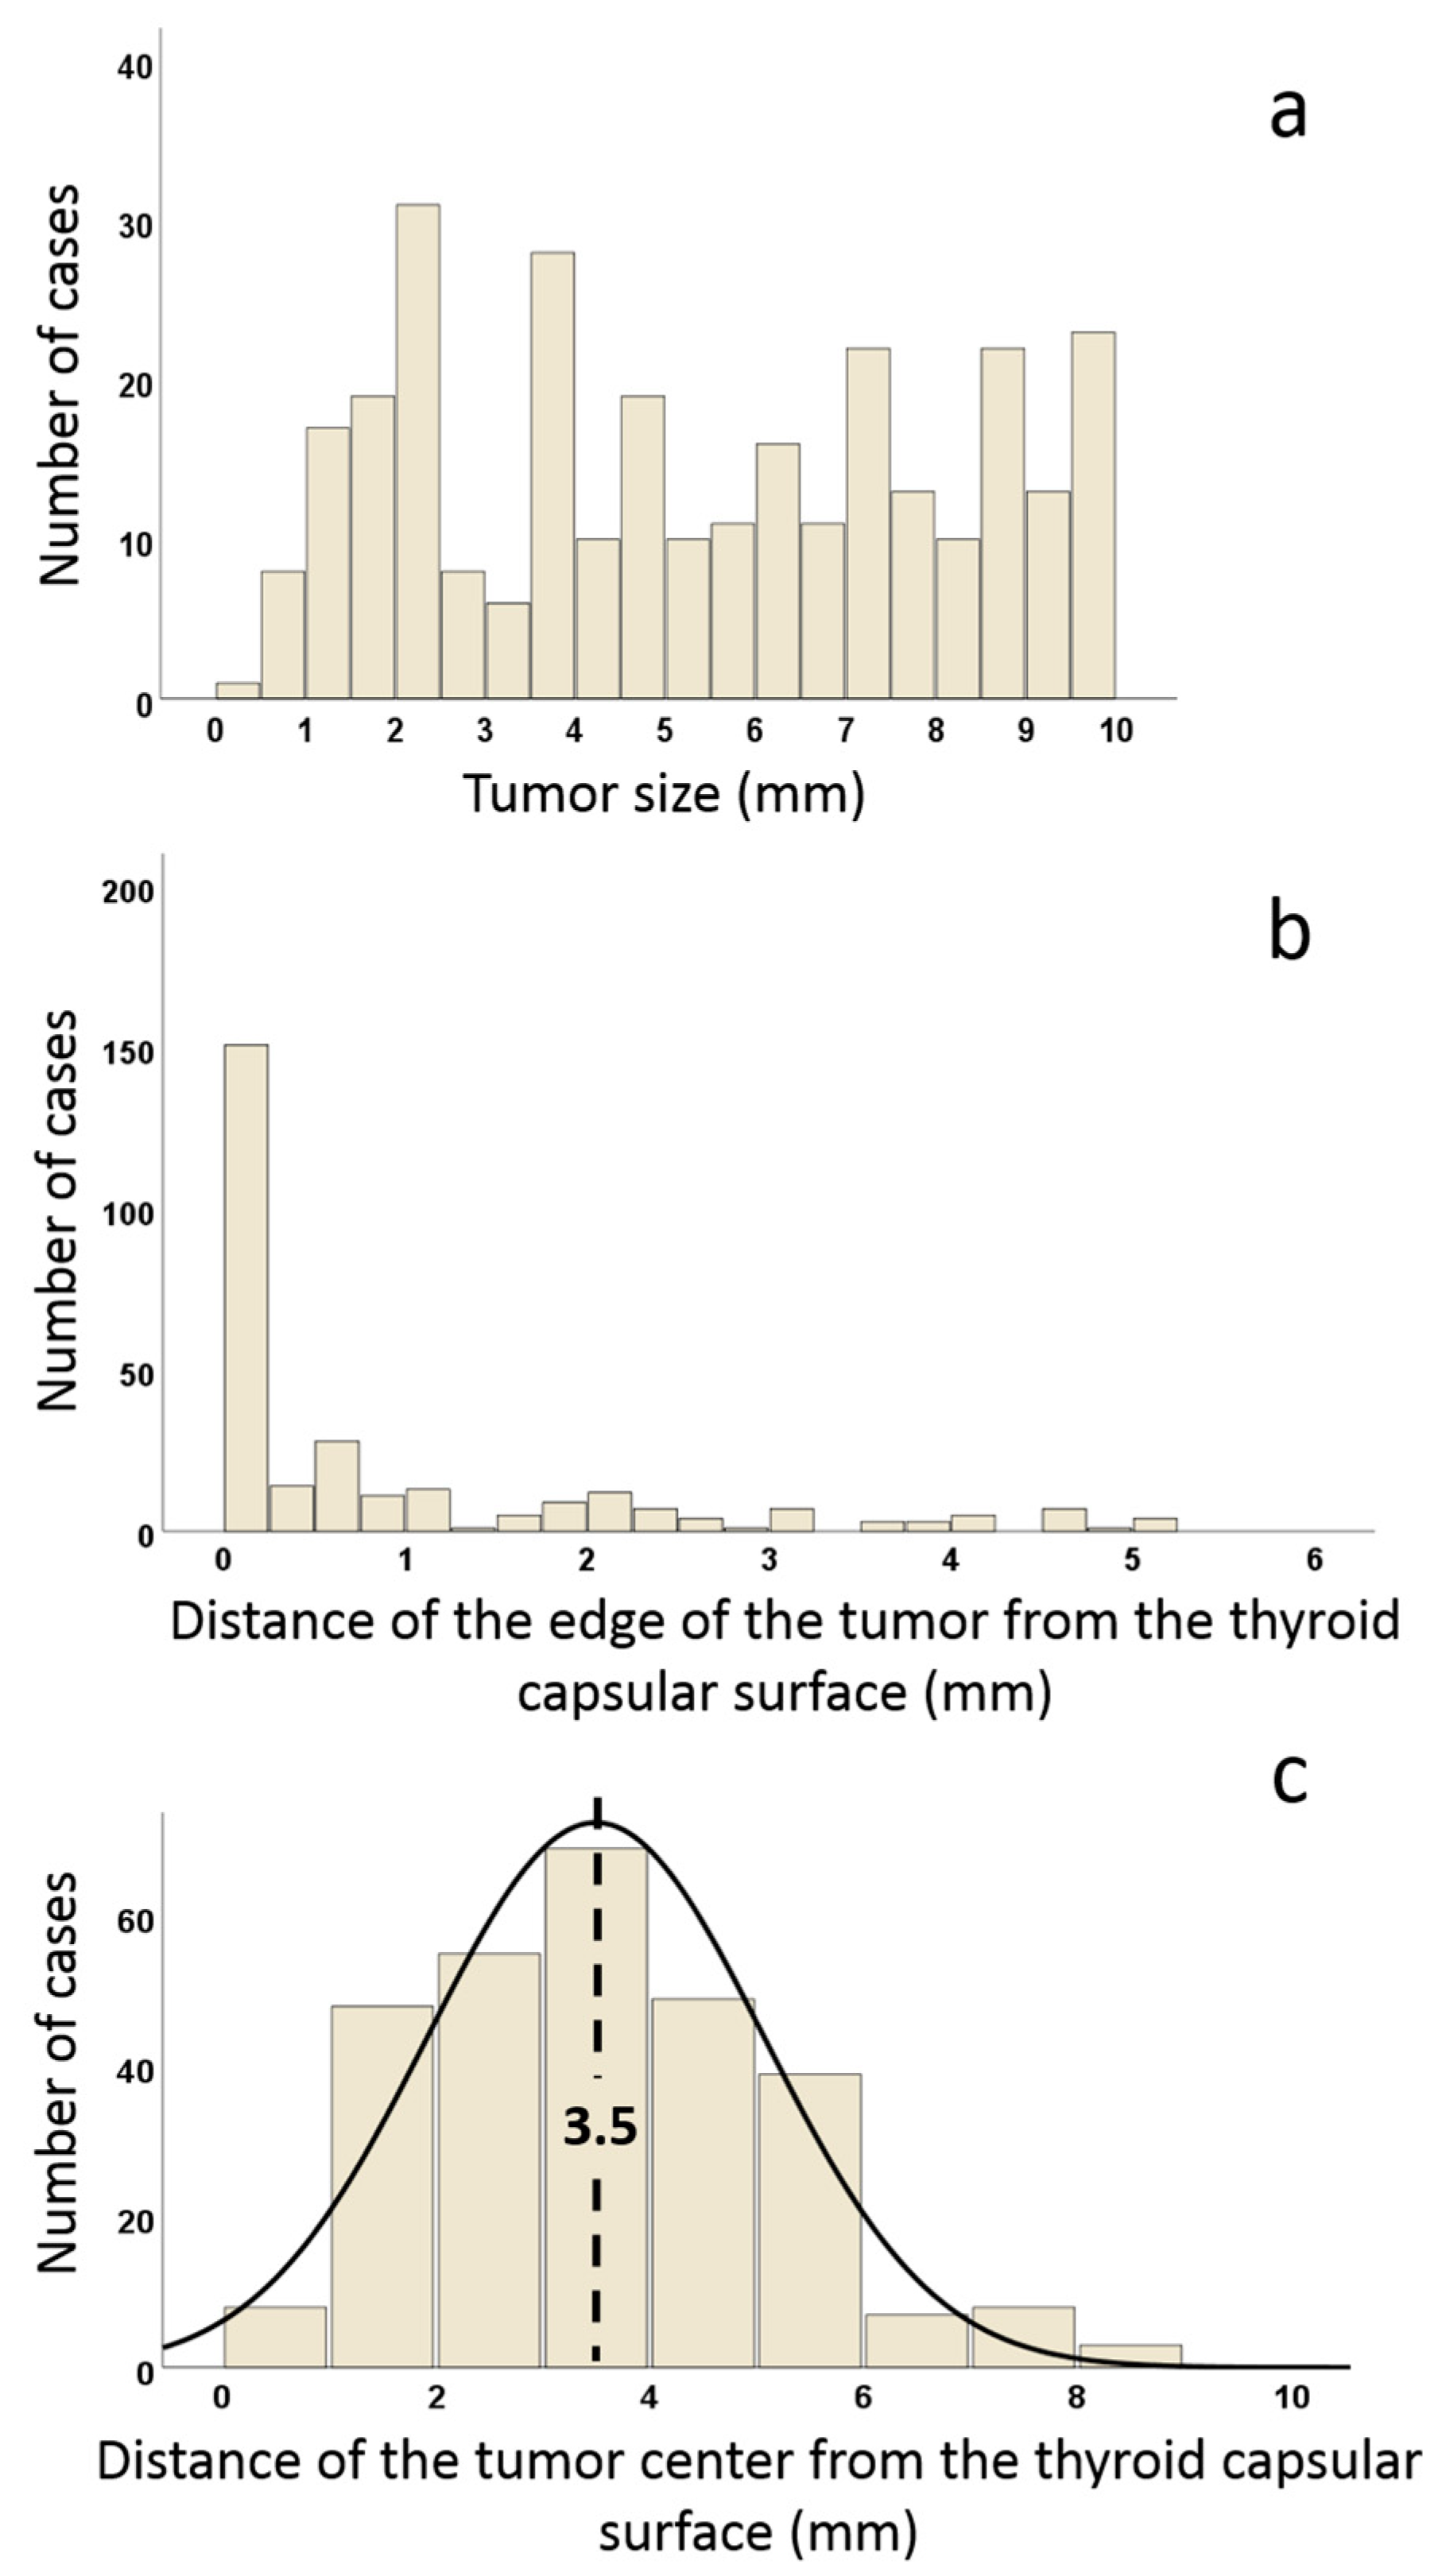
| Tumor size (mm) | 5.2 ± 2.8 a |
| Distance of the tumor center from the thyroid capsule | 3.5 (0.5–8.5) b |
| BRAF V600E mutation | 140 (48.9%) |
| Lymph node metastasis | 29 (10.1%) |
| ATA (2015) recurrence risk groups | |
| Low risk | 200 (69.9%) |
| Intermediate risk | 86 (30.1%) |
| AJCC stage (8th ed) c | |
| I | 268 (93.7%) |
| II | 8 (6.3%) |
| Unfavorable disease-related patient events (persistent or recurrent disease) | 8 (2.8%) |
| Incidental findings | 173 (58%) |
| Aggressive growth (IGTS-infiltrative border-extrathyroidal extension) | 195 (65.4%) |
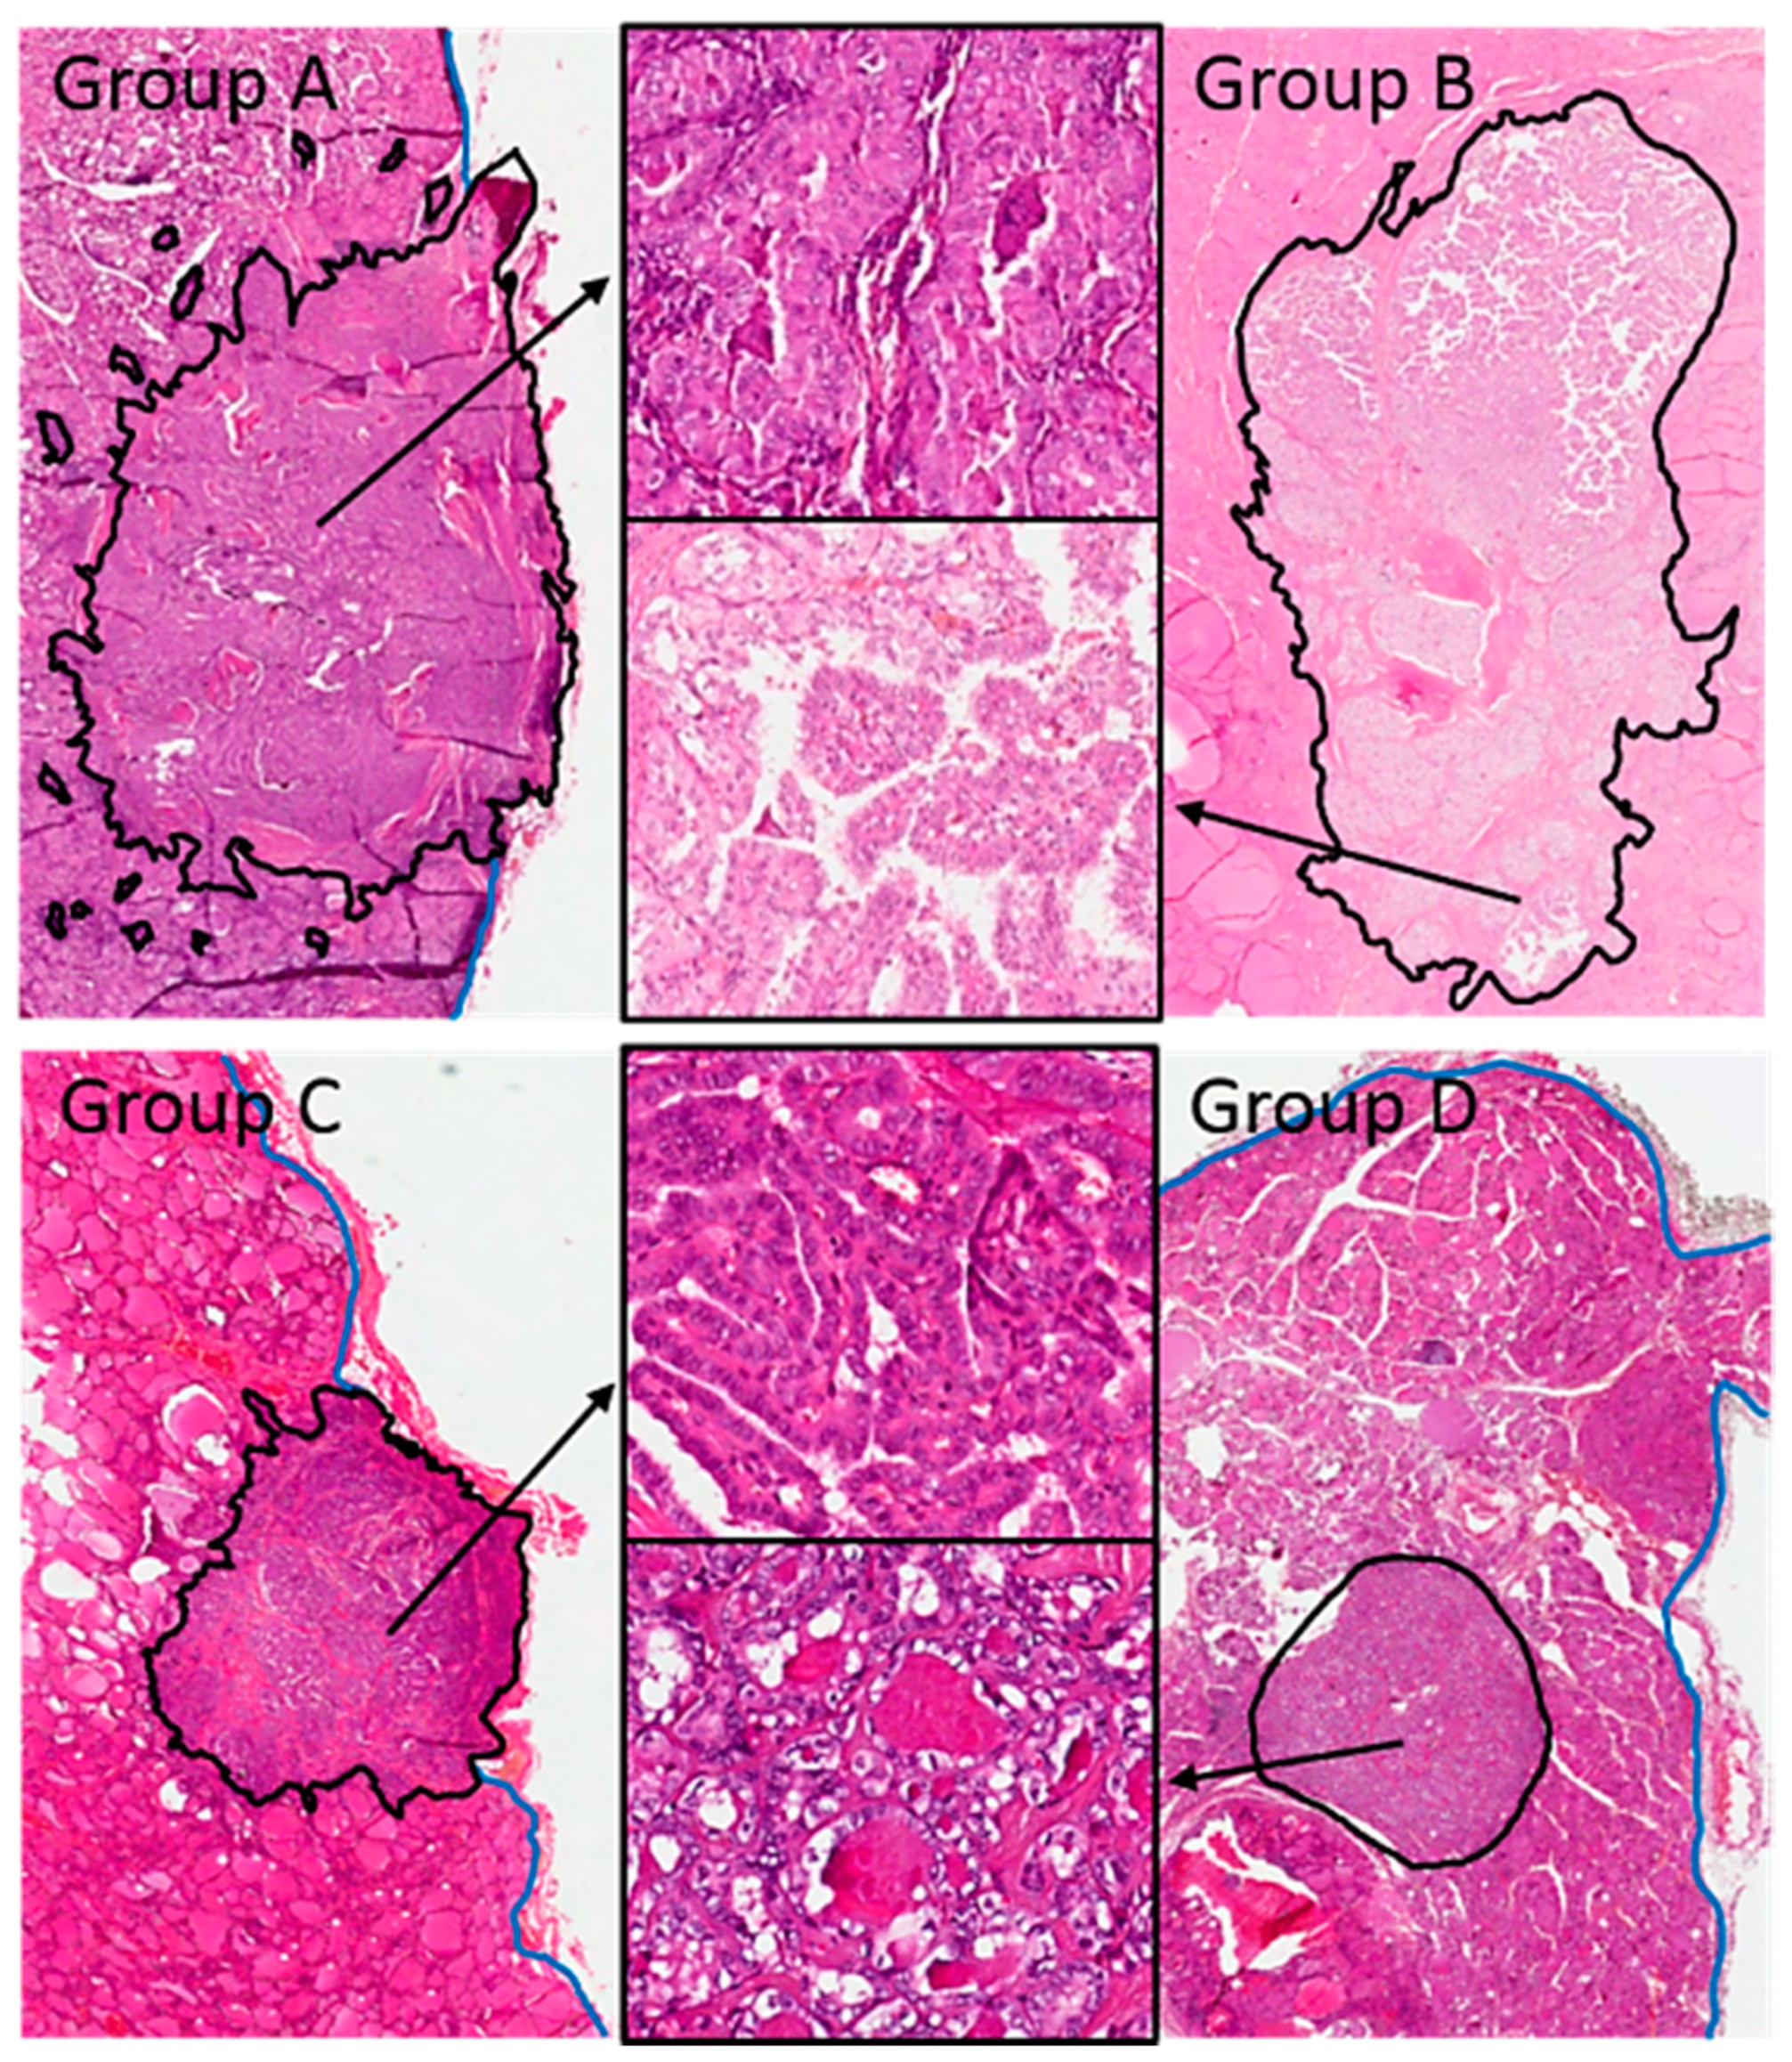
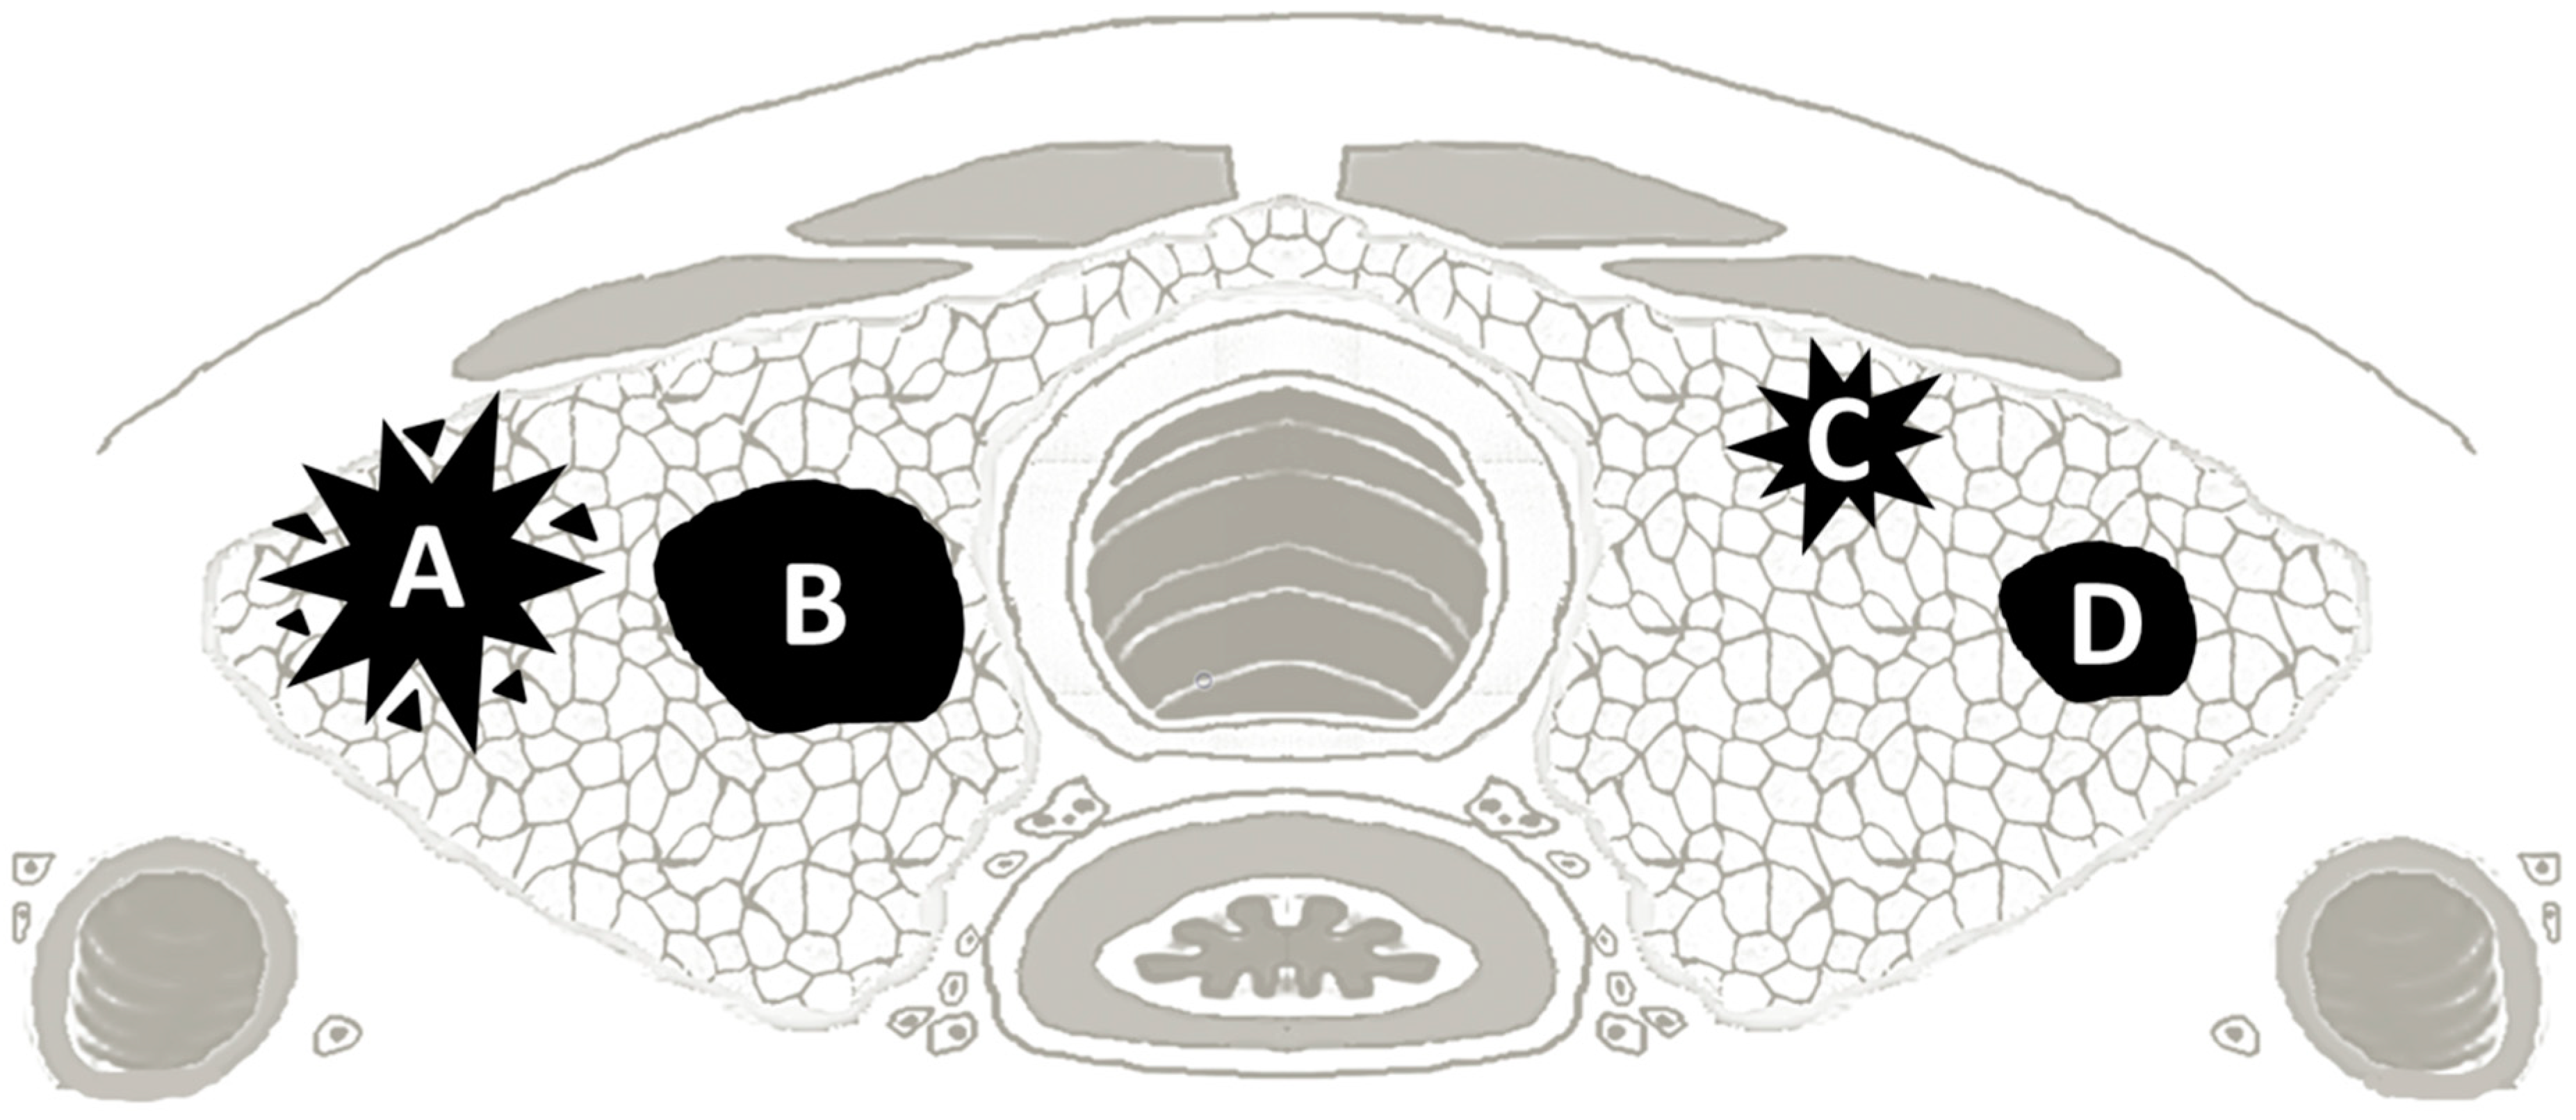
| Variables | GROUP A | GROUP B | GROUP C | GROUP D | p-Value |
|---|---|---|---|---|---|
| Subcapsular & ≥ 5 mm n = 93 (32.5%) n (%) | Nonsubcapsular & ≥ 5 mm n = 54 (18.9%) n (%) | Subcapsular & < 5 mm n = 41 (14.3%) n (%) | Nonsubcapsular & < 5 mm n = 98 (34.3) n (%) | ||
| Clinicopathologic Features | |||||
| Age (mean ± s.d.) | 47.3 ± 12.8 | 52.6 ± 15.1 | 51 ± 12.2 | 51.7 ± 12.1 | 0.057 a |
| Female sex (n = 218) | 72 (77.4%) | 38 (70.4%) | 31 (75.6%) | 77 (78.6%) | 0.811 a |
| Pathological diagnosis | <0.0001 a | ||||
| Follicular variant (n = 124) | 18 (19.4%) | 21 (38.9%) | 23 (56.1%) | 62 (63.3%) | |
| Classic variant (n = 110) | 45 (48.4%) | 27 (50.0%) | 11 (26.8%) | 27 (27.6%) | |
| Tall cell variant (n = 36) | 24 (25.8%) | 2 (3.7%) | 5 (12.2%) | 5 (5.1%) | |
| Other histotypes (n = 16) | 6 (6.5%) | 4 (7.4%) | 2 (4.9%) | 4 (4.1%) | |
| NIFTP (n = 50) | 4 (4.3%) | 11 (20.4%) | 5 (12.2%) | 30 (30.6%) | <0.0001 a |
| PMiT (n = 69) | 10 (10.8%) | 14 (25.9%) | 5 (12.2%) | 40 (40.8%) | <0.0001 a |
| BRAF V600E mutation (n = 140) | 64 (68.8%) | 25 (46.3%) | 20 (48.8%) | 36 (36.7%) | <0.0001 a |
| Lymph node metastasis (n = 29) | 18 (19.4%) | 5 (9.3%) | 1 (2.4%) | 5 (5.1%) | 0.003 a |
| AJCC stage (8th ed.) c | 0.734 a | ||||
| I (n = 268) | 84 (90.3%) | 51 (94.4%) | 38 (92.7%) | 95 (96.9%) | |
| II (n = 8) | 4 (4.3%) | 1 (1.9%) | 1 (2.4%) | 2 (2.0%) | |
| ATA (2015) recurrence risk groups | <0.0001 a | ||||
| Low risk (n = 200) | 41 (44.1%) | 46 (85.2%) | 23 (56.1%) | 90 (91.8%) | |
| Intermediate risk (n = 86) | 52 (55.9%) | 8 (14.8%) | 18 (43.9%) | 8 (8.2%) | |
| Other thyroid neoplasms (n = 32) | 5 (5.4%) | 1 (1.9%) | 7 (17.1%) | 19 (19.4%) | 0.001 a |
| Hyperthyroidism (n = 10) | 1 (1.1%) | 2 (3.7%) | 3 (7.3%) | 4 (4.1%) | 0.321 a |
| Nodular hyperplasia (n = 181) | 43 (46.2%) | 38 (70.4%) | 29 (70.7%) | 71 (72.4%) | 0.001 a |
| Lymphocytic thyroiditis (n = 35) | 10 (10.8%) | 4 (7.4%) | 6 (14.6%) | 15 (15.3%) | 0.486 a |
| Incidental findings (n = 169) | 55 (59.1%) | 37 (68.5%) | 32 (78.0%) | 78 (79.6%) | 0.006 a |
| Administration of RAI (n = 114) | 48 (51.6%) | 27 (50.0%) | 12 (29.3%) | 27 (27.6%) | 0.005 a |
| Unfavorable disease-related patient events (persistent or recurrent disease) (n = 8) | 5 (5.4%) | 2 (3.7%) | 0 (0%) | 1 (1.0%) | 0.265 a |
| Characteristics of Tumor Growth | |||||
| Cystic component (n = 18) | 7 (7.5%) | 8 (14.8%) | 1 (2.4%) | 2 (2.0%) | 0.012 a |
| Invasion of extrathyroidal tissues (n = 68) | 50 (53.8%) | 0 (0%) | 18 (43.9%) | 0 (0%) | <0.0001 a |
| Infiltrative tumor border (n = 171) | 72 (77.4%) | 21 (38.9%) | 29 (70.7%) | 49 (50.0%) | <0.0001 a |
| High-grade features (mitoses and/or necrosis) (n = 54) | 25 (26.9%) | 12 (22.2%) | 7 (17.1%) | 10 (10.2%) | 0.029 a |
| Mitoses (n = 52) | 24 (25.8%) | 11 (20.4%) | 7 (17.1%) | 10 (10.2%) | 0.049 a |
| Tumor necrosis (n = 7) | 5 (5.4%) | 1 (1.9%) | 1 (2.4%) | 0 (0%) | 0.12 a |
| Vascular invasion (n = 17) | 15 (16.1%) | 1 (1.9%) | 0 (0%) | 1 (1.0%) | <0.0001 a |
| Microcarcinoma multicentric (n = 106) | 25 (26.9%) | 27 (50.0%) | 18 (43.9%) | 36 (36.7%) | 0.032a |
| Intraglandular tumor spread (n = 112) | 56 (60.2%) | 20 (37.0%) | 10 (24.4%) | 25 (25.5%) | <0.0001 a |
| Psammoma bodies out of the carcinoma (n = 31) | 19 (20.4%) | 6 (11.1%) | 2 (4.9%) | 4 (4.1%) | 0.002 a |
| Intratumoral lymphoid cells (n = 59) | 29 (31.2%) | 14 (25.9%) | 5 (12.2%) | 11 (11.2%) | 0.003 a |
| Peritumoral lymphoid cells (n = 53) | 29 (31.2%) | 10 (18.5%) | 7 (17.1%) | 7 (7.1%) | <0.0001 a |
| Microscopic Appearance of Papillary Microcarcinoma | |||||
| Nuclei | |||||
| Pseudoinclusions (n = 45) | 25 (26–9%) | 8 (14.8%) | 3 (7.3%) | 9 (9.2%) | 0.003 a |
| Grooves (n = 167) | 64 (68.8%) | 35 (64.8%) | 25 (61.0%) | 43 (43.9%) | 0.004 a |
| Nuclear membrane irregularities (n = 207) | 82 (88.2%) | 36 (66.7%) | 28 (68.3%) | 61 (62.2%) | 0.0001 a |
| Optically clear nuclei (n = 207) | 68 (73.1%) | 38 (70.4%) | 26 (63.4%) | 75 (76.5%) | 0.207 a |
| Cytoplasm | |||||
| Cells with cytoplasmic eosinophilia (n = 159) | 57 (61.3%) | 32 (59.3%) | 26 (63.4%) | 44 (44.9%) | 0.012 a |
| Cells with cytoplasmic clearing (n = 63) | 27 (29.0%) | 11 (20.3%) | 9 (22.0%) | 16 (16.3%) | 0.217 a |
| Tall cells (n = 62) | 36 (38.7%) | 10 (18.5%) | 9 (22.0%) | 7 (7.1%) | <0.0001a |
| Tall cell features (mean% ± s.d.) | 25.6 ± 36.5 | 8.3 ± 21 | 14.4 ± 31 | 5.1 ± 19.7 | 0.0001 b |
| Psammoma bodies within the carcinoma (n = 31) | 40 (43.0%) | 11 (20.4%) | 5 (12.2%) | 11 (11.2%) | <0.0001 a |
| Fibrosis associated with the tumor (n = 83) | 42 (45.2%) | 12 (22.2%) | 14 (34.1%) | 15 (15.3%) | <0.0001 a |
| Tumor patterns (mean% ± s.d.) | |||||
| Papillary | 40.4 ± 33.5 | 33.8 ± 39.6 | 22.9 ± 35 | 19.7 ± 31.5 | 0.0003 b |
| Follicular | 44.4 ± 32.8 | 54.8 ± 38.3 | 64 ± 39.4 | 73.4 ± 35.7 | <0.0001 b |
| Solid/trabecular | 15.2 ± 19.7 | 11.4 ± 21.1 | 13 ± 25.9 | 6.9 ± 16.9 | 0.039 b |
© 2020 by the authors. Licensee MDPI, Basel, Switzerland. This article is an open access article distributed under the terms and conditions of the Creative Commons Attribution (CC BY) license (http://creativecommons.org/licenses/by/4.0/).
Share and Cite
Tallini, G.; De Leo, A.; Repaci, A.; de Biase, D.; Bacchi Reggiani, M.L.; Di Nanni, D.; Ambrosi, F.; Di Gioia, C.; Grani, G.; Rhoden, K.J.; et al. Does the Site of Origin of the Microcarcinoma with Respect to the Thyroid Surface Matter? A Multicenter Pathologic and Clinical Study for Risk Stratification. Cancers 2020, 12, 246. https://doi.org/10.3390/cancers12010246
Tallini G, De Leo A, Repaci A, de Biase D, Bacchi Reggiani ML, Di Nanni D, Ambrosi F, Di Gioia C, Grani G, Rhoden KJ, et al. Does the Site of Origin of the Microcarcinoma with Respect to the Thyroid Surface Matter? A Multicenter Pathologic and Clinical Study for Risk Stratification. Cancers. 2020; 12(1):246. https://doi.org/10.3390/cancers12010246
Chicago/Turabian StyleTallini, Giovanni, Antonio De Leo, Andrea Repaci, Dario de Biase, Maria Letizia Bacchi Reggiani, Doriana Di Nanni, Francesca Ambrosi, Cira Di Gioia, Giorgio Grani, Kerry Jane Rhoden, and et al. 2020. "Does the Site of Origin of the Microcarcinoma with Respect to the Thyroid Surface Matter? A Multicenter Pathologic and Clinical Study for Risk Stratification" Cancers 12, no. 1: 246. https://doi.org/10.3390/cancers12010246
APA StyleTallini, G., De Leo, A., Repaci, A., de Biase, D., Bacchi Reggiani, M. L., Di Nanni, D., Ambrosi, F., Di Gioia, C., Grani, G., Rhoden, K. J., Solaroli, E., Monari, F., Filetti, S., & Durante, C. (2020). Does the Site of Origin of the Microcarcinoma with Respect to the Thyroid Surface Matter? A Multicenter Pathologic and Clinical Study for Risk Stratification. Cancers, 12(1), 246. https://doi.org/10.3390/cancers12010246