Prognostic Significance of CT-Attenuation of Tumor-Adjacent Breast Adipose Tissue in Breast Cancer Patients with Surgical Resection

 , and
, and
Abstract
1. Introduction
2. Results
2.1. Patient Characteristics
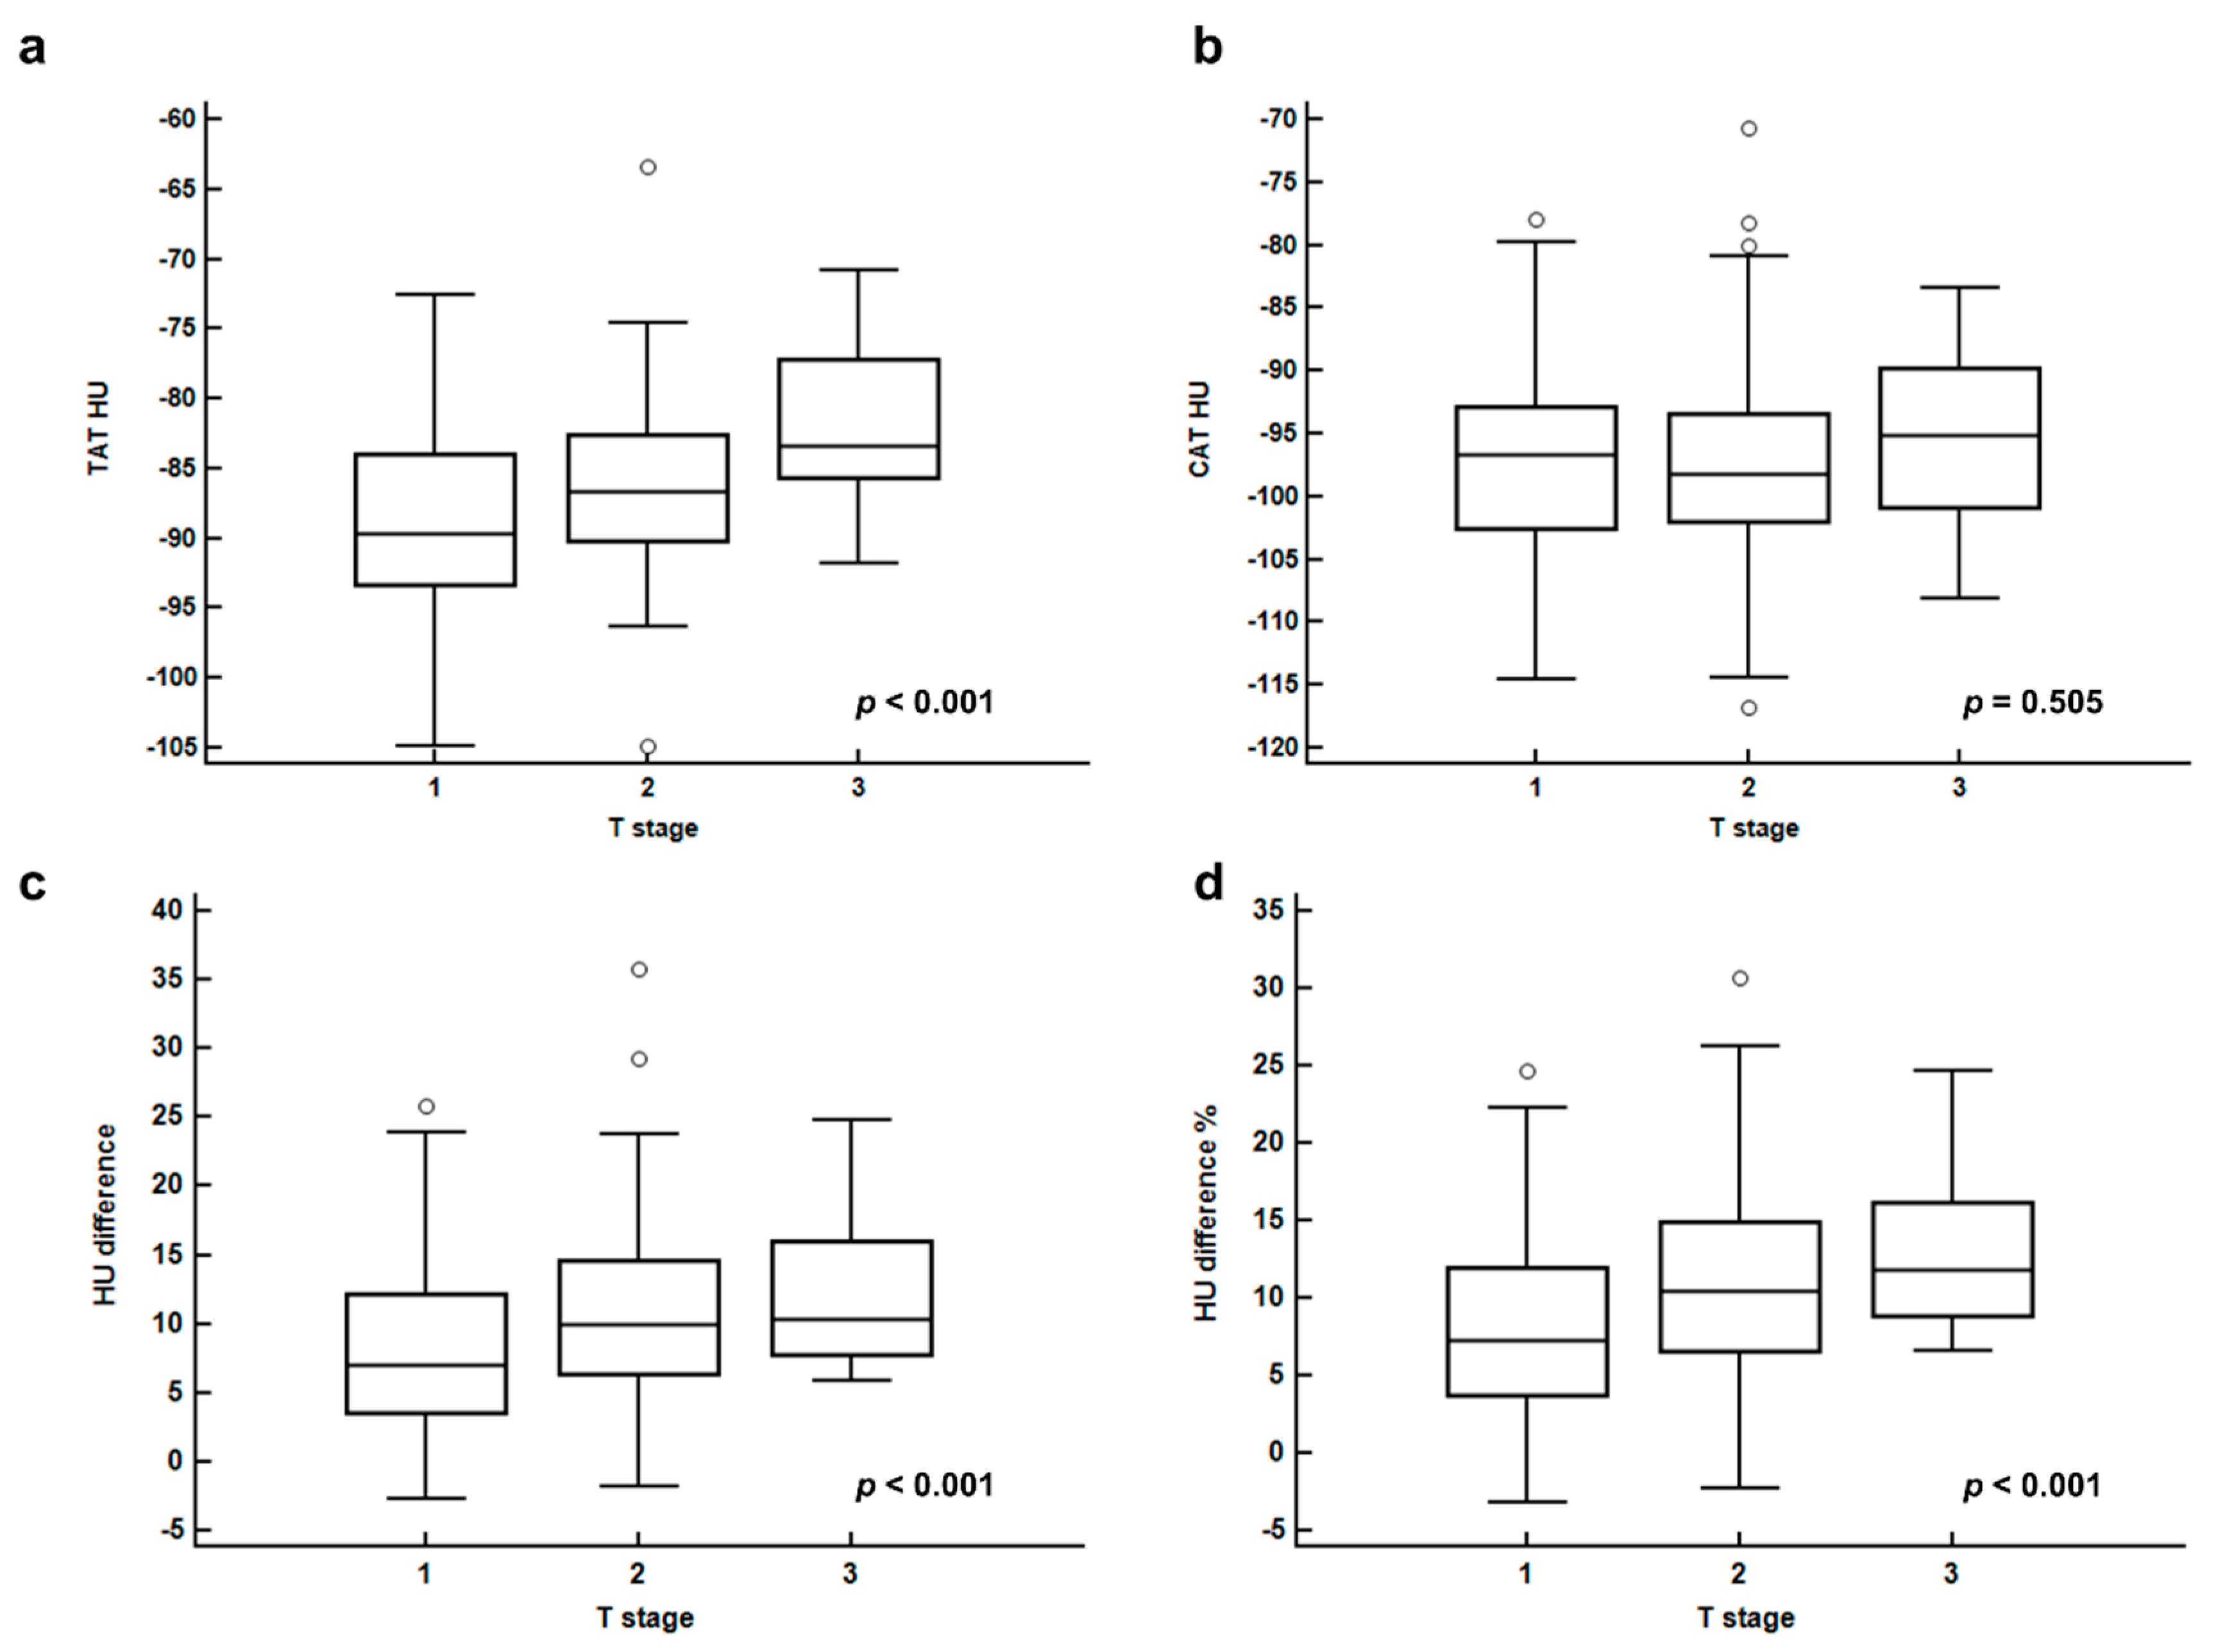
2.2. Breast Adipose Tissue Measurement
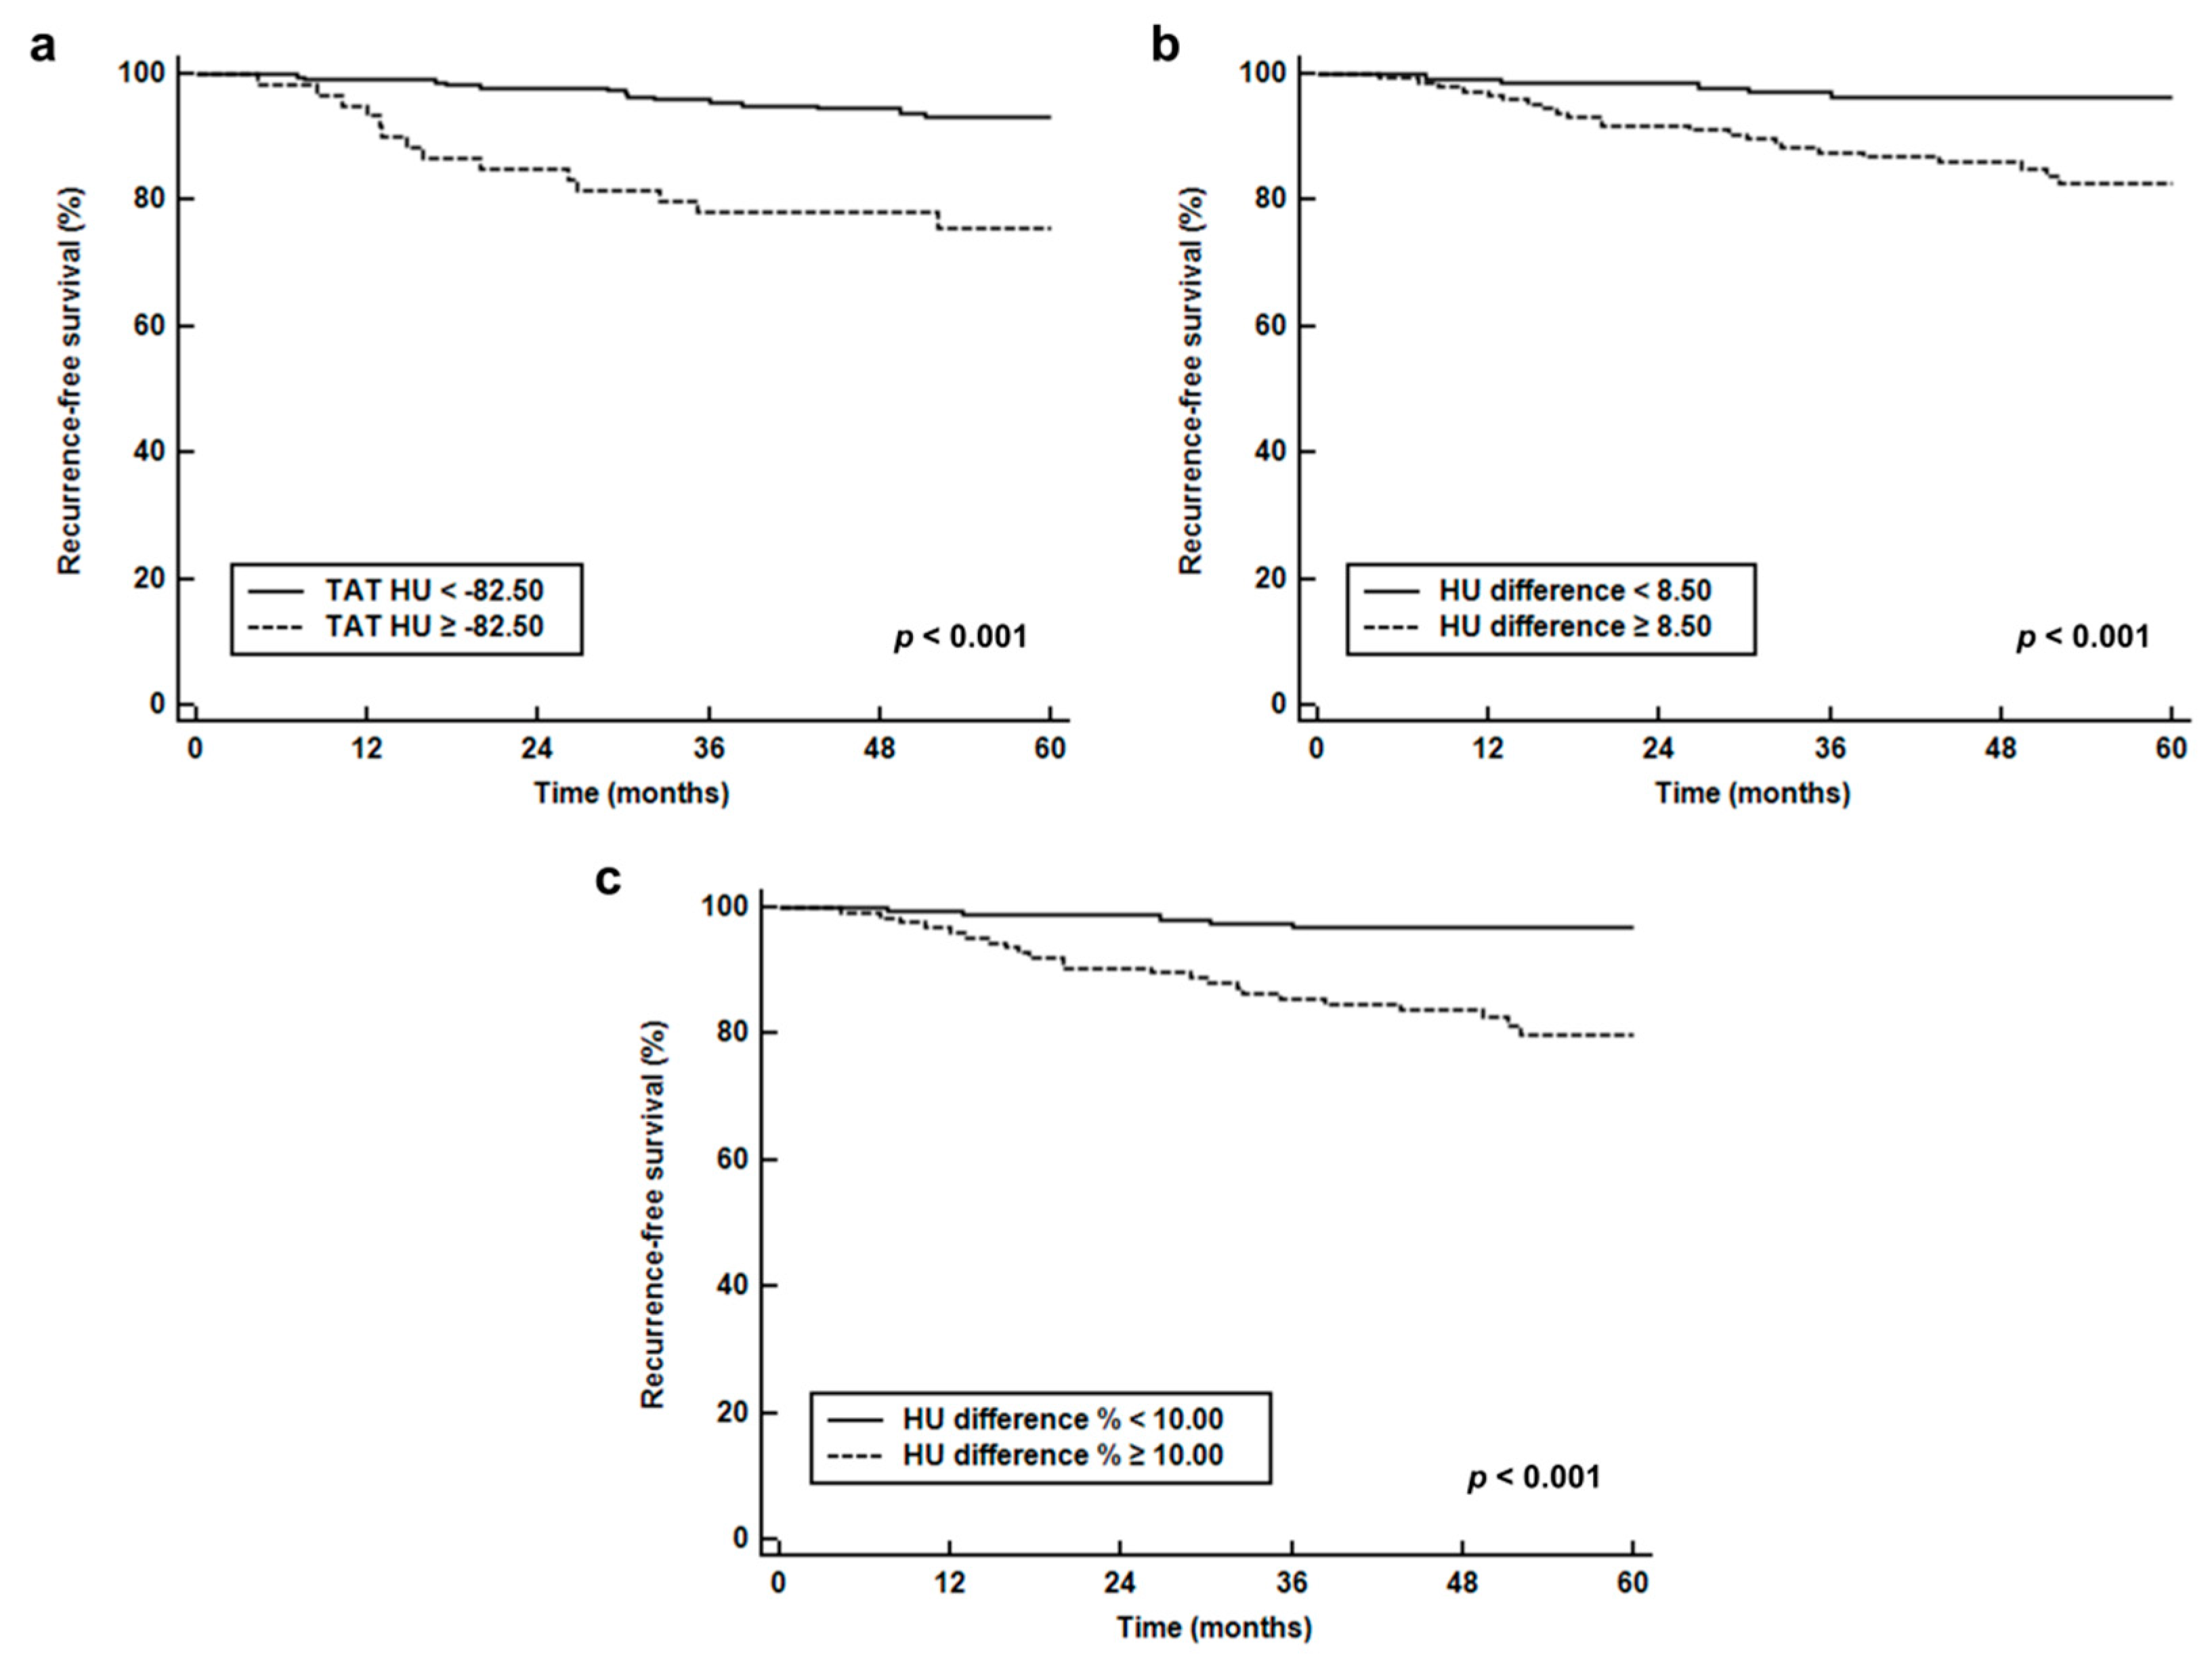
2.3. Survival Analysis
3. Discussion
4. Materials and Methods
4.1. Study Population
4.2. Image Analysis
4.3. Statistical Analysis
5. Conclusions
Author Contributions
Funding
Conflicts of Interest
References
- Duong, M.N.; Geneste, A.; Fallone, F.; Li, X.; Dumontet, C.; Muller, C. The fat and the bad: Mature adipocytes, key actors in tumor progression and resistance. Oncotarget 2017, 8, 57622–57641. [Google Scholar] [CrossRef] [PubMed]
- Vandeweyer, E.; Hertens, D. Quantification of glands and fat in breast tissue: An experimental determination. Ann. Anat. 2002, 184, 181–184. [Google Scholar] [CrossRef]
- Guaita-Esteruelas, S.; Guma, J.; Masana, L.; Borras, J. The peritumoural adipose tissue microenvironment and cancer. The roles of fatty acid binding protein 4 and fatty acid binding protein 5. Mol. Cell. Endocrinol. 2018, 462, 107–118. [Google Scholar] [CrossRef] [PubMed]
- Lehr, S.; Hartwig, S.; Sell, H. Adipokines: A treasure trove for the discovery of biomarkers for metabolic disorders. Proteom. Clin. Appl. 2012, 6, 91–101. [Google Scholar] [CrossRef] [PubMed]
- Divella, R.; De Luca, R.; Abbate, I.; Naglieri, E.; Daniele, A. Obesity and cancer: The role of adipose tissue and adipo-cytokines-induced chronic inflammation. J. Cancer 2016, 7, 2346–2359. [Google Scholar] [CrossRef]
- Engin, A.B.; Engin, A.; Gonul, I.I. The effect of adipocyte-macrophage cross-talk in obesity-related breast cancer. J. Mol. Endocrinol. 2019. [Google Scholar] [CrossRef] [PubMed]
- Choi, J.; Cha, Y.J.; Koo, J.S. Adipocyte biology in breast cancer: From silent bystander to active facilitator. Prog. Lipid. Res. 2018, 69, 11–20. [Google Scholar] [CrossRef] [PubMed]
- Dirat, B.; Bochet, L.; Dabek, M.; Daviaud, D.; Dauvillier, S.; Majed, B.; Wang, Y.Y.; Meulle, A.; Salles, B.; Le Gonidec, S.; et al. Cancer-associated adipocytes exhibit an activated phenotype and contribute to breast cancer invasion. Cancer Res. 2011, 71, 2455–2465. [Google Scholar] [CrossRef] [PubMed]
- Fletcher, S.J.; Sacca, P.A.; Pistone-Creydt, M.; Colo, F.A.; Serra, M.F.; Santino, F.E.; Sasso, C.V.; Lopez-Fontana, C.M.; Caron, R.W.; Calvo, J.C.; et al. Human breast adipose tissue: Characterization of factors that change during tumor progression in human breast cancer. J. Exp. Clin. Cancer Res. 2017, 36, 26. [Google Scholar] [CrossRef] [PubMed]
- Murphy, R.A.; Register, T.C.; Shively, C.A.; Carr, J.J.; Ge, Y.; Heilbrun, M.E.; Cummings, S.R.; Koster, A.; Nevitt, M.C.; Satterfield, S.; et al. Adipose tissue density, a novel biomarker predicting mortality risk in older adults. J. Gerontol. A Biol. Sci. Med. Sci. 2014, 69, 109–117. [Google Scholar] [CrossRef] [PubMed]
- Lee, J.W.; Lee, H.S.; Na, J.O.; Lee, S.M. Effect of adipose tissue volume on prognosis in patients with non-small cell lung cancer. Clin. Imaging 2018, 50, 308–313. [Google Scholar] [CrossRef] [PubMed]
- Lee, J.W.; Lee, S.M.; Chung, Y.A. Prognostic value of CT attenuation and FDG uptake of adipose tissue in patients with pancreatic adenocarcinoma. Clin. Radiol. 2018, 73, 1056.e1–1056.e10. [Google Scholar] [CrossRef] [PubMed]
- Lee, J.W.; Ban, M.J.; Park, J.H.; Lee, S.M. Visceral adipose tissue volume and CT-attenuation as prognostic factors in patients with head and neck cancer. Head Neck 2019, 41, 1605–1614. [Google Scholar] [CrossRef] [PubMed]
- Veld, J.; Vossen, J.A.; De Amorim Bernstein, K.; Halpern, E.F.; Torriani, M.; Bredella, M.A. Adipose tissue and muscle attenuation as novel biomarkers predicting mortality in patients with extremity sarcomas. Eur. Radiol. 2016, 26, 4649–4655. [Google Scholar] [CrossRef]
- Yoo, I.D.; Lee, S.M.; Lee, J.W.; Baek, M.J.; Ahn, T.S. Usefulness of metabolic activity of adipose tissue in FDG PET/CT of colorectal cancer. Abdom. Radiol. (NY) 2018, 43, 2052–2059. [Google Scholar] [CrossRef]
- Obeid, J.P.; Stoyanova, R.; Kwon, D.; Patel, M.; Padgett, K.; Slingerland, J.; Takita, C.; Alperin, N.; Yepes, M.; Zeidan, Y.H. Multiparametric evaluation of preoperative MRI in early stage breast cancer: Prognostic impact of peri-tumoral fat. Clin. Transl. Oncol. 2017, 19, 211–218. [Google Scholar] [CrossRef]
- Caresia Aroztegui, A.P.; Garcia Vicente, A.M.; Alvarez Ruiz, S.; Delgado Bolton, R.C.; Orcajo Rincon, J.; Garcia Garzon, J.R.; de Arcocha Torres, M.; Garcia-Velloso, M.J. 18F-FDG PET/CT in breast cancer: Evidence-based recommendations in initial staging. Tumour Biol. 2017, 39. [Google Scholar] [CrossRef]
- Lee, S.S.; Bae, S.K.; Park, Y.S.; Park, J.S.; Kim, T.H.; Yoon, H.K.; Ahn, H.J.; Lee, S.M. Correlation of molecular subtypes of invasive ductal carcinoma of breast with glucose metabolism in FDG PET/CT: Based on the Recommendations of the St. Gallen Consensus Meeting 2013. Nucl. Med. Mol. Imaging 2017, 51, 79–85. [Google Scholar] [CrossRef]
- Kitajima, K.; Yamano, T.; Miyoshi, Y.; Enoki, T.; Yamakado, K. Prognostic value of FDG-PET/CT prior to breast cancer treatment—Comparison with MRS and DWI. J. Nucl. Med. 2019, 60 (Suppl. 1), 603. [Google Scholar]
- Onner, H.; Canaz, F.; Dincer, M.; Isiksoy, S.; Sivrikoz, I.A.; Entok, E.; Erkasap, S. Which of the fluorine-18 fluorodeoxyglucose positron emission tomography/computerized tomography parameters are better associated with prognostic factors in breast cancer? Medicine (Baltimore) 2019, 98, e15925. [Google Scholar] [CrossRef]
- Ribeiro, R.J.; Monteiro, C.P.; Cunha, V.F.; Azevedo, A.S.; Oliveira, M.J.; Monteiro, R.; Fraga, A.M.; Principe, P.; Lobato, C.; Lobo, F.; et al. Tumor cell-educated periprostatic adipose tissue acquires an aggressive cancer-promoting secretory profile. Cell. Physiol. Biochem. 2012, 29, 233–240. [Google Scholar] [CrossRef] [PubMed]
- Dirat, B.; Bochet, L.; Escourrou, G.; Valet, P.; Muller, C. Unraveling the obesity and breast cancer links: A role for cancer-associated adipocytes? Endocr. Dev. 2010, 19, 45–52. [Google Scholar] [CrossRef] [PubMed]
- Bochet, L.; Lehuede, C.; Dauvillier, S.; Wang, Y.Y.; Dirat, B.; Laurent, V.; Dray, C.; Guiet, R.; Maridonneau-Parini, I.; Le Gonidec, S.; et al. Adipocyte-derived fibroblasts promote tumor progression and contribute to the desmoplastic reaction in breast cancer. Cancer Res. 2013, 73, 5657–5668. [Google Scholar] [CrossRef] [PubMed]
- Jung, Y.Y.; Lee, Y.K.; Koo, J.S. Expression of cancer-associated fibroblast-related proteins in adipose stroma of breast cancer. Tumour Biol. 2015, 36, 8685–8695. [Google Scholar] [CrossRef] [PubMed]
- Ando, S.; Barone, I.; Giordano, C.; Bonofiglio, D.; Catalano, S. The Multifaceted mechanism of leptin signaling within tumor microenvironment in driving breast cancer growth and progression. Front. Oncol. 2014, 4, 340. [Google Scholar] [CrossRef] [PubMed]
- Huang, C.K.; Chang, P.H.; Kuo, W.H.; Chen, C.L.; Jeng, Y.M.; Chang, K.J.; Shew, J.Y.; Hu, C.M.; Lee, W.H. Adipocytes promote malignant growth of breast tumours with monocarboxylate transporter 2 expression via beta-hydroxybutyrate. Nat. Commun. 2017, 8, 14706. [Google Scholar] [CrossRef] [PubMed]
- McDonald, A.M.; Fiveash, J.B.; Kirkland, R.S.; Cardan, R.A.; Jacob, R.; Kim, R.Y.; Dobelbower, M.C.; Yang, E.S. Subcutaneous adipose tissue characteristics and the risk of biochemical recurrence in men with high-risk prostate cancer. Urol. Oncol. 2017, 35, 663.e615–663.e621. [Google Scholar] [CrossRef]
- Li, Q.; Xia, J.; Yao, Y.; Gong, D.W.; Shi, H.; Zhou, Q. Sulforaphane inhibits mammary adipogenesis by targeting adipose mesenchymal stem cells. Breast Cancer Res. Treat. 2013, 141, 317–324. [Google Scholar] [CrossRef]
- Bochet, L.; Meulle, A.; Imbert, S.; Salles, B.; Valet, P.; Muller, C. Cancer-associated adipocytes promotes breast tumor radioresistance. Biochem. Biophys. Res. Commun. 2011, 411, 102–106. [Google Scholar] [CrossRef]
- Nabavizadeh, N.; Klifa, C.; Newitt, D.; Lu, Y.; Chen, Y.Y.; Hsu, H.; Fisher, C.; Tokayasu, T.; Olshen, A.B.; Spellman, P.; et al. Topographic enhancement mapping of the cancer-associated breast stroma using breast MRI. Integr. Biol. (Camb.) 2011, 3, 490–496. [Google Scholar] [CrossRef][Green Version]
- Wu, J.; Li, B.; Sun, X.; Cao, G.; Rubin, D.L.; Napel, S.; Ikeda, D.M.; Kurian, A.W.; Li, R. Heterogeneous enhancement patterns of tumor-adjacent parenchyma at MR imaging are associated with dysregulated signaling pathways and poor survival in breast cancer. Radiology 2017, 285, 401–413. [Google Scholar] [CrossRef] [PubMed]
- Kullberg, J.; Brandberg, J.; Angelhed, J.E.; Frimmel, H.; Bergelin, E.; Strid, L.; Ahlstrom, H.; Johansson, L.; Lonn, L. Whole-body adipose tissue analysis: Comparison of MRI, CT and dual energy X-ray absorptiometry. Br. J. Radiol. 2009, 82, 123–130. [Google Scholar] [CrossRef] [PubMed]
- Pescatori, L.C.; Savarino, E.; Mauri, G.; Silvestri, E.; Cariati, M.; Sardanelli, F.; Sconfienza, L.M. Quantification of visceral adipose tissue by computed tomography and magnetic resonance imaging: Reproducibility and accuracy. Radiol. Bras. 2019, 52, 1–6. [Google Scholar] [CrossRef] [PubMed]
- Goo, H.W.; Goo, J.M. Dual-energy CT: New horizon in medical imaging. Korean J. Radiol. 2017, 18, 555–569. [Google Scholar] [CrossRef] [PubMed]
- Toepker, M.; Moritz, T.; Krauss, B.; Weber, M.; Euller, G.; Mang, T.; Wolf, F.; Herold, C.J.; Ringl, H. Virtual non-contrast in second-generation, dual-energy computed tomography: Reliability of attenuation values. Eur. J. Radiol. 2012, 81, e398–e405. [Google Scholar] [CrossRef]
- Jamali, S.; Michoux, N.; Coche, E.; Dragean, C.A. Virtual unenhanced phase with spectral dual-energy CT: Is it an alternative to conventional true unenhanced phase for abdominal tissues? Diagn. Interv. Imaging 2019. [Google Scholar] [CrossRef]


| Characteristics | Number (%) | Median (Range) | |
|---|---|---|---|
| Age (years) | 52 (30–85) | ||
| Body mass index | 23.8 (16.4–35.2) | ||
| Menopausal status | Premenopausal | 108 (37.6%) | |
| Postmenopausal | 179 (62.4%) | ||
| Histopathology | Intraductal carcinoma | 252 (87.8%) | |
| Intralobular carcinoma | 35 (12.2%) | ||
| T stage | T1 | 136 (47.4%) | |
| T2 | 128 (44.6%) | ||
| T3 | 23 (8.0%) | ||
| N stage | N0 | 190 (66.2%) | |
| N1 | 58 (20.2%) | ||
| N2 | 21 (7.3%) | ||
| N3 | 18 (6.3%) | ||
| Tumor size (cm) | 2.0 (0.4–8.0) | ||
| Histologic grade | Grade 1 | 67 (23.4%) | |
| Grade 2 | 143 (49.7%) | ||
| Grade 3 | 77 (26.9%) | ||
| Estrogen receptor statue | Positive | 213 (74.2%) | |
| Negative | 74 (25.8%) | ||
| Progesterone receptor status | Positive | 177 (61.7%) | |
| Negative | 110 (38.3%) | ||
| HER2 status | Positive | 142 (49.5%) | |
| Negative | 145 (50.5%) | ||
| Ki67 expression status | Positive | 177 (61.7%) | |
| Negative | 110 (38.3%) | ||
| Maximum SUV of primary tumor | 4.06 (1.10–35.59) | ||
| MTV of primary tumor (cm3) | 1.14 (0.0–235.30) | ||
| TAT HU | −87.69 (−104.88–−63.36) | ||
| CAT HU | −97.54 (−116.85–−70.74) | ||
| HU difference | 8.66 (−2.67–35.84) | ||
| HU difference % | 8.94 (−3.15–30.67) | ||
| Neoadjuvant chemotherapy | Yes | 32 (11.1%) | |
| No | 255 (88.9%) | ||
| Adjuvant treatment | CTx + RTx + HTx | 139 (48.4%) | |
| RTx + HTx | 82 (28.6%) | ||
| CTx + HTx | 17 (5.9%) | ||
| CTx + RTx | 3 (1.0%) | ||
| HTx | 24 (8.4%) | ||
| CTx | 16 (5.6%) | ||
| RTx | 1 (0.3%) | ||
| No | 5 (1.7%) |
| Clinico-Histological Factors | TAT HU | CAT HU | HU Difference | HU Difference % | |
|---|---|---|---|---|---|
| T stage | T1 | −88.95 ± 6.53 | −96.95 ± 6.61 | 7.99 ± 6.06 | 8.08 ± 6.02 |
| T2 | −86.33 ± 5.72 | −97.15 ± 7.22 | 10.82 ± 6.69 | 10.87 ± 6.23 | |
| T3 | −82.67 ± 5.68 | −95.43 ± 7.39 | 12.76 ± 6.18 | 13.14 ± 5.66 | |
| p-value | <0.001 * | 0.505 * | <0.001 * | <0.001 * | |
| N stage | N0 | −87.64 ± 6.26 | −96.95 ± 6.82 | 8.63 ± 6.43 | 8.76 ± 6.27 |
| N1-3 | −86.56 ± 6.56 | −98.06 ± 7.97 | 11.61 ± 6.34 | 11.63 ± 5.92 | |
| p-value | 0.176 | 0.203 | <0.001 | <0.001 | |
| Histologic grade | Grade 1 | −87.62 ± 7.21 | −96.28 ± 7.61 | 8.65 ± 7.11 | 8.76 ± 6.75 |
| Grade 2 | −87.65 ± 6.23 | −96.87 ± 6.71 | 9.23 ± 6.42 | 9.32 ± 6.21 | |
| Grade 3 | −86.27 ± 5.85 | −97.58 ± 6.84 | 11.21 ± 6.09 | 11.29 ± 5.83 | |
| p-value | 0.288 * | 0.391 * | 0.013 * | 0.013 * | |
| ER status | Positive | −88.03 ± 6.26 | −96.76 ± 6.91 | 8.73 ± 6.34 | 8.81 ± 6.09 |
| Negative | −85.11 ± 6.25 | −97.36 ± 7.07 | 12.25 ± 6.46 | 12.36 ± 6.15 | |
| p-value | <0.001 | 0.528 | <0.001 | <0.001 | |
| PR status | Positive | −87.94 ± 6.47 | −96.60 ± 6.76 | 8.16 ± 5.73 | 8.34 ± 5.69 |
| Negative | −86.22 ± 6.09 | −97.23 ± 7.06 | 12.01 ± 7.08 | 11.97 ± 6.58 | |
| p-value | 0.026 | 0.318 | <0.001 | <0.001 | |
| HER2 status | Positive | −87.54 ± 5.71 | −97.56 ± 6.34 | 10.02 ± 6.79 | 10.03 ± 6.49 |
| Negative | −87.02 ± 6.97 | −96.29 ± 7.45 | 9.27 ± 6.29 | 9.43 ± 6.10 | |
| p-value | 0.488 | 0.122 | 0.336 | 0.426 | |
| Ki67 expression status | Positive | −86.72 ± 6.10 | −96.88 ± 6.83 | 10.16 ± 6.76 | 10.25 ± 6.42 |
| Negative | −88.01 ± 7.01 | −96.72 ± 7.37 | 8.72 ± 6.25 | 8.82 ± 6.17 | |
| p-value | 0.115 | 0.856 | 0.083 | 0.076 | |
| Recurrence | No recur | −87.74 ± 6.27 | −96.90 ± 6.74 | 9.16 ± 6.37 | 9.25 ± 6.17 |
| Recur | −83.35 ± 6.00 | −97.10 ± 8.62 | 13.75 ± 6.71 | 13.85 ± 5.91 | |
| p-value | <0.001 | 0.882 | <0.001 | <0.001 |
| Variables | p-Value | Hazard Ratio (95% CI) | |
|---|---|---|---|
| Age (1-year increase) | 0.562 | 1.01 (0.98–1.04) | |
| BMI (1 kg/m2 increase) | 0.283 | 0.93 (0.82–1.06) | |
| Menopausal status (pre vs. post) | 0.799 | 0.91 (0.44–1.89) | |
| T stage | T1 stage | - | 1.00 |
| T2 stage | 0.001 | 11.24 (2.62–48.25) | |
| T3 stage | <0.001 | 37.90 (8.17–175.80) | |
| N stage (N0 vs. N1-3) | 0.004 | 2.92 (1.42–6.09) | |
| Histologic grade | Grade 1 | - | 1.00 |
| Grade 2 | 0.873 | 1.10 (0.34–3.58) | |
| Grade 3 | 0.008 | 4.42 (1.48–13.16) | |
| ER status (positive vs. negative) | <0.001 | 3.41 (1.66–7.00) | |
| PR status (positive vs. negative) | <0.001 | 5.22 (2.32–11.74) | |
| HER2 status (positive vs. negative) | 0.254 | 0.65 (0.31–1.36) | |
| Ki67 index (negative vs. positive) | 0.005 | 7.79 (1.85–32.83) | |
| Triple negative tumor (no vs. yes) | 0.011 | 3.00 (1.28–7.03) | |
| Maximum SUV (1.0 increase) | <0.001 | 1.08 (1.03–1.13) | |
| MTV (1.0 cm3 increase) | <0.001 | 1.03 (1.02–1.04) | |
| TAT HU (1.0 HU increase) | <0.001 | 1.10 (1.05–1.16) | |
| CAT HU (1.0 HU increase) | 0.786 | 0.99 (0.94–1.05) | |
| HU difference (1.0 HU increase) | <0.001 | 1.10 (1.05–1.16) | |
| HU difference % (1.0% increase) | <0.001 | 1.12 (1.06–1.18) | |
| Models | TAT HU | HU Difference | HU Difference % | |
|---|---|---|---|---|
| (1.0 HU Increase) | (1.0 HU Increase) | (1.0% Increase) | ||
| Model 1 * | p-value | 0.012 | 0.001 | 0.001 |
| Hazard ratio | 1.08 | 1.07 | 1.09 | |
| (95% CI) | (1.02–1.15) | (1.02–1.19) | (1.02–1.15) | |
| Model 2 † | p-value | 0.018 | 0.044 | 0.033 |
| Hazard ratio | 1.08 | 1.06 | 1.07 | |
| (95% CI) | (1.01–1.16) | (1.00–1.12) | (1.01–1.14) | |
| Model 3 ‡ | p-value | 0.014 | 0.054 | 0.038 |
| Hazard ratio | 1.09 | 1.05 | 1.07 | |
| (95% CI) | (1.02–1.16) | (1.00–1.11) | (1.00–1.13) | |
| TAT HU | T Stage | ||
|---|---|---|---|
| T1 Stage | T2–T3 Stage | ||
| TAT HU | <−82.50 HU | 1/117 | 14/110 |
| (0.9%) | (12.7%) | ||
| ≥−82.50 HU | 1/19 | 14/41 | |
| (5.3%) | (34.1%) | ||
| p-value | 0.260 | 0.003 | |
© 2019 by the authors. Licensee MDPI, Basel, Switzerland. This article is an open access article distributed under the terms and conditions of the Creative Commons Attribution (CC BY) license (http://creativecommons.org/licenses/by/4.0/).
Share and Cite
Lee, J.W.; Kim, S.Y.; Lee, H.J.; Han, S.W.; Lee, J.E.; Lee, S.M. Prognostic Significance of CT-Attenuation of Tumor-Adjacent Breast Adipose Tissue in Breast Cancer Patients with Surgical Resection. Cancers 2019, 11, 1135. https://doi.org/10.3390/cancers11081135
Lee JW, Kim SY, Lee HJ, Han SW, Lee JE, Lee SM. Prognostic Significance of CT-Attenuation of Tumor-Adjacent Breast Adipose Tissue in Breast Cancer Patients with Surgical Resection. Cancers. 2019; 11(8):1135. https://doi.org/10.3390/cancers11081135
Chicago/Turabian StyleLee, Jeong Won, Sung Yong Kim, Hyun Ju Lee, Sun Wook Han, Jong Eun Lee, and Sang Mi Lee. 2019. "Prognostic Significance of CT-Attenuation of Tumor-Adjacent Breast Adipose Tissue in Breast Cancer Patients with Surgical Resection" Cancers 11, no. 8: 1135. https://doi.org/10.3390/cancers11081135
APA StyleLee, J. W., Kim, S. Y., Lee, H. J., Han, S. W., Lee, J. E., & Lee, S. M. (2019). Prognostic Significance of CT-Attenuation of Tumor-Adjacent Breast Adipose Tissue in Breast Cancer Patients with Surgical Resection. Cancers, 11(8), 1135. https://doi.org/10.3390/cancers11081135