Trapping a Hot Drop on a Superhydrophobic Surface with Rapid Condensation or Microtexture Melting


Abstract
1. Introduction
2. Materials and Methods
3. Results
4. Discussion
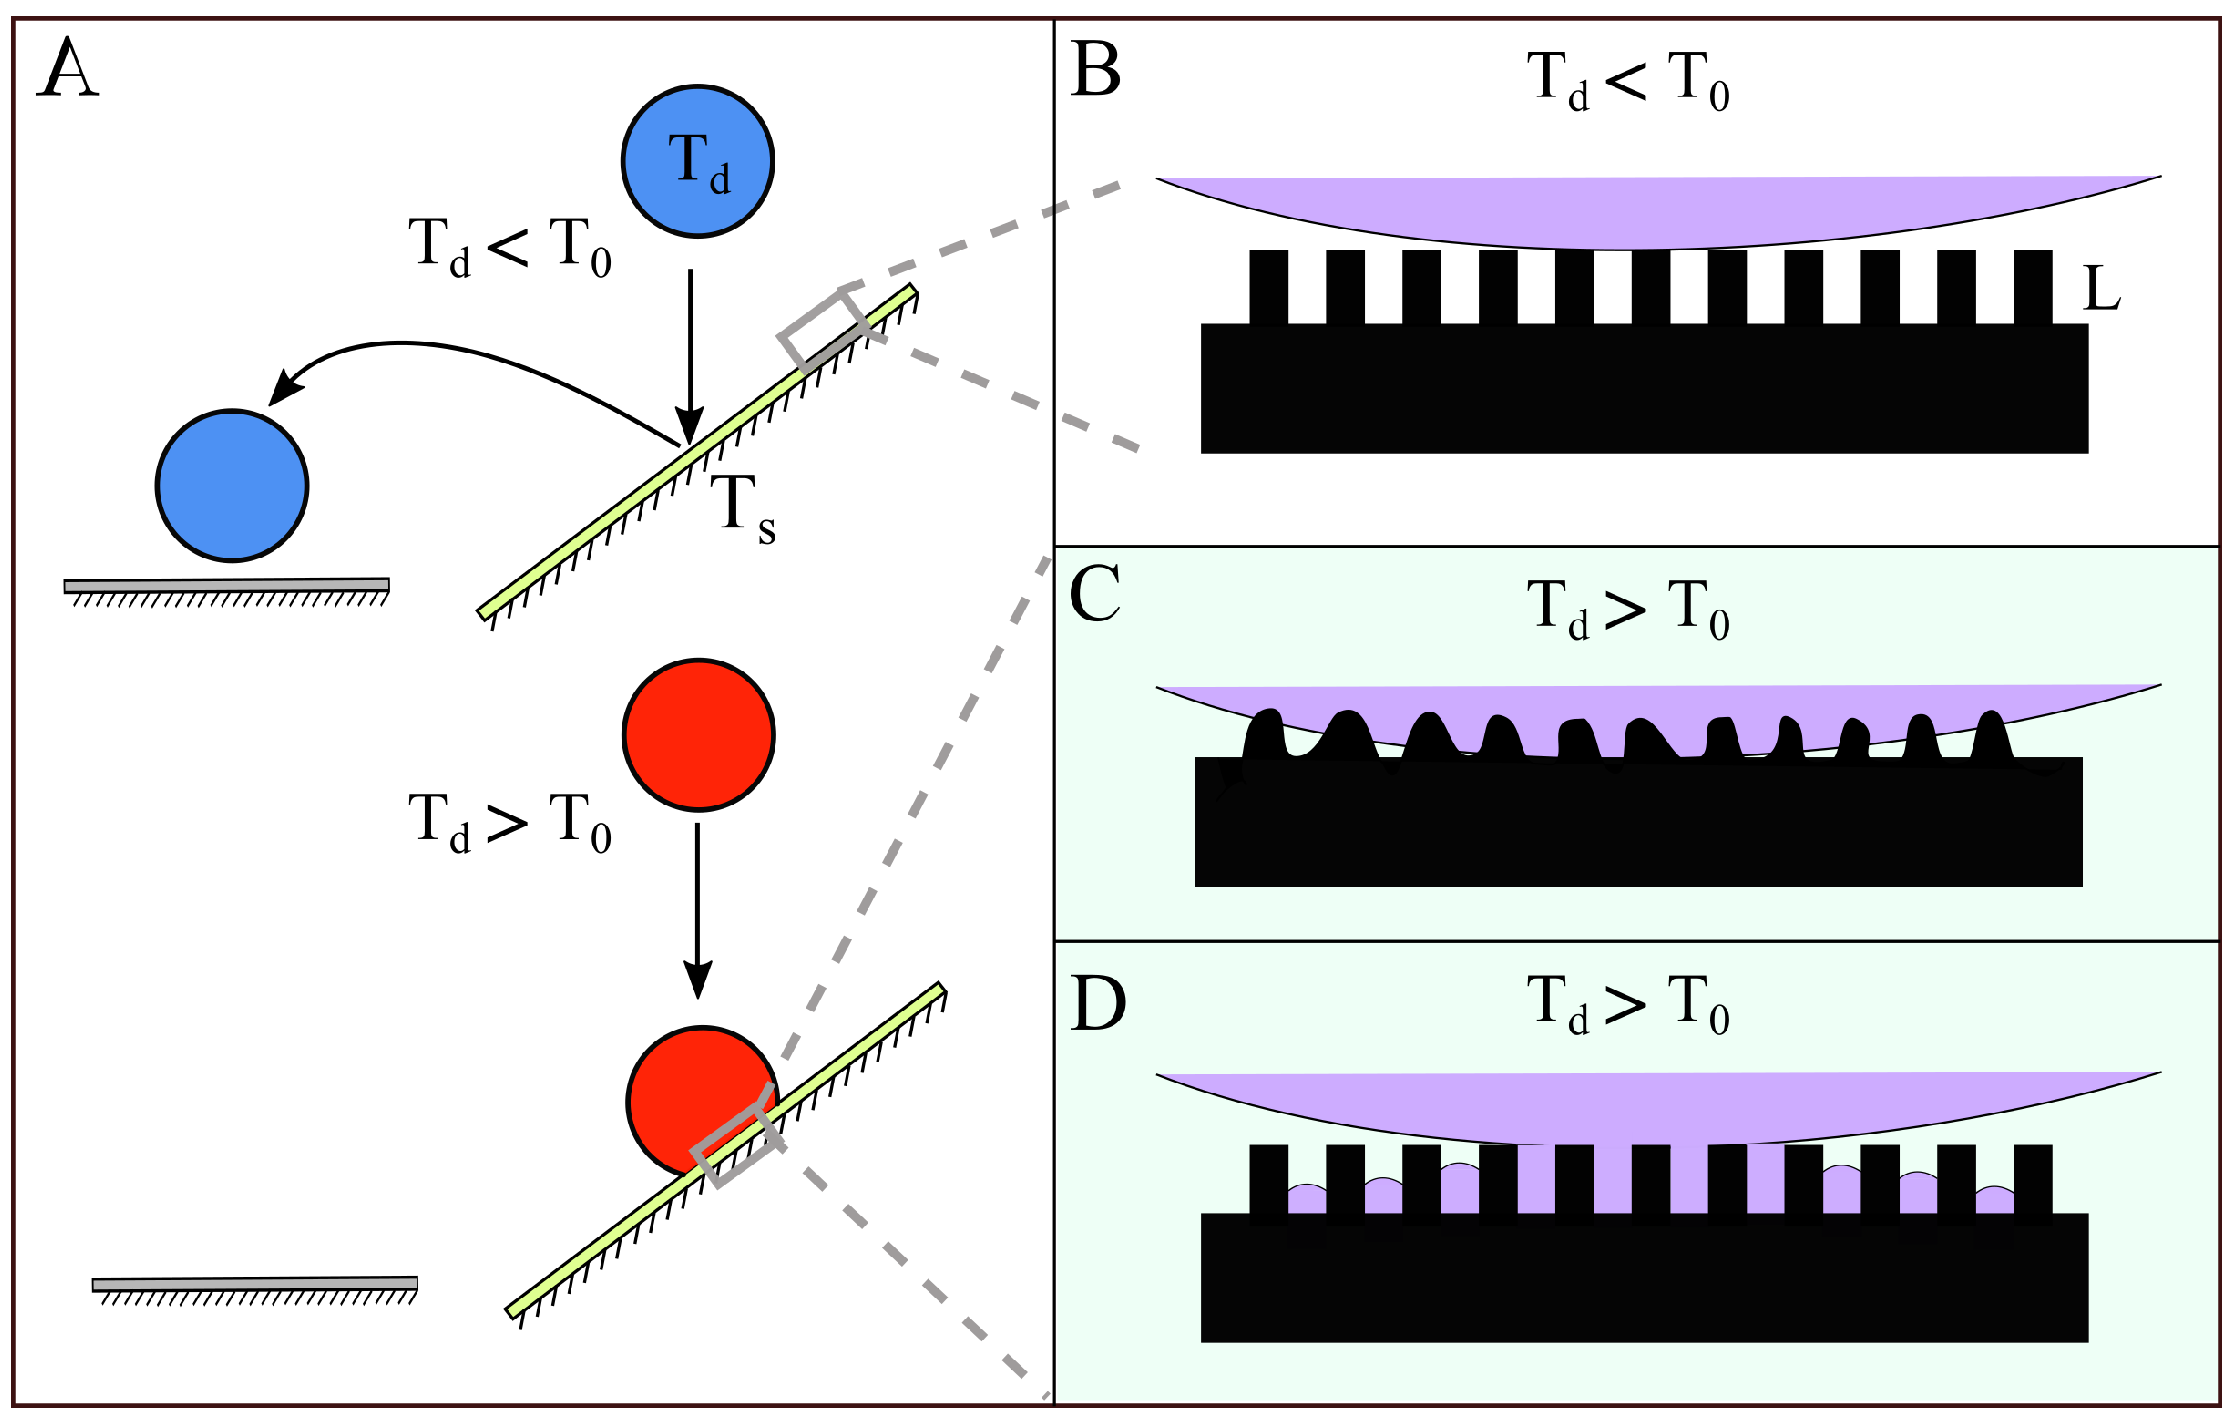
4.1. Melting of the Surface Microtexture
4.2. Condensation of the Vapor within the Superhydrophobic Texture
5. Conclusions
Author Contributions
Funding
Acknowledgments
Conflicts of Interest
References
- Richard, D.; Clanet, C.; Quéré, D. Surface phenomena: Contact time of a bouncing drop. Nature 2002, 417, 811. [Google Scholar] [CrossRef] [PubMed]
- Quéré, D. Non-sticking drops. Rep. Prog. Phys. 2005, 68, 2495. [Google Scholar] [CrossRef]
- Yarin, A.L. Drop impact dynamics: Splashing, spreading, receding, bouncing... Annu. Rev. Fluid Mech. 2006, 38, 159–192. [Google Scholar] [CrossRef]
- Yu, X.; Wang, Z.; Jiang, Y.; Shi, F.; Zhang, X. Reversible pH-responsive surface: From superhydrophobicity to superhydrophilicity. Adv. Mater. 2005, 17, 1289–1293. [Google Scholar] [CrossRef]
- Xia, F.; Ge, H.; Hou, Y.; Sun, T.; Chen, L.; Zhang, G.; Jiang, L. Multiresponsive surfaces change between superhydrophilicity and superhydrophobicity. Adv. Mater. 2007, 19, 2520–2524. [Google Scholar] [CrossRef]
- Li, B.; Zhang, J. Durable and self-healing superamphiphobic coatings repellent even to hot liquids. Chem. Comrefmun. 2016, 52, 2744–2747. [Google Scholar] [CrossRef] [PubMed]
- Cassie, A.; Baxter, S. Wettability of porous surfaces. Trans. Faraday Soc. 1944, 40, 546–551. [Google Scholar] [CrossRef]
- Wenzel, R.N. Resistance of solid surfaces to wetting by water. Ind. Eng. Chem. 1936, 28, 988–994. [Google Scholar] [CrossRef]
- Koishi, T.; Yasuoka, K.; Fujikawa, S.; Ebisuzaki, T.; Zeng, X.C. Coexistence and transition between Cassie and Wenzel state on pillared hydrophobic surface. Proc. Natl. Acad. Sci. USA 2009, 106, 8435–8440. [Google Scholar] [CrossRef] [PubMed]
- Liu, Y.; Chen, X.; Xin, J. Can superhydrophobic surfaces repel hot water? J. Mater. Chem. 2009, 19, 5602–5611. [Google Scholar] [CrossRef]
- Cheng, Y.T.; Rodak, D.E. Is the lotus leaf superhydrophobic? Appl. Phys. Lett. 2005, 86, 144101. [Google Scholar] [CrossRef]
- Yin, L.; Wang, Q.; Xue, J.; Ding, J.; Chen, Q. Stability of superhydrophobicity of lotus leaf under extreme humidity. Chem. Lett. 2010, 39, 816–817. [Google Scholar] [CrossRef]
- Yu, Z.J.; Yang, J.; Wan, F.; Ge, Q.; Yang, L.L.; Ding, Z.L.; Yang, D.Q.; Sacher, E.; Isimjan, T.T. How to repel hot water from a superhydrophobic surface? J. Mater. Chem. A 2014, 2, 10639–10646. [Google Scholar] [CrossRef]
- Bartolo, D.; Bouamrirene, F.; Verneuil, E.; Buguin, A.; Silberzan, P.; Moulinet, S. Bouncing or sticky droplets: Impalement transitions on superhydrophobic micropatterned surfaces. EPL 2006, 74, 299. [Google Scholar] [CrossRef]
- Reyssat, M.; Richard, D.; Clanet, C.; Quéré, D. Dynamical superhydrophobicity. Faraday Discuss. 2010, 146, 19–33. [Google Scholar] [CrossRef] [PubMed]
- Bird, J.C.; Dhiman, R.; Kwon, H.M.; Varanasi, K.K. Reducing the contact time of a bouncing drop. Nature 2013, 503, 385. [Google Scholar] [CrossRef] [PubMed]
- Liu, Y.; Moevius, L.; Xu, X.; Qian, T.; Yeomans, J.M.; Wang, Z. Pancake bouncing on superhydrophobic surfaces. Nature Phys. 2014, 10, 515. [Google Scholar] [CrossRef] [PubMed]
- Liu, Y.; Andrew, M.; Li, J.; Yeomans, J.M.; Wang, Z. Symmetry breaking in drop bouncing on curved surfaces. Nature Commun. 2015, 6, 10034. [Google Scholar] [CrossRef] [PubMed]
- Patterson, C.J.; Shiri, S.; Bird, J.C. Macrotextured spoked surfaces reduce the residence time of a bouncing Leidenfrost drop. J. Phys. Condens. Matter 2017, 29, 064007. [Google Scholar] [CrossRef] [PubMed]
- Shiri, S.; Bird, J.C. Heat exchange between a bouncing drop and a superhydrophobic substrate. Proc. Natl. Acad. Sci. USA 2017, 114, 6930–6935. [Google Scholar] [CrossRef] [PubMed]
- Sugden, S. VI.—The variation of surface tension with temperature and some related functions. J. Chem. Soc. Trans. 1924, 125, 32–41. [Google Scholar] [CrossRef]
- Loglio, G.; Ficalbi, A.; Cini, R. A new evaluation of the surface tension temperature coefficients for water. J. Colloid Interface Sci. 1978, 64, 198. [Google Scholar] [CrossRef]
- Khattab, I.S.; Bandarkar, F.; Fakhree, M.A.A.; Jouyban, A. Density, viscosity, and surface tension of water+ ethanol mixtures from 293 to 323K. Korean J. Chem. Eng. 2012, 29, 812–817. [Google Scholar] [CrossRef]
- Rathjen, K.A.; Jiji, L.M. Heat conduction with melting or freezing in a corner. J. Heat Transf. 1971, 93, 101–109. [Google Scholar] [CrossRef]
- Cussler, E.L. Diffusion: Mass Transfer in Fluid Systems; Cambridge University Press: New York, NY, USA, 2009. [Google Scholar]
- Kim, S.; Kim, K.J. Dropwise condensation modeling suitable for superhydrophobic surfaces. J. Heat Transf. 2011, 133, 081502. [Google Scholar] [CrossRef]
- Rykaczewski, K. Microdroplet growth mechanism during water condensation on superhydrophobic surfaces. Langmuir 2012, 28, 7720–7729. [Google Scholar] [CrossRef] [PubMed]
- Mills, A.; Seban, R. The condensation coefficient of water. Int. J. Heat Mass Transf. 1967, 10, 1815–1827. [Google Scholar] [CrossRef]


© 2018 by the authors. Licensee MDPI, Basel, Switzerland. This article is an open access article distributed under the terms and conditions of the Creative Commons Attribution (CC BY) license (http://creativecommons.org/licenses/by/4.0/).
Share and Cite
Shiri, S.; Murrizi, A.; Bird, J.C. Trapping a Hot Drop on a Superhydrophobic Surface with Rapid Condensation or Microtexture Melting. Micromachines 2018, 9, 566. https://doi.org/10.3390/mi9110566
Shiri S, Murrizi A, Bird JC. Trapping a Hot Drop on a Superhydrophobic Surface with Rapid Condensation or Microtexture Melting. Micromachines. 2018; 9(11):566. https://doi.org/10.3390/mi9110566
Chicago/Turabian StyleShiri, Samira, Armela Murrizi, and James C. Bird. 2018. "Trapping a Hot Drop on a Superhydrophobic Surface with Rapid Condensation or Microtexture Melting" Micromachines 9, no. 11: 566. https://doi.org/10.3390/mi9110566
APA StyleShiri, S., Murrizi, A., & Bird, J. C. (2018). Trapping a Hot Drop on a Superhydrophobic Surface with Rapid Condensation or Microtexture Melting. Micromachines, 9(11), 566. https://doi.org/10.3390/mi9110566