Article

Dynamics of Microvalve Operations in Integrated Microfluidics

Department of Mechanical and Biomedical Engineering, City University of Hong Kong, Hong Kong
*
Author to whom correspondence should be addressed.
Micromachines 2014, 5(1), 50-65; https://doi.org/10.3390/mi5010050
Submission received: 15 December 2013 / Revised: 20 January 2014 / Accepted: 21 January 2014 / Published: 10 February 2014

Abstract

:
Pneumatic microvalves are widely used key components for automating liquid manipulation and flow control in microfluidics for more than one decade. Due to their robust operations and the ease of fabrication, tremendous microfluidic systems have been developed with the multiple microvalves for higher throughput and extended functionalities. Therefore, operation performance of the microvalves in the integrated microfluidic devices is crucial to the related applications, in fields such as micro-flows, cell analyses, drug discovery, and physical/chemical detections. It has been reported that operation performance of the microvalves are highly sensitive to the device configuration and pressurization scheme. This implies the further development of integrated microfluidics with a larger number of the valves may suffer the problems of undetermined microvalve behaviors during operations, which can become an unavoidable hurdle in the device design and optimization processes. Herein, we characterize responses of the individual microvalves for different operation configurations, e.g., membrane thicknesses and driving pressures. We investigate also the effects in microfluidics integrated with the more valves, through experiments, modeling and simulations. We show that dynamics of the microvalves is indeed influenced by the configurations, levels of design complexity and positions in the devices. Overall, taken dynamics of the microvalve responses into considerations, this work provides insights and guidelines for better designs of integrated microfluidics for the future applications requiring higher throughput and improved operation performance.

1. Introduction

Since the past two decades, miniaturization of the fluidic operations had become the great demand for applications requiring precise control of liquid manipulations [1,2]. Microfluidic systems typically combined with individual components such as valves, pumps [3], mixers [4,5], filters/sorters [6], sensors and heaters [7]. The related technologies [1,8] have already been commercialized into highly automated products, e.g., Fluidigm, South San Francisco, CA, USA [9]. Multilayer soft lithography for PDMS emerged as a ground-breaking technology for numerous biological and chemical applications, such as protein crystallization [10], blood diagnostics [11], chemical synthesis [10], bio-molecular separations [12,13,14], enzymatic assays [15,16], immuno-hybridization reactions [17], large-scale single-molecule assays [18], self-contained cell culture [19], cell sorting [20], cell-based screening [21], drug screening [22], self-sustainable microfluidic cell cultures [4,23], and oxygenated microenvironments for mammalian and bacterial cells [24]. Thorsen et al. [25] demonstrated a microfluidic platform as a milestone of the large-scale integration, which contained thousands of pneumatic microvalves and hundreds of individually addressable microchambers. A microfabricated emulsion generator array [1,18,26,27] has been established for high-throughput single-cell analyses. A microfluidic platform integrated with microarray technology for cellular viral-host proteomic interaction analysis has also been reported recently [28].
There have been increasing interests in applying dynamics of the pneumatic microvalves in automated microfluidic operations. For example, an array of microvalves was configured to control pulsed sample flows for a micro-scale flow injection analysis [29]. Due to elasticity of the valve membrane materials (polydimethylsiloxane (PDMS)) [30], the applied pressure in an overhead actuation channel can modulate flow rates in the working flow microchannels by defining the membrane deflection and the corresponding fluidic resistance [31]. Moreover, the pneumatic rotary pumps were applied to mix a defined amount of medium in closed microchambers [23] based on the Taylor dispersion effect [32]. While the pneumatic microvalve has proven as an effective fluidic actuation component, the essential precise controls of membrane deflections highly depend on the pneumatic pump configurations, such as the valve dimensions and pressure sources [4]. Indeed, considering a microvalve gates an underneath flow channel based on deflection of the elastomeric valve membrane, responses of the microvalve should rely on physical effects such as the membrane stiffness and the fluidic resistance in liquid flows. The microvalves in microfluidic devices can have distinct levels of complexity (e.g., quantities and arrangements), and therefore physical characteristics of the individual microvalves can vary for different device designs. Together, there is necessity for the detailed analysis of microvalve operations for different degrees of microfluidic integration. The universal strategy converting the microvalve-driven microfluidic devices into mathematical models would be extremely helpful in predicting the microvalve responses, and further provide directions to optimize overall performance of the devices.
Typically, microfluidic devices fabricated by soft lithography have been modeled as networks consisting of multiple lumped elements, which can be described by simple analytical relation individually [33]. For example, Bourouia and Grandchamp modeled vibration-based micropumps by defining non-linear mechanical properties for the silicon flat membranes and check-valves [34]. Mastrangelo’s group has established multiple microfluidic devices using the lumped element strategy to regulate chemical concentrations defined by difference schemes [35], e.g., the “concentration digital-to-analog converter” employed multiple inputs as a binary number to generate discretized chemical concentrations [36], the “pulse code modulator” defining the chemical concentration by generating a flowing stream of solute-solvent plugs with variable lengths and mixing the liquids along a long microchannel [37], and a microchannel network as a band-pass filter for the variation of chemical concentrations in a solution [38]. In addition, Hong and Pan described a flow rate-controlled switch as a lumped element for the design of micro-flow regulation devices [39].
In this work, we systematically investigate dynamic responses of the pneumatic microvalves in the integrated microfluidics conditions. Though a few studies on the pneumatic microvalves have been reported previously [31,40,41], their focuses were not related to the large-scale integration aspect. Based on the multilayer soft lithography [3], we first design and fabricate microfluidic devices consisting of a manageable number of microvalves, which can represent the major physical settings of the general valve-based microfluidics. We quantify membrane stiffnesses of the individual microvalves under both static and stepwise pressure actuations via the experiments under different operation conditions. On the other hand, we simplify the system characteristics into mathematical models by considering only dominant physical factors in the multiple-valve microfluidic devices, i.e., membrane stiffnesses and fluidic resistances in channels. We then adopt the experimental stiffness values and fit them in the models to predict responses of every microvalve in the devices. Comparing these predictions with the corresponding experimental measurements can validate the proposed modeling strategy for the general integrated microfluidics.

2. Methods

2.1. Fabrication

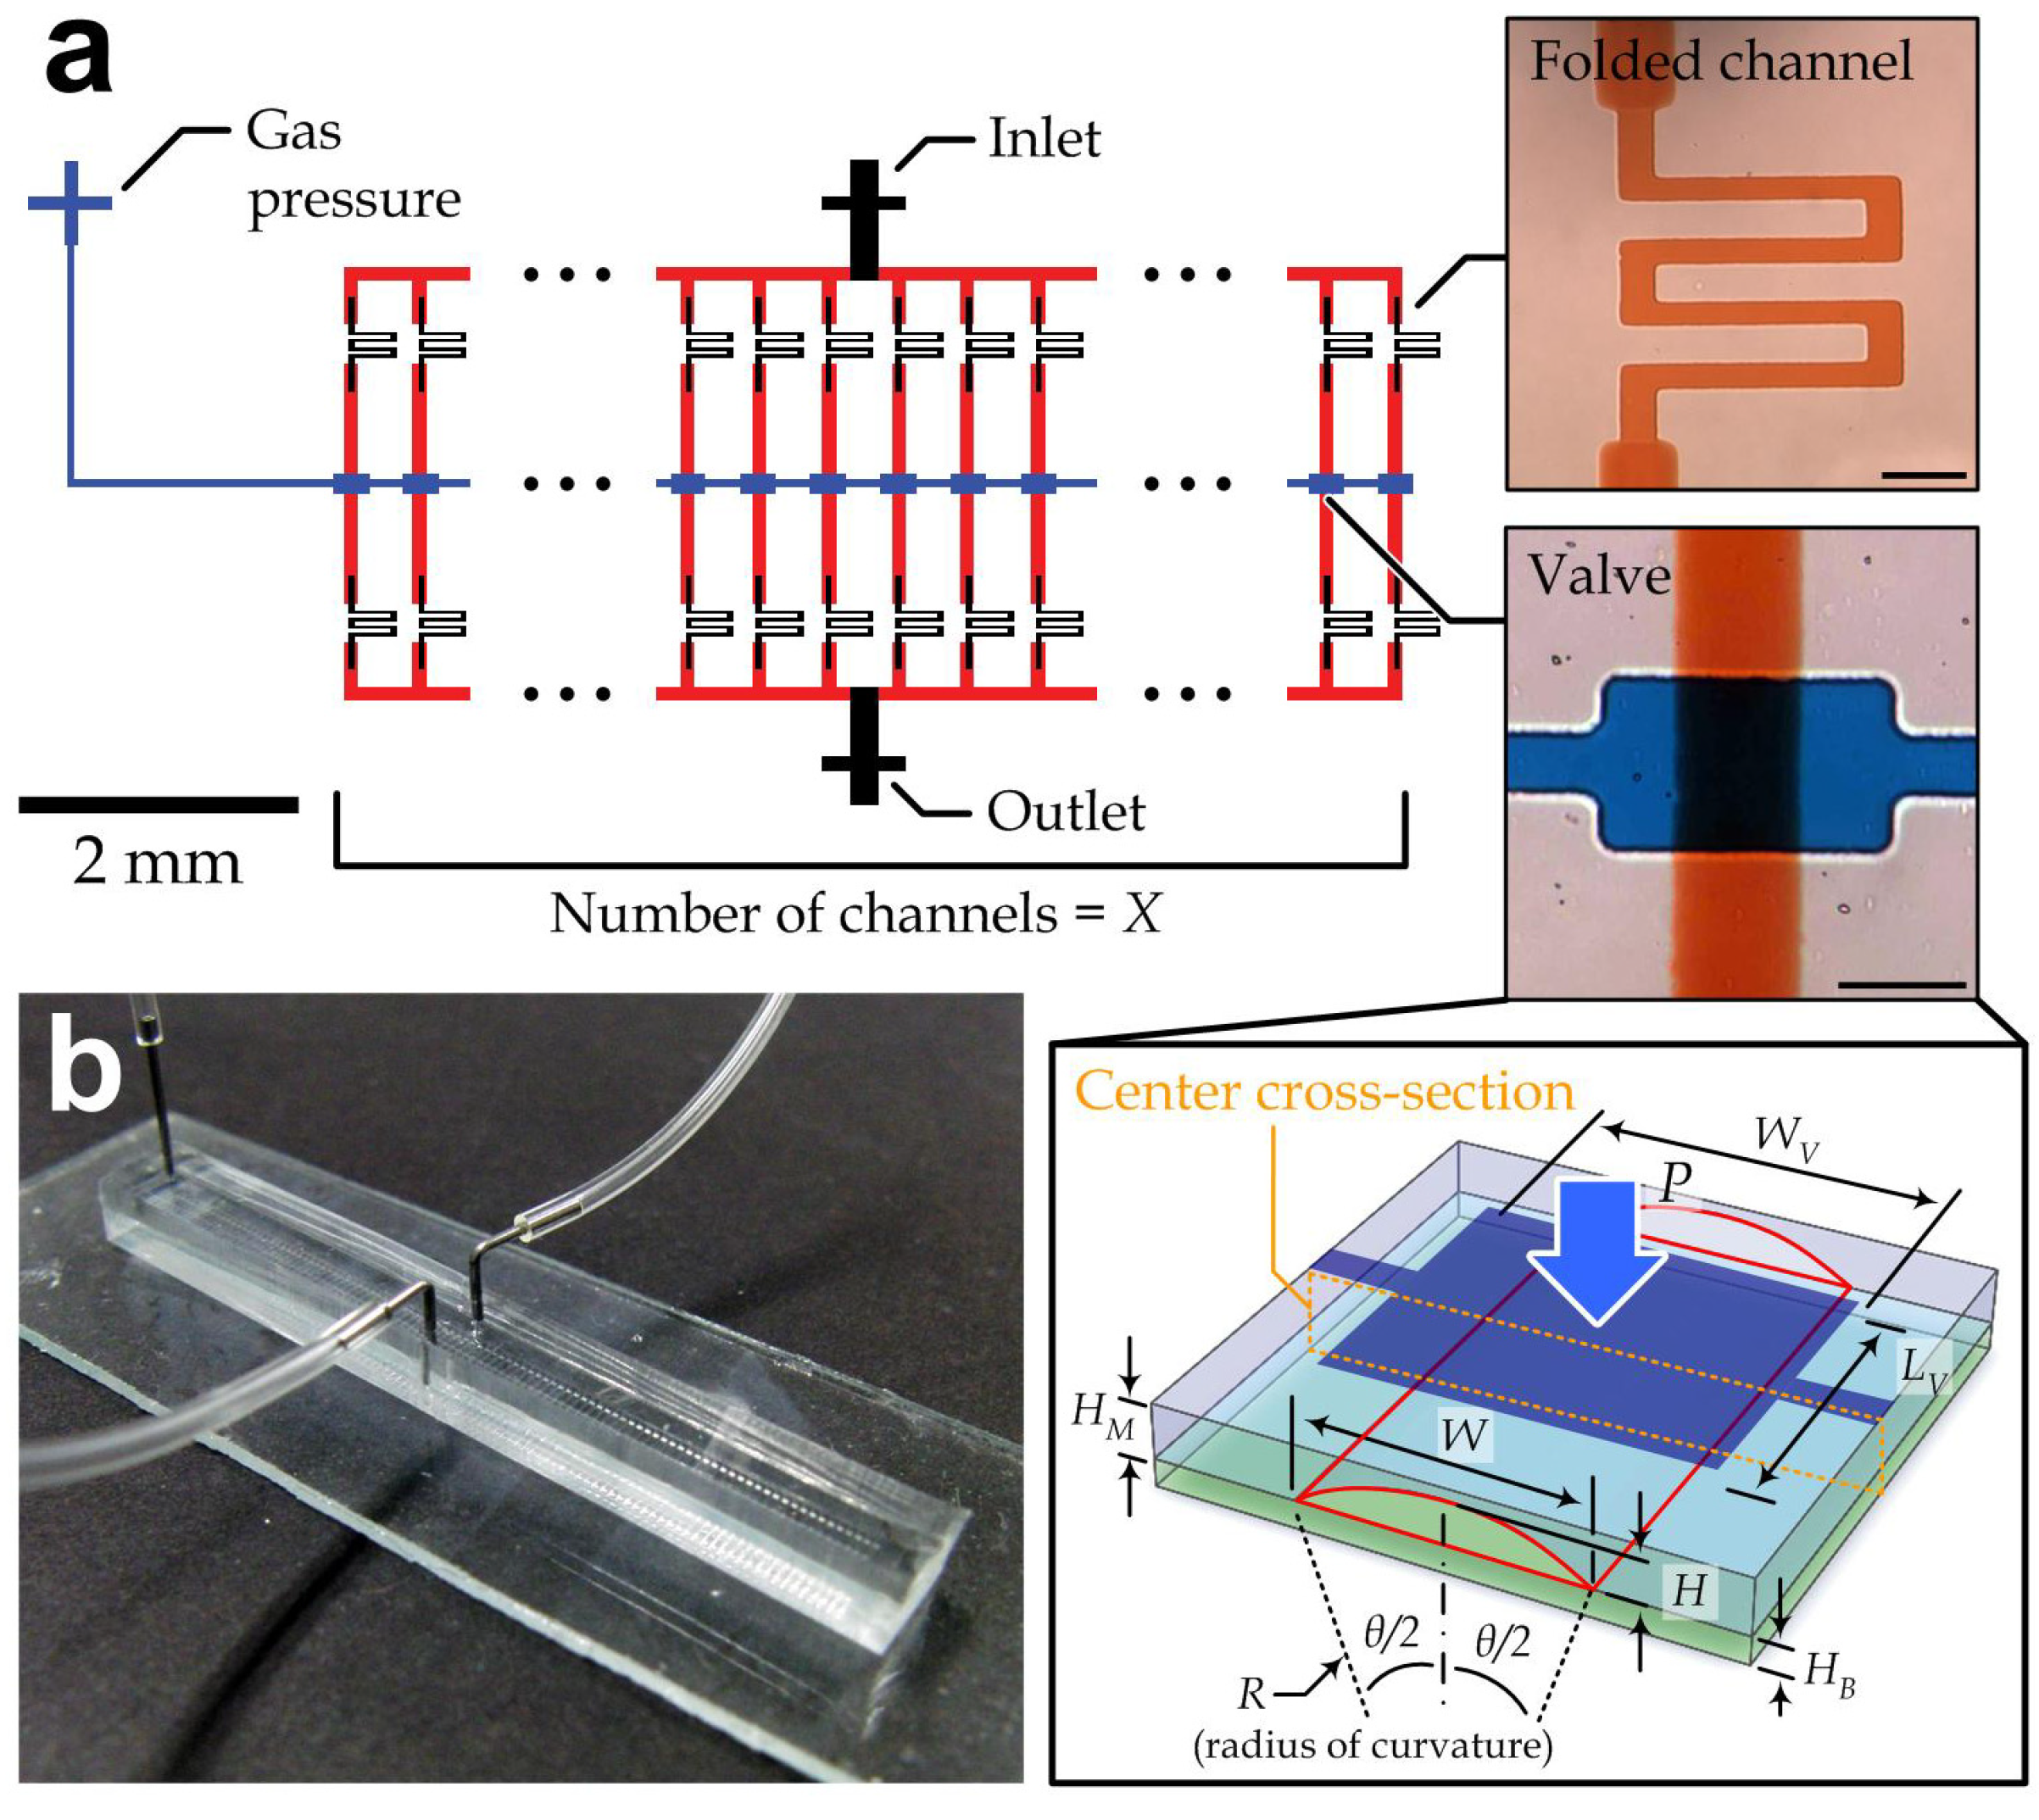
Two molds were fabricated for microstructures required in the microvalve devices based on photolithography as shown in Figure 1. To fabricate the mold for the control layer (blue patterns in Figure 1a), SU-8 negative photoresist (SU-8 25, Microchem, Newton, MA, USA) photoresist was spin-coated on a silicon wafer (~2400 rpm) for a thickness of 20 μm, prebaked at 65 °C for 2 min and soft-baked at 95 °C for 5 min on a hot plate, followed by ultraviolet (UV) exposure using a mask including the desired micro-patterns for 40 s (4 times of 10-second exposures). Post exposure bake was carried out at 65 °C for 1 min and at 95 °C for 2 min. SU-8 developer (Microchem) was then applied to remove the unexposed photoresist. To enhance mechanical properties of the cross-linked photoresist, the mold was baked again on a hot plate at 65 °C for 30 min.
For the second mold, the fabrication of SU-8 on a silicon wafer was adopted again for narrow channels (width: 20 µm) in the flow layers (black patterns in Figure 1a), with a thickness of ~5 µm (SU-8, Microchem). AZ4620 photoresist (AZ Electronic Materials, Branchburg, NJ, USA) was then patterned on the mold for the rest flow channels (red patterns in Figure 1a) using photolithography. Briefly, hexamethyldisilazane (Sigma-aldrich, St. Louis, MO, USA) was first applied on the patterned SU-8/silicon wafer in order to promote adhesion of AZ4620 on silicon. AZ4620 was spin-coated at 1400 rpm for 30 s, baked at 95 °C for 30 min and exposed under UV light for 80 s (4 times of 20-s exposures). After developing the photoresist, the mold was reflowed on a hot plate for 1 min at 140 °C, which is at the temperature region for glass-liquid transition of the photoresist. The reflow process can create rounded profiles of the mold structures and of the microchannel cross sections in the PDMS devices. To facilitate the release of PDMS layers from substrates, the two molds were silanized with a high-molecular-weight trichloro-perfluorooctyl saline (Sigma-Aldrich) in a chemical fume hood for 2 h before the downstream device manufacturing processes.
Figure 1. (a) Design layout of the microvalve devices. Upper-right insets: a folded flow channel structure and a region overlapping with flow channels and valve chambers. The channels/chambers were filled with color dyes for better visualization. Lower-right inset: Individual microvalve structure labeled with key configuration parameters. This structure only shows the two spin-coated polydimethylsiloxane (PDMS) layers, whereas the upper thick PDMS layer and the underneath glass slide are skipped. Scale bar in inset: 100 µm; (b) Fabricated microfluidic device containing 100 microvalves.
Micromachines 05 00050 g001
Afterwards, PDMS pre-polymer (Sylgard 184, Dow Corning, Midland, MI, USA) was prepared by mixing the monomer and the curing agent with a 10:1 volumetric ratio using a glass rod. To remove air bubbles trapped in PDMS during mixing, vacuum was applied to degas the pre-polymer in a vacuum bell jar. The PDMS was then poured onto the mold fabricated with the control channel patterns and baked in an oven at 80 °C for 20 min. The PDMS substrates with the control channel patterns were cut from the mold with a traversing blade. The substrates were then peeled off and punched at the channel openings using a hole-chopper (Cat# 15071, Harris Uni-Core, Ted Pella, Inc., Redding, CA, USA) for gas pressure connections. On the other hand, PDMS pre-polymer was spin-coated for 60 s on the flow-channel AZ/silicon mold at a specified rotational speed (2400, 2600, 2800 or 3200 rpm) for different thicknesses (34, 28, 25 or 18 µm), and on glass slides at 3000 rpm for a thickness of ~20 µm for the PDMS base layer (HB in Figure 1a). The spin-coated PDMS layer with the mold partially cured in an oven at 80 °C for 9 min, while the PDMS layers on glass slides were baked at 80 °C for >2 h. Afterwards, the control-channel PDMS substrates were subsequently aligned and placed onto the flow-channel PDMS layer under a stereo microscope (JSZ-6S, Yee Mau Industrial Co., Hong Kong). The bound PDMS substrates were baked again in an oven at for 2 h at 80 °C such that further curing of the PDMS interface could induce permanent PDMS bonding. The lower flow-channel layer was then chopped along the device boundaries using a razor blade. After peeling off the PDMS substrates, flow-channel inlets and outlets were generated by punching holes through the substrates. Oxygen plasma treatment (PDC-002, Harrick Plasma, Ithaca, NY, USA) with power 30 W for 30 s was applied to the multilayer PDMS substrates and the PDMS/glass slides, in order to activate surfaces on both the channel sides. Subsequently, permanent seal of the flow channels was achieved by bonding the surfaces together. To finish the fabrication as shown in Figure 1b, the devices were baked in an oven overnight to ensure thorough PDMS curing.

2.2. Measurement of Valve Responses

We observed dynamics of the microvalves under an inverted optical microscope (PW-BDS500EPI, Proway Optics and Electronics, Ningbo, China) equipped with a cooled CCD digital camera (TCC5.01CE, Tucsen Imaging Technology, Fuzhou, China). Fluidic connections for both the control and flow channels were achieved by inserting stainless steel adaptors (New England Small Tube, Litchfield, NH, USA) and Tygon tubing (Cole-Parmer, Vernon Hills, IL, USA). To prepare the experiments, we injected red dye (McCormick, Hunt Valley, MD, USA) into the flow channels using syringes for better visualization, while distilled water was pressurized into the control channels at ~5 psi.
In this work, measurements of the valve responses included two major aspects: the membrane stiffness and the transient response. We investigated the membrane stiffness by recording microscopic images of the membrane deflections under different static pressures along the control channels. For the dynamic responses, we applied a step-signal to an electro-fluidic valve (LHDA1211111H, Lee Products, Buckinghamshire, UK) to switch the driving pressures for the microvalve actuation or deactuation, while the signal was simultaneously fed also to a light emitting diode (LED) for visualizing the command. We used a high-speed (1000 frames per second) digital camera (EX-FH20, Casio, Tokyo, Japan) to capture both the LED illumination and the deformation of the microvalves through an eyepiece on the microscope. The LED has only negligible time delay (<70 ns) comparing to the frame-refreshing time in the videos (1 ms). Afterwards, we extracted snapshots of the captured videos and analyzed for response time of the microvalves under different operation configurations.

2.3. Membrane Deformation Simulation

Mechanical deformations of single valves with defined configurations were computed by commercial finite element analysis software (COMSOL Multiphysics 4.3, COMSOL, Burlington, MA, USA). A two-dimensional computational model with HM = 25 µm was constructed for the valve “center” cross-section as indicated in the inset of Figure 1a. Because of the large deformation during the valve operation, we adopted the Neo-Hookean hyperelastic model [42] (Lamé constant µ = 678.6 kPa; Lamé constant λ = 1.0714 MPa) with the density ρ = 920 kg/m3, the Young’s modulus E = 2.2 MPa [43], and the Poisson’s ratio γ = 0.4 [44], in order to describe the mechanical behaviors of PDMS. For the material domains, triangular meshes were generated with an average element size of ~0.2 µm2; and all peripheries of the flow channel region were set as contact pairs. The boundary conditions were defined according to operations of the single valves in the practical implementation.

2.4. Simulation of Lumped Circuit Models for Multiple-Valve Devices

We simplified physical characteristics of the devices with different numbers of multiple microvalves as lumped circuit models to simulate the dynamic responses of all the microvalves. Subsequently, we expressed each lumped model as a series of time-dependent differential equations. (Details are described later in the Section Lumped Modeling for Prediction of Valve Dynamics.) We wrote MATLAB scripts (version R2010b, Mathworks, Natick, MA, USA) to numerically solve these equations by a finite different scheme similar to the Crank-Nicolson method, which discretizes the time-space as an average of forward and backward Euler approximations to achieve second-order convergence in the time-space.

2.5. Statistics

p-Values were calculated using the two-tail Student’s t-test to identify whether there was a significant change for two selected sets of experimental data. Since the data sets in the current study had independent sample sizes and standard deviations, we adopted a standard t-test scheme, also known as the Welch’s t-test. In all comparisons, we defined a significant change by p < 0.05.

3. Results and Discussion

3.1. Device Configuration

We designed and repeatedly manufactured microfluidic devices to analyze the functional responses in the microfluidics integrated with multiple pneumatic microvalves. These devices were fabricated with the two-layer soft lithography [3] with a control channel layer overhead the flow channels (Figure 1). We considered the microfluidic designs consisting of multiple pneumatic microvalves (1 to 100 microvalves) connected in serial. In essence, these testing devices should reflect major dynamics of the typical integrated microfluidics, which has analogous device configurations with multiple microvalves in the control channels. The microvalves were designed to gate parallel microchannels sharing the same liquid inlet and outlet (Figure 1b).
Here, we considered fixed dimensions of the upper valve chambers (length: LV = 150 µm and width: WV = 200 µm) and the flow channels (width: W = 100 µm, center height: H and radius of surface curvature: R) as shown in Figure 1a. We calculated the cross-section geometry of a reflowed channel (Figure 1a) by correlating a relation that the cross-section area after reflow was unchanged:
θ R2 / 2 − W (RH) / 2 = WHο
where R is the radius of curvature, θ is the arc angle of the channel surface profile, and Hο is the height of channel structures on the mold before reflow. With the measurable dimensions (W and Hο) of the fabricated microchannels, we further applied the geometric relations to solve for R and H:
tan(θ / 2) = W / [2 (RH)]
and
R = W2 / (8H) + H / 2
The microfluidic devices used in this study had W = 100 μm and Hο = 10 μm and hence we obtained that R = 92.14 µm and H = 14.75 µm. In our studies, we investigated the device operations by considering different thicknesses of the PDMS membrane layers (HM) and applied pressures on the membranes (p).

3.2. Individual Membrane Deformation

Characterization of the valve deformation was performed by both experimental and computational studies. We fabricated the single-valve devices with different spin-coated PDMS thickness (HM) and recorded microscopic images of the microvalves for different driving pressures. Figure 2a shows that the color of a microvalve region in a channel injected with a red dye changed greatly under a larger driving pressure. Considering that the intensity level should reflect the amount of liquid and hence the channel volume in the microvalve region, we wrote MATLAB scripts to quantify the corresponding membrane deflections using the intensity changes in the entire areas (white box in Figure 2a) and the center slices (black box in Figure 2a) of the valve regions indicated in Figure 2a (upper left). Additionally, we performed simulations to validate the correlations between the membrane deflections and the intensity changes. Because the membrane deflections at the center cross-sections (Figure 1a) can be simplified as two-dimensional models based on the geometric symmetry, we constructed numerical models representing the “center” cross-sections for and defined the boundary conditions accordingly. Figure 2b shows a model consisting of a control channel, a flow channel and a base; and their dimensions matches the device configuration adopted in this work. We then imposed compressive pressures on the membrane tops of the models, ranging from 0 psi to 12 psi, until the valve closure was obtained. We compared the simulated membrane deflections (Figure 2b) with the experimental intensities under the sample device conditions with reasonable agreement (Figure 2c, left plot). This correlation implies that the intensity changes over the entire valve areas should reflect the overall membrane deflections. In particular, Figure 2c (right plot) indicates that even when the valve closure is obtained at ~6.5 psi (without any red dye at the “center region”), the membranes can further deflect under higher driving pressures (the “entire valve” curve).
Figure 2. (a) Photographs of a representative microvalve under different driving pressures. Scale bar: 50 µm; (b) Simulations of deformation at the “center” cross-section in a microvalve (HM = 25 µm) under different levels of a driving pressure (p). Sample stress profiles of the model where p = 3 psi, 4.5 psi and 12 psi are provided here; (c) Comparison of the flow channel area at the center cross-section between experimental and simulation values (left), and color intensities of microvalve regions in the photographs mentioned in sub-figure a (right). Each data point was obtained from measurements of at least 3 devices. Error bars represent the standard deviations.
Micromachines 05 00050 g002

3.3. Dynamics of Individual Microvalves
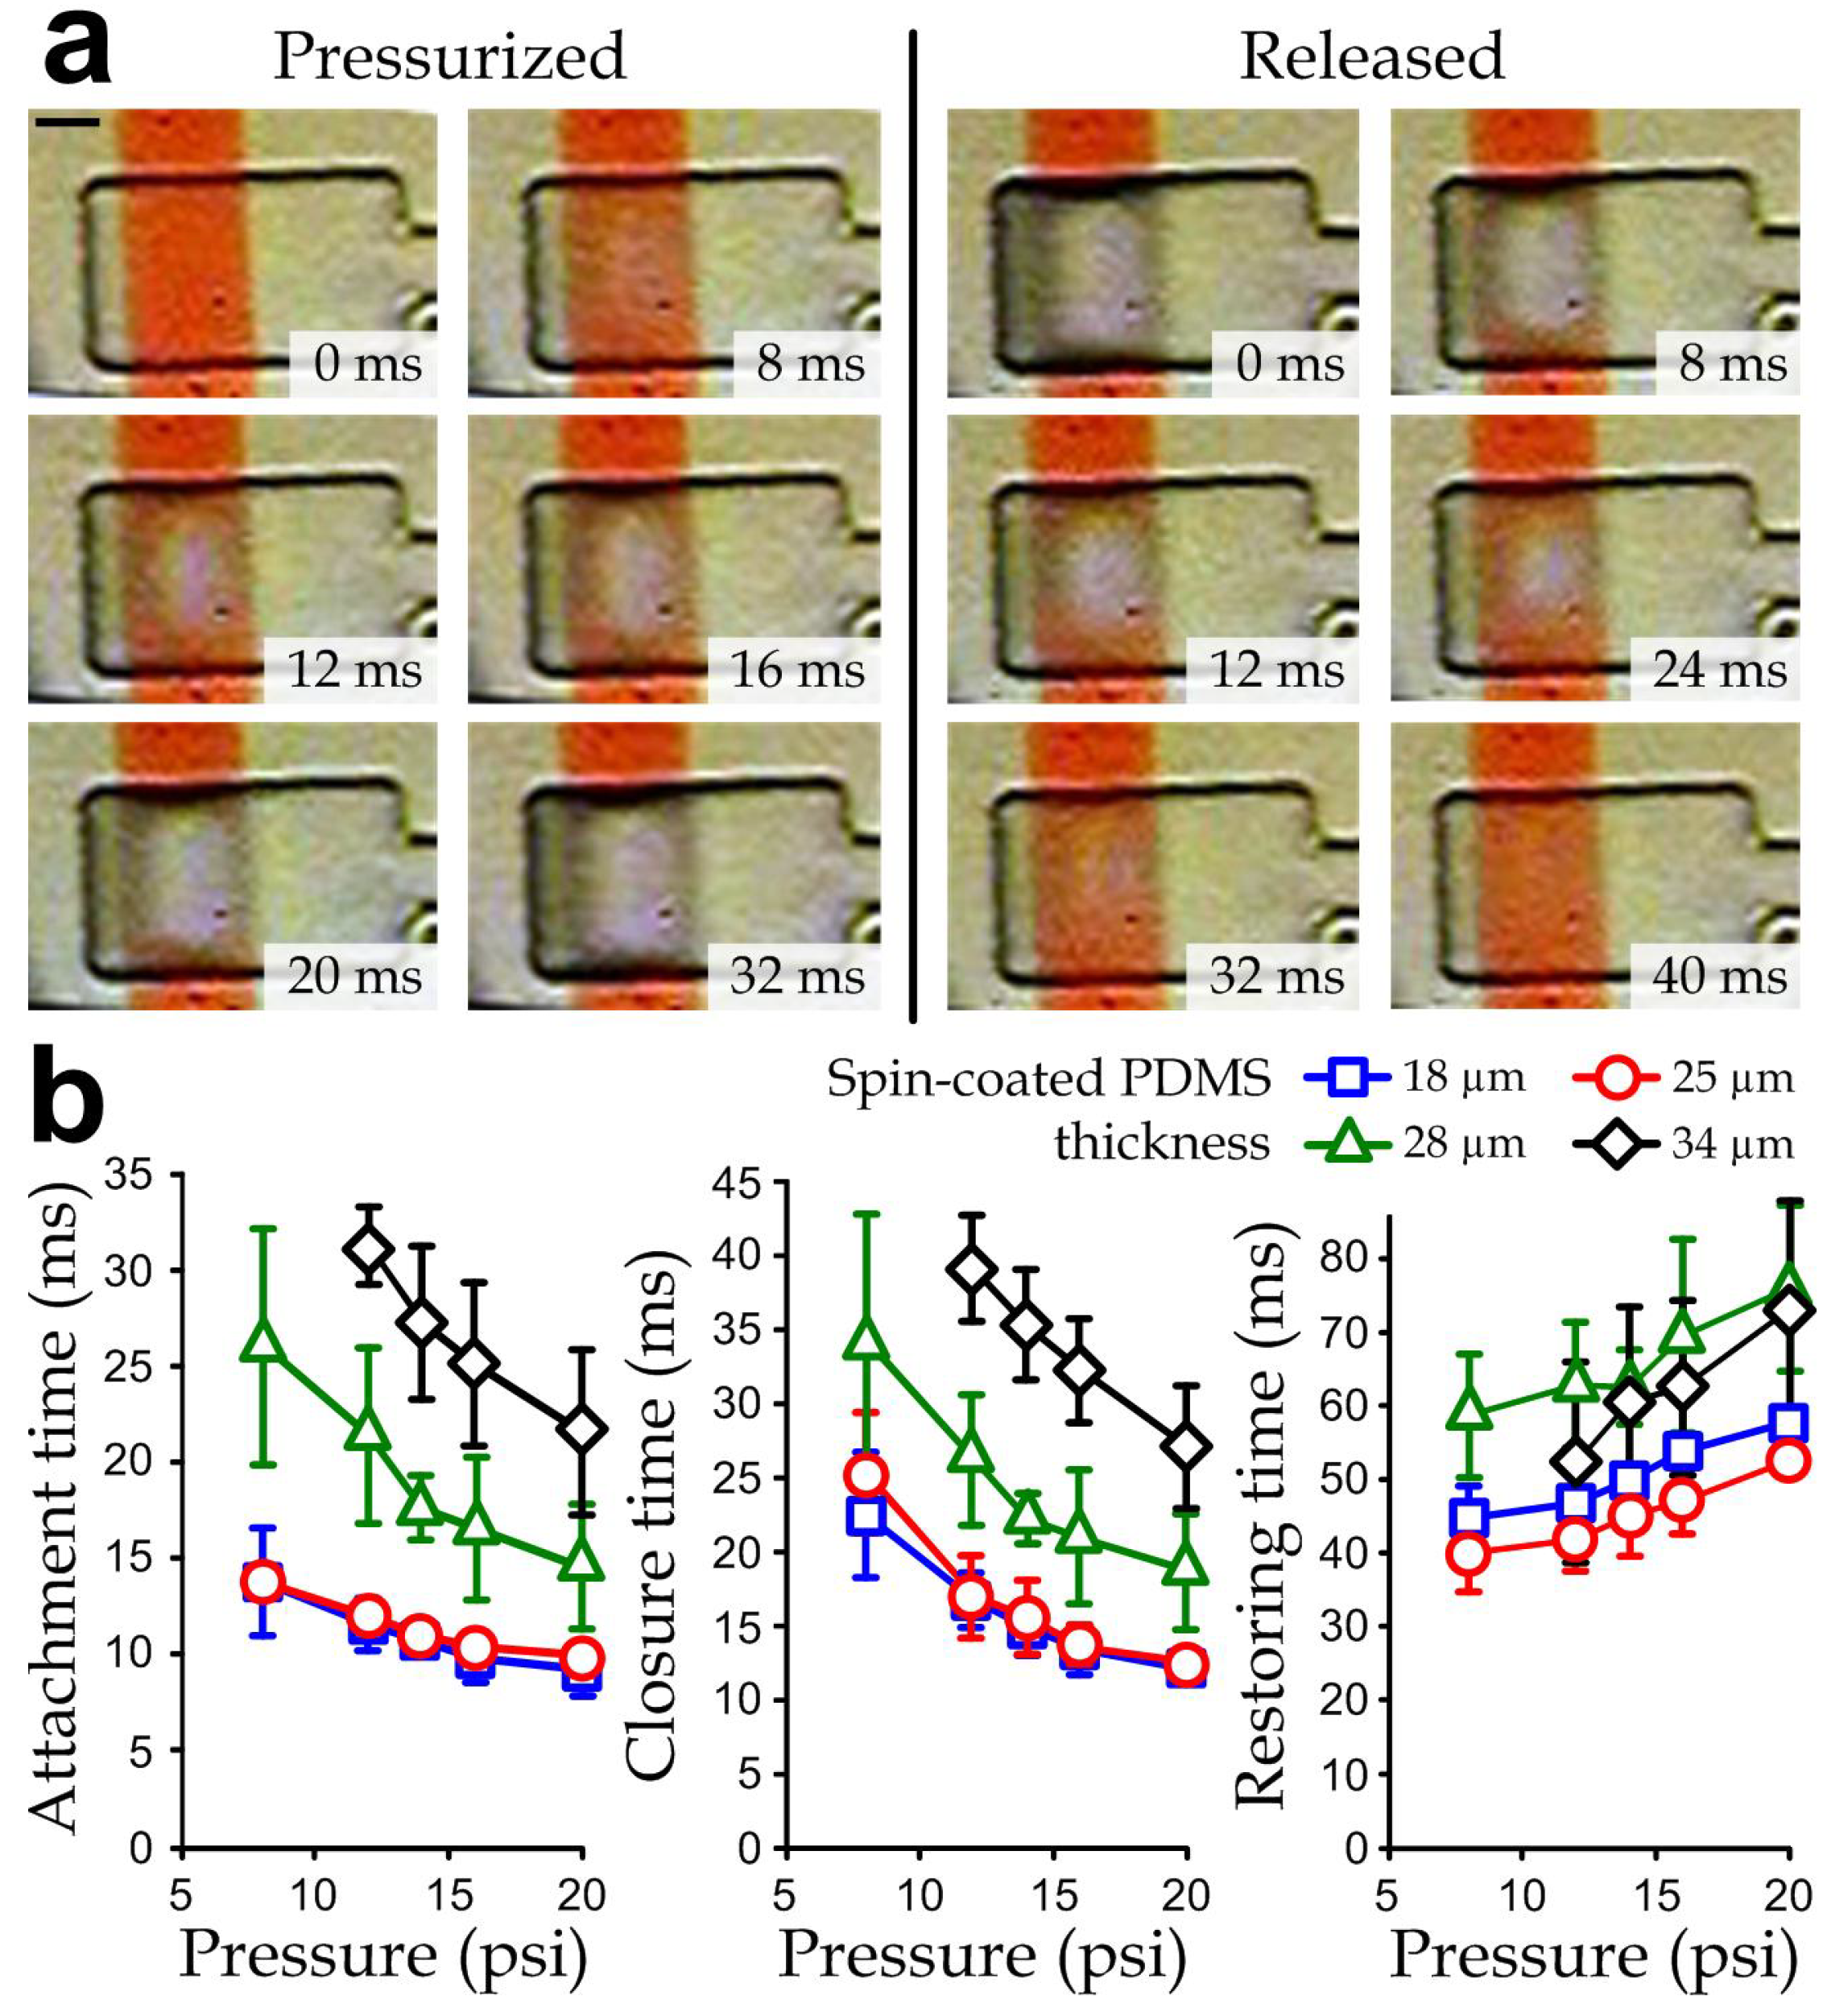
We investigated dynamics of the microvalve operations fabricated with different spin-coated PDMS layer thicknesses (18, 25, 28 and 34 µm). We examined transient responses at the microvalve regions, whose underneath flow channels were injected with a red dye for visualization, under different levels of driving pressures ranging from 8 psi to 20 psi. In each experiment, we characterized the microvalve dynamics in terms of attachment time, closure time and restoring time. The attachment time of a microvalve was defined as the time required for a deflecting membrane under a driving pressure first contacted with the bottom of the flow channel. The closure time was defined as the period taken for a microvalve completely blocked the underneath flow channel. As aforementioned in Section 2.2, the reference times for both membrane attachment and closure were indicated by the lighting of a neighboring LED. The restoring time was defined as the duration required for a fully deflected membrane to return to its open state (with ~80% of the channel undeflected volume) after the driving pressure was released, indicated by the de-illumination of the LED. As demonstration, Figure 3a shows representative time-lapsed images of membrane deflections in a microvalve area (layer thickness HM = 25 µm) during a constant driving pressure (12 psi) was applied (left) and then released (right). Once after a microvalve was pressurized, the red color intensity at the valve region reduced (8 ms) and the valve center turned to transparent at the attachment time (~12 ms). The expanding transparent area indicated further membrane deflection and then the channel was fully blocked at the closure time (~16 ms). The transparent region continuously expanded until the membrane reached its maximum deflection (~32 ms). We subsequently released the pressure to record the restoring time (~40 ms), which was longer than the closure time for every microvalve in all our measurements involved in this work. This observation may be explained by the fact that the restoring time included an additional period for a membrane deforms from its maximum deflection state to the channel-closure state, comparing to the time for valve closure.
Figure 3. (a) Time-lapsed micrographs of a microvalve when it was pressurized and de-actuated. Scale bar: 50 µm; (b) Plots of attachment time, closure time and restoring time against the driving pressure of single-valve devices fabricated with different membrane thicknesses. Error bars indicate standard deviations of the data points, each obtained from 3–5 fabricated devices. Standard deviations smaller than the data symbol height are not shown.
Micromachines 05 00050 g003
Selection of the configuration parameters is important for the valve operations. In particular, complete valve closure cannot be achieved by an insufficient driving pressure below a cutoff level, which increases with the membrane thickness. In the experiments, we could not obtain the attachment/closure of microvalves with a spin-coated PDMS thickness of 34 µm driven by a pressure of 8 psi as indicated in Figure 3b. In addition, ultra-thin spin-coated PDMS layers (<16 µm based on our experiments) were not stiff enough to restore to their undeformed states once pressurized.

3.4. Dynamics of Multiple-Valve Operations

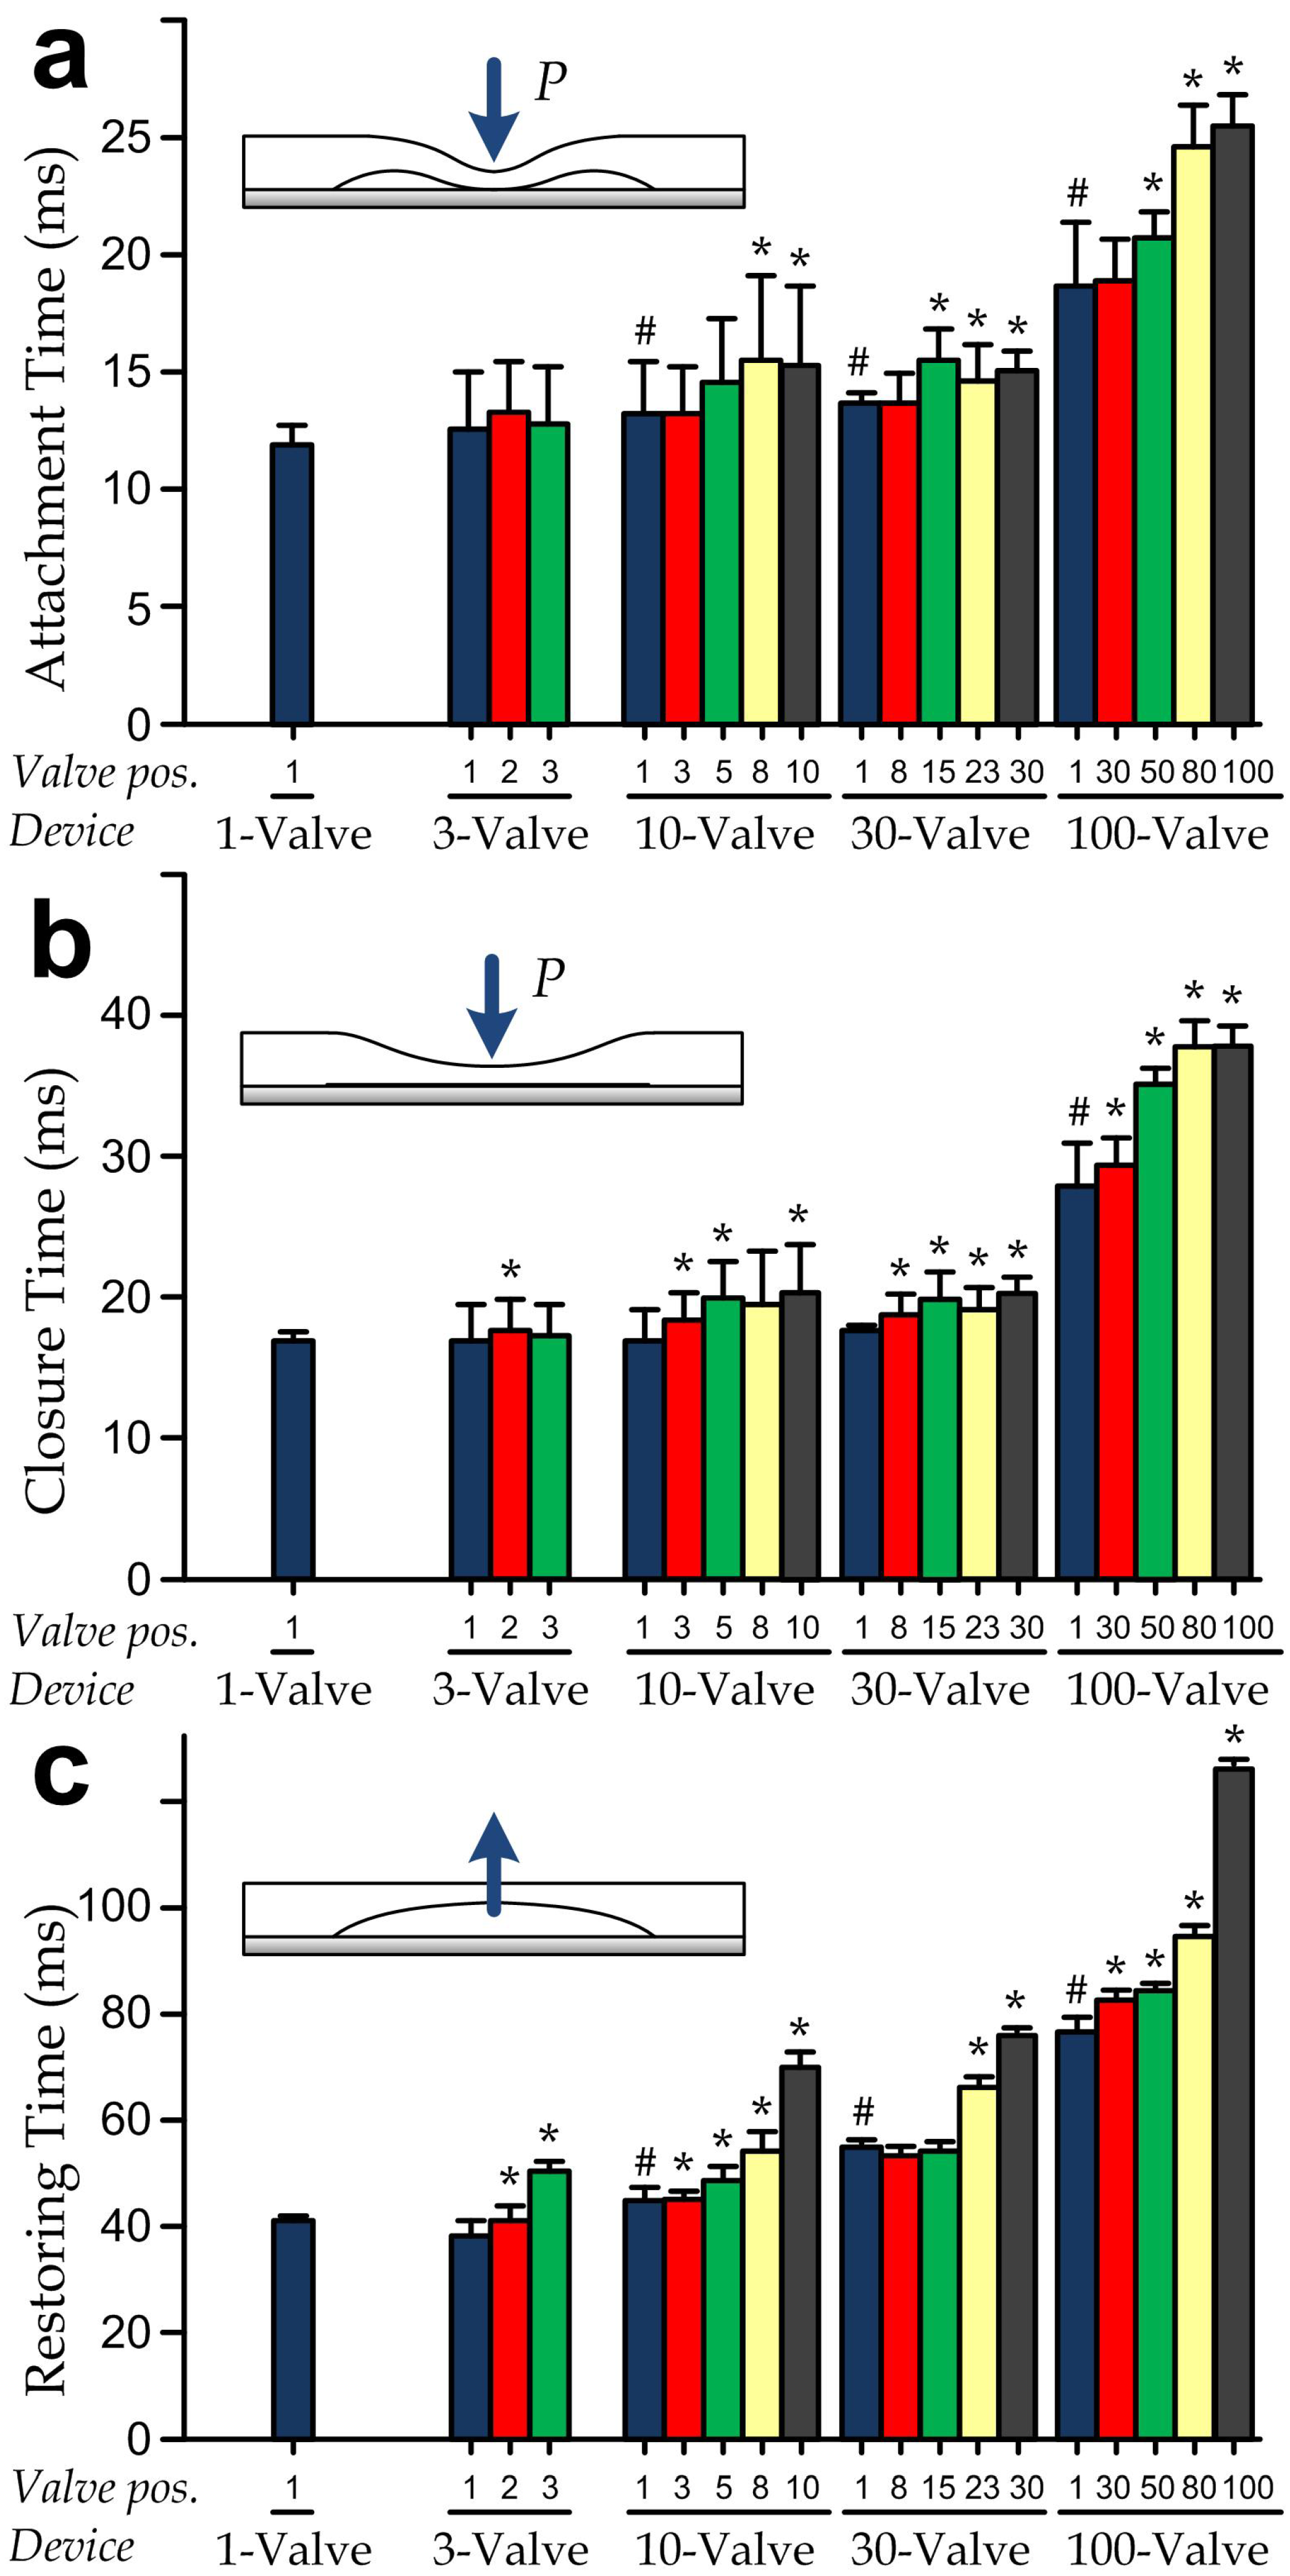
To study the dynamics of microvalves in integrated microfluidics, we performed experiments on the microfluidic devices, in which a shared control line linked up the microvalves overhead an array of parallel microchannnels, as described in Device configuration and Figure 1. We fabricated various devices consisting of different numbers of microvalves (1, 3, 10, 30 and 100) and compared the operation characteristics of microvalves at different positions and in different device types. In these sets of experiments, we were interested in the variations on valve responses mainly caused by the device complexity or, more specifically, the number of microvalves in control lines; therefore we fixed the spin-coated PDMS layer thickness (25 µm) and the driving pressure (12 psi). For each device condition, we performed measurements on multiple individually fabricated devices (n = 9–18) to ensure the repeatability. Our results (Figure 4) indicate that the devices containing more microvalves along the control lines caused the significantly slower responses (i.e., longer attachment, closure and restoring times). Moreover, in order to identify the microvalve positions in a device containing X microvalves, we describe here the valve positions with consecutive indices, with the valve closest to the pressure source as “position 1” whereas the valve located the end of a control line with “position X”. We analyzed the response times for microvalves with selected position indices as shown in Figure 4 and demonstrated that the responses of microvalves in a device were position-dependent, i.e., a valve located further from the pressure source (larger position index) in general responded slower along the control line. For instance, the microvalve at position 100 in the 100-valve device could have a restoring time of >120 ms, which was about three times of the restoring time for a single-valve device.

3.5. Lumped Modeling for Prediction of Valve Dynamics

It has been demonstrated in the previous sections that operation performance of individual microvalves varies in different microfluidic designs and configurations. In the general cases, additional microvalves along a control line would slow down responses of all the microvalves. A modeling technique predicting the essential dynamic behaviors for every valve in an integrated device can facilitate analyses of the further integration of microfluidics, which involves parallel operations of a large number of the microvalves. For this purpose, we lumped and converted dominating physical effects of microvalves in our testing devices as circuit models with equivalent dynamic responses, by expressing gas/liquid pressure as voltage, fluid flow rate as current, fluidic resistance as resistors, and membrane stiffness as capacitors. The resultant circuit model of an X-valve device consisting of multiple branches of capacitors and resistors is shown in Figure 5a. Considering that the flow of a rectangular channel in either the control or the flow layer has a sufficiently low Reynolds number (Re << 1) that viscous effects dominates, fluidic resistance (RI) of an individual channel is [45].
Micromachines 05 00050 i001
where μ is liquid viscosity (~10−3 Pa s for water), WI is channel width, HI is channel height, and LI is total channel length. For the microfluidic devices used in this study, we considered the resistances along microchannels at different locations: the pressure inlet channel RVIN (=2.4 × 10⁴ Ns/m3), the bridging channel linking up neighboring valves RVG (=3.07 × 10³ Ns/m3), the inlet channels RIN (=8.4 × 10⁵ Ns/m3) and outlet channels ROUT (=RIN) in the flow layer. On the other hand, we expressed the membrane stiffness as the equivalent capacitance CM as a function of the driving pressure (with a unit of volumetric deformation per pressure), i.e., CM = AV HO(1 − VC)/p, where AV (=WLV in Figure 1a) is membrane area, p is net downward pressure, HO is height of channel structure on mold before reflow as defined previously, and VC is normalized volume a flow channel section underneath a membrane, ranging from 0 (closure) to 1 (fully open state). Since Figure 2c indicates that both the normalized total flow channel volume in microvalve regions tended to reduce exponentially with the driving pressures, we approximated the channel volume as VC = ekP, where k is a constant. As shown in Figure 5b (the plot on the left), we obtained k = 0.22 psi−1 (or 3.191 × 10⁻² kPa−1) by fitting k for the least square errors of VC with the experimental mean valves reported in Figure 2c. These experimental results (Figure 2) indicate also that the downward pressure levels for the microvalve attachment and closure were ~3.5 psi (equivalent to VC ~ 0.463) and ~6.5 psi (VC ~ 0.239), respectively. Therefore, we adopted:
CM = WLV × Hο (1 − ekP)/ p
for the membranes in order to describe such nonlinear physical behavior (Figure 5b, right).
To describe essential states in the models, our computation recorded transient profiles of the “nodal” pressures above and below the X membranes and hence there were 2X state-variables in total (Figure 5a). Applying the conservation of mass for liquid flows (or the nominal Kirchoff’s current law in the models) at all the 2X nodes, we obtained the interconnecting relation for each node position i as the followings:
(VSV1)/RVIN = (V1V2)/RVG + CM d(V1VX+1)/dt   for i = 1
(Vi-1Vi)/RVG = (Vi+1Vi)/RVG + CM d(ViVX+i)/dt   for i = 2, 3, …, X – 1
(VX-1VX)/RVG = CM d(VXV2X)/dt   for i = X
(VSV1)/RVIN = (V1V2)/RVG + VX+1 (1/RIN + 1/ROUT)   for i = X + 1
(Vi-1Vi)/RVG = (Vi+1Vi)/RVG + Vi (1/RIN + 1/ROUT)   for i = X + 2, X + 3, …, 2X – 1
(VX-1VX)/RVG = V2X (1/RIN + 1/ROUT)   for i = 2X
We then converted each model into 2X equations expressed in the form ΨVS = ΘV + ΦdV/dt, where VS is the device driving pressure, Ψ is a 2X × 1 vector mapping effects of VS to the 2X states, V = [V1, V2, …, V2X]T is a vector including all the state variables, and Θ and Φ are time-variant 2X × 2X matrices describing the rest relations in the model. It should be mentioned that in this study we considered all the multiple-valve devices with the common spin-coated PDMS thickness (HM = 25 µm) and level of the pressure actuation (12 psi).
Figure 4. Bar charts showing response times of microfluidic devices with different numbers of valves connected in serial. (a) Attachment time; (b) closure time; and (c) restoring time of selected valve positions are listed for devices with 1, 3, 10, 30 and 100 microvalves. Error bars represent the standard deviations. Hashes indicate significant time increments (p < 0.05) of the valves closest to the gas inlets (“position 1”) in different multi-valve devices relative to the single-valve ones. Each asterisk indicates a significant time increment (p < 0.05) of a microvalve comparing to the valve at “position 1” of the same device type.
Micromachines 05 00050 g004
Figure 5. (a) Lumped circuit model of a multiple-valve device. The driving pressure VS was set as square-wave inputs according to the operation. CM is equivalent capacitance for the PDMS membrane. RVIN, RVG, RIN and ROUT are fluidic resistances of different channels in the device; (b) Plots of channel volume in the valve region (left) and membrane stiffness (right) as functions of the net downward pressure acting on the membrane; (c) Transient VC of a microvalve (valve position “1” in a 100-valve device) under the actuation and deactuation of VS; (d) Attachment, closure and restoring times of the single-valve devices. Only average values of the experimental results from Figure 3 are shown here; (e) Comparison of the responses times between the experimental values and the predictions using the circuit models. The bars indicate averages of the experimental values from Figure 4.
Micromachines 05 00050 g005

4. Conclusions

In this research, we investigated dynamic responses of the pneumatic microvalve operations in integrated microfluidics. Through measurements on the various representative single-/multiple-valve designs and operation conditions, we examined in detailed the effects of different configurations parameters on the attachment, closure and restoring times of the microvalves. We demonstrated that the slower responses in the valve attachment and closure were caused by a thicker membrane layer or an insufficient driving pressure. A longer restoring time was observed under an excessive driving pressure. Thus, a driving pressure should be chosen with an appropriate range for the short overall response period. The microfluidic devices integrated with more microvalves will have the slower responses. This relation indicates also the expected response retardation in the largely integrated microfluidic devices. In particular, the response times can become highly inconsistent between different valves (i.e., larger the valve “position”, longer the response times) in highly integrated microfluidics with ~100 valves in the control lines. Further, our simulation results based on lumped circuit models have shown reasonable agreement with the experimental data. These comparisons have validated that the modeling strategy is effective for predicting the valve behaviors in general integrated microfluidics. Applying this analysis strategy in the device designs can help determine the allowable level of integration (e.g., the number of valves along each control line) and further optimize the devices according to the target operation performance. We anticipate that this strategy can become an essential tool supporting the rapid development and integration of microfluidics, and the device commercialization processes.

Acknowledgments

We thank the financial supports from City University of Hong Kong (project# 7200267 and 9610212), Croucher Foundation (start-up allowance), and Early Career Scheme of Hong Kong Research Grant Council (project# RGC124212).

Conflicts of Interest

The authors declare no conflicts of interest.

References

  1. Whitesides, G.M. The origins and the future of microfluidics. Nature 2006, 442, 368–373. [Google Scholar] [CrossRef]
  2. Ho, C.-M.; Tai, Y.-C. Micro-electro-mechanical-systems (MEMS) and fluid flows. Annu. Rev. Fluid Mech. 1998, 30, 579–612. [Google Scholar] [CrossRef]
  3. Unger, M.A.; Chou, H.-P.; Thorsen, T.; Scherer, A.; Quake, S.R. Monolithic microfabricated valves and pumps by multilayer soft lithography. Science 2000, 288, 113–116. [Google Scholar] [CrossRef]
  4. Hong, J.W.; Studer, V.; Hang, G.; Anderson, W.F.; Quake, S.R. A nanoliter-scale nucleic acid processor with parallel architecture. Nat. Biotechnol. 2004, 22, 435–439. [Google Scholar] [CrossRef]
  5. Stroock, A.D.; Dertinger, S.K.; Ajdari, A.; Mezic, I.; Stone, H.A.; Whitesides, G.M. Chaotic mixer for microchannels. Science 2002, 295, 647–651. [Google Scholar] [CrossRef]
  6. Fu, A.Y.; Chou, H.P.; Spence, C.; Arnold, F.H.; Quake, S.R. An integrated microfabricated cell sorter. Anal. Chem. 2002, 74, 2451–2457. [Google Scholar] [CrossRef]
  7. Wu, J.; Cao, W.; Wen, W.; Chang, D.C.; Sheng, P. Polydimethylsiloxane microfluidic chip with integrated microheater and thermal sensor. Biomicrofluidics 2009, 3, 012005. [Google Scholar] [CrossRef]
  8. Melin, J.; Quake, S.R. Microfluidic large-scale integration: The evolution of design rules for biological automation. Annu. Rev. Biophys. Biomol. Struct. 2007, 36, 213–231. [Google Scholar] [CrossRef]
  9. Smith, C. Tools for drug discovery: Tools of the trade. Nature 2007, 446, 219–222. [Google Scholar] [CrossRef]
  10. Lau, B.T.; Baitz, C.A.; Dong, X.P.; Hansen, C.L. A complete microfluidic screening platform for rational protein crystallization. J. Am. Chem. Soc. 2007, 129, 454–455. [Google Scholar] [CrossRef]
  11. Paik, S.-J.; Byun, S.; Lim, J.-M.; Park, Y.; Lee, A.; Chung, S.; Chang, J.; Chun, K.; Cho, D.D. In-plane single-crystal-silicon microneedles for minimally invasive microfluid systems. Sens. Actuators A 2004, 114, 276–284. [Google Scholar] [CrossRef]
  12. Hadd, A.G.; Jacobson, S.C.; Ramsey, J.M. Microfluidic assays of acetylcholinesterase inhibitors. Anal. Chem. 1999, 71, 5206–5212. [Google Scholar] [CrossRef]
  13. Harrison, D.J. Micromachining a miniaturized capillary electrophoresis-base. Science 1993, 261, 895–895. [Google Scholar]
  14. Li, P.C.H.; Harrison, D.J. Transport, manipulation, and reaction of biological cells on-chip using electrokinetic effects. Anal. Chem. 1997, 69, 1564–1568. [Google Scholar] [CrossRef]
  15. Hadd, A.G.; Raymond, D.E.; Halliwell, J.W.; Jacobson, S.C.; Ramsey, J.M. Microchip device for performing enzyme assays. Anal. Chem. 1997, 69, 3407–3412. [Google Scholar] [CrossRef]
  16. Lagally, E.T.; Medintz, I.; Mathies, R.A. Single-molecule DNA amplification and analysis in an integrated microfluidic device. Anal. Chem. 2001, 73, 565–570. [Google Scholar] [CrossRef]
  17. Wang, J.; Ibáñez, A.; Chatrathi, M.P.; Escarpa, A. Electrochemical enzyme immunoassays on microchip platforms. Anal. Chem. 2001, 73, 5323–5327. [Google Scholar] [CrossRef]
  18. Zeng, Y.; Novak, R.; Shuga, J.; Smith, M.T.; Mathies, R.A. High-performance single cell genetic analysis using microfluidic emulsion generator arrays. Anal. Chem. 2010, 82, 3183–3190. [Google Scholar] [CrossRef]
  19. Hung, P.J.; Lee, P.J.; Sabounchi, P.; Lin, R.; Lee, L.P. Continuous perfusion microfluidic cell culture array for high-throughput cell-based assays. Biotechnol. Bioeng. 2005, 89, 1–8. [Google Scholar] [CrossRef]
  20. Fu, A.Y.; Spence, C.; Scherer, A.; Arnold, F.H.; Quake, S.R. A microfabricated fluorescence-activated cell sorter. Nat. Biotechnol. 1999, 17, 1109–1111. [Google Scholar] [CrossRef]
  21. Kim, M.S.; Ju, H.Y.; Park, J.-K. A microfluidic platform for 3-dimensional cell culture and cell-based assays. Biomed. Microdevices 2007, 9, 25–34. [Google Scholar] [CrossRef]
  22. Tian, J.; Gong, H.; Sheng, N.; Zhou, X.; Gulari, E.; Gao, X.; Church, G. Accurate multiplex gene synthesis from programmable DNA microchips. Nature 2004, 432, 1050–1054. [Google Scholar] [CrossRef]
  23. Gomez-Sjoberg, R.; Leyrat, A.A.; Pirone, D.M.; Chen, C.S.; Quake, S.R. Versatile, fully automated, microfluidic cell culture system. Anal. Chem. 2007, 79, 8557–8563. [Google Scholar] [CrossRef]
  24. Lam, R.H.; Kim, M.C.; Thorsen, T. Culturing aerobic and anaerobic bacteria and mammalian cells with a microfluidic differential oxygenator. Anal. Chem. 2009, 81, 5918–5924. [Google Scholar] [CrossRef]
  25. Thorsen, T.; Maerkl, S.J.; Quake, S.R. Microfluidic large-scale integration. Science 2002, 298, 580–584. [Google Scholar] [CrossRef]
  26. Ottesen, E.A.; Hong, J.W.; Quake, S.R.; Leadbetter, J.R. Microfluidic digital PCR enables multigene analysis of individual environmental bacteria. Science 2006, 314, 1464–1467. [Google Scholar] [CrossRef]
  27. Marcus, J.S.; Anderson, W.F.; Quake, S.R. Microfluidic single-cell mRNA isolation and analysis. Anal. Chem. 2006, 78, 3084–3089. [Google Scholar] [CrossRef]
  28. Ben-Ari, Y.; Glick, Y.; Kipper, S.; Schwartz, N.; Barbiro-Michaely, E.; Gerber, D. Microfluidic large scale integration of viral-host interaction analysis. Lab Chip 2013, 13, 2202–2209. [Google Scholar] [CrossRef]
  29. Hosokawa, K.; Maeda, R. A pneumatically-actuated three-way microvalve fabricated with polydimethylsiloxane using the membrane transfer technique. J. Micromech. Microeng. 2000, 10, 415. [Google Scholar] [CrossRef]
  30. Kartalov, E.P.; Scherer, A.; Quake, S.R.; Taylor, C.R.; Anderson, W.F. Experimentally validated quantitative linear model for the device physics of elastomeric microfluidic valves. J. Appl. Phys. 2007, 101, 64505. [Google Scholar] [CrossRef]
  31. Goulpeau, J.; Trouchet, D.; Ajdari, A.; Tabeling, P. Experimental study and modeling of polydimethylsiloxane peristaltic micropumps. J. Appl. Phys. 2005, 98. [Google Scholar] [CrossRef]
  32. Hou-Pu, C.; Unger, M.A.; Quake, S.R. A microfabricated rotary pump. Biomed. Microdevices 2001, 3, 323–323. [Google Scholar] [CrossRef]
  33. El-Ali, J.; Sorger, P.K.; Jensen, K.F. Cells on chips. Nature 2006, 442, 403–411. [Google Scholar] [CrossRef]
  34. Bourouina, T.; Grandchamp, J.-P. Modeling micropumps with electrical equivalent networks. J. Micromech. Microeng. 1996, 6, 398. [Google Scholar] [CrossRef]
  35. Zeng, Y.; Azizi, F.; Mastrangelo, C. Behavioral Modeling of Solute Tracking in Microfluidics. In Proceedings of the IEEE Behavioral Modeling and Simulation Workshop 2009, San José, CA, USA, 17–18 September 2009; pp. 1–6.
  36. Chen, L.; Azizi, F.; Mastrangelo, C.H. Generation of dynamic chemical signals with microfluidic C-DACs. Lab Chip 2007, 7, 850–855. [Google Scholar] [CrossRef]
  37. Azizi, F.; Mastrangelo, C.H. Generation of dynamic chemical signals with pulse code modulators. Lab Chip 2008, 8, 907–912. [Google Scholar] [CrossRef]
  38. Xie, Y.; Wang, Y.; Chen, L.; Mastrangelo, C.H. Fourier microfluidics. Lab Chip 2008, 8, 779–785. [Google Scholar] [CrossRef]
  39. Hong, L.; Pan, T. Three-dimensional surface microfluidics enabled by spatiotemporal control of elastic fluidic interface. Lab Chip 2010, 10, 3271–3276. [Google Scholar] [CrossRef]
  40. Studer, V.; Hang, G.; Pandolfi, A.; Ortiz, M.; French Anderson, W.; Quake, S.R. Scaling properties of a low-actuation pressure microfluidic valve. J. Appl. Phys. 2004, 95, 393–398. [Google Scholar] [CrossRef]
  41. Pandolfi, A.; Ortiz, M. Numerical Analysis of Elastomeric Fluidic Microvalves. Sens. Lett. 2008, 6, 43–48. [Google Scholar] [CrossRef]
  42. Basar, Y.; Ding, Y. Shear deformation models for large-strain shell analysis. Int. J. Solids Struct. 1997, 34, 1687–1708. [Google Scholar] [CrossRef]
  43. Khanafer, K.; Duprey, A.; Schlicht, M.; Berguer, R. Effects of strain rate, mixing ratio, and stress-strain definition on the mechanical behavior of the polydimethylsiloxane (PDMS) material as related to its biological applications. Biomed. Microdevices 2009, 11, 503–508. [Google Scholar] [CrossRef]
  44. Xia, Y.; Kim, E.; Zhao, X.-M.; Rogers, J.A.; Prentiss, M.; Whitesides, G.M. Complex optical surfaces formed by replica molding against elastomeric masters. Science 1996, 273, 347–349. [Google Scholar]
  45. Joekar-Niasar, V.; Schotting, R.; Leijnse, A. Analytical solution of electrohydrodynamic flow and transport in rectangular channels: Inclusion of double layer effects. Comput. Geosci. 2013, 17, 497–513. [Google Scholar] [CrossRef]