Article

Hydrothermally Synthesized PPy/VO2 Nanorod Composites for High-Performance Aqueous Zinc-Ion Battery Cathodes

1
School of Information, Hunan University of Humanities, Science and Technology, Loudi 417099, China
2
Key Laboratory of Low-Dimensional Structural Physics and Application, Education Department of Guangxi Zhuang Autonomous Region, College of Physics and Electronic Information Engineering, Guilin University of Technology, Guilin 541004, China
*
Author to whom correspondence should be addressed.
Micromachines 2025, 16(6), 705; https://doi.org/10.3390/mi16060705
Submission received: 11 May 2025 / Revised: 7 June 2025 / Accepted: 11 June 2025 / Published: 13 June 2025
(This article belongs to the Section E:Engineering and Technology)

Abstract

:
The rapid development of energy storage technologies has led to an increasing demand for high-performance electrode materials that can enhance both the energy density and the cycling stability of batteries. In this study, polypyrrole (PPy) nanorods with partial hollow features are utilized as a conductive and flexible framework for the in situ growth of VO2 nanospheres via a simple hydrothermal method, forming a well-defined core–shell PPy/VO2 nanocomposite. This hierarchical nanostructure combines the excellent electrical conductivity and mechanical flexibility of PPy with the high theoretical capacity of VO2, creating a synergistic effect that significantly enhances the electrochemical performance. The well-integrated interface between PPy and VO2 reduces interfacial resistance, promotes efficient electron and ion transport, and improves the overall energy conversion efficiency. Electrochemical testing reveals that the PPy/VO2 nanocomposite delivers a high specific capacity of 413 mAh g−1 at 100 mA g−1 and retains 87.2% of its initial capacity after 1200 cycles, demonstrating exceptional rate capability and long-term cycling stability. This work provides a versatile strategy for designing high-performance cathode materials and highlights the promising potential of PPy/VO2 nanocomposites for next-generation high-energy-density aqueous zinc-ion batteries.

1. Introduction

The growing global energy demand, along with rising environmental concerns, highlights the urgent need for sustainable and environmentally friendly energy storage technologies [1,2]. Conventional fossil-fuel-based energy sources are increasingly associated with greenhouse gas emissions and environmental degradation, which limit their long-term viability [3]. In response, renewable energy sources such as solar and wind have gained significant traction. However, their intermittency and geographical limitations require the integration of high-performance energy storage devices to ensure grid stability and efficient power management [4,5].
Among various energy storage technologies, rechargeable batteries—particularly lithium-ion batteries (LIBs)—have dominated markets for portable electronics and electric vehicles due to their high energy density and cycle life. However, the limited abundance and uneven global distribution of lithium resources, along with safety risks associated with organic electrolytes and rising costs, hinder their broader application in large-scale energy storage [6,7,8,9,10]. Consequently, alternative battery systems based on earth-abundant, low-cost, and safe materials are being intensively investigated.
Aqueous zinc-ion batteries (ZIBs) have emerged as a promising candidate due to the high volumetric capacity of zinc (5855 mAh cm−3), two-electron redox activity, environmental friendliness, and compatibility with water-based electrolytes, which greatly improve safety and reduce manufacturing costs [11,12,13,14,15,16]. Nevertheless, the development of ZIBs is currently constrained by the lack of high-performance cathode materials. Although manganese oxides, Prussian blue analogues, and vanadium-based materials have been explored, many of them suffer from poor rate capability, structural degradation, or low capacity retention during prolonged cycling [17,18,19,20,21].
Among these, vanadium oxides—especially VO2—have attracted considerable attention due to their layered or tunnel crystal structures and multiple valence states (V4+/V5+), which facilitate reversible Zn2+ insertion/extraction [22,23,24]. However, VO2 alone often exhibits low electrical conductivity, sluggish Zn2+ diffusion kinetics, and poor cycling stability due to dissolution in aqueous electrolytes, limiting its practical application in ZIBs. Therefore, enhancing the conductivity, structural integrity, and ion transport pathways of VO2-based cathodes is critical to fully realize their potential.
Conductive polymers, such as polypyrrole (PPy), offer a compelling strategy to address these issues. Owing to its π-conjugated structure, intrinsic electrical conductivity, mechanical flexibility, and ability to buffer volume changes, PPy has been widely used in hybrid electrode designs [25,26]. Notably, PPy can form tubular or globular nanostructures that establish interconnected conductive networks and act as protective layers to suppress dissolution of active materials. These features enable improved charge transport and structural stability under electrochemical cycling.
Previous studies have reported PPy-based composites with vanadium oxides, such as V2O5 or mixed-valence VOx, for supercapacitors or other battery systems [25,26]. However, most of these works either focus on non-battery-type devices (e.g., flexible asymmetric supercapacitors), use complex nanowire arrays on substrates, or operate in three-electrode systems, which are less representative of practical full-cell aqueous ZIB configurations. Moreover, the synergistic mechanism between PPy and VO2 in true battery environments—particularly regarding interfacial charge transfer, structural stability, and Zn2+ diffusion pathways—remains poorly understood.
In this work, we report a facile hydrothermal and self-assembly strategy to synthesize a PPy/VO2 hybrid composite, where VO2 nanospheres are uniformly anchored and grown in situ on PPy nanorods. Unlike previous approaches, our design yields a free-standing powder with a hierarchical nanostructure that is easily processed into coin cells, enabling direct application in aqueous ZIBs. The composite not only enhances electrical conductivity and structural integrity, but also demonstrates superior rate capability and long-term cycling performance under realistic two-electrode conditions. The improved interfacial engineering and pseudocapacitive kinetics distinguish our material from prior PPy–VOx systems and offer a new route for practical, high-performance zinc-ion energy storage.
Electrochemical results demonstrate that the composite delivers a high specific capacity (413 mAh g−1 at 0.1 A g−1), excellent rate capability, and remarkable cycling stability (87.2% capacity retention after 1200 cycles). This study not only provides a new route for cathode material design in ZIBs but also contributes to understanding polymer-inorganic hybrid mechanisms for fast and durable energy storage.

2. Material and Methods

2.1. Materials

All chemicals used in this study are of analytical reagent (AR) grade and were used without further purification. Hydrochloric acid, oxalic acid, methanol, aniline, ethanol, and hydrogen peroxide (30% AR) were purchased from Xilong Chemical Corporation (Shantou, China). Ammonium metavanadate (NH4VO3) and argon gas (Ar, AR grade) were obtained from Luoen Corporation (Shanghai, China) and Guangzhou Junduo Gas Corporation (Guangzhou, China), respectively. The glass fiber separator (model 1823-047) was supplied by Whatman (Maidstone, UK).

2.2. Preparation of PPy Nanorods

To prepare a 2.0 mmol/L methyl orange solution, 0.196 g of methyl orange was dissolved in 300 mL of deionized water. Then, 1 mL (14.4 mmol) of pyrrole monomer was added to the solution, and the mixture was stirred at 0 °C for 1 h. Next, an oxidant solution containing 100 mL of FeCl3 was slowly introduced into the reaction system. The polymerization reaction was carried out at 0 °C with continuous mechanical stirring for 24 h. Upon completion of the reaction, the black precipitate was collected by vacuum filtration and washed alternately with deionized water and ethanol six times until the filtrate became colorless. The product was then freeze-dried at −50 °C for 24 h to obtain PPy nanorods.

2.3. Synthesis of PPy/VO2

In a separate procedure, 100 mL of deionized water was mixed with 3.56 g of oxalic acid and commercial V2O5 powder, and the mixture was stirred at 60 °C until the solution turned blue. The mixture was then dried at 75 °C for two days and ground into a fine powder for further use.
Next, 60 mg of the prepared V2O5 powder was added to 60 mL of a methanol–water mixture (methanol/water = 4:1) and stirred for 3 h. Following this, 20 mg of PPy nanorods was added, and the mixture was sonicated for 1 h. The resulting suspension was transferred to an 80 mL autoclave and heated at 200 °C for 24 h.
After the reaction, the product was washed repeatedly with ethanol and deionized water until the filtrate was clear. Finally, the material was dried at 60 °C for 24 h to obtain the PPy/VO2 composite.

2.4. Electrode Fabrication and Cell Construction

High-purity zinc foil (99.9%) was employed as both the counter and reference electrodes in the electrochemical setup, leveraging its well-defined and reversible Zn/Zn2+ redox potential (~0.76 V vs. SHE in 3 M Zn(CF3SO3)2) to ensure stable and reproducible measurements. The working electrode was prepared by thoroughly mixing the active material (PPy/VO2 composite or pure VO2), Super P carbon, and PVDF binder in a mass ratio of 7:2:1 using N-methyl-2-pyrrolidone (NMP) as the dispersing agent. The resulting slurry was uniformly applied onto stainless-steel mesh current collectors and vacuum-dried at 65 °C for 12 h. The electrode coating was controlled to achieve an active material loading of approximately 2 mg cm−2. Coin-type cells (CR2016) were assembled under ambient conditions, incorporating zinc foil electrodes, the prepared cathode, a glass fiber separator (Whatman, UK), and 3 M Zn(CF3SO3)2 aqueous electrolyte to complete the configuration.

2.5. Characterization Techniques

The structural, morphological, and chemical properties of the synthesized PPy/VO2 composites were comprehensively characterized using various analytical techniques. Powdered samples were prepared according to the specific requirements of each method. To provide a systematic overview of the experimental techniques employed in this study, the instrumentation, key parameters, and analysis software used for structural, morphological, chemical, and electrochemical characterization of PPy/VO2 are summarized in Table 1. These methods encompass a comprehensive range of analysis—including phase identification, surface morphology, elemental composition, thermal behavior, surface area measurement, and electrochemical performance—ensuring a thorough understanding of the material properties.

3. Results and Discussion

3.1. Material Characterization

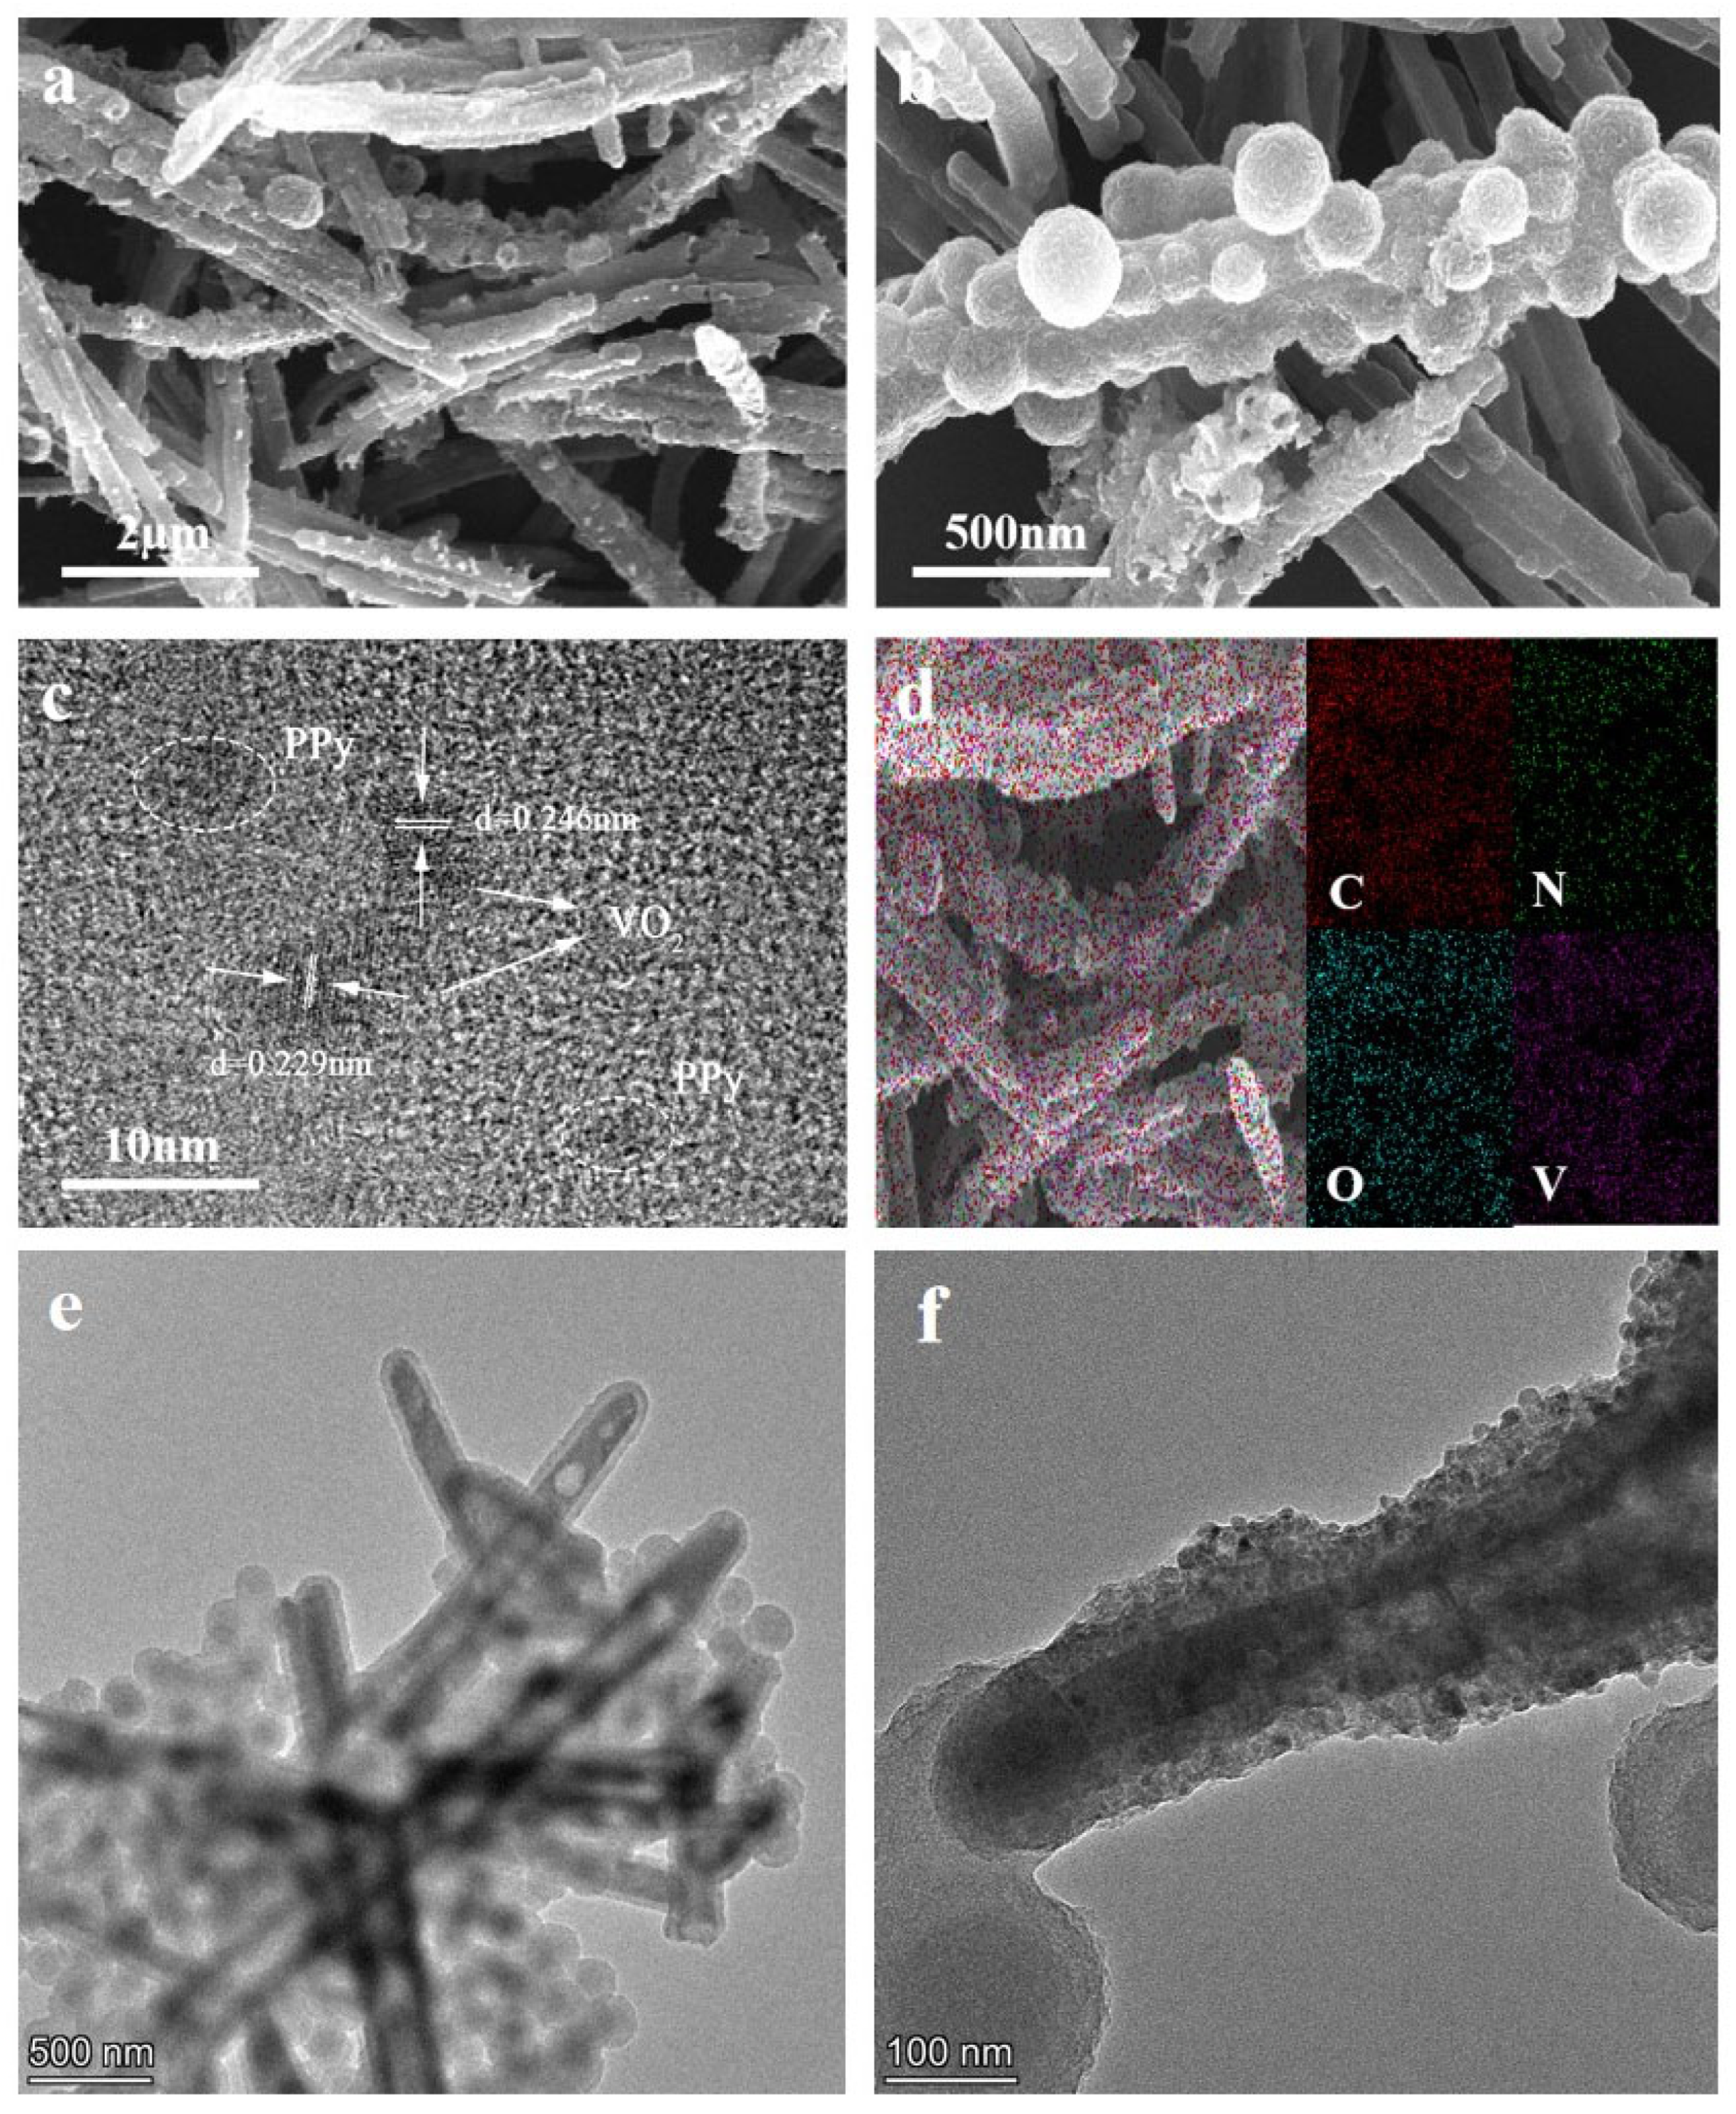
3.1.1. Scanning Electron Microscopy (SEM) and Energy Dispersive Spectroscopy (EDS) Analysis

The morphological characteristics of PPy/VO2 were investigated using SEM and TEM, as shown in Figure 1. Figure 1a,b presents SEM images of the composite after hydrothermal synthesis.
Figure 1a shows a low-magnification SEM image (scale bar: 2 μm), where PPy/VO2 exhibits large-scale rod-like or fibrous structures. These structures, composed of PPy and VO2 nanoparticles, appear relatively uniform and well-aligned.
Figure 1b displays a high-magnification SEM image (scale bar: 500 nm), revealing surface features of PPy/VO2 at the nanoscale. In this image, certain fibrous structures are observed to be partially decorated with spherical or irregularly shaped nanoparticles, which are tentatively attributed to VO2. However, this decoration is not uniformly present on all observed structures, indicating some degree of morphological variation across the sample.
Figure 1c presents a high-resolution TEM (HRTEM) image (scale bar: 10 nm), which offers insights into the fine structural organization at the nanoscale. The observed lattice fringes correspond to interplanar spacings of 0.246 nm and 0.229 nm, matching the (002) and (200) crystallographic planes of VO2, respectively [27,28]. The surrounding low-contrast amorphous regions are tentatively assigned to PPy, considering its composition of light elements (C, N, H) and characteristic low electron density.
Figure 1d shows the elemental distribution of PPy/VO2 obtained via EDS. Elemental mapping reveals the presence and distribution of carbon (C), nitrogen (N), oxygen (O), and vanadium (V). The homogeneous distribution of C and N elements indicates the uniform dispersion of PPy, while O and V are evenly distributed throughout the sample, confirming the presence of VO2. These findings demonstrate the successful integration of PPy and VO2.
Figure 1e,f validates the formation of PPy/VO2 nanorods with a core–shell architecture. In Figure 1e, the nanorods exhibit partial surface decoration with VO2 nanospheres, indicating some degree of morphological non-uniformity. In contrast, Figure 1f displays a single nanorod uniformly coated with nanospheres, confirming the successful formation of a core–shell structure at the individual level. Although minor inconsistencies in surface coverage are observed, the overall composite maintains a robust architecture, which is advantageous for improving structural integrity and electrochemical performance.

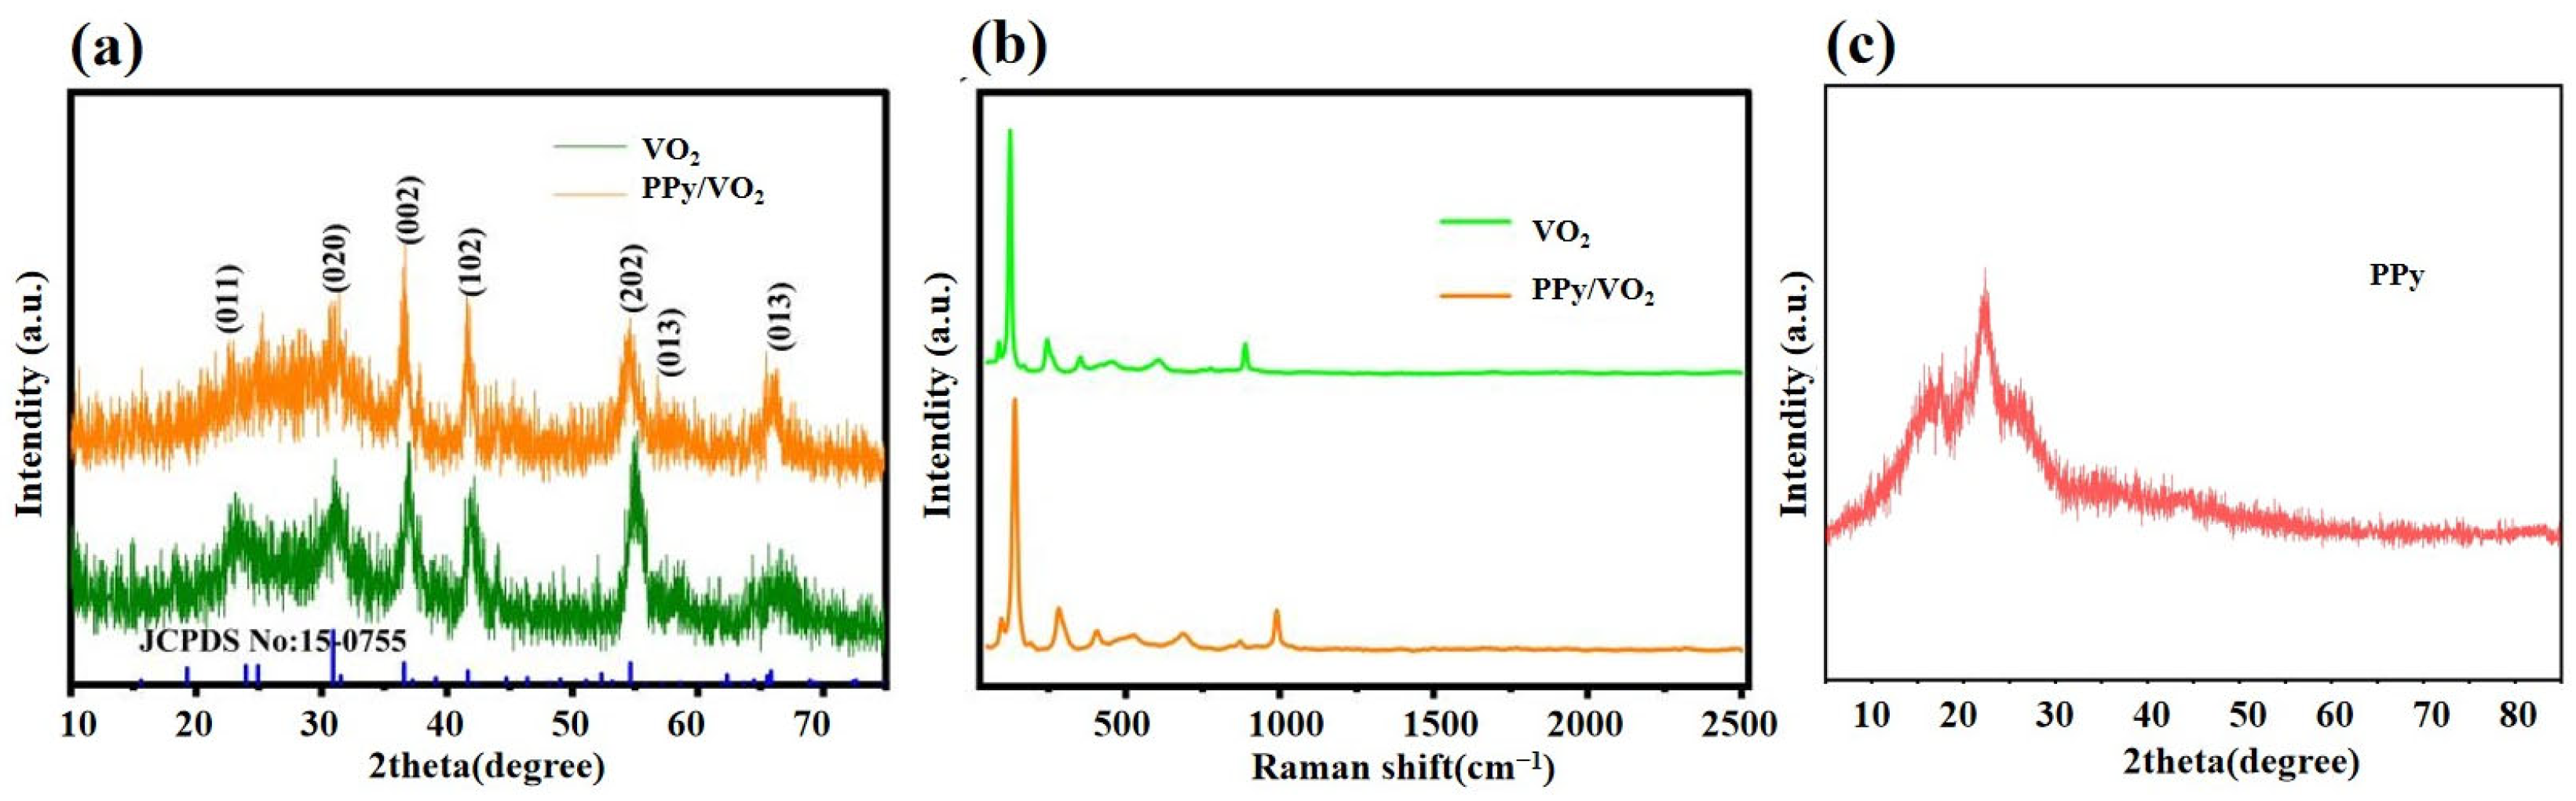
3.1.2. X-Ray Diffraction (XRD) and Raman Spectroscopy Analysis

XRD analysis is performed on the synthesized VO2, PPy/VO2 composites, and PPy, and the results are shown in Figure 2.
Figure 2a presents the XRD patterns of VO2 and PPy/VO2. The characteristic diffraction peaks of VO2 in PPy/VO2 are consistent with the standard pattern for monoclinic VO2 (JCPDS No. 15-0755), indicating that the incorporation of PPy does not alter the crystalline phase of VO2.
Specifically, diffraction peaks at 24.92°, 30.93°, 36.57°, 41.66°, 39.12°, and 54.62° correspond to the (110), (111), (002), (200), (102), and (202) planes, respectively, confirming the retention of the monoclinic phase with lattice parameters a = 4.5968 Å, b = 5.6844 Å, and c = 4.9133 Å [29].
Notably, the PPy/VO2 composite exhibits broader diffraction peaks in the 25–30° range, accompanied by increased peak intensity. This phenomenon may be attributed to the interaction of PPy with the VO2 matrix.
Figure 2b shows the Raman spectra of VO2 and PPy/VO2, in which the Raman spectrum of PPy/VO2 does not show significant changes compared to VO2. This suggests that, while the introduction of PPy may lead to changes in the lattice or local structure, it does not induce significant chemical structural changes [30]. The major Raman peaks of both materials remain consistent within the range of 500 cm−1 to 2500 cm−1, indicating that the crystal structure of VO2 still dominates in the composite.
Figure 2c shows the XRD patterns of PPy, which displays a broad diffraction peak around 20–30°, indicating the amorphous or low-crystalline nature of pure PPy. Compared to this, PPy/VO2 exhibits distinct crystalline VO2 peaks and significantly enhanced electrochemical performance, including a much higher specific capacity and structural stability.

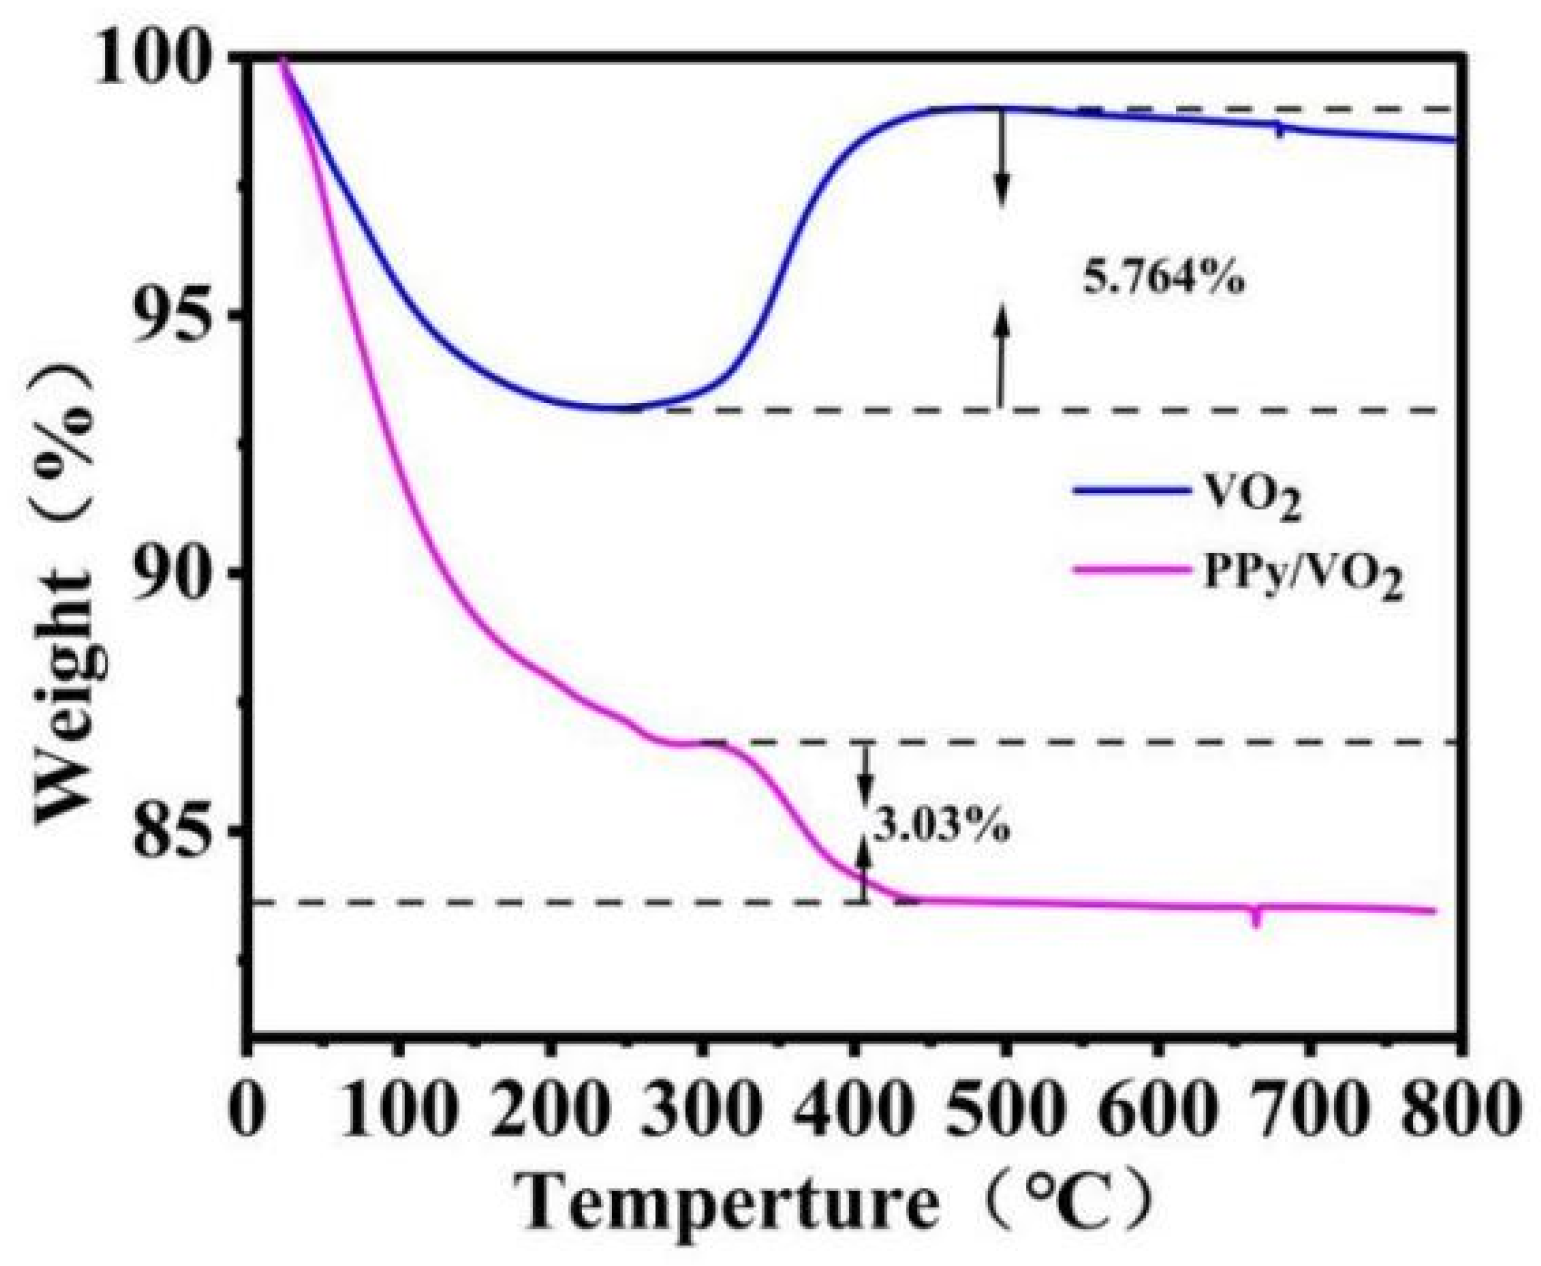
3.1.3. Thermogravimetric (TGA) Analysis

TGA analysis provides an intuitive view of the proportions of the components in the composite material and its thermal stability. Figure 3 shows the TGA curves of PPy/VO2 and VO2.
In the temperature range from 0 °C to 300 °C, both VO2 and PPy/VO2 samples exhibit a sharp weight loss, which is primarily attributed to the evaporation of physically adsorbed and interlayer water, as well as the possible removal of volatile surface species. This indicates that moisture and low-boiling-point substances are gradually expelled from the materials at lower temperatures.
Between 300 °C and 800 °C, a distinct divergence is observed between the two curves. For the pure VO2 sample, a mass gain of approximately 5.764% is recorded. This increase is ascribed to the oxidation of VO2 to V2O5, a well-known transformation that occurs in this temperature range [31]. The formation of V2O5 introduces additional oxygen into the lattice, leading to a net mass increase, which then gradually stabilizes at higher temperatures.
In contrast, the PPy/VO2 composite exhibits more complex thermal behavior in the same temperature region. Around 300 °C, a transition point is observed where the mass of the composite begins to decline. This weight loss is attributed to the thermal decomposition and oxidative degradation of the PPy component, which undergoes carbonization and combustion in the oxidative atmosphere [31].
The total weight loss of the composite between 300 °C and 800 °C is approximately 3.03%, which is initially used as a rough estimate of the PPy content. This value reflects the combined effects of PPy decomposition and VO2 oxidation, including the potential mass gain from the VO2 → V2O5 conversion. Therefore, the actual PPy content is likely slightly higher than 3.03%.
Nevertheless, the TGA data still indicate that the PPy content in the composite is relatively low, which is consistent with the minor structural modifications observed in the XRD and Raman spectra, and provides a reasonable basis for interpreting the interfacial role of PPy in the composite.

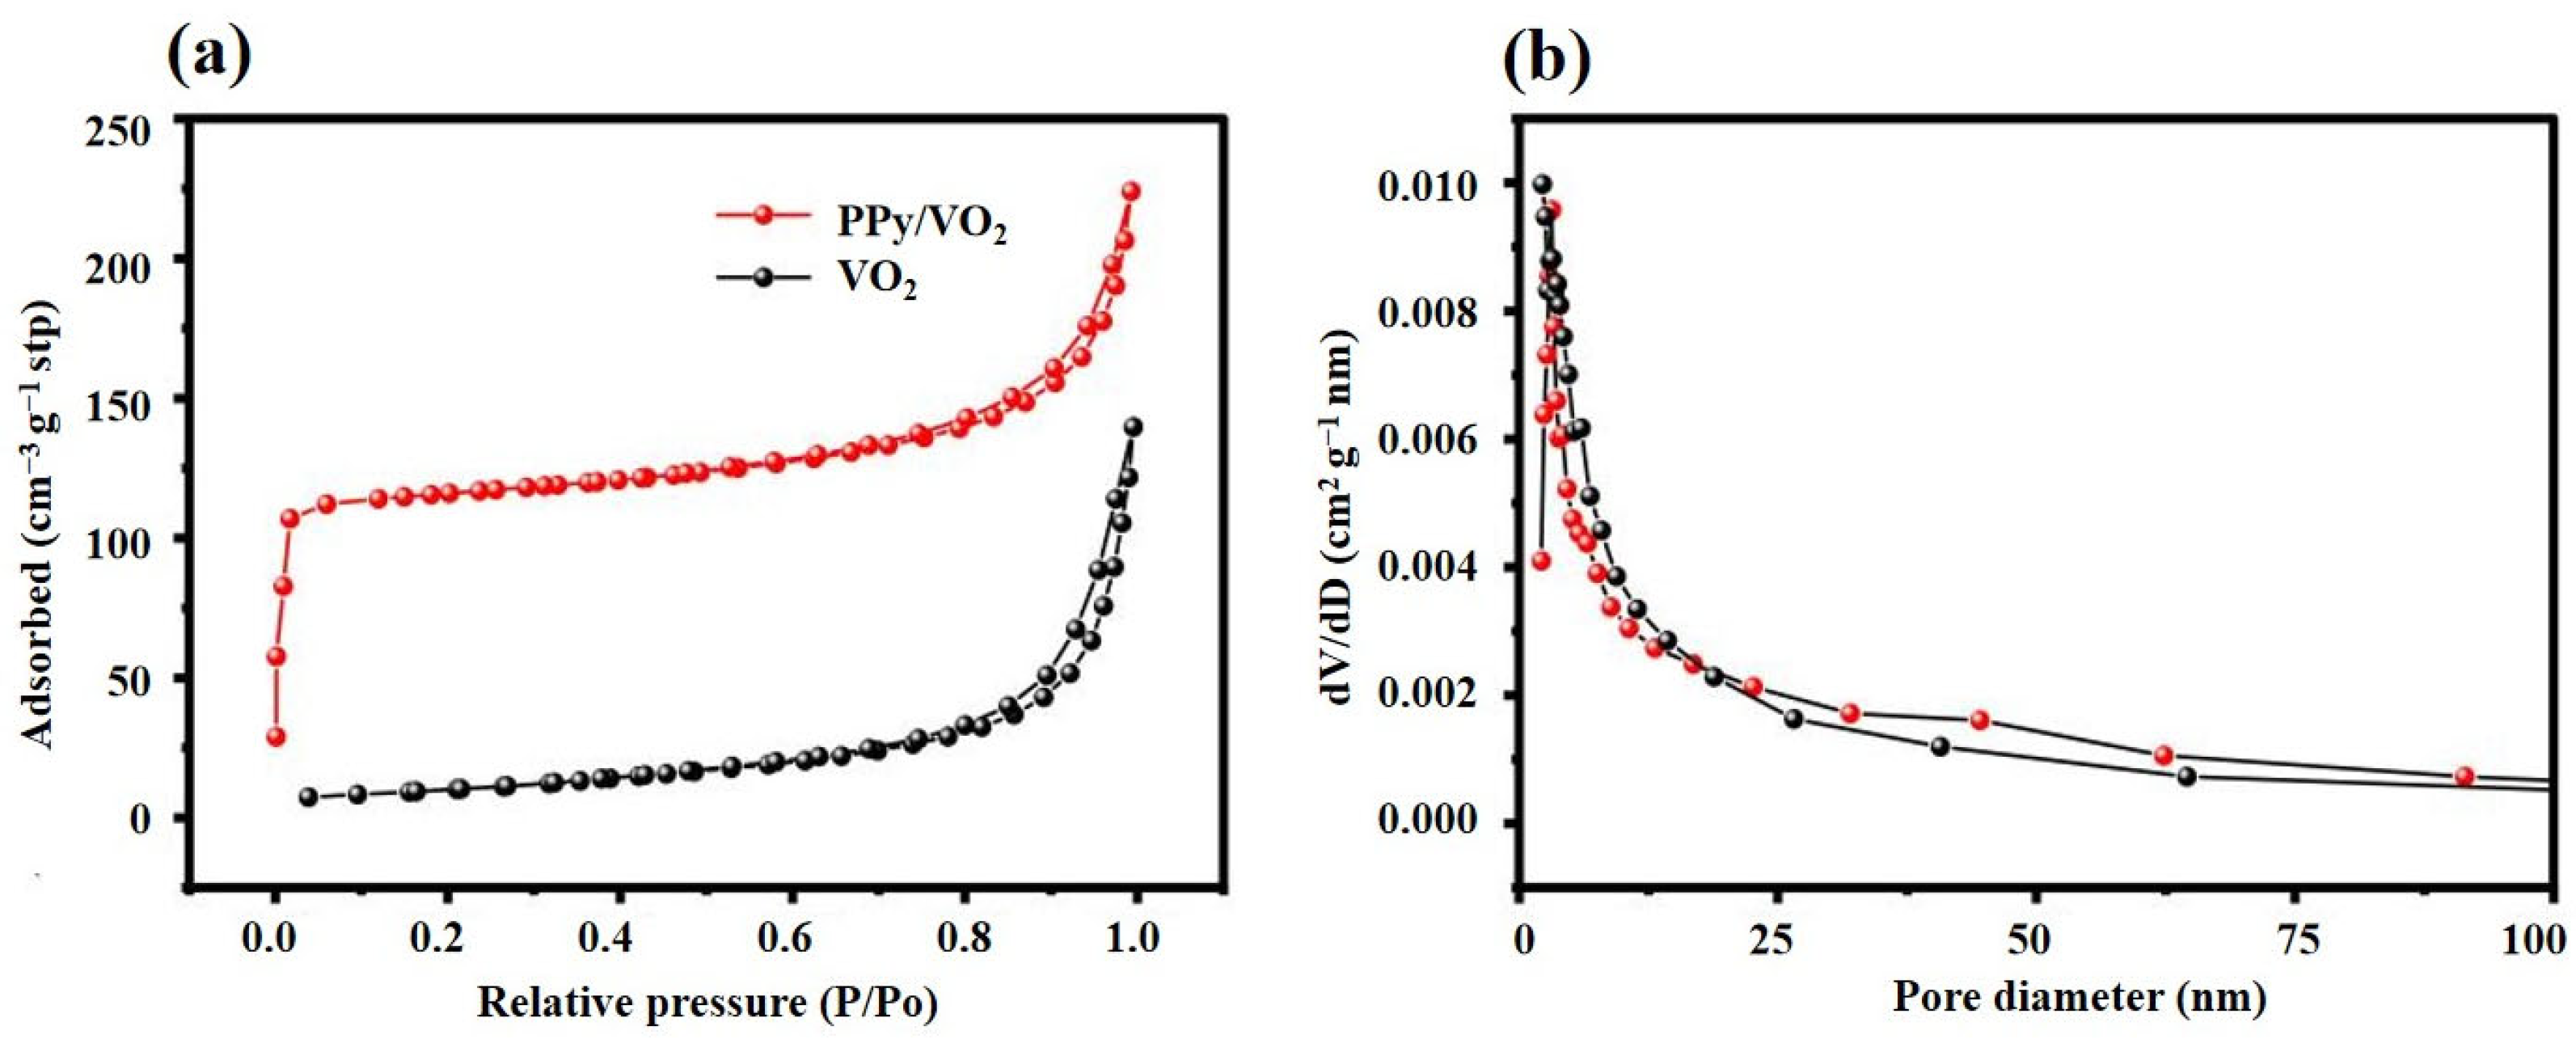
3.1.4. Nitrogen Adsorption/Desorption Test

To study the pore size distribution and pore structure characteristics of the synthesized materials, nitrogen adsorption-desorption tests are performed on both VO2 and PPy/VO2 samples, as shown in Figure 4.
Figure 4a shows the nitrogen adsorption/desorption isotherms of VO2 and PPy/VO2 measured at 77 K. Both materials exhibit isotherms resembling type IV characteristics according to the IUPAC classification [32], with clear hysteresis loops appearing in the high relative pressure region (P/P0 > 0.8), indicative of mesoporous structures. Compared to pristine VO2, PPy/VO2 demonstrates a significantly higher adsorption capacity across the entire pressure range, suggesting an increase in both pore volume and specific surface area. The BET surface area (SSA) increases from 139.75 m2/g for VO2 to 224.04 m2/g for PPy/VO2, representing an improvement of approximately 60%. This enhanced surface area offers more electrochemically active sites, facilitating improved Zn2+ adsorption, electrolyte accessibility, and interfacial charge transfer.
However, it is noteworthy that PPy/VO2 exhibits a sharp increase in nitrogen uptake at very low relative pressures (P/P0 < 0.02), which is typically associated with micropore filling or strong adsorbate–adsorbent interactions [32]. Such behavior is uncommon in PPy/VO2 systems. This unexpected feature raises the possibility of instrumental artifacts (e.g., incomplete degassing) or the presence of minor micropores not accounted for in the synthesis design.
Due to the limitations of the BJH method in accurately resolving micropores, further confirmation using DFT-based pore size distribution analysis or additional degassing and repeat measurements would be necessary to fully validate the porosity profile. This refinement will be addressed in future work to ensure the reliability of the data.
As shown in Figure 4b, the pore size distribution derived from the BJH method reveals bimodal mesoporosity, with dominant pore sizes centered at ~2.85 nm and ~22.63 nm. This multiscale pore structure enhances electrolyte infiltration and ion diffusion, while the hierarchical porosity contributes to efficient charge transport, both of which are beneficial for boosting electrochemical performance [32].

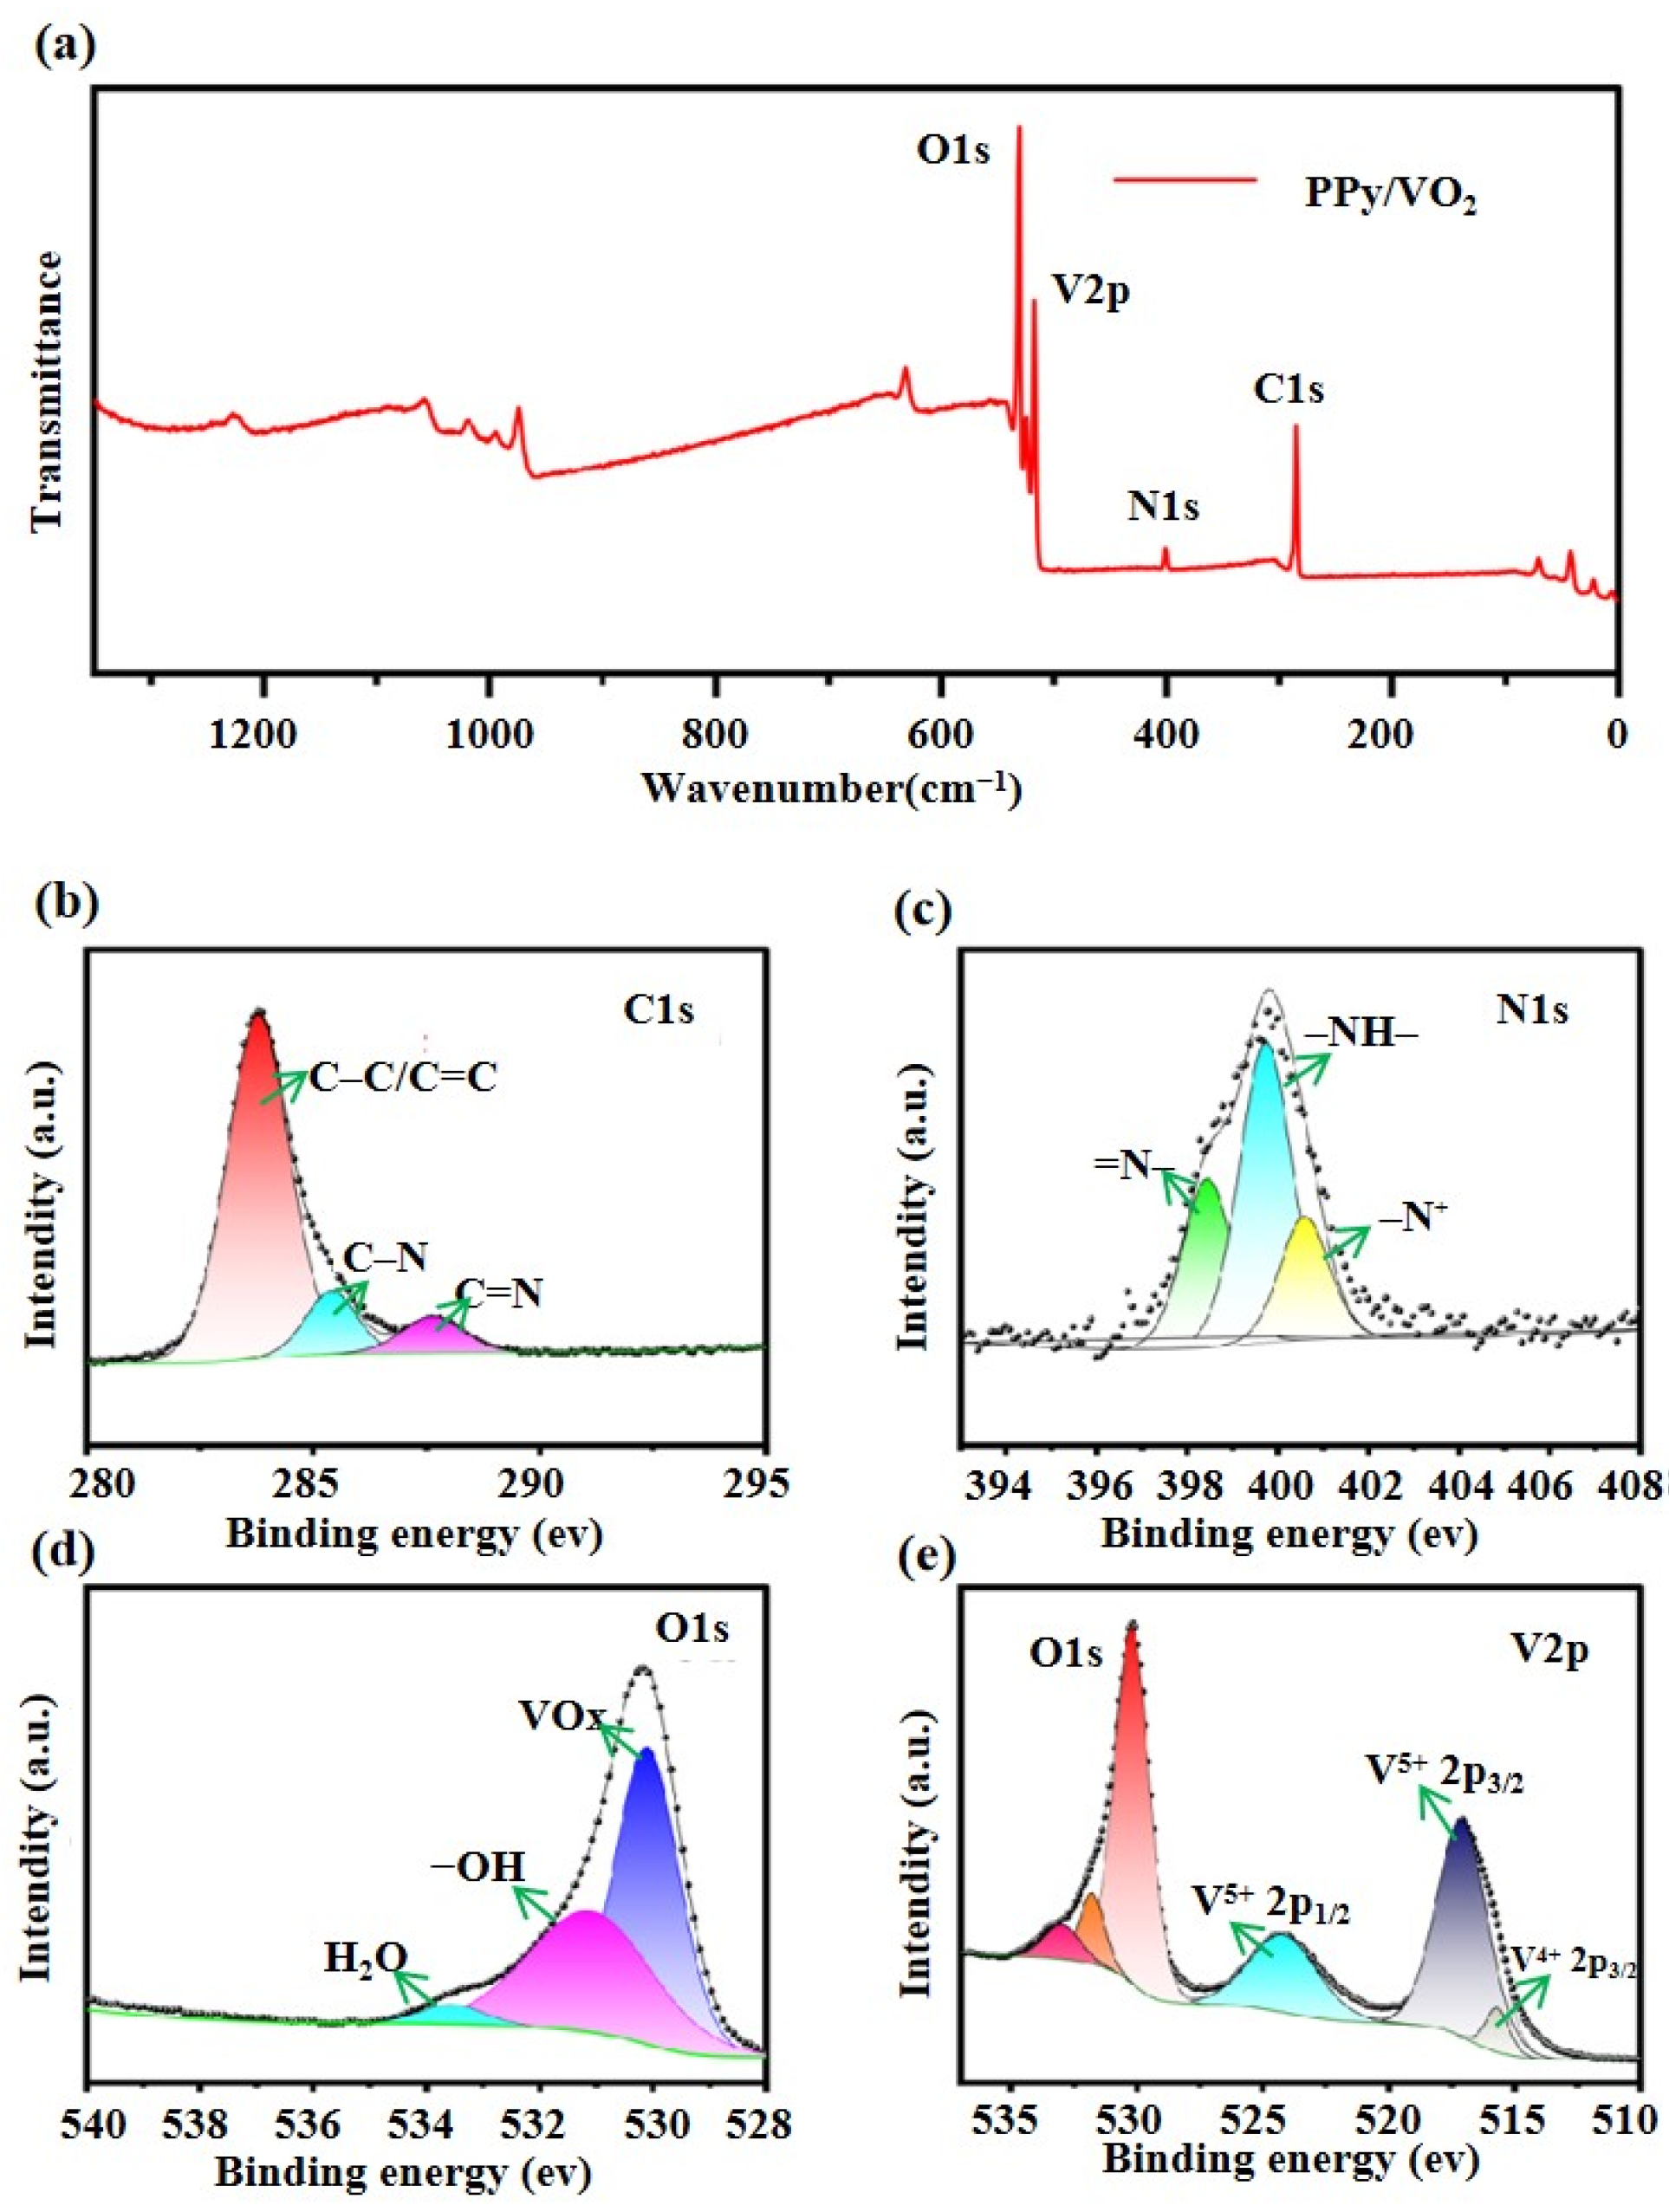
3.1.5. X-Ray Photoelectron Spectroscopy (XPS) Analysis

To further investigate the surface elemental composition and chemical states of PPy/VO2, XPS analysis is conducted, as presented in Figure 5.
Figure 5a shows the survey spectrum of the PPy/VO2 sample, clearly indicating the presence of characteristic peaks corresponding to O 1s, V 2p, N 1s, and C 1s, which are the main constituents of the material.
Figure 5b presents the high-resolution C 1s spectrum, which exhibits three distinct peaks at approximately 283.2 eV, 285.6 eV, and 287.4 eV. These are attributed to C–C/C=C, C–N, and C=N bonds, respectively, confirming the carbon bonding configurations within the PPy backbone and verifying the successful incorporation of PPy [33].
Figure 5c shows the N 1s spectrum, which reveals three nitrogen species with binding energies at 398.4 eV, 399.68 eV, and 400.68 eV. These peaks correspond to quinoid (=N–), benzenoid (–NH–), and positively charged quaternary nitrogen (–N⁺), reflecting the diverse nitrogen bonding configurations within the PPy framework.
Figure 5d displays the high-resolution O 1s spectrum, with three main peaks observed at 530.1 eV, 531.6 eV, and 533.7 eV. These correspond to lattice oxygen in VOx, hydroxyl groups (–OH) in the PPy chains, and adsorbed water (H2O), respectively. Notably, the prominent peak at 530.1 eV suggests the presence of partially oxidized V2O5 components on the VO2 surface [25].
Figure 5e depicts the V 2p spectrum, where the peak at 524.18 eV is attributed to the V 2p1/2 orbital of V5+. Peaks at 515.18 eV and 517.18 eV correspond to the V 2p3/2 orbitals of V4+ and V5+, respectively, indicating the coexistence of vanadium in both +4 and +5 oxidation states [26]. The presence of V5+ may result from residual V2O5 on the VO2 surface or partial oxidation of VO2 during synthesis.

3.2. Electrochemical Performance

To evaluate the Zn2⁺ storage capability of the synthesized material as a cathode for AZIBs, CR2016-type coin cells are assembled under ambient conditions, as detailed in the Materials and Methods section.

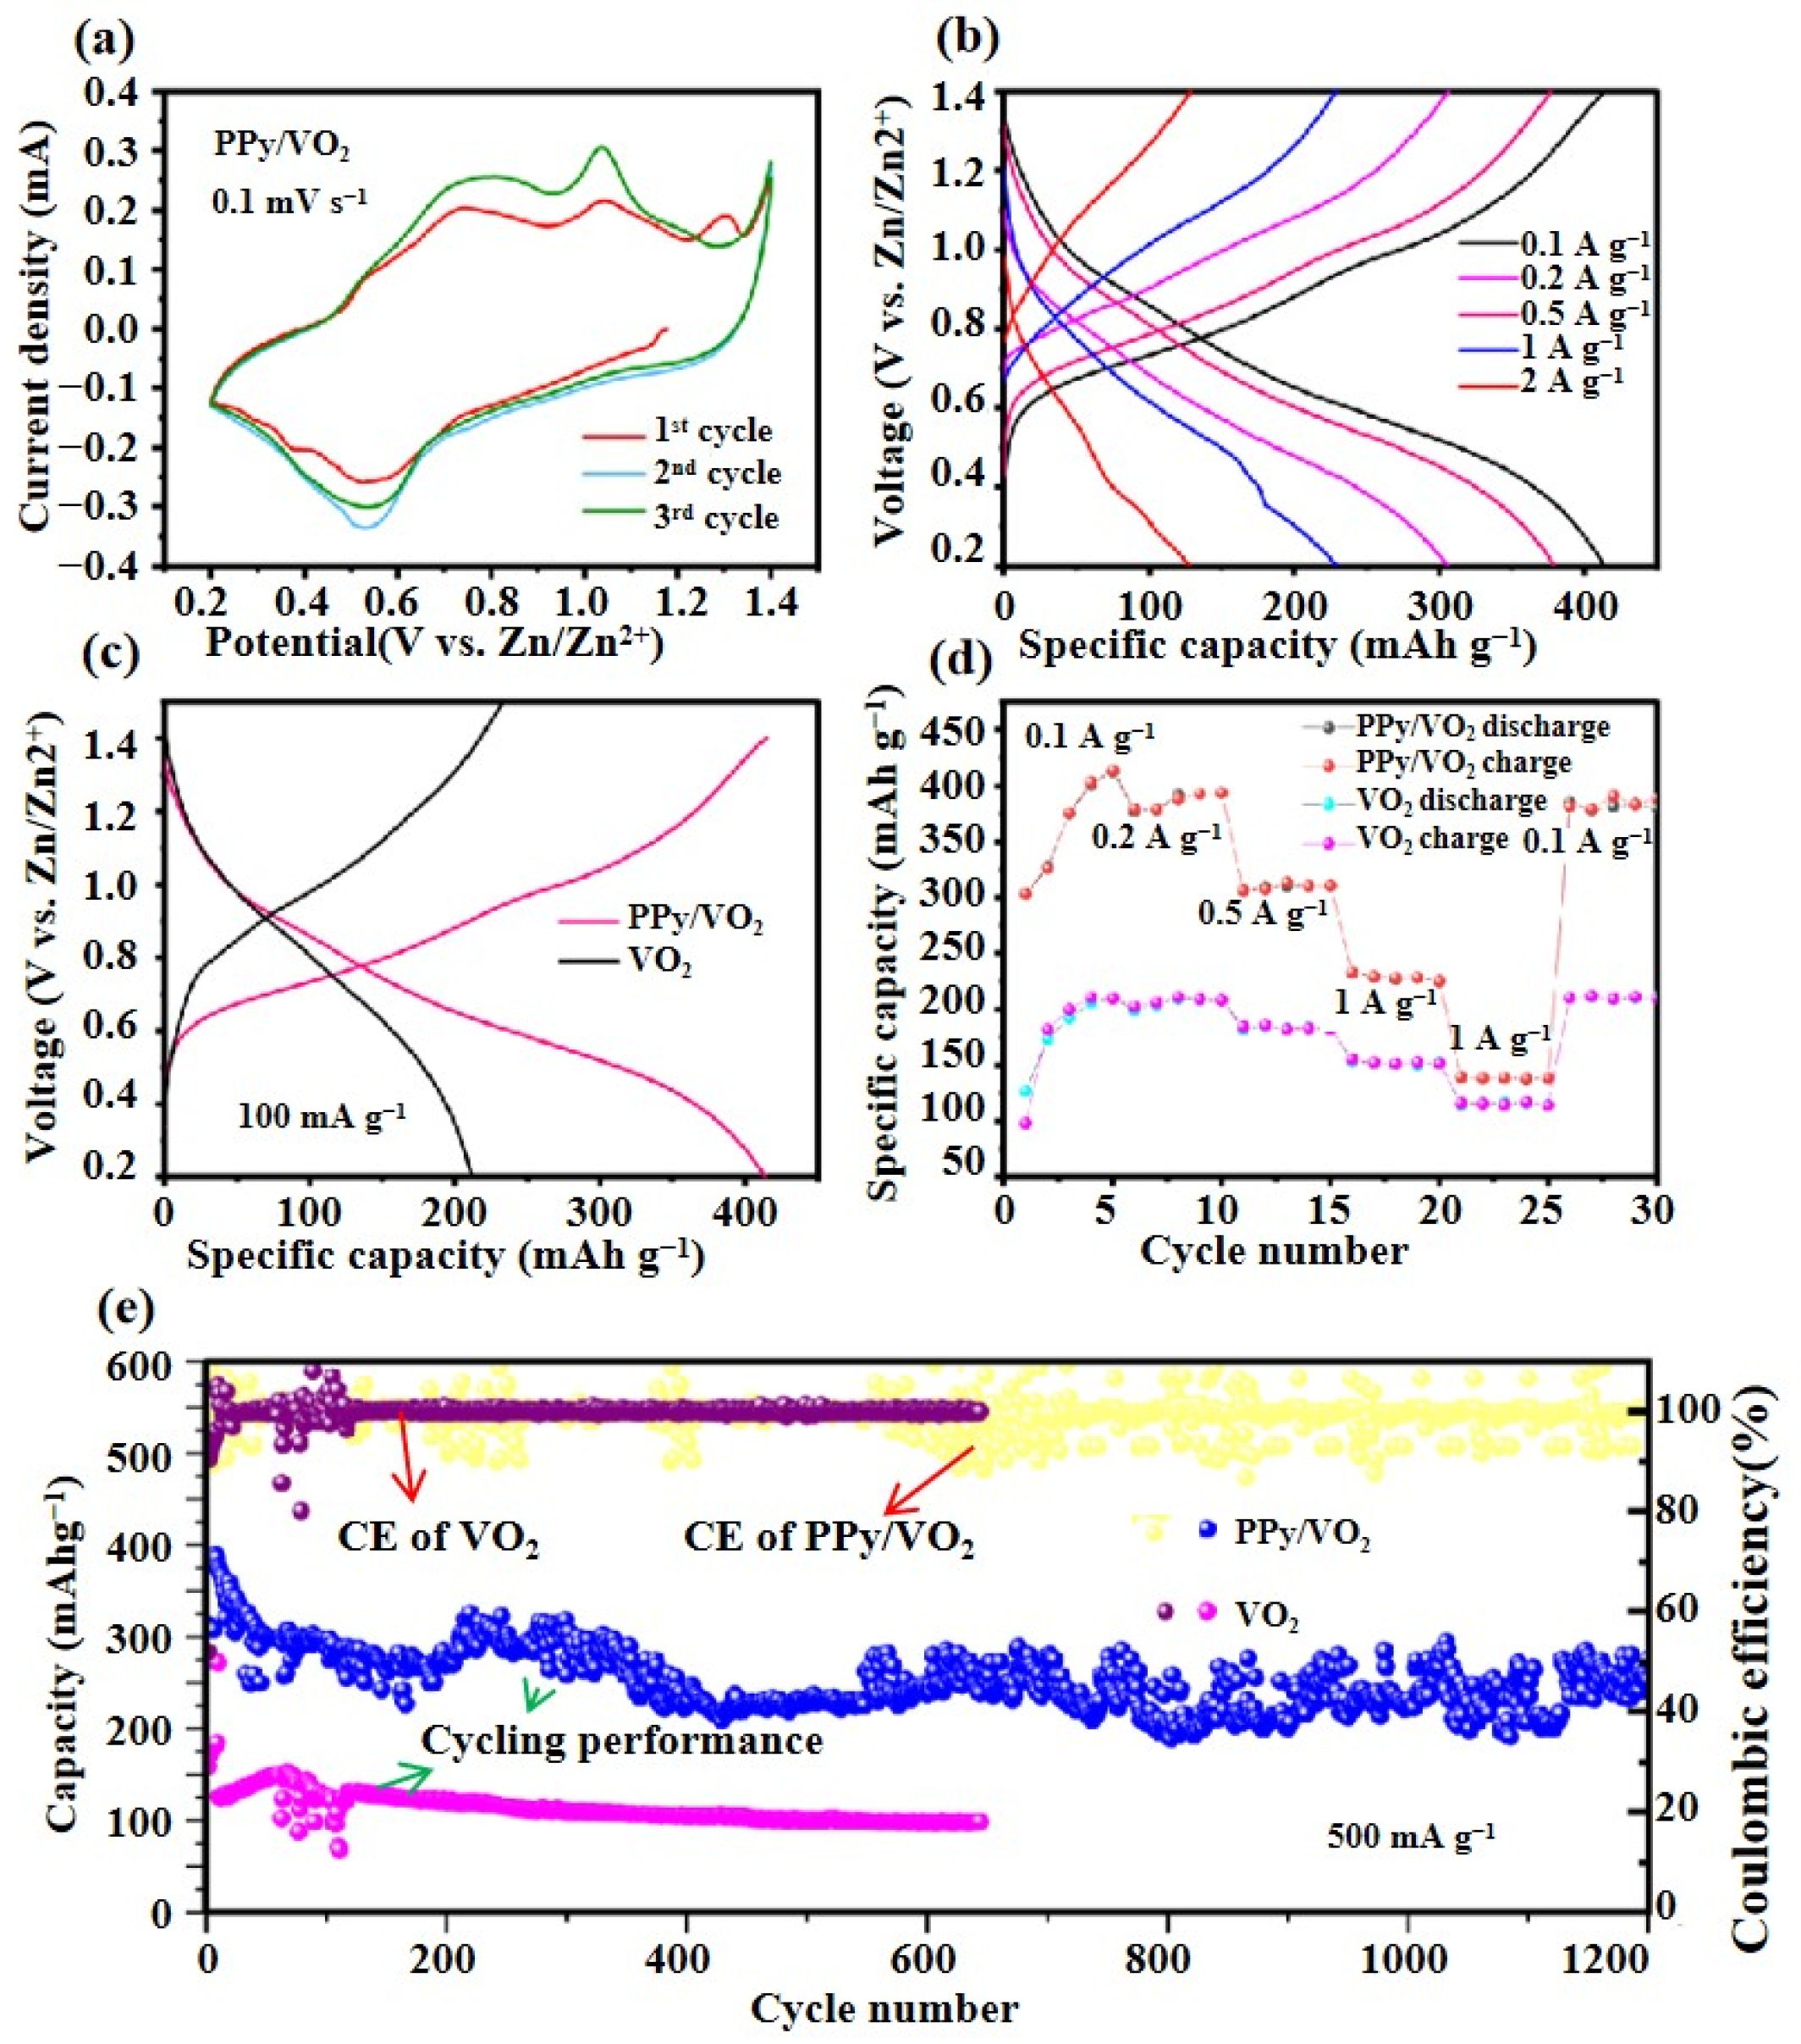
3.2.1. Cyclic Voltammetry (CV) Test

Figure 6 presents the electrochemical performance of PPy/VO2, including cyclic voltammetry, rate capability, capacity comparison, rate performance, and cycling stability.
Figure 6a displays the CV curves of PPy/VO2 at a scan rate of 0.1 mV s−1 within the voltage window of 0.2–1.4 V during the initial three cycles. Three distinct redox peaks are observed, indicating the Zn2+ storage mechanism. The cathodic peak at approximately 0.52 V corresponds to the intercalation of Zn2+ ions, while the anodic peaks at 0.8 V and 1.0 V are associated with the deintercalation process.
As shown in Figure 6b, the GCD profiles of PPy/VO2 at different current densities reveal minimal variation in shape, even when the current density increases from 0.1 A g−1 to 2 A g−1. This indicates favorable structural robustness and fast reaction kinetics. Notably, the distinct voltage plateaus are retained at higher current densities, confirming the superior rate performance of the PPy/VO2 system.
A comparison of the charge–discharge performance between pristine VO2 and PPy/VO2 at a current density of 100 mA g−1 is presented in Figure 6c. PPy/VO2 exhibits a high discharge capacity of 413 mAh g−1, significantly surpassing that of VO2 (210 mAh g−1). This enhancement is attributed to the conductive network and buffering structure provided by PPy [26].
Figure 6d illustrates the rate capability of PPy/VO2 at various current densities (0.1, 0.2, 0.5, 1, and 2 A g−1), yielding average discharge capacities of 413.87, 379.56, 306.47, 225.37, and 139.2 mAh g−1, respectively. Importantly, when the current density returns to 0.1 A g−1, the capacity recovers to 391.04 mAh g−1, demonstrating outstanding rate capability and structural reversibility.
Long-term cycling performance is shown in Figure 6e. After 1200 cycles at a current density of 0.5 A g−1, PPy/VO2 retains 87.2% of its initial capacity, which is significantly higher than that of pristine VO2, whose capacity retention drops to 64.3% after 600 cycles.
However, noticeable fluctuations in the capacity profile are observed during long-term cycling. These variations may stem from several factors [29,30]. One plausible cause is electrode instability resulting from repeated volume changes during Zn2+ intercalation/deintercalation. Another possible explanation is partial dissolution of vanadium species into the aqueous electrolyte, a well-documented issue in vanadium-based cathodes that can alter the redox environment and introduce cycling instability. Additionally, side reactions such as electrolyte decomposition or the formation/dissolution of intermediate zinc-vanadium complexes may also contribute to the observed fluctuations.
Despite these variations, the coulombic efficiency (CE) remains consistently close to 100% throughout all 1200 cycles, suggesting that the charge/discharge processes are highly reversible and that no significant parasitic reactions dominate [26].

3.2.2. Electrochemical Kinetics Analysis

Figure 7 systematically illustrates the electrochemical kinetics behavior of PPy/VO2, providing insight into the charge storage mechanism that underpins its excellent rate capability.
As shown in Figure 7a, the CV curves of PPy/VO2 recorded at scan rates ranging from 0.1 to 1.0 mV s−1 consistently exhibit three well-defined redox peak pairs, which are indicative of multi-step Zn2+ insertion/extraction processes and favorable electrochemical reversibility. With increasing scan rate, the anodic peaks gradually shift toward higher potentials, and the cathodic peaks shift toward lower potentials, which reflects increasing polarization and kinetic limitations in the redox reactions—an expected behavior in diffusion-controlled systems [34].
At a scan rate of 0.8 mV s−1, a significant peak shift is observed. This shift occurs because, as the scan rate increases, the ion diffusion and charge transfer rates in the electrochemical reactions are limited, leading to polarization at the electrode surface. This polarization causes the redox peaks to shift, with the anodic peak moving to higher potentials and the cathodic peak moving to lower potentials. Such behavior is typical in diffusion-controlled systems [35].
To further investigate the energy storage mechanism, a classical electrochemical kinetics model is employed for quantitative analysis [16,36].
The relationship between scan rate (v) and peak current (i) can be described as follows:
i = a v b
The logarithmic form of Equation (1) is as follows:
log i = b log v + log ( a )
The calculation of the slope b provides a qualitative analysis of the electrochemical kinetics. Typically, the value of b ranges between 0.5 and 1.0. When b = 0.5, the process is diffusion-controlled, whereas b = 1 indicates a surface capacitive process.
By performing a linear fitting of the logarithmic relationship between peak current and scan rate for each redox peak in CV curves (Figure 7b), the b-values corresponding to different peaks are determined to be 0.75, 0.87, and 0.86, respectively. These b-values are significantly greater than 0.5 and approach 1.0, indicating that the energy storage process of PPy/VO2 is primarily governed by surface-controlled pseudocapacitive behavior rather than the traditional diffusion-controlled intercalation mechanism. This result suggests that the PPy/VO2 material enables fast and reversible Zn2+ insertion/extraction, exhibiting a rapid electrochemical kinetics response.
According to the semi-empirical method proposed by Dunn et al. [37,38], the total CV current i can be divided into two components: surface capacitive current ( k 1 v ) and diffusion-controlled current ( k 2 v ), both of which vary with scan rate v.
Equation (3) is used to characterize and differentiate the contributions of surface capacitive and diffusion-controlled redox processes:
i = k 1 v + k 2 v
where i (A) represents response current, v (mV·s−1) denotes scan rate, and k1 and k2 are constants. For a given potential, the surface capacity and diffusion-controlled contribution can be calculated by fitting the linear relationship according to Equation (4).
Divide both sides of Equation (3) by v :
i v = k 1 v + k 2
Equation (4) determines the proportion of surface capacity contribution at different scan rates by utilizing the integral area ratio between the surface capacity response current and the total current.
Figure 7c–e further analyzes the current responses at different scan rates, separating capacitive contribution (highlighted in pink) from the diffusion-controlled component. Specifically, at a scan rate of 0.5 mV s−1, the capacitive contribution accounts for 45.3% of the total capacity (Figure 7d), and this value increases to 66.1% when the scan rate is elevated to 1.0 mV s−1 (Figure 7e).
The bar chart in Figure 7f clearly illustrates that the capacitive contribution gradually increases from 40.7% at 0.1 mV s−1 to 66.1% at 1.0 mV s−1, indicating that under fast scan conditions, PPy/VO2 predominantly relies on a surface-controlled pseudocapacitive mechanism for energy storage.
In summary, PPy/VO2 exhibits a distinct surface capacitance-dominated behavior, with its Zn2+ storage process primarily governed by rapid and reversible pseudocapacitive reactions. This significantly enhances the energy output efficiency and reaction kinetics of the material at high charge/discharge rates.

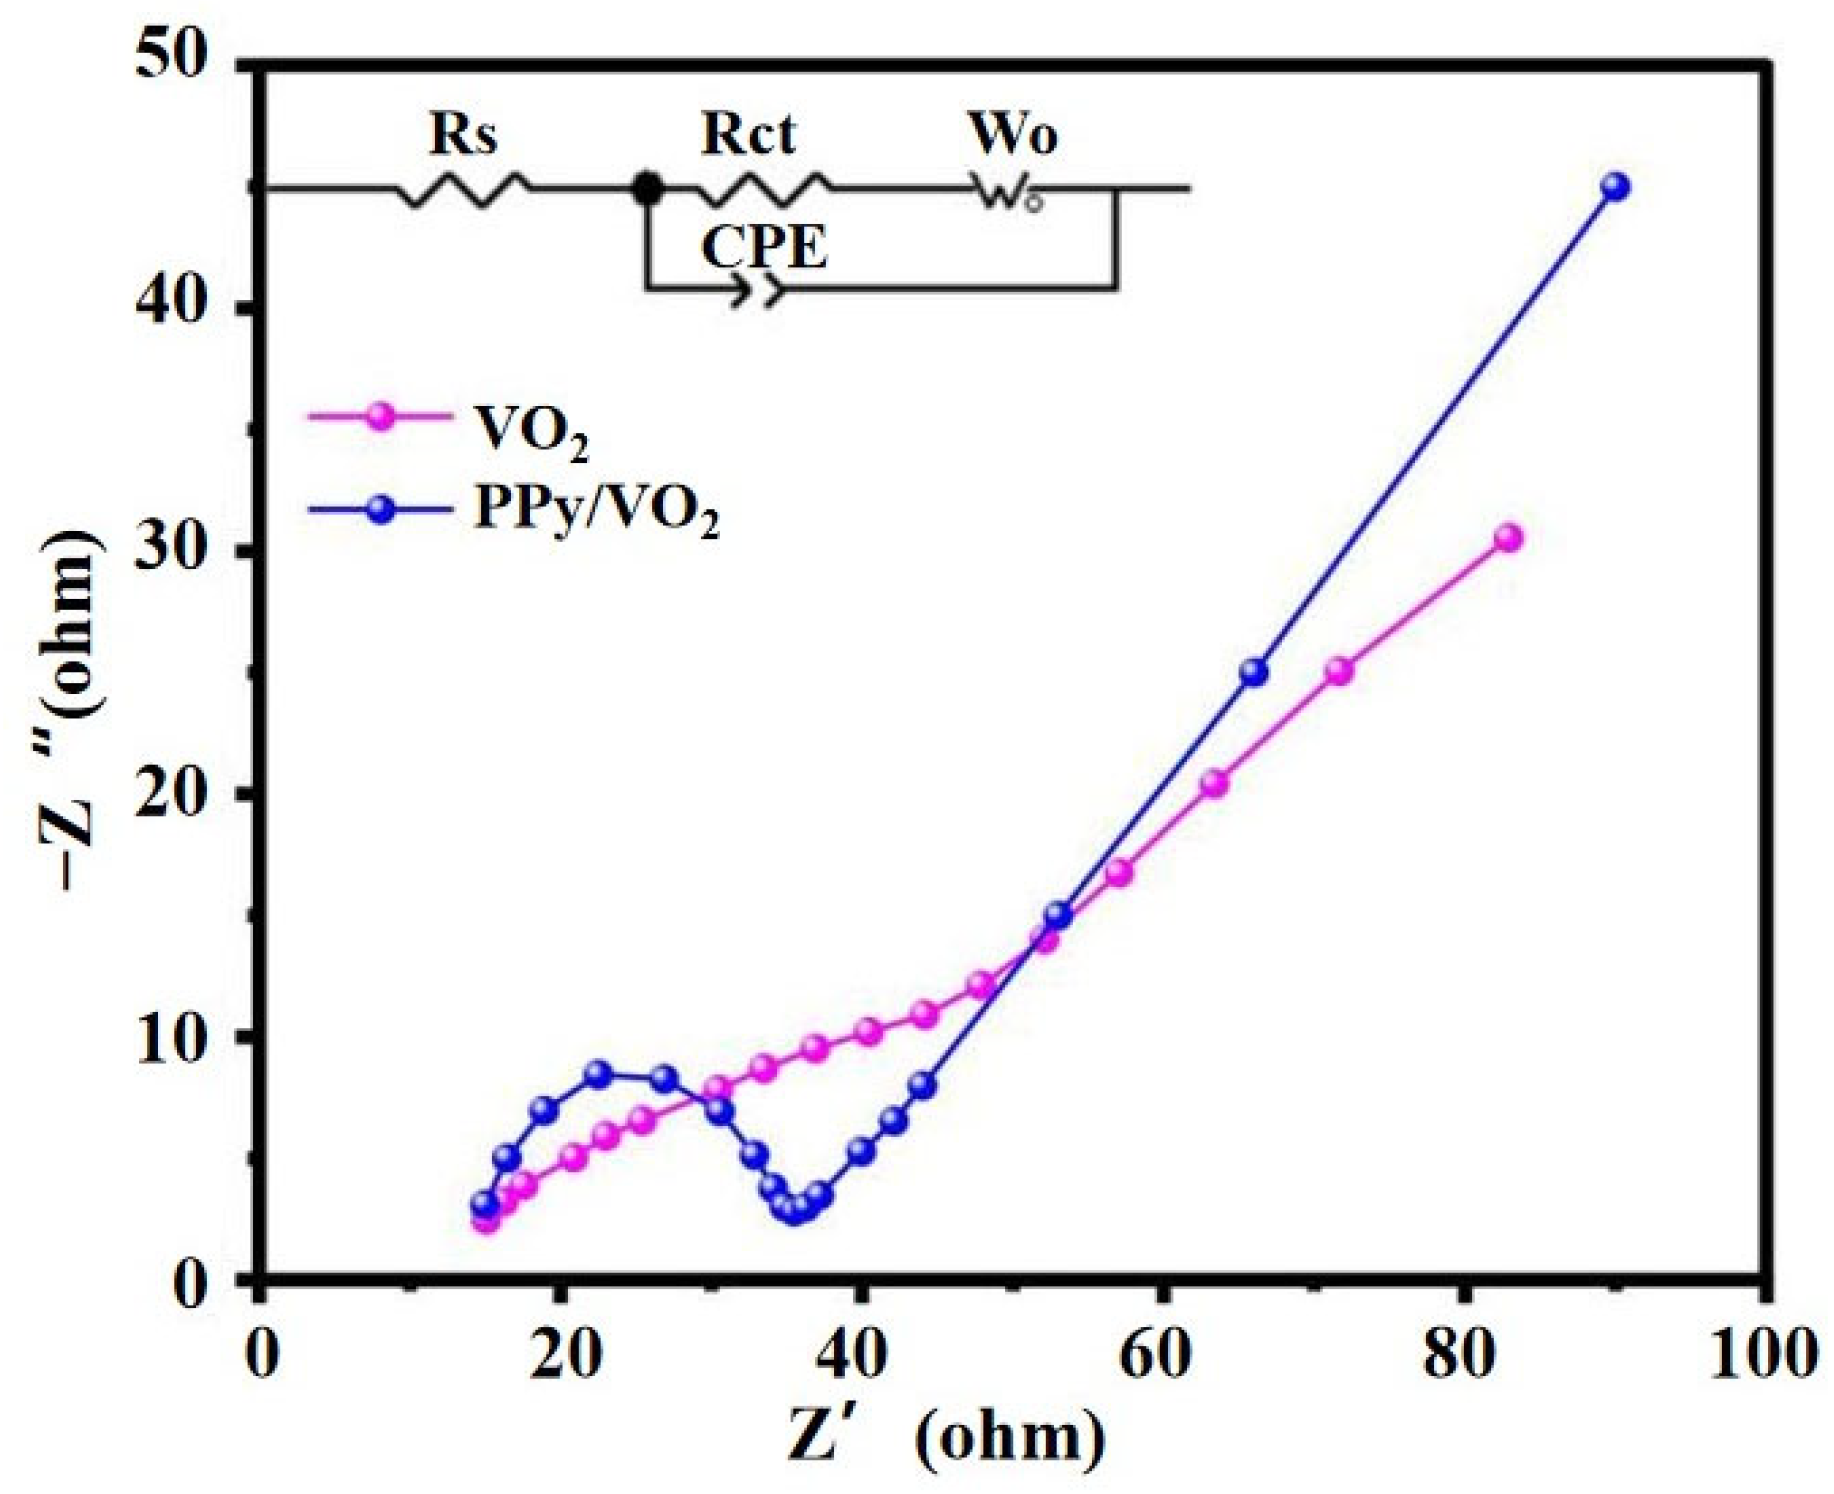
3.2.3. Electrochemical Impedance Spectroscopy (EIS) Analysis

The electrochemical impedance spectroscopy (EIS) results for PPy/VO2 and pristine VO2 are presented in Figure 8. The distinct differences in their Nyquist plots under identical conditions provide insights into their respective electron transport and ion diffusion capabilities. Each Nyquist plot consists of a semicircle in the high-frequency region and a straight line in the low-frequency region [30,32]. The high-frequency semicircle corresponds to the charge transfer process, while the low-frequency inclined line is attributed to ion diffusion.
The inset in the top-left corner of Figure 8 shows the equivalent circuit model used for fitting, comprising the series resistance (Rs), charge transfer resistance (Rct), constant phase element (CPE), and Warburg diffusion impedance (W0).
According to the fitted data, the Rct of PPy/VO2 is 16.42 Ω, which is significantly lower than that of VO2 (45.23 Ω). As a conductive polymer, PPy effectively forms a three-dimensional conductive network, promoting interfacial electron transport and significantly reducing the energy barrier for charge transfer. This structural feature is crucial for improving the charge transport kinetics of the electrode material [25,26].
The updated EIS fitting results (Table 2) further support this conclusion. Compared to pure VO2, PPy/VO2 demonstrates significantly lower Rct (16.4 Ω vs. 45.2 Ω), reduced Warburg impedance (Wo-R and Wo-T), and improved CPE parameters that are closer to ideal capacitive behavior.

3.3. Performance Analysis

To comprehensively evaluate the electrochemical performance of PPy/VO2 developed in this work, we conducted a multidimensional comparison with several representative VO2-based composite electrodes, focusing on specific capacity, cycling stability, rate adaptability, and structural–electrolyte compatibility (Table 3) [25,26,39,40].
(1)
Specific capacity at comparable current densities
Among the reported materials, PPy/VO2 delivers a remarkable specific capacity of 413 mAh g−1 at 0.1 A g−1, outperforming V5+-VO2@PPy-180 (314.2 mAh g−1 at 0.5 A g−1) [25] and MnO2/PPy (205.2 mAh g−1 at 0.1 A g−1) [39]. Although other VO2-based hybrid systems—such as VO2@PPy nanowire arrays [26] and VO2(D)/PPy/g-C3N4 composites [39]—also exhibit promising capacitive characteristics, their performance is primarily evaluated under non-battery conditions (e.g., fiber-type supercapacitors or three-electrode CV setups), limiting their applicability to practical full-cell ZIBs environments. In contrast, the PPy/VO2 composite is tested in a two-electrode configuration with 3 M Zn(CF3SO3)2 electrolyte, rendering the reported capacity directly relevant to real-world aqueous battery systems.
(2)
Cycling stability
PPy/VO2 exhibits excellent cycling durability, retaining 87.2% of its initial capacity after 1200 cycles at 0.1 A g−1. This is comparable to the stability of V5+-VO2@PPy-180 (95.99% after 1500 cycles at 0.5 A g−1) and significantly superior to MnO2/PPy (75% after 1000 cycles) [39].
(3)
Rate performance and high-rate adaptability
While many VO2-based electrodes demonstrate high capacities at moderate current densities, few studies report detailed rate performance across a wide range of current loads. In this work, PPy/VO2 maintains excellent redox reversibility and structural stability under increasing rates, delivering 139.2 mAh g−1 at 2 A g−1 and recovering to 391.0 mAh g−1 when the current density returns to 0.1 A g−1.
(4)
Interfacial charge transfer and electrolyte compatibility
EIS reveals that PPy/VO2 exhibits a significantly reduced Rct (16.42 Ω) compared to pure VO2 (45.23 Ω), indicating the formation of an efficient conductive interface between PPy and VO2. Furthermore, the use of Zn(CF3SO3)2 as the sole electrolyte eliminates interference from Mn2+-based buffering effects, as observed in MnO2/PPy systems [36], ensuring that the performance enhancement stems from the intrinsic properties of the composite rather than electrolyte composition.
(5)
Scalability and practicality electrode processing
Unlike VO2@PPy nanowire arrays grown on carbon nanorod (CNT) fibers [26], which require intricate substrate templating and microfabrication steps, PPy/VO2 is synthesized via a simple, scalable hydrothermal self-assembly method. The resulting free-standing powder can be readily incorporated into standard slurry-cast electrodes, enhancing the material’s compatibility with existing manufacturing infrastructure and its potential for commercial application.

4. Conclusions

In this study, a PPy/VO2 nanocomposite is successfully synthesized via a simple combination of hydrothermal reaction and self-assembly, wherein VO2 nanospheres are grown in situ on polypyrrole (PPy) nanorods, forming a well-defined core–shell architecture. The resulting composite is applied as a cathode material for aqueous ZIBs. Experimental results demonstrate that the composite offers significant advantages in structural design and interfacial optimization. The PPy nanorods provide a stable and conductive framework, while the uniform dispersion and strong anchoring of VO2 nanospheres enhance ionic and electronic transport, reduce interfacial resistance, and improve the overall energy conversion efficiency of the battery.
Electrochemical performance evaluations show that PPy/VO2 exhibits a high specific capacity, excellent rate capability, and superior long-term cycling stability. It achieves a discharge capacity of 413 mAh g−1 at a current density of 100 mA g−1 and maintains 87.2% of its initial capacity after 1200 cycles, highlighting its considerable potential for high-performance energy storage applications. These findings not only provide a new route for cathode material optimization in ZIBs but also open avenues for designing polymer-inorganic hybrid systems with improved interface engineering and pseudocapacitive behavior in next-generation aqueous batteries.

Author Contributions

Writing—original draft preparation, T.Z. and S.L.; writing—review and editing, Y.L., Y.C. and X.L.; validation, D.X. and Y.L. All authors have read and agreed to the published version of the manuscript.

Funding

This research was funded by the Natural Science Foundation of Hunan Province, China (Grant No. 2023JJ50499, No. 2023JJ50493, No. 2024JJ7275, No. 2024JJ7276 and No. 2025JJ70308) and was supported by the Scientific Research Fund of Hunan Provincial Education Department (No. 23B0807).

Data Availability Statement

The data used to support the findings of this study are included within the article.

Conflicts of Interest

The authors declare no conflicts of interest.

References

  1. Hu, A.; Chen, W.; Li, F.; He, M.; Chen, D.; Li, Y.; Zhu, J.; Yan, Y.; Long, J.; Hu, Y. Nonflammable Polyfluorides-Anchored Quasi-Solid Electrolytes for Ultra-safe Anode-free Lithium Pouch Cells without Thermal Runaway. Adv. Mater. 2023, 35, 202304762. [Google Scholar] [CrossRef] [PubMed]
  2. Guo, P.; Li, X.; Tang, T.; Cheng, Y.; Wang, Y.; Yang, Y.; Liu, L.; Li, Y.; Li, M.; Xiao, J.; et al. Modularized Cathode with Neural Network Topology for High Rate and Fault-Tolerant Lithium–Sulfur Batteries. Adv. Mater. 2025, 2504908. [Google Scholar] [CrossRef]
  3. Zhao, C.; Yan, Z.; Zhou, B.; Pan, Y.; Hu, A.; He, M.; Liu, J.; Long, J. Identifying the Role of Lewis-Base Sites for the Chemistry in Lithium-Oxygen Batteries. Angew. Chem. Int. Ed. 2023, 62, 202302746. [Google Scholar] [CrossRef]
  4. Wang, B.; Wang, Y.; Lan, Y.; Lu, G.; Liu, L.; Tang, T.; Li, M.; Cheng, Y.; Xiao, J.; Li, X. Integrated Design for Discrete Sulfur @ Polymer Nanoreactor with Tandem Connection as Lithium–Sulfur Battery Cathodes. Angew. Chem. Int. Ed. 2024, 63, e202406693. [Google Scholar] [CrossRef] [PubMed]
  5. Wang, P.; Gong, Z.; Wang, D.; Hu, R.; Ye, K.; Gao, Y.; Zhu, K.; Yan, J.; Wang, G.; Cao, D. Facile Fabrication of F-doped Biomass Carbon as High-Performance Anode Material for Potassium-ion Batteries. Electrochim. Acta 2021, 389, 138799. [Google Scholar] [CrossRef]
  6. Quilty, C.; Wu, D.; Li, W.; Bock, D.; Wang, L.; Housel, L.; Abraham, A.; Takeuchi, K.; Marschilok, A.; Takeuchi, E. Electron and Ion Transport in Lithium and Lithium-Ion Battery Negative and Positive Composite Electrodes. Chem. Rev. 2023, 123, 1327–1363. [Google Scholar] [CrossRef]
  7. Zhu, Y.; Ge, M.; Lai, H. Multifunctional Electrolyte Additives for Better Metal Batteries. Adv. Funct. Mater. 2024, 34, 2301964. [Google Scholar] [CrossRef]
  8. Yi, X.; Feng, Y.; Rao, A.; Zhou, J.; Wang, C.; Lu, B. Quasi-Solid Aqueous Electrolytes for Low-Cost Sustainable Alkali-metal Batteries. Adv. Mater. 2023, 35, 2302280. [Google Scholar] [CrossRef] [PubMed]
  9. Feng, Y.; Rao, A.; Lu, Z. Selective Potassium Deposition Enables Dendrite-resistant Anodes for Ultrastable Potassium-Metal Batteries. Adv. Mater. 2023, 35, 2300886. [Google Scholar] [CrossRef]
  10. Wang, T.; Sun, J.; Hua, Y.; Krishna, B.; Xi, Q.; Ai, W.; Yu, J. Planar and Dendrite-Free Zinc Deposition Enabled by Exposed Crystal Plane Optimization of Zinc Anode. Energy Storage Mater. 2022, 53, 273–304. [Google Scholar] [CrossRef]
  11. Yi, Z.; Chen, G.; Hou, F. Strategies for the Stabilization of Zn Metal Anodes for Zn-Ion Batteries. Adv. Energy Mater. 2021, 11, 2003065. [Google Scholar] [CrossRef]
  12. Xiao, Y.; Ren, J.; Li, M.; Xiao, K.; Wang, Y. Charge-Tuning Mediated Rapid Kinetics of Zinc Ions in Aqueous Zn-Ion Battery. Chem. Eng. J. 2023, 474, 145801. [Google Scholar] [CrossRef]
  13. Huang, J.; Li, Y.; Xie, R.; Li, J.; Tian, Z.; Chai, G.; Zhang, Y.; Lai, F.; He, G.; Liu, C. Structural Engineering of Cathodes for Improved Zn-Ion Batteries. J. Energy Chem. 2021, 58, 147–155. [Google Scholar] [CrossRef]
  14. Tian, Y.; An, Y.; Liu, C.; Xiong, S.; Feng, J.; Qian, Y. Reversible Zinc-based Anodes Enabled by Zincophilic Antimony Engineered MXene for Stable and Dendrite-free Aqueous Zinc Batteries. Energy Storage Mater. 2021, 41, 343–353. [Google Scholar] [CrossRef]
  15. Fu, X.; Li, G.; Wang, X.; Wang, J.; Yu, W.; Dong, X.; Liu, D. The Etching Strategy of Zinc Anode to Enable high Performance Zinc-Ion Batteries. J. Energy Chem. 2024, 88, 125–143. [Google Scholar] [CrossRef]
  16. Blanc, L.; Kundu, D.; Nazar, L. Scientific Challenges for the Implementation of Zn-Ion Batteries. Joule 2020, 4, 771–799. [Google Scholar] [CrossRef]
  17. Xia, J.; Zhou, Y.; Zhang, J.; Lu, T.; Gong, W.; Zhang, D.; Wang, X.; Di, J. Triggering High Capacity and Superior Reversibility of Manganese Oxides Cathode via Magnesium Modulation for Zn//MnO2 Batteries. Small 2023, 19, 2301906. [Google Scholar] [CrossRef] [PubMed]
  18. Liu, Y.; Liu, Y.; Wu, X. Enhanced Electrochemical Performance of Zn/VO-x Batteries by a Carbon-Encapsulation Strategy. ACS Appl. Mater. Interfaces 2022, 14, 11654–11662. [Google Scholar] [CrossRef]
  19. Sambandam, B.; Kim, S.; Pham, D.; Mathew, V.; Lee, J.; Lee, S.; Soundharrajan, V.; Kim, S.; Alfaruqi, M.; Hwang, J. Hyper oxidized V6O13+x·nH2O Layer Oxide for Aqueous Rechargeable Zn Battery: Effect on Dual Carriers Transportation and Parasitic Reactions. Energy Storage Mater. 2020, 35, 47–61. [Google Scholar] [CrossRef]
  20. Deng, W.; Li, Z.; Ye, Y.; Zhou, Z.; Li, R. Zn2+ Induced Phase Transformation of K2MnFe(CN)6 Boosts Highly Stable Zinc-Ion Storage. Adv. Energy Mater. 2021, 11, 2003639. [Google Scholar] [CrossRef]
  21. Dai, Y.; Kong, X.; Wang, L.; Gu, Y.; Guo, J. Al-induced Fast Phase Transition in Vanadium Oxide Cathode Materials for High-performance Aqueous Zinc-ion Batteries. CrystEngComm 2025, 27, 801–808. [Google Scholar] [CrossRef]
  22. Yan, M.; He, P.; Chen, Y.; Wang, S.; Wei, Q.; Zhao, K.; Xu, X.; An, Q.; Shuang, Y.; Shao, Y. Water-Lubricated Intercalation in V2O5·nH2O for High-Capacity and High-Rate Aqueous Rechargeable Zinc Batteries. Adv. Mater. 2018, 30, 1703725. [Google Scholar] [CrossRef]
  23. Li, Z.; Ganapathy, S.; Xu, Y.; Zhou, Z.; Sarilar, M.; Wagemaker, M. Mechanistic Insight into the Electrochemical Performance of Zn/VO2 Batteries with an Aqueous ZnSO4 Electrolyte. Adv. Energy Mater. 2019, 9, 1900237. [Google Scholar] [CrossRef]
  24. Zhang, W.; Xiao, Y.; Zuo, C.; Tang, W.; Liu, G.; Wang, S.; Cai, W.; Dong, S.; Luo, P. Adjusting the Valence State of Vanadium in VO2(B) by Extracting Oxygen Anions for High-Performance Aqueous Zinc-Ion Batteries. Chem. Sustain. Energy Mater. 2021, 14, 971–978. [Google Scholar] [CrossRef]
  25. Qi, Y.; Jin, X.; Xu, L.; Ren, X.; Xia, Y. Ultra-high Mass-Loading V5+-VO2@PPy Cathode for Aqueous Zinc-Ion Battery. J. Alloys Compd. 2023, 967, 171750. [Google Scholar] [CrossRef]
  26. Ping, M.; Zhang, Q.; Sun, J.; Guo, J.; Wang, X.; Zhou, Z.; He, B.; Li, Q.; Xie, L.; Zhao, J. Hierarchically Structured VO2@PPy Core-Shell Nanowire Arrays Grown on Carbon Nanotube Fibers as Advanced Cathodes for High-Performance Wearable Asymmetric Supercapacitors. Carbon 2018, 139, 21–28. [Google Scholar]
  27. Deng, W.; Li, C.; Zou, W.; Xu, Y.; Chen, Y.; Li, R. Understanding the Super-Theoretical Capacity Behavior of VO2 in Aqueous Zn Batteries. Small 2023, 20, 2309527. [Google Scholar] [CrossRef]
  28. Li, Z.; Zhang, Z.; Zhou, X. Chemical Modulation of Metal–Insulator Transition toward Multifunctional Applications in Vanadium Dioxide Nanostructures. Small 2023, 19, 2305234. [Google Scholar] [CrossRef]
  29. Liu, Y.; Wu, X. High Durable Aqueous Zinc Ion Batteries by Synergistic Effect of V6O13/VO2 Electrode Materials. J. Energy Chem. 2023, 87, 334–341. [Google Scholar] [CrossRef]
  30. Song, Z.; Zhao, Y.; Wang, H.; Zhou, A.; Jin, X.; Huang, Y.; Li, L.; Wu, F.; Chen, R. Dual mechanism with graded energy storage in long-term aqueous zinc-ion batteries achieved using a polymer/vanadium dioxide cathode. Energy Environ. Sci. 2024, 17, 6666–6675. [Google Scholar] [CrossRef]
  31. Chu, F.; Cheng, S.; Ye, Z.; Wu, F.; Zhuang, H.; Dong, W.; Xie, A. In Situ Etching by Released Proton in Aniline Polymerization to form Network VO2 Doped Polyaniline Composites with Variable Infrared Emissivity for Electromagnetic Absorption Application. Adv. Compos. Hybrid Mater. 2022, 5, 2760–2771. [Google Scholar] [CrossRef]
  32. Liu, H.; Yang, L.; Ting, S.; Li, C.; Kang, T.; Niu, H.; Huang, W.; Chang, C.; Yang, M.; Cao, G.; et al. Distorting Local Structures to Modulate Ligand Fields in Vanadium Oxide for High-Performance Aqueous Zinc-Ion Batteries. ACS Nano 2025, 19, 9132–9143. [Google Scholar] [CrossRef] [PubMed]
  33. Tong, Y.; Li, X.; Su, S.; Li, J.; Fang, J.; Liang, B.; Hou, J.; Luo, M. Hydrated Lithium Ions Intercalated V2O5 with Dual-ion Synergistic Insertion Mechanism for High-Performance Aqueous Zinc-Ion Batteries. J. Colloid Interface Sci. 2022, 606, 645–653. [Google Scholar] [CrossRef]
  34. Xie, B.; Wu, X.; Wang, J.; Wang, R.; Dong, Y.; Hou, J.; Lv, R.; Chen, M.; Diao, G. Confinement Sacrifice Template Synthesis of Size Controllable Heterogeneous Double-layer Hollow Spheres SnO2@Void@HCSs as Anode for Li+/Na+ Batteries. J. Electroanal. Chem. 2022, 923, 116830. [Google Scholar] [CrossRef]
  35. Xu, Z.; Sun, Z.; Shan, J.; Jin, S.; Cui, J.; Deng, Z.; Seo, M.; Wang, X. O, N-Codoped, Self-Activated, Holey Carbon Sheets for Low-Cost And High-Loading Zinc-Ion Supercapacitors. Adv. Funct. Mater. 2024, 34, 2302818. [Google Scholar] [CrossRef]
  36. Wang, J.; Polleux, J.; Lim, J.; Dunn, B. Pseudocapacitive contributions to electrochemical energy storage in TiO2 (anatase) nanoparticles. J. Phys. Chem. 2007, 111, 14925–14931. [Google Scholar] [CrossRef]
  37. Xia, Y.; Mathis, T.; Zhao, M.; Anasori, B.; Dang, A.; Zhou, Z.; Cho, H.; Gogotsi, Y.; Yang, S. Thickness-independent Capacitance of Vertically Aligned Liquid-crystalline MXenes. Nature 2018, 557, 409–412. [Google Scholar] [CrossRef]
  38. Zhou, Y.; Fu, Y.; Zhang, T.; Hu, C.; Qiao, F.; Wang, J.; Noh, H.; Baek, J. Synthesis of Size-controllable, Yolk-shell Metal Sulfide Spheres for Hybrid Supercapacitors. Chem. Eng. J. 2023, 476, 146377. [Google Scholar] [CrossRef]
  39. Dhanda, M.; Arora, R.; Saini, M. Nehrac and Suman LataProlific Intercalation of VO2 (D)/polypyrrole/g-C3N4 as an Energy Storing Electrode with Remarkable Capacitance. New J. Chem. 2022, 46, 14251. [Google Scholar] [CrossRef]
  40. Li, S.; Zhou, T.; Liu, M.; Zhao, Q.; Liu, Y.; Cheng, Y.; Li, X. Electrode Design Based on Porous MnO2/PPy Hybrid Nanocomposite and Its Application in Zinc-Ion Batteries. Micromachines 2025, 16, 536. [Google Scholar] [CrossRef]
Figure 1. SEM and TEM images of PPy/VO2: (a,b) SEM images of PPy/VO2 at different magnifications, showing the morphology and structure, (c) HRTEM image of the PPy/VO2 composite, (d) EDS image of the PPy/VO2 composite, and (e,f) TEM images of the PPy/VO2 at different magnifications.
Micromachines 16 00705 g001
Figure 2. Characterization of PPy/VO2 and VO2 samples: (a) XRD patterns of PPy/VO2 and VO2, (b) Raman spectra of PPy/VO2 and VO2, and (c) XRD patterns of PPy.
Micromachines 16 00705 g002
Figure 3. TGA curves of PPy/VO2 at different temperatures.
Micromachines 16 00705 g003
Figure 4. Nitrogen adsorption/desorption isotherms and pore size distribution of PPy/VO2 and VO2 samples: (a) Nitrogen adsorption/desorption isotherms, and (b) BJH pore size distribution curve.
Micromachines 16 00705 g004
Figure 5. XPS analysis of PPy/VO2: (a) survey spectrum; (b) high-resolution C 1s spectrum; (c) high-resolution N 1s spectrum; (d) high-resolution O 1s spectrum; and (e) high-resolution V 2p spectrum.
Micromachines 16 00705 g005
Figure 6. Electrochemical performance of PPy/VO2: (a) CV curves of PPy/VO2 at a scan rate of 0.1 mV s−1 in the voltage range of 0.2–1.4 V during the initial three cycles; (b) GCD curves at different current densities (0.1–2 A g−1); (c) comparison of the discharge capacities of pristine VO2 and PPy/VO2 at 100 mA g−1; (d) rate capability of PPy/VO2 at various current densities and its capacity recovery; and (e) cycling performance and Coulombic efficiency of PPy/VO2 and VO2 electrodes at 0.5 A g−1.
Micromachines 16 00705 g006
Figure 7. Electrochemical kinetics analysis of PPy/VO2. (a) CV curves of PPy/VO2 at various scan rates; (b) log–log plots of peak current (log(i)) versus scan rate (log(v)) derived from the CV curves; (ce) separation of capacitive and diffusion-controlled current contributions at scan rates of 0.1, 0.5, and 1.0 mV s−1, respectively; and (f) variation in the proportion of capacitive contribution with increasing scan rate.
Micromachines 16 00705 g007
Figure 8. Impedance test of PPy/VO2 and VO2.
Micromachines 16 00705 g008
Table 1. Summary of characterization techniques, instruments, and operating conditions.
TechniqueInstrument & ManufacturerKey
Parameters
Software
XRDRigaku D/MAX-2500 (Rigaku, Tokyo, Japan) Cu Kα (λ = 1.5406 Å); 40 kV, 30 mA; 5°/min; 0.02° step
Cu Kα (λ = 1.5406 Å), 40 kV, 30 mA, 2θ: 10~70°, 5°/min, 0.02° step
MDI Jade 6.5
SEM & EDSHitachi S-4800 (Hitachi, Tokyo, Japan) + Oxford EDS (Oxford, UK)5–20 kV accelerating voltageQuartz PCI 8.0, INCA 5.05
TEMJEOL JEM-2100 (JEOL, Tokyo, Japan)200 kV accelerating voltageDigital Micrograph 3.30.2004
XPSThermo ESCALAB 250Xi (Thermo Fisher, Waltham, MA, USA)Al Kα (1486.6 eV), pass energy: 20 eV, resolution: 0.5 eV, base pressure < 5 × 10⁻⁹ mbarThermo Avantage 5.991
Raman SpectroscopyLabRAM HR Evolution (Horiba, Kyoto, Japan)Excitation: 512 nm, room temperatureLabSpec 6.5
BET/BJHASAP 2460 (Micromeritics, Norcross, GA, USA)−196 °C, N2 adsorption–desorption, BET for SSA, BJH for pore sizeMicroActive 6.07
TGA/DTASDT Q600 (TA Instruments, New Castle, DE, USA) Air atmosphere, RT–800 °C, heating rate: 10 °C/minUniversal Analysis 5.5
GCDNeware CT4008 (Neware, Shenzhen, China)Voltage range: 0.2~1.4 V (vs. Zn/Zn2+), room temperatureNeware BTSDA 7.6
CV, EISCHI760E (Chenhua Instruments, Shanghai, China)CV: 0.1–1.0 mV/s; EIS: 100 kHz–0.01 Hz, 5 mV AC amplitude, two-electrode system, room temperatureCHI Software 14.01
Table 2. Analytical data of electrochemical impedance spectroscopy (EIS).
SampleRs (Ω)Rct (Ω)CPE-TCPE-PWo-R (Ω)Wo-T (s)Wo-P
PPy/VO218.016.42.50 × 10−50.886.055.00.450
VO235.045.21.50 × 10−50.8510.070.00.450
Table 3. Comparative analysis of electrochemical performance of selected VO2-based electrode materials for energy storage applications.
MaterialsCurrent
Density
Discharge
Capacity
CyclesCapacity
Retention
ElectrolyteSystem TypeRef.
V5+-VO2@PPy-1800.5 A/g314.2 mAh/g150095.99%3 M Zn(CF3SO3)2Aqueous ZIB[25]
VO2@PPy NW Arrays400088.9%Supercapacitor (FASC)[26]
VO2(D)/PPy/g-C3N40.5 A/g200099.71%1 M H2SO4(3-electrode system)3-electrode system (CV only)[39]
MnO2/PPy0.1 A/g205.2 mAh/g100075%2 M ZnSO4 + 0.1 M MnSO4Aqueous ZIB[40]
PPy/VO20.1 A/g413 mAh/g120087.2%3 M Zn(CF3SO3)2Aqueous ZIBThis work
Disclaimer/Publisher’s Note: The statements, opinions and data contained in all publications are solely those of the individual author(s) and contributor(s) and not of MDPI and/or the editor(s). MDPI and/or the editor(s) disclaim responsibility for any injury to people or property resulting from any ideas, methods, instructions or products referred to in the content.

