Abstract
The luminescent properties of cerium-doped barium aluminate (BaAl2O4) samples with varying Ce concentrations (0–1.1 mol%) prepared either in an air or nitrogen-reduced atmosphere are presented. This work provides the first detailed comparison of the material’s structural, luminescent, and chromatic properties at different doping levels and thermal treatments. X-ray diffraction analysis confirmed the hexagonal crystal structure of barium aluminate. Samples treated in an air atmosphere exhibited crystallite sizes of 58.5 nm for undoped samples and 45.7 nm for doped samples. In contrast, those treated under nitrogen showed smaller crystallite sizes, i.e., 39.8 nm for undoped and 42.3 nm for doped samples, respectively. XPS analysis indicated that the nitrogen-reduced atmosphere minimized Ce oxidation, favoring the presence of Ce3+. The bandgap values of the material were 4.0 eV and 5.6 eV for the air and for the nitrogen atmosphere, respectively. Photoluminescence spectra showed maxima at 357 nm (air) and 386 nm (nitrogen), attributed to 4f-5d transitions of Ce. The samples under air atmosphere showed longer lifetimes values (0.94 ns) compared to those in a nitrogen atmosphere (0.40 ns). These results suggest that thermal treatment in an air atmosphere promoted better structural order and higher photoluminescence efficiency, while treatment in a nitrogen-reduced atmosphere increased defect formation, shortening the lifetime. Chromaticity coordinate analysis showed that the cerium ion dopant influenced the blueish emission color in both samples.
1. Introduction
Barium aluminate (BaAl2O4) is an important class of phosphorescent inorganic material because of its high melting point, high thermal and chemical stability, low density, catalytic activity, radiation resistance, and long-afterglow phosphorescence [1,2,3]. The electronic structure of these materials can be modified by introducing dopants during manufacturing and by varying the synthesis method [4]. Dopants intentionally added within a matrix influence the electronic properties of the material by altering the density of charge carriers within the bandgap and the energy levels of the electronic states as well as the carrier mobility. The synthesis methods affect the electronic material structure, chemical composition, and defect distribution. Research shows that the physicochemical properties of the materials, as well as their persistent emission, are associated with their synthesis route and the concentration of the dopant [5,6]. Phosphorescent materials find applications in emergency signals, radiation detection, X-ray imaging, LEDs, etc. [3,7,8].
It is well known that barium aluminate phosphors doped with various rare earth elements, such as Eu2+, Tb3+, Ce3+, Eu3+, Er3+, Dy3+, Tm3+, Tb3+, and Pr3+, exhibit enhanced luminescence [1,7,9,10,11,12]. The long-afterglow phosphorescence of BaAl2O4 was analyzed [13], which exhibited a duration longer than 10 h at 402 and 450 nm [13]. The spectrum showed a broad emission band over 300–650 nm, peaking at 405 nm. This band was attributed to defect state transitions in the BaAl2O4 matrix. Gedekar et al. [8] observed PL emissions of ultraviolet light from cerium-doped barium aluminate at 386 nm, attributed to electronic transitions of Ce3+. These emissions depended on the host matrix and varied from the UV region to the visible region. Strongly blue-emitting Ce3+-activated BaAl2O4 nanophosphors with an emission peak at 422 nm were observed [7]. In 2024, Hema et al. [13] documented yellow photoluminescent emissions at 589 nm from BaAl2O4: Ce3+.
Investigations of thermal treatment at high temperatures and of environmental atmospheres have shown they affect the internal structure of the material [14]. Trivalent cerium (Ce3+) presents poor thermal stability and fast oxidation during heat treatment above 300 °C. It exhibits redox properties and oxygen storage capacity due to its reversible transformation between the Ce4+ and Ce3+ states [15,16,17]. It is important to determine whether cerium is in its trivalent or tetravalent state when incorporated into a host matrix, as the atmosphere used during the material synthesis process can significantly influence the state of cerium oxidation. The use of an atmosphere over another can promote the appearance of either Ce3+ or Ce4+, thus altering the material properties. Understanding how these variables affect the material behavior is crucial to optimize its luminescent properties.
In this article, the influence of the heat treatment preparation and atmosphere conditions under which BaAl2O4: Ce samples were synthesized was assessed through the study of their crystalline structure, composition, and optical properties. Although the material is well known, this work presents the first detailed experimental comparison of its structural, luminescent, and chromatic properties at various doping concentrations, depending on the thermal treatment in air or nitrogen.
2. Experimental Section
2.1. Preparation of BaAl2O4: Ce Samples
The precursors and reagents used for the synthesis of each sample were aluminum isopropoxide (C9H21AlO3; Sigma-Aldrich, Saint Louis, MO, USA), barium nitrate (Ba(NO3)2; E. Merck AG, Darmstadt, Alemania), cerium III nitrate (Sigma-Aldrich), ethyl alcohol (C2H5OH; J.T. Baker, Phillipsburg, NJ, USA), acetic acid (C2H4O2; J. T. Baker), and distilled water. Aluminum isopropoxide and barium nitrate were mixed using an agate mortar, then dissolved in ethanol. The solution was then placed on a magnetic stirrer for 90 min at 500 rpm to obtain a homogeneous solution. Acetic acid and cerium dissolved in distilled water were then added to the first solution and stirred until the solution turned into a gel. To remove the remaining solvent, the gel was dried in a muffle furnace (KSL-1100X, Xian Yima Optoelec Co., Ltd., Shaanxi, China) at 120 °C for 120 min. A course powder was obtained and ground using an agate mortar until a finer powder was obtained and then treated with heat at 900 °C for 4 h. Finally, the obtained powder was further ground to achieve nanometric grain sizes for characterization.
Two series of BaAl2O4 samples doped with 0, 0.3, 0.5, 0.7, 0.9, and 1.1 mol% Ce were prepared. The first series, labeled Air Atm, was heat-treated at 900 °C for 4 h in air, whereas the second series, labeled N2 Atm, underwent the same heat treatment in a reduced atmosphere, with nitrogen used as the reducing agent.
2.2. Characterization of BaAl2O4: Ce Samples
The crystalline phase of the BaAl2O4 samples was identified by X-ray diffraction (XRD) using BRUKER diffraction equipment and a Cu Kα radiation source (λ = 1.5460 Å), operated at 40 kV and 40 mA for 2θ values in a range from 5° to 90° with increments of 0.04°. The chemical state of the elements was analyzed by X-ray photoelectron spectroscopy (XPS). These data were obtained using an XR50 M monochromatic Al Kα (hν = 1486.7 eV) X-ray source and a Phoibos 150 spectrometer with the one-dimensional detector 1D-DLD provided by SPECS (Berlin, Germany). Samples were mounted on a steel sample holder using double-sided copper tape. The peak-fitting analysis was performed by employing the AAnalyzer software, version 1.5. The bandgap of the material was determined using diffuse reflectance patterns obtained with a Varian Cary 5000 UV-Vis-NIR spectrophotometer equipped with an integrating sphere, covering a spectral range of 200–800 nm. The PL properties were analyzed by PL spectroscopy using the Horiba Jobin Yvon spectrofluorometer model NanoLog equipped with a 450 W Xenon lamp. Emission spectra were taken in the 350–600 nm range with an excitation wavelength of 300 nm. Fluorescence lifetime measurements were carried out using the same system.
3. Results and Discussion
Figure 1 shows the XRD patterns for undoped and Ce-doped BaAl2O4 samples heat-treated in an oxidizing atmosphere (Air Atm), while Figure 2 displays the same results for the samples obtained in a reduced atmosphere (N2 Atm). In Figure 1c, the crystal structure of BaAl2O4 is presented, corresponding to the space group P6322, which exhibits a hexagonal crystal structure. The lattice parameters for each sample are listed in Table 1. A peak around 24° was observed in all XRD spectra, indicating the presence of a secondary phase identified as barium carbonate (BaCO3). This impurity was likely due to the reaction between Ba2+ and CO2 during the synthesis process, especially under the influence of residual moisture, and is not attributed to the addition of cerium. The formation of BaCO3 in barium-based aluminates has been reported in previous works [3,18].
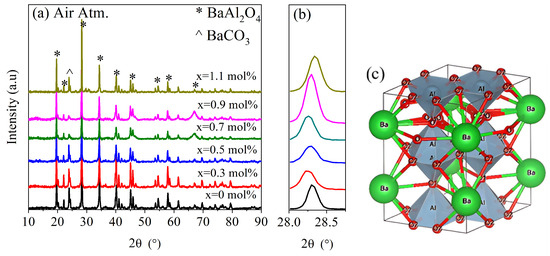
Figure 1.
X-ray diffraction study for samples produced in air atmosphere. (a) Spectra of BaAl2O4: Ce samples, (b) magnification of (202) plane, and (c) hexagonal crystal structure of samples, where ions are indicated.
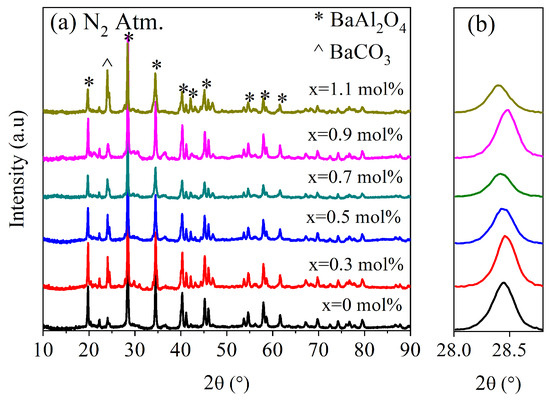
Figure 2.
X-ray diffraction study for samples produced in N2 atmosphere. (a) Spectra of BaAl2O4: Ce samples. (b) Magnification of (202) plane, indicating variation in 2θ values with respect to Figure 1b.

Table 1.
Crystal structure parameters of BaAl2O4: Ce samples in an oxidizing atmosphere (Air Atm) and in a reducing atmosphere (N2 Atm).
Both groups of samples showed diffraction patterns closely matching the standard JCPDS card No. 00-017-0306 (Figure 1a and Figure 2a). Hema et al. [18] reported on Ce-doped BaAl2O4 samples which were prepared with the solid-state reaction method, with results similar to the ones presented here, after their samples were calcined twice: first at 1200 °C in an air atmosphere and then at 1100 °C with a surrounding reducing agent. In that work, BaCO3 was also observed as a secondary phase, suggesting that its presence was more related to synthesis conditions rather than cerium doping. The average crystallite size was calculated using the Scherrer equation [19], , where D is the crystallite size, is a constant, is the full width at half maximum (FWHM) of the main peak in radians, and θ is the Bragg angle. This calculation was carried out using the peak of highest intensity, found around 28.4° for each sample. A magnified view of this maximum is shown in Figure 1b and Figure 2b.
For Air Atm samples, the average crystallite size was 58.5 nm for undoped samples and ranged between 44 and 46.9 nm for doped samples. In contrast, N2 Atm samples exhibited sizes of 39.8 nm for undoped samples and 41.2–44.7 nm for doped ones. These results suggest that the oxidizing atmosphere promoted greater crystallinity. The decrease in crystallite size with Ce addition in Air Atm samples may be attributed to dopant-induced lattice strain that inhibited grain growth [20]. Conversely, under reducing conditions, doping slightly increased crystallite size, possibly due to differences in defect structures or interactions with oxygen vacancies.
Figure 3a,b show the XPS spectra of BaAl2O4: Ce samples with a 0.5 mol% Ce concentration calcined in air or a nitrogen-reduced atmosphere. The peaks corresponding to Al 2p, C 1s, O 1s, Ba 3d, and Ce 3d can be observed in both spectra. In both cases, the peak corresponding to the Ce 3d3/2 component overlap the Auger peak of Ba MNN [21], which could affect the interpretation of the Ce 3d peak.
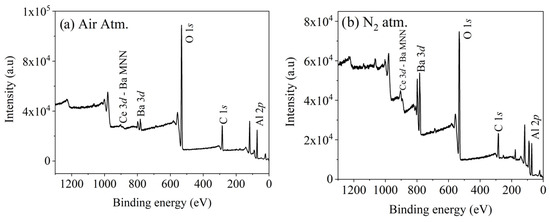
Figure 3.
XPS spectra of BaAl2O4: Ce samples with 0.5 mol% Ce. (a) In air atmosphere. (b) In nitrogen-reduced atmosphere.
For the same samples (0.5 mol% Ce), a deconvolution of the obtained curve attributed to Ce 3d was performed; Figure 4a shows the curve for the air atmosphere. The peak corresponding to p0 is thought to be a component of Ba 3d, specifically the Auger component MNN. Peak p1 is attributed to the Ce4+ oxidation state, and peak p2 is attributed to Ce3+, as has been reported previously [22]. Similarly, Figure 4b shows the deconvolution for the N2 Atm sample, performed using the same fitting parameters. In this spectrum, it can be observed that the preserved oxide corresponds to the Ce3+ oxidation state, while the p1 peak corresponding to Ce4+ is almost absent.
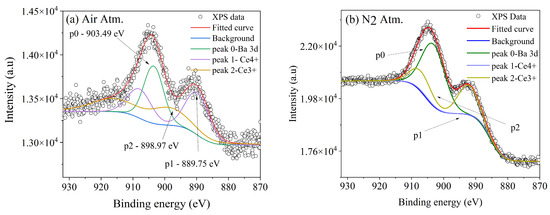
Figure 4.
The deconvolution of the curve attributed to Ce 3d for the BaAl2O4 samples with 0.5 mol% Ce (a) in an air atmosphere and (b) in a nitrogen atmosphere.
The determination of the band gap energy Eg was carried out using diffuse reflectance data and applying the Kubelka–Munk function F(R):
where R∞ represents the measure of the diffuse reflectance. could be utilized to estimate the material’s band gap energy () through Tauc’s method, which involved plotting versus hv, where hv denotes the photon energy. By performing a linear fit to the slope of the curve and extrapolating this fit to its intersection with the horizontal axis, the band gap value was determined.
Figure 5a shows the Tauc plots for undoped and Ce-doped BaAl2O4 samples in an air atmosphere. These samples exhibited energy band gaps around 4 eV, consistent with values reported in the literature [23,24]. Figure 5b presents the Tauc plots for undoped and Ce-doped BaAl2O4 samples in a nitrogen atmosphere. In this case, two band gap values (4 eV, and 5 eV) were observed for the Ce-doped samples. However, undoped samples had a single energy value of 5.64 eV, in agreement with the findings of other authors [25]. The formation of multiple gaps of energy in the Ce-doped samples is attributed to the interaction between impurities and surface defects as suggested by Zhai et al. [26]. Thus, the air atmosphere favored a homogeneous structure, while the N2 atmosphere induced multiple energy states in the doped samples. The band gap values are in Table 2 for both sample groups.
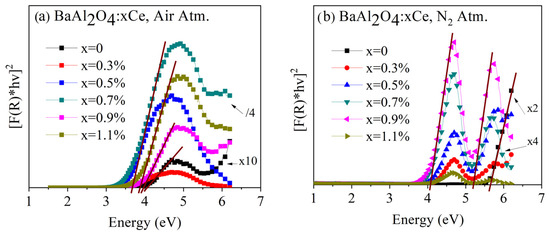
Figure 5.
Diffuse reflectance spectra of BaAl2O4: Ce samples (a) heat-treated in air and (b) heat-treated in reduced atmosphere.

Table 2.
Band gap values of BaAl2O4 and BaAl2O4: Ce samples prepared under different atmospheres.
The PL emissions for both series of samples, with an excitation wavelength of 300 nm, are presented in Figure 6. For the samples thermally treated in an oxidizing atmosphere, a broad emission band between 330 and 550 nm, centered around 357 nm, was observed for the doped samples, while the undoped sample exhibited a broad peak with a maximum at 391 nm. Pandey et al. [27] documented PL emission from undoped BaAl2O4 thermally treated in an oxidizing atmosphere, showing a broad emission band between 300 and 650 nm, with a maximum at 405 nm. Shivaramu et al. [25] presented the PL emission spectrum of undoped BaAl2O4 thermally treated in air, observing a narrow green emission peak at 542 nm and a broad emission band between 350 and 600 nm. Zhai et al. [28] reported the emission of undoped BaAl2O4 thermally treated in air, displaying a broad emission band from 350 to 550 nm with a maximum around 400 nm, which is consistent with the results presented here. Maphiri et al. [29] analyzed the PL emission of BaAl2O4 thermally treated in an oxidizing atmosphere, with two broad emission bands: the first between 400 and 650 nm and the second from 650 to 800 nm. Through deconvolution, maxima were identified around 420, 435, 457, 521, 612, and 722 nm. These emissions may have been due to defects in the crystalline structure, such as oxygen or barium vacancies. Additionally, Gedekar et al. [8] characterized the PL emissions of BaAl2O4: Ce3+ thermally treated in air, showing a broad band between 360 and 550 nm centered at 386 nm. These emissions may have been due to oxygen vacancies generated in the matrix by Ce4+ formation, some residual transitions from 4f1 to the 4f05d1 state of Ce3+, and intrinsic structural defects in the matrix related to the material synthesis process. The results from this study are consistent with some of the findings reported in the literature, particularly regarding the broad emission bands observed. However, they differ from other reports. These differences may be attributed to variations in the synthesis conditions.
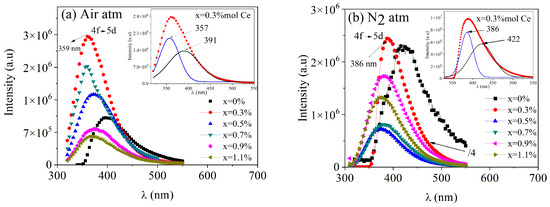
Figure 6.
PL emission spectra of BaAl2O4: xCe samples (a) prepared in air and (b) in a nitrogen reduced atmosphere. Both samples were excited at a λext = 300 nm wavelength.
For the nitrogen-reducing case (Figure 6b), peaks centered around 386 nm were observed in the doped samples, with a broad peak centered at 422 nm in the undoped sample. Mao et al. [30] reported the PL emissions of undoped BaAl2O4 thermally treated in a reducing atmosphere (with carbon), observing a broad emission centered at 495 nm. Kumar et al. [3] investigated the PL emission of BaAl2O4 thermally treated in a reducing atmosphere and also with carbon, describing a broad band between 450 and 700 nm with a maximum centered at 589 nm. Chatterjee et al. [7] analyzed the PL emission of BaAl2O4 samples thermally treated in a reducing atmosphere with N2 and H2, showing a broad band between 370 and 515 nm with a maximum at 422 nm. These emissions were associated with intrinsic lattice defects and the 5d to 2F5/2 transitions of Ce3+. Our results are consistent with these latter findings. The differences in the PL emission maxima may be attributed to the distinct characteristics of the synthesis processes.
Figure 7 presents the integrated PL response as a function of Ce doping concentration for both sample series. In both cases, it was observed that the sample with 0.3% mol Ce exhibited the highest PL response. For the case of samples under an air atmosphere, the sample with 0.3 mol% Ce increased the PL response by 133% compared to the undoped sample, while for samples under a nitrogen atmosphere, the sample with 0.3 mol% Ce increased the PL response by 190% compared to the undoped sample. The use of a reduced atmosphere promoted higher emissions for this Ce concentration.
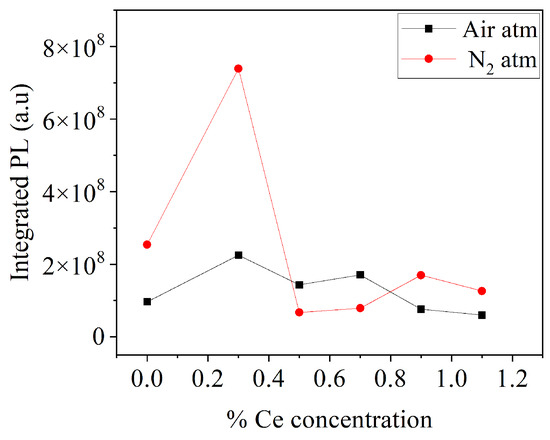
Figure 7.
Integrated PL response of BaAl2O4 as function of Ce doping concentration.
The chromaticity coordinates according to the International Commission on Illumination (CIE) for both prepared series were calculated and are shown in Figure 8. The (x, y) values were calculated using CIE chromaticity coordinate software, OriginPro version 2019b (OriginLab Corporation, Northampton, MA, USA) [31] and are presented in the tables included in the chromaticity graphs. The results indicate that the use of dopant influenced the blueish emission color in both sample series. The color purity can be described by the following equation [32]:
where are the chromaticity coordinates of the sample, correspond to the white point (0.3101, 0.3162), and are the coordinates of the dominant wavelength, in this case (0.1741, 0.005). Table 3 summarizes the calculated purities for BaAl2O4: x%Ce samples treated under air and nitrogen atmospheres.
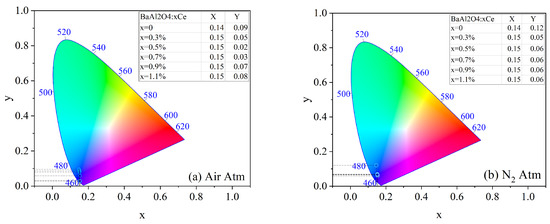
Figure 8.
CIE coordinates of BaAl2O4: Ce samples with thermal treatment in (a) air atmosphere and (b) in reduced atmosphere.

Table 3.
Chromaticity coordinates and color purity of Ce3+-doped BaAl2O4 under air and nitrogen atmospheres.
These results indicate that the introduction of Ce significantly enhanced the color purity in both atmospheres, with the highest value (99.14%) observed at 0.5 mol% Ce in air. In this atmosphere, color purity increased with Ce concentration up to 0.5 mol%, after which it declined, likely due to concentration quenching, where non-radiative energy transfer between neighboring Ce ions became predominant.
In contrast, the samples treated in a nitrogen atmosphere exhibited more stable color purity values, ranging around 88.95% from 0.5 to 1.1 mol% Ce3+. This suggests that nitrogen may contribute to stabilizing the Ce3+ oxidation state and minimizing non-radiative losses, thus supporting more consistent emission properties.
The undoped samples displayed the lowest color purity values in both conditions, reinforcing the role of Ce3+ as an effective activator for enhancing luminescent performance. The differences between both atmospheres further suggest that the thermal treatment environment influenced defect formation and the stabilization of the Ce oxidation state.
Figure 9 presents the lifetime decay spectra for both series of samples under an excitation wavelength of 450 nm. These spectra were fitted using a biexponential function, as given by
where and were the weighting parameters and and were the components of the lifetime decay [3,32]. Using these parameters, the average lifetime decay could be calculated using the following equation:
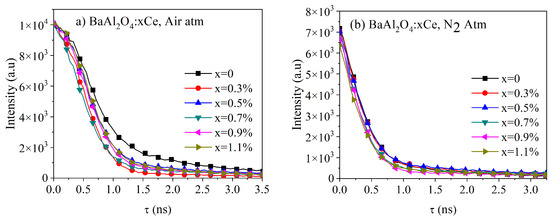
Figure 9.
Luminescence decay spectra of BaAl2O4: Ce sample thermally treated in (a) air atmosphere and (b) N2 atmosphere. Both were excited at wavelength λext = 450nm.
Table 4 and Table 5 list the parameters for each sample series, along with the calculated τavg values. The results showed that the thermal treatment in air and a N2 atmosphere impacted the average lifetime of the samples. The samples treated in air exhibited longer τavg values (0.94 ns for undoped BaAl2O4), which slightly decreased with increasing Ce concentrations (down to 0.79 ns for 1.1% Ce), suggesting that air treatment promoted radiative recombination. In contrast, the samples treated in a reduced atmosphere showed much shorter lifetimes (0.40 ns for undoped BaAl2O4 and around 0.34 ns for doped samples), indicating that oxygen reduction and the formation of structural defects, such as oxygen vacancies, accelerated non-radiative decay. This analysis suggests that the thermal treatment atmosphere played a crucial role in optimizing the luminescent properties of the material.

Table 4.
Fit parameters (A1, A2) for average lifetime (τav) calculation for BaAl2O4: Ce samples thermally treated in Air Atm.

Table 5.
Fit parameters (A1, A2) for average lifetime (τav) calculation for BaAl2O4: Ce samples thermally treated in N2 Atm.
Kumar et al. [3] documented lifetimes for BaAl2O4: 0.1%Ce3+ with an approximate value of 3.42 ns. Hema et al. [18] measured a lifetime of 4 ns for BaAl2O4: 0.5%Ce3+. Maphiri et al. [29] identified a lifetime of BaAl2O4 with an approximate value of 503 ms. Chatterjee et al. [7] presented an average lifetime of BaAl2O4: 1%Ce3+ with a value of 8.3 µs. The latter lifetimes [7,29] were significantly longer than those obtained in this and other works [3,29]. This difference could be attributed to variations in synthesis methods, the specific Ce3+ concentration used, or thermal treatment conditions.
The observed decrease in lifetime values can be attributed to variations in experimental conditions that influence the photoluminescent properties of the materials. Structural defects, such as oxygen vacancies, may act as non-radiative recombination centers, while concentration quenching at higher Ce levels could promote non-radiative energy transfer processes. Additionally, the thermal treatment atmosphere affects both the oxidation state of cerium and the defect density, which in turn modifies relaxation mechanisms. These combined factors could explain the significant differences compared to other reported studies.
4. Conclusions
Two series of BaAl2O4 samples were prepared, with the cerium concentration varied from 0 to 1.1 mol%. The first series underwent heat treatment in an air atmosphere (Air Atm), while the second was treated in a nitrogen-reduced atmosphere (N2 Atm). XRD analysis confirmed the hexagonal crystal structure of BaAl2O4, and the bandgap values were calculated as 4 eV for air-treated samples and 5.6 eV for those treated in a nitrogen-reduced atmosphere. Broad PL emission bands were observed at approximately 357 nm and 386 nm for BaAl2O4: Ce samples treated in air and N2 atmospheres, respectively, with these emissions attributed to the dopant. XPS analysis confirmed that using a N2 atmosphere minimized cerium oxidation, thereby favoring the presence of trivalent Ce. Samples treated in air exhibited higher crystallinity, with larger crystallite sizes of 58.5 nm for undoped samples and 45.7 nm for doped ones. This suggests that the oxygen present in the atmosphere promoted the formation of a more ordered structure. Conversely, samples treated in a N2 atmosphere displayed smaller crystallite sizes, 39.8 nm for undoped samples and 42.3 nm for doped ones, likely indicating that oxygen reduction led to the formation of structural defects, such as oxygen vacancies. These defects hindered crystallite growth and reduced PL efficiency due to non-radiative processes, resulting in shorter lifetimes compared to those of the air-treated samples. Overall, our results indicate that the choice of environmental atmosphere for the thermal treatment significantly influences the structural and luminescent properties of BaAl2O4: Ce samples, making it a critical factor for the optimization of the luminescent properties of this material.
Author Contributions
The contributions of the following authors were as follows: Conceptualization, M.R.P.M., B.d.C.A., J.E.E.R. and E.C.-Z.; methodology, M.N.C.O., M.R.P.M., J.E.E.R. and E.C.-Z.; software, M.N.C.O., M.R.P.M. and E.C.-Z.; validation, M.N.C.O., M.R.P.M., B.d.C.A., J.E.E.R. and E.C.-Z.; formal analysis, M.N.C.O. and M.R.P.M.; investigation, M.N.C.O., M.R.P.M., B.d.C.A., J.E.E.R. and E.C.-Z.; resources, M.R.P.M., B.d.C.A. and E.C.-Z.; data curation, M.N.C.O., M.R.P.M. and B.d.C.A.; writing—original draft preparation, M.N.C.O., M.R.P.M. and B.d.C.A.; writing—review and editing, M.N.C.O., M.R.P.M., B.d.C.A., J.E.E.R. and E.C.-Z.; visualization, M.N.C.O., M.R.P.M., B.d.C.A., J.E.E.R. and E.C.-Z.; supervision, M.R.P.M., B.d.C.A., J.E.E.R. and E.C.-Z.; project administration, M.R.P.M. and B.d.C.A.; funding acquisition, M.R.P.M. and B.d.C.A. All authors have read and agreed to the published version of the manuscript.
Funding
We thank the SECIHT Mexico for their support with a doctoral grant for the author M.N.C.O.
Data Availability Statement
Data are contained within the article; nevertheless, if more detailed information is required, the dataset will be available on request from the authors.
Acknowledgments
We would like to thank Giancarlo C. Righini for his help in the discussion of this manuscript.
Conflicts of Interest
The authors declare no conflicts of interest.
References
- Ziyauddin, M.; Brahme, N.; Shrivastava, A.K. Luminescence Properties of BaAl2O4: Eu2+ Phosphors. Int. Res. J. Eng. Technol. 2018, 5, 3656–3660. [Google Scholar]
- Wang, S.; Gao, H.; Fang, L.; Wei, Y.; Li, Y.; Lei, L. Synthesis and Characterization of BaAl2O4 Catalyst and its Photocatalytic Activity Towards Degradation of Methylene Blue Dye. Z. Phys. Chem. 2018, 233, 1161–1181. [Google Scholar] [CrossRef]
- Kumar, G.K.; Bhargav, B.P.; Aravinth, K.; Balaji, C. Enhanced photoluminescence properties of BaAl2O4: Ce3+/Li+ yellow phosphors. J. Mater. Sci. Mater. Electron. 2022, 33, 15323–15332. [Google Scholar] [CrossRef]
- Ren, J.; Lin, L.; Lieutenant, K.; Schulz, C.; Wong, D.; Gimm, T.; Bande, A.; Wang, X.; Petit, T. Role of Dopants on the Local Electronic Structure of Polymeric Carbon Nitride Photocatalysts. Small Methods 2021, 5, 2000707. [Google Scholar] [CrossRef] [PubMed]
- Melo, S.S.; Andrade, A.B.; Bispo, G.; Carvalho, J.; Macedo, Z.; Valerio, M.E. X-ray absorption spectroscopy and tunable color emission study of the Mnco-doped BaAl2O4:Ce phosphor under synchrotron radiation. Opt. Mater. 2019, 91, 401–407. [Google Scholar] [CrossRef]
- Khanin, V.; Venevtsev, I.; Chernenko, K.; Pankratov, V.; Klementiev, K.; van Swieten, T.; van Bunningen, A.J.; Vrubel, I.; Shendrik, R.; Ronda, C.; et al. Exciton interaction with Ce3+and Ce4+ ions in (LuGd)3(Ga,Al)5O12 ceramics. J. Lumin. 2021, 237, 118150. [Google Scholar] [CrossRef]
- Chatterjee, R.; Saha, S.; Panigrahi, K.; Ghorai, U.K.; Das, G.C.; Chattopadhyay, K.K. Blue Emitting BaAl2O4:Ce3+ Nanophosphors with High Color Purity and Brightness for White LEDs. Microsc. Microanal. 2019, 25, 1466–1470. [Google Scholar] [CrossRef]
- Gedekar, K.A.; Wankhede, S.P.; Moharil, S.V.; Belekar, R.M. d–f luminescence of Ce3+ and Eu2+ ions in BaAl2O4, SrAl2O4 and CaAl2O4 phosphors. J. Adv. Ceram. 2017, 6, 341–350. [Google Scholar] [CrossRef]
- Chatterjee, R.; Das, G.C.; Chattopadhyay, K.K. Synthesis and characterization of highly luminescent green emitting BaAl2O4: Tb3+ nanophosphors. Mater. Today Proc. 2017, 18, 1132–1137. [Google Scholar] [CrossRef]
- Rezende, M.; Andrade, A.; Paschoal, C. Co-doping effect of Ca2+ on luminescent properties of BaAl2O4:Eu3+. J. Electron Spectrosc. Relat. Phenom. 2018, 225, 62–65. [Google Scholar] [CrossRef]
- Wiglusz, R.; Grzyb, T. Sol–gel synthesis of micro and nanocrystalline BaAl2O4:Eu3+ powders and their luminescence properties. Opt. Mater. 2013, 36, 539–5455. [Google Scholar] [CrossRef]
- Rodrigues, L.C.; Hölsä, J.; Carvalho, J.M.; Pedroso, C.C.; Lastusaari, M.; Felinto, M.C.; Watanabe, S.; Brito, H.F. Co-Dopant Influence on the Persistent Luminescence of BaAl2O4:Eu2+, R3+. Phys. B 2014, 439, 67–71. [Google Scholar] [CrossRef]
- Jia, D.; Wang, X.-J.; Kolk, E.v.d.; Yen, W. Site dependent thermoluminescence of long persistent phosphorescence of BaAl2O4:Ce3+. Opt. Commun. 2002, 204, 247–251. [Google Scholar] [CrossRef]
- Catauro, M.; Tranquillo, E.; Poggetto, G.D.; Pasquali, M.; Dell’era, A.; Ciprioti, S.V. Influence of the Heat Treatment on the Particles Size and on the Crystalline Phase of TiO2 Synthesized by the Sol-Gel Method. Materials 2018, 11, 2364. [Google Scholar] [CrossRef] [PubMed]
- Younis, A.; Chu, D.; Li, S. Cerium Oxide Nanostructures and their Applications. Funct. Nanomater. 2016, 3, 53–68. [Google Scholar] [CrossRef]
- Hosseini, M.; Amjadi, I.; Mohajeri, M.; Mozafari, M. Sol–Gel Synthesis, Physico-Chemical and Biological Characterization of Cerium Oxide/Polyallylamine Nanoparticles. Polymers 2020, 12, 1444. [Google Scholar] [CrossRef]
- Martos, M.; López, B.; Folgado, J.V.; Cordoncillo, E.; Escribano, P. Sol-gel synthesis of tunable cerium titanate materials. Eur. J. Inorg. Chem. 2007, 2008, 3163–3171. [Google Scholar] [CrossRef]
- Hema, N.; Kumar, K.G.; Lakshmi, M.A.D.; Abbas, M.; Kuppusamy, M. Impact of Dy3+ and Ce3+ ion doping on the photoluminescence, thermoluminescence, and electrochemical properties of strontium aluminate (SrAl2O4) and barium aluminate (BaAl2O4) phosphors. J. Mater. Sci. Mater. Electron. 2024, 35, 923. [Google Scholar] [CrossRef]
- Will, G. Powder Diffraction: The Rietveld Method and the Two Stage Method to Determine and Refine Crystal Structures from Powder Diffraction Data; Springer: Berlin/Heidelberg, Germany, 2006. [Google Scholar]
- Vrankic, M.; Gržeta, B.; Lützenkirchen-Hecht, D.; Bosnar, S.; Šaric, A. Chromium Environment within Cr-Doped BaAl2O4: Correlation of X ray Diffraction and X ray Absorption Spectroscopy Investigations. Inorg. Chem. 2015, 54, 11127–11135. [Google Scholar] [CrossRef]
- Moulder, J.F.; Stickle, W.F.; Sobol, P.E.; Bomben, K.D. Handbook of X-Ray Photoelectron Spectroscopy: A Reference Book of Standard Spectra for Identification and Interpretacion of XPS Data; Division, P.E., Ed.; Perkin-Elmer Corporation: Waltham, MA, USA, 1992. [Google Scholar]
- Zhang, C.; Lin, J. Visible-light induced oxo-bridged ZrIV-O-CeIII redox centre in tetragonal ZrO2-CeO2 solid solution for degradation of organic pollutants. Phys. Chem. Chem. Phys. 2011, 13, 3896–3905. [Google Scholar] [CrossRef]
- Faisal, S.; Majid, S.S.; Ahad, A.; Sofi, F.A.; Mohanta, S.; Gupta, M.; Sahu, P.; Hsieh, W.-P.; Srivastava, H.; Ikram, M.; et al. Photocatalytic Activity of BaAl2O4 for Water Purification. Langmuir 2024, 40, 8418–8426. [Google Scholar] [CrossRef] [PubMed]
- Mahi, K.; Mosfeta, R. Characterization of Magnesium/Barium Aluminates Spinel Synthesized by Sol-Gel Auto-Combustion Method. J. Nano Electron. Phys. 2022, 1–5. [Google Scholar] [CrossRef] [PubMed]
- Shivaramu, N.J.; Coetsee, E.; Roos, W.D.; Nagabhushana, K.R.; Swart, H.C. Charge carrier trapping processes in un-doped and BaAl2O4:Eu3+ nanophosphor for thermoluminescent dosimeter applications. J. Phys. D Appl. Phys. 2020, 53, 475305. [Google Scholar] [CrossRef]
- Wang, S.; Wang, Y.; Gao, H.; Li, J.; Fang, L.; Yu, X.; Tang, S.; Zhao, X.; Sun, G. Synthesis and characterization of BaAl2O4:Ce and Mn-Ce-co-doped BaAl2O4 composite materials by a modified polyacrylamide gel method and prediction of photocatalytic activity using artificial neural network (ANN) algorithm. Opt.-Int. J. Light Electron Opt. 2020, 221, 165363. [Google Scholar] [CrossRef]
- Pandey, A.; Chithambo, M.L. Thermoluminescence of the persistent-luminescence phosphor, BaAl2O4; A stuffed tridymite. Radiat. Meas. 2018, 120, 73–77. [Google Scholar] [CrossRef]
- Zhai, B.-G.; Ma, Q.-L.; Xiong, R.; Li, X.; Huang, Y.M. Blue–green afterglow of BaAl2O4:Dy3+ phosphors. Mater. Res. Bull. 2016, 75, 1–6. [Google Scholar] [CrossRef]
- Maphiri, V.; Mhlongo, M.; Hlatshwayo, T.; Motaung, T.; Koao, L.; Motloung, S.V. Citrate sol-gel synthesis of BaAl2O4:x% Cu2+ (0 ≤ x ≤ 1) nano-phosphors. Opt. Mater. 2020, 109, 110244. [Google Scholar] [CrossRef]
- Mao, Q.; Ji, Z.; Yuan, Q.; Xi, J.; Kong, Z.; Zhang, J. Effects of boric acid on structural and luminescent properties of BaAl2O4:(Eu2+, Dy3+) phosphors. Res. Chem. Intermed. 2016, 42, 6557–6566. [Google Scholar] [CrossRef]
- Origin(Pro), version number 2019b; OriginLab Corporation: Northampton, MA, USA, 2019.
- Raja, A.; Annadurai, G.; Daniel, D.J.; Ramasamy, P. Synthesis, structural and optical properties of Eu3+ activated fluoroperovskite (RbMgF3) phosphors. J. Alloys Compd. 2017, 727, 215–223. [Google Scholar] [CrossRef]
Disclaimer/Publisher’s Note: The statements, opinions and data contained in all publications are solely those of the individual author(s) and contributor(s) and not of MDPI and/or the editor(s). MDPI and/or the editor(s) disclaim responsibility for any injury to people or property resulting from any ideas, methods, instructions or products referred to in the content. |
© 2025 by the authors. Licensee MDPI, Basel, Switzerland. This article is an open access article distributed under the terms and conditions of the Creative Commons Attribution (CC BY) license (https://creativecommons.org/licenses/by/4.0/).