Article

Optimization of Gas-Liquid Sulfonation in Cross-Shaped Microchannels for α-Olefin Sulfonate Synthesis

Shanxi Key Laboratory of Chemical Product Engineering, College of Chemistry and Chemical Engineering, Taiyuan University of Technology, Taiyuan 030024, China
*
Author to whom correspondence should be addressed.
Micromachines 2025, 16(6), 638; https://doi.org/10.3390/mi16060638
Submission received: 27 April 2025 / Revised: 25 May 2025 / Accepted: 26 May 2025 / Published: 28 May 2025
(This article belongs to the Section C:Chemistry)

Abstract

:
The gas-liquid sulfonation of α-olefin sulfonate (AOS) in falling film reactors faces significant limitations, primarily due to poor mass transfer efficiency and excessive byproduct formation. To overcome these challenges, a novel cross-shaped microchannel reactor was developed for the continuous gas-liquid sulfonation of α-olefin (AO) with gaseous sulfur trioxide (SO3). The influence of key process parameters, including gas-phase flow rate, reaction temperature, SO3/AO molar ratio, and SO3 volume fraction, on product characteristics and their interactions was systematically investigated using the single-factor experiment and response surface methodology (RSM). A high-precision empirical model (coefficient of determination, R2 = 0.9882) to predict product content was successfully constructed. To achieve multi-objective optimization considering product active substance content and energy efficiency, a strategy combining a two-population genetic algorithm with the entropy-weighted TOPSIS (Technique for Order of Preference by Similarity to Ideal Solution) method was implemented. Optimal conditions were determined as follows: gas-phase flow rate of 228 mL/min, reaction temperature of 52 °C, SO3/AO molar ratio of 1.27, and SO3 volume fraction of 4%. Compared to conditions optimized solely by RSM, this multi-objective approach achieved a significant 10% reduction in energy efficiency, with only a marginal 3.8% decrease in active substance content. This study demonstrates the feasibility and advantages of microreactors for the efficient and green synthesis of AOS.

Graphical Abstract

1. Introduction

α-Olefin sulfonates (AOS), a prominent class of anionic surfactants, have garnered significant attention for their widespread application in domestic detergents and diverse industrial processes [1,2]. This is attributed to their advantageous properties, including excellent hard water tolerance, ready biodegradability, effective wetting capabilities, and a mild, low-irritation profile to human skin [3,4,5]. Consequently, AOS has emerged as a promising alternative to conventional surfactants such as alkylbenzene sulfonates and fatty alcohol ether sulfates, potentially mitigating some of their associated environmental and health concerns [6,7].
Conventional reactor designs, such as kettle and falling-film reactors, employed in industrial sulfonation processes, have a specific surface area that is only 1/10–1/1000 that of a microreactor [8], and often encounter challenges associated with inefficient mixing and inadequate heat removal [9,10]. The rapid, highly exothermic nature of these reactions can lead to non-uniform temperature profiles, promoting undesirable side reactions that negatively impact product quality and diminish equipment lifespan [11,12]. Microchannel reactors, recognized as powerful process intensification tools, offer a compelling alternative for such strong exothermic reactions [13,14]. Their characteristic micro-scale dimensions facilitate dramatically enhanced heat and mass transfer rates compared to conventional reactors [15,16]. This not only accelerates reaction kinetics but also enables precise control over reaction conditions, effectively suppressing side reactions and improving product selectivity [17,18].
The potential of microchannel reactors for the synthesis of sulfonate anionic surfactants has been demonstrated in several recent studies [19,20,21,22]. Xu et al. [19] utilized a continuous stirred kettle microreactor for the synthesis of cetylbenzenesulfonic acid. Geng et al. [20] implemented a continuous flow sulfonation process in a microreactor to optimize the conventional sulfonation of dodecylbenzene with dilute SO3. Furthermore, Yuan et al. [21] successfully synthesized dodecylbenzenesulfonic acid using a helicoidal tube microreactor, while Xu et al. [22] employed a specific microstructured microchip for the efficient preparation of fatty acid methyl ester sulfonates. These studies highlight the versatility and efficacy of microreactor technology for sulfonation reactions.
While microchannel reactors have shown promise for AOS synthesis, previous studies, such as the work by Ma et al. [23] on the sulfonation of 1-tetradecene with liquid SO3 in a microchannel and the multistep cascade synthesis investigated by Xu et al. [24], have primarily focused on liquid-liquid homogeneous sulfonation systems. These systems necessitate dissolving SO3 in organic solvents like dichloroethane, introducing additional separation and purification costs, as well as posing environmental and health hazards [25,26]. These drawbacks are incongruous with the green chemistry principles driving modern chemical manufacturing. Utilizing gaseous SO3 as the sulfonating agent obviates the need for subsequent solvent separation; however, it introduces the complexity of managing gas-liquid two-phase flow within the microchannel, which significantly influences interfacial mass transfer efficiency [27,28]. Moreover, gas-liquid sulfonation reactions are inherently more vigorous than their liquid-liquid counterparts, posing a substantial challenge in effectively dissipating the large heat release and mitigating side reactions [21]. This efficient heat management is crucial for achieving process stability and control. To date, a systematic investigation of AOS synthesis via gas-liquid sulfonation remains unexplored.
Furthermore, while maximizing the active substance content is desirable, the associated energy costs must be carefully considered [29,30]. Therefore, global process optimization, balancing product quality with energy consumption, is essential for minimizing costs and maximizing overall efficiency [31]. Multi-objective optimization algorithms offer a powerful approach for navigating such complex design spaces [32,33]. For instance, Alexandrova et al. [34] successfully employed the NSGA-II algorithm to optimize polycyclic aromatic hydrocarbon hydrogenation temperatures, maximizing both cycloalkane yield and feedstock conversion. Similarly, Verhellen et al. [35] leveraged NSGA-II for efficient molecular design in small-molecule drug discovery, demonstrating its superiority over single-objective methods. Consequently, applying these advanced optimization strategies to simultaneously enhance product quality and minimize energy consumption is a critical aspect in developing a sustainable and economically viable continuous AOS synthesis process via gas-liquid microchannel sulfonation.
This study addresses the critical challenges associated with conventional AOS synthesis via SO3 gas-liquid sulfonation, particularly the difficulties in controlling the highly exothermic reaction and mitigating side reactions. We report, for the first time, the development and systematic optimization of a continuous-flow AOS synthesis process employing gas-liquid sulfonation within a cross-shaped microchannel reactor. The influence of key process parameters, including gas-phase flow rate, SO3 concentration, reactant molar ratio, reaction temperature, and residence time, on AOS yield and selectivity within the microchannel was investigated in detail. Furthermore, to achieve cost-effective production, an improved two-population genetic algorithm was implemented for multi-objective optimization, aiming to identify the optimal operating conditions that simultaneously maximize active substance content and minimize energy consumption. This study provides a theoretical foundation and technical framework for the continuous, efficient, safe, and sustainable production of AOS, paving the way for the green manufacturing of high-performance surfactants.

2. Materials and Methods

2.1. Chemicals

1-Dodecene (purity > 95.0 wt%) was purchased from Macklin Biochemical Co., Ltd., Shanghai, China. Sulfur dioxide (SO2, standard gas) was obtained from Anxuhongyun Science and Technology Development Co., Ltd., Taiyuan, China. Anhydrous ethanol (>99.7 wt%), isopropyl alcohol (>99.7 wt%), and petroleum ether (analytical grade) were supplied by Sinopharm Chemical Reagent Co., Ltd., Shanghai, China. Sodium hydroxide (>98.0 wt%) was purchased from the Kemiou Chemical Reagent Co., Ltd., Tianjin, China. Methanol (chromatographic grade, >99.9 wt%) was obtained from Aladdin Biochemical Technology Co., Ltd., Shanghai, China.

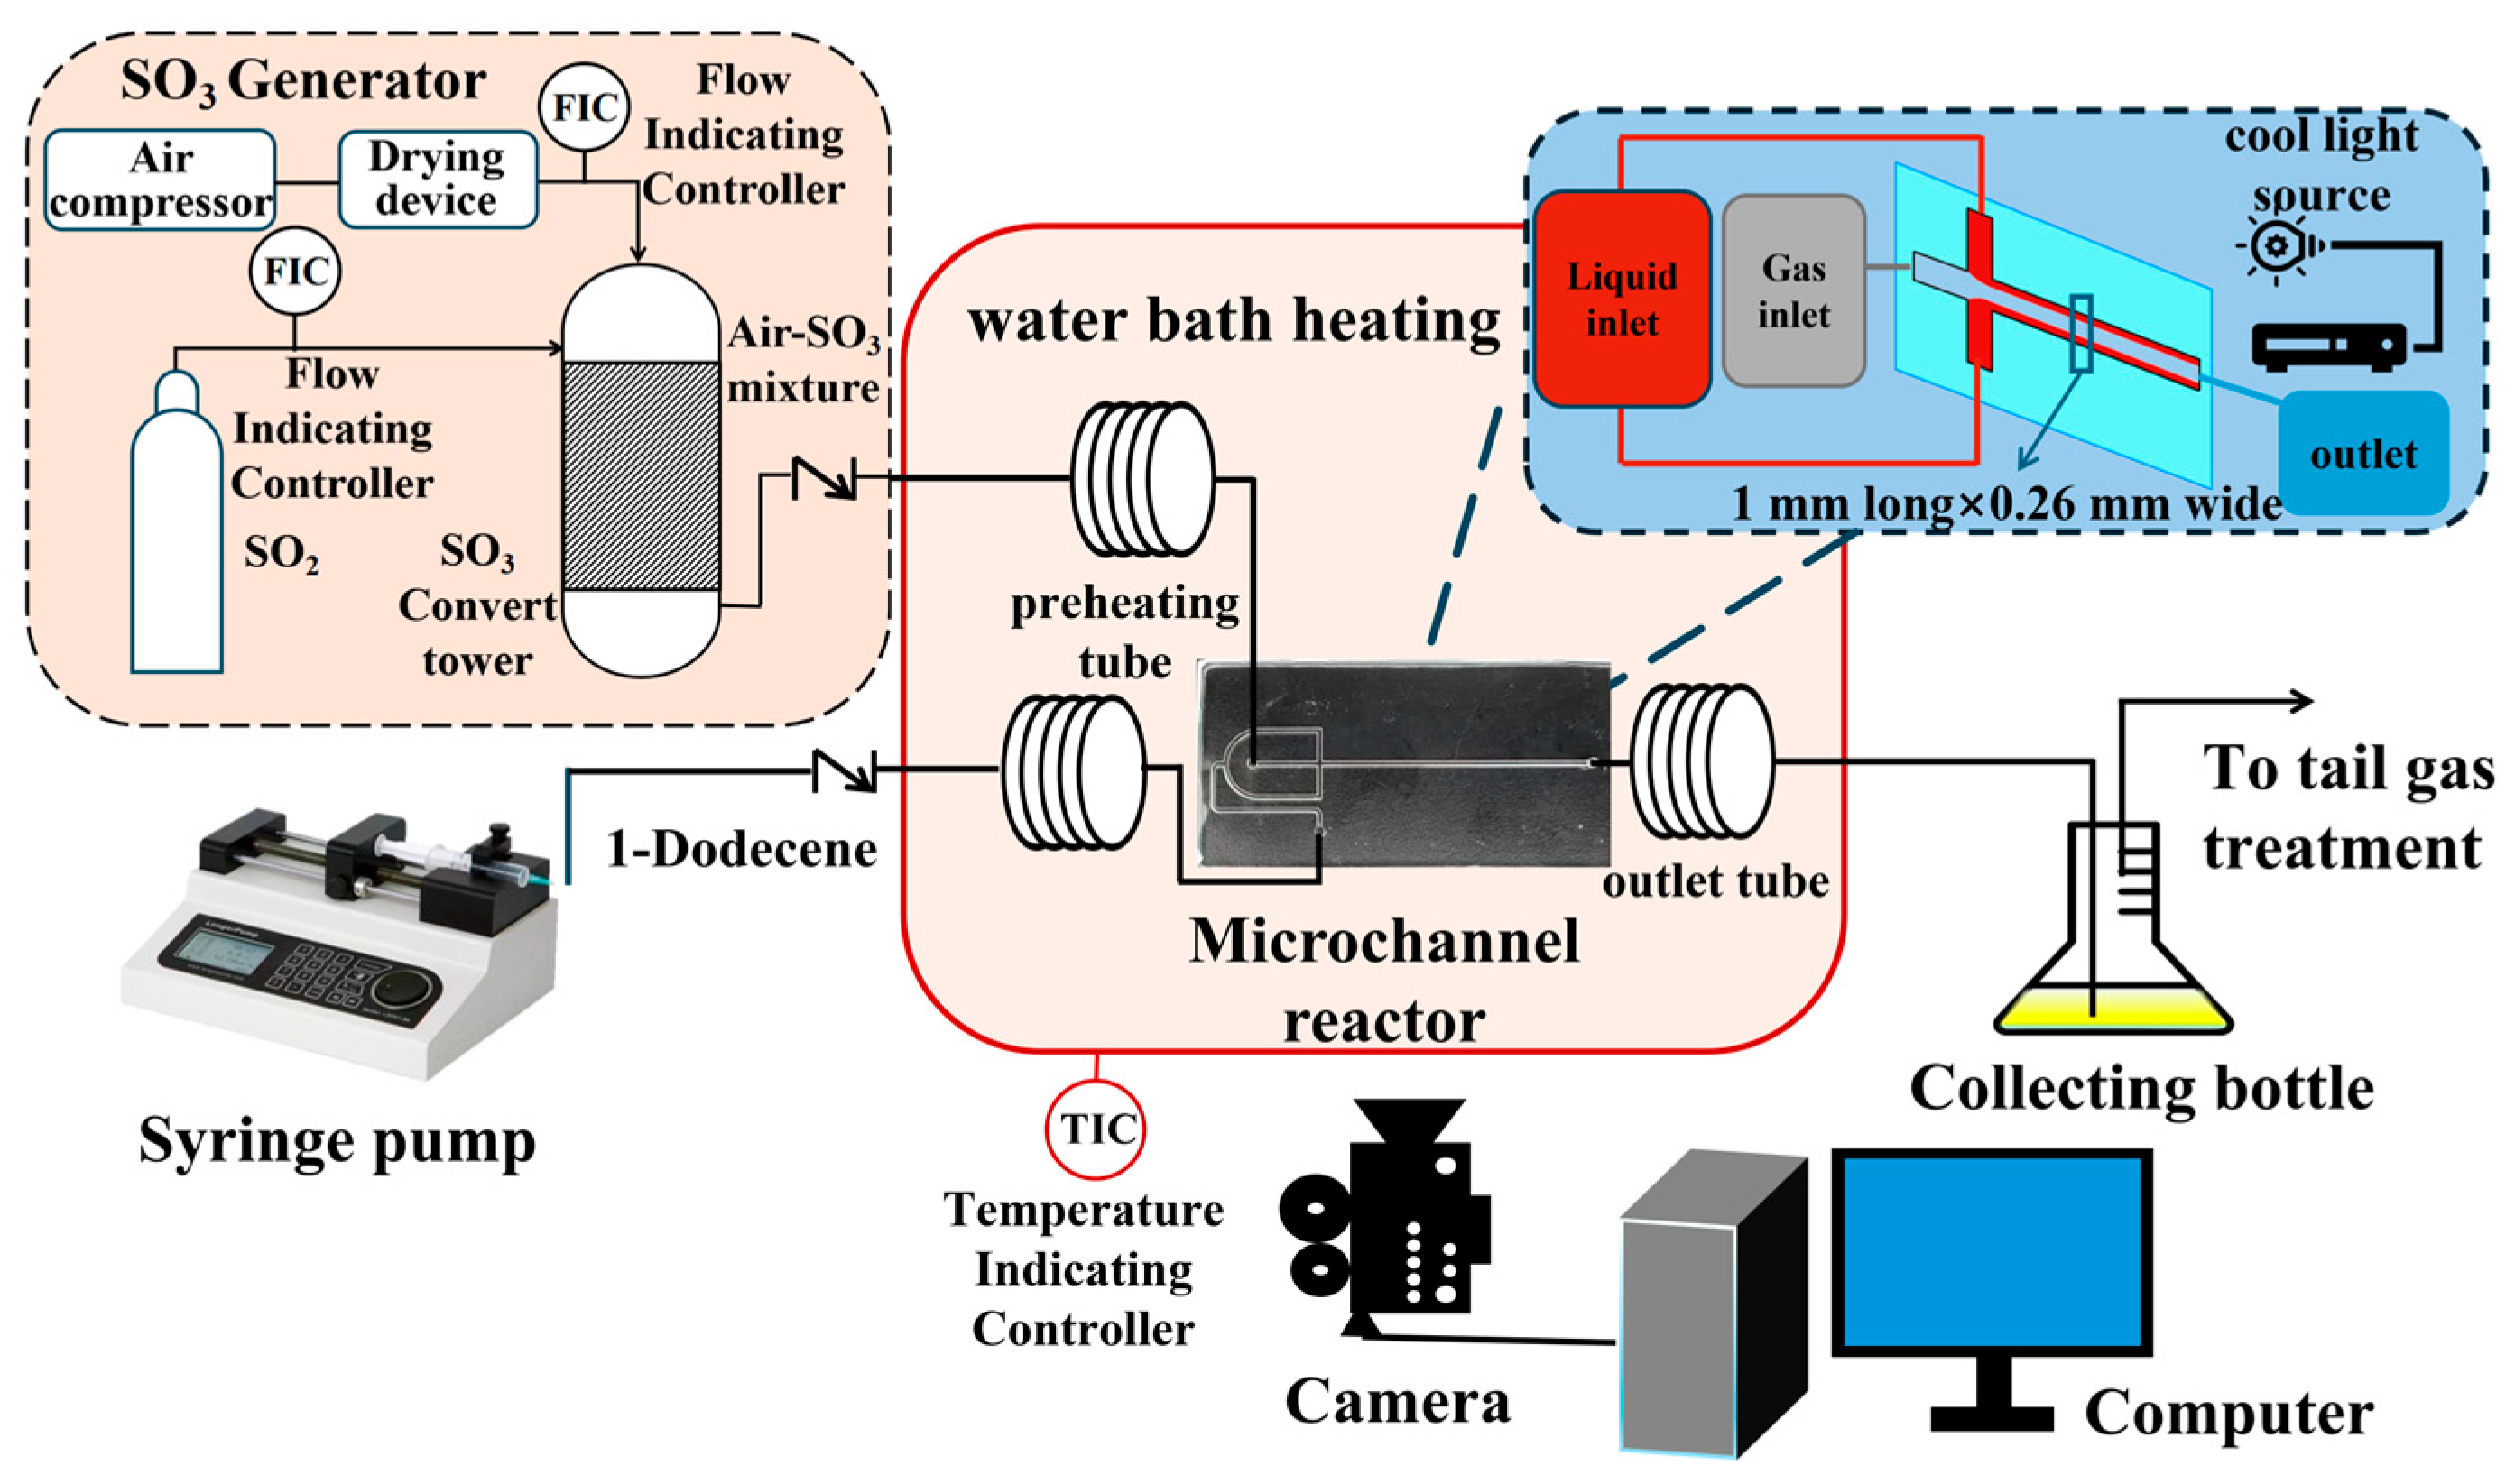
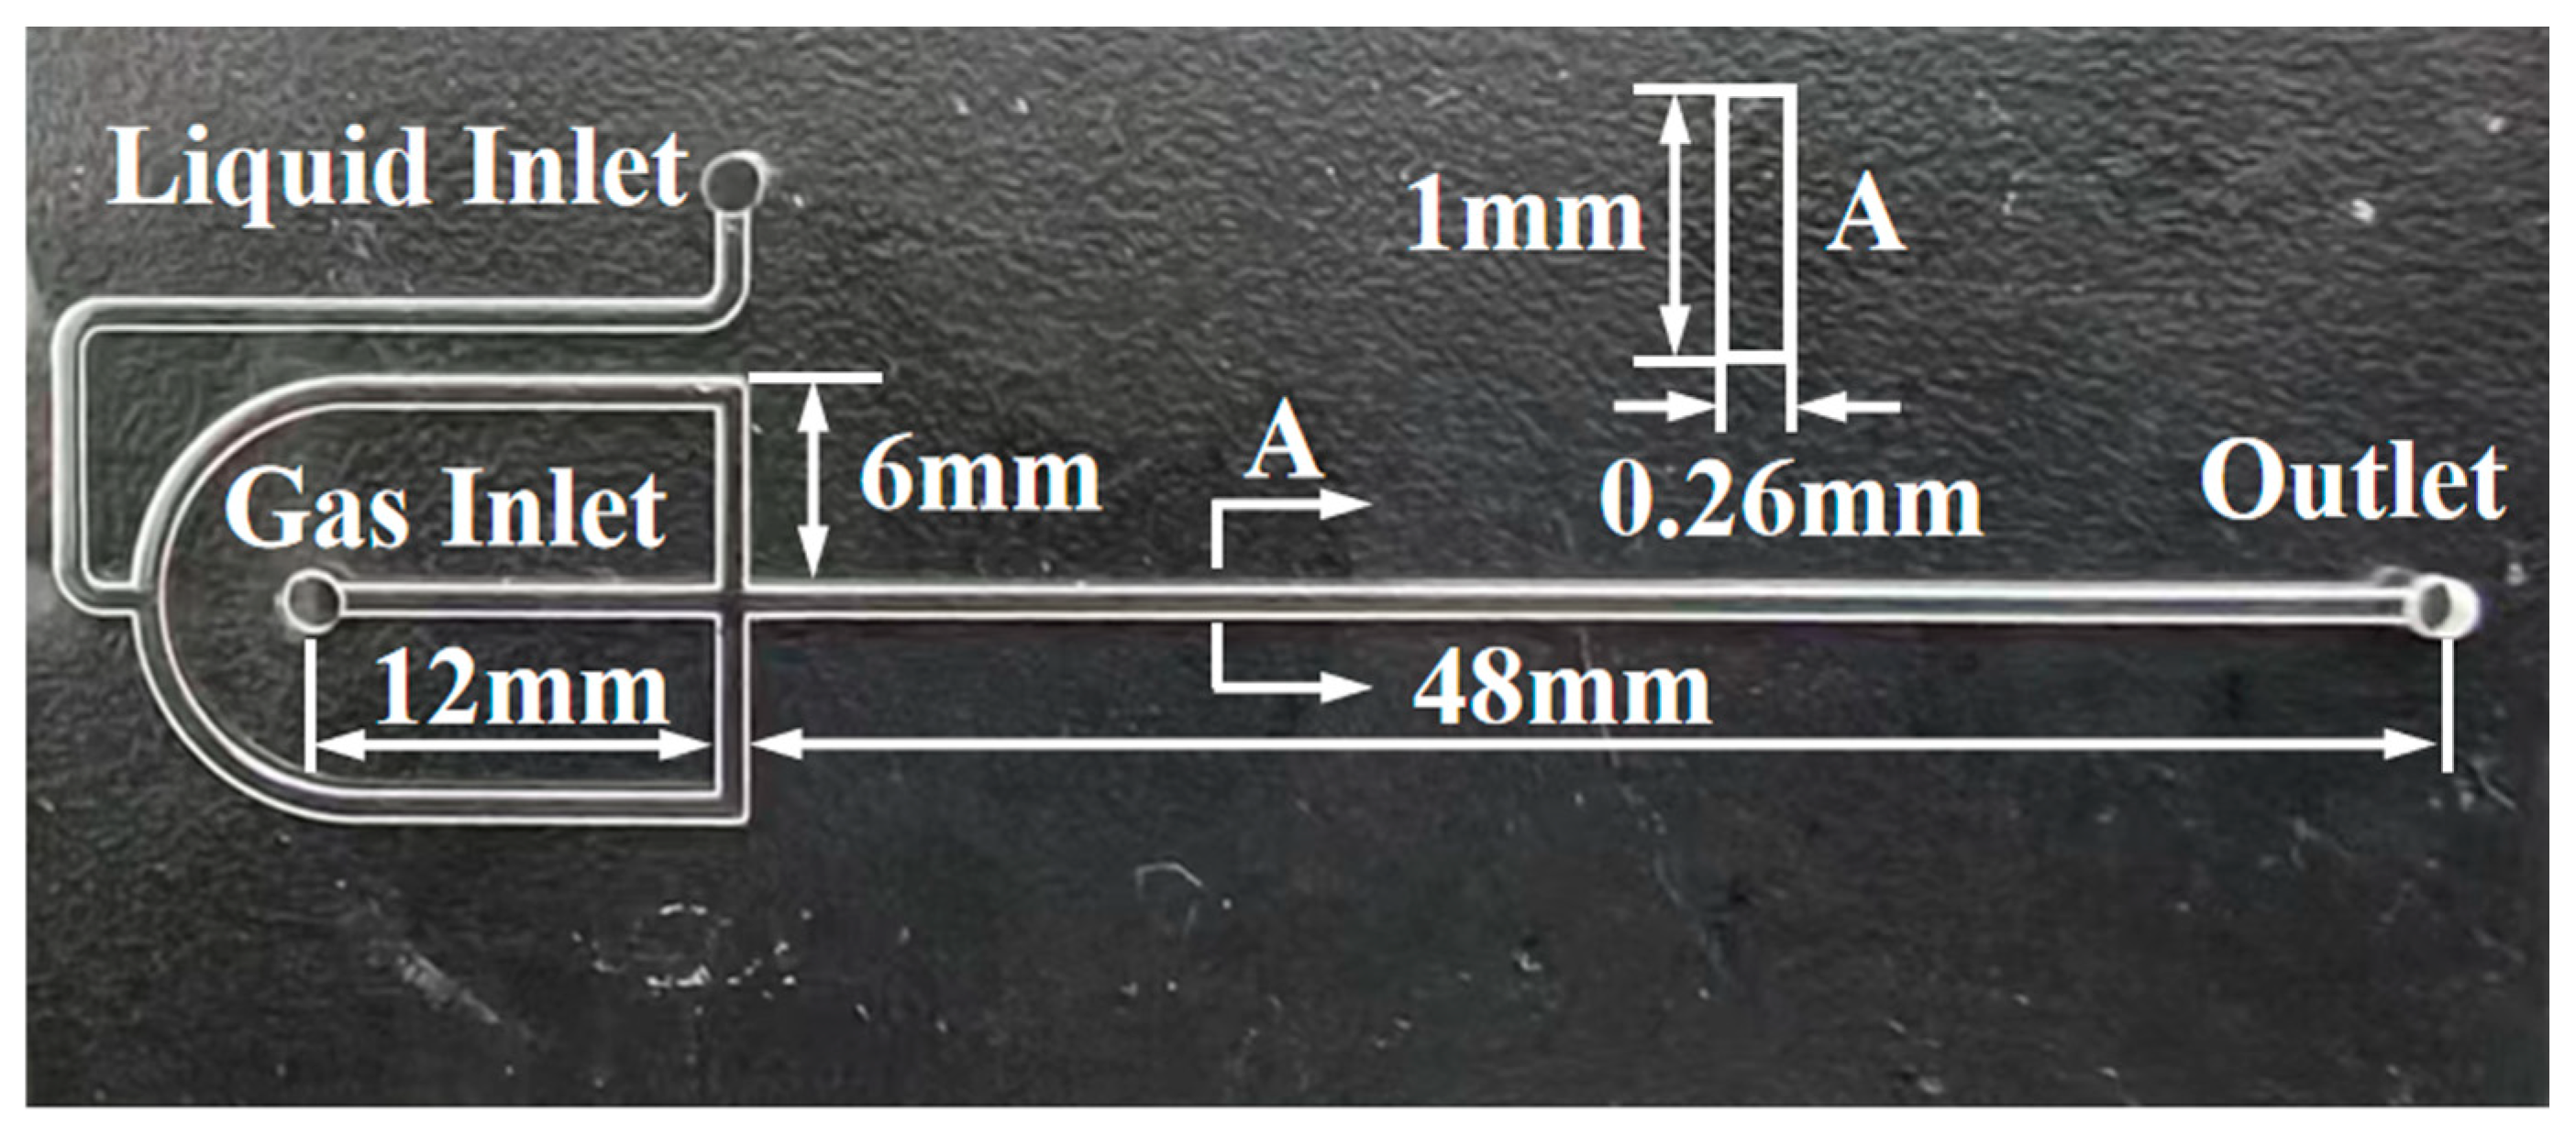
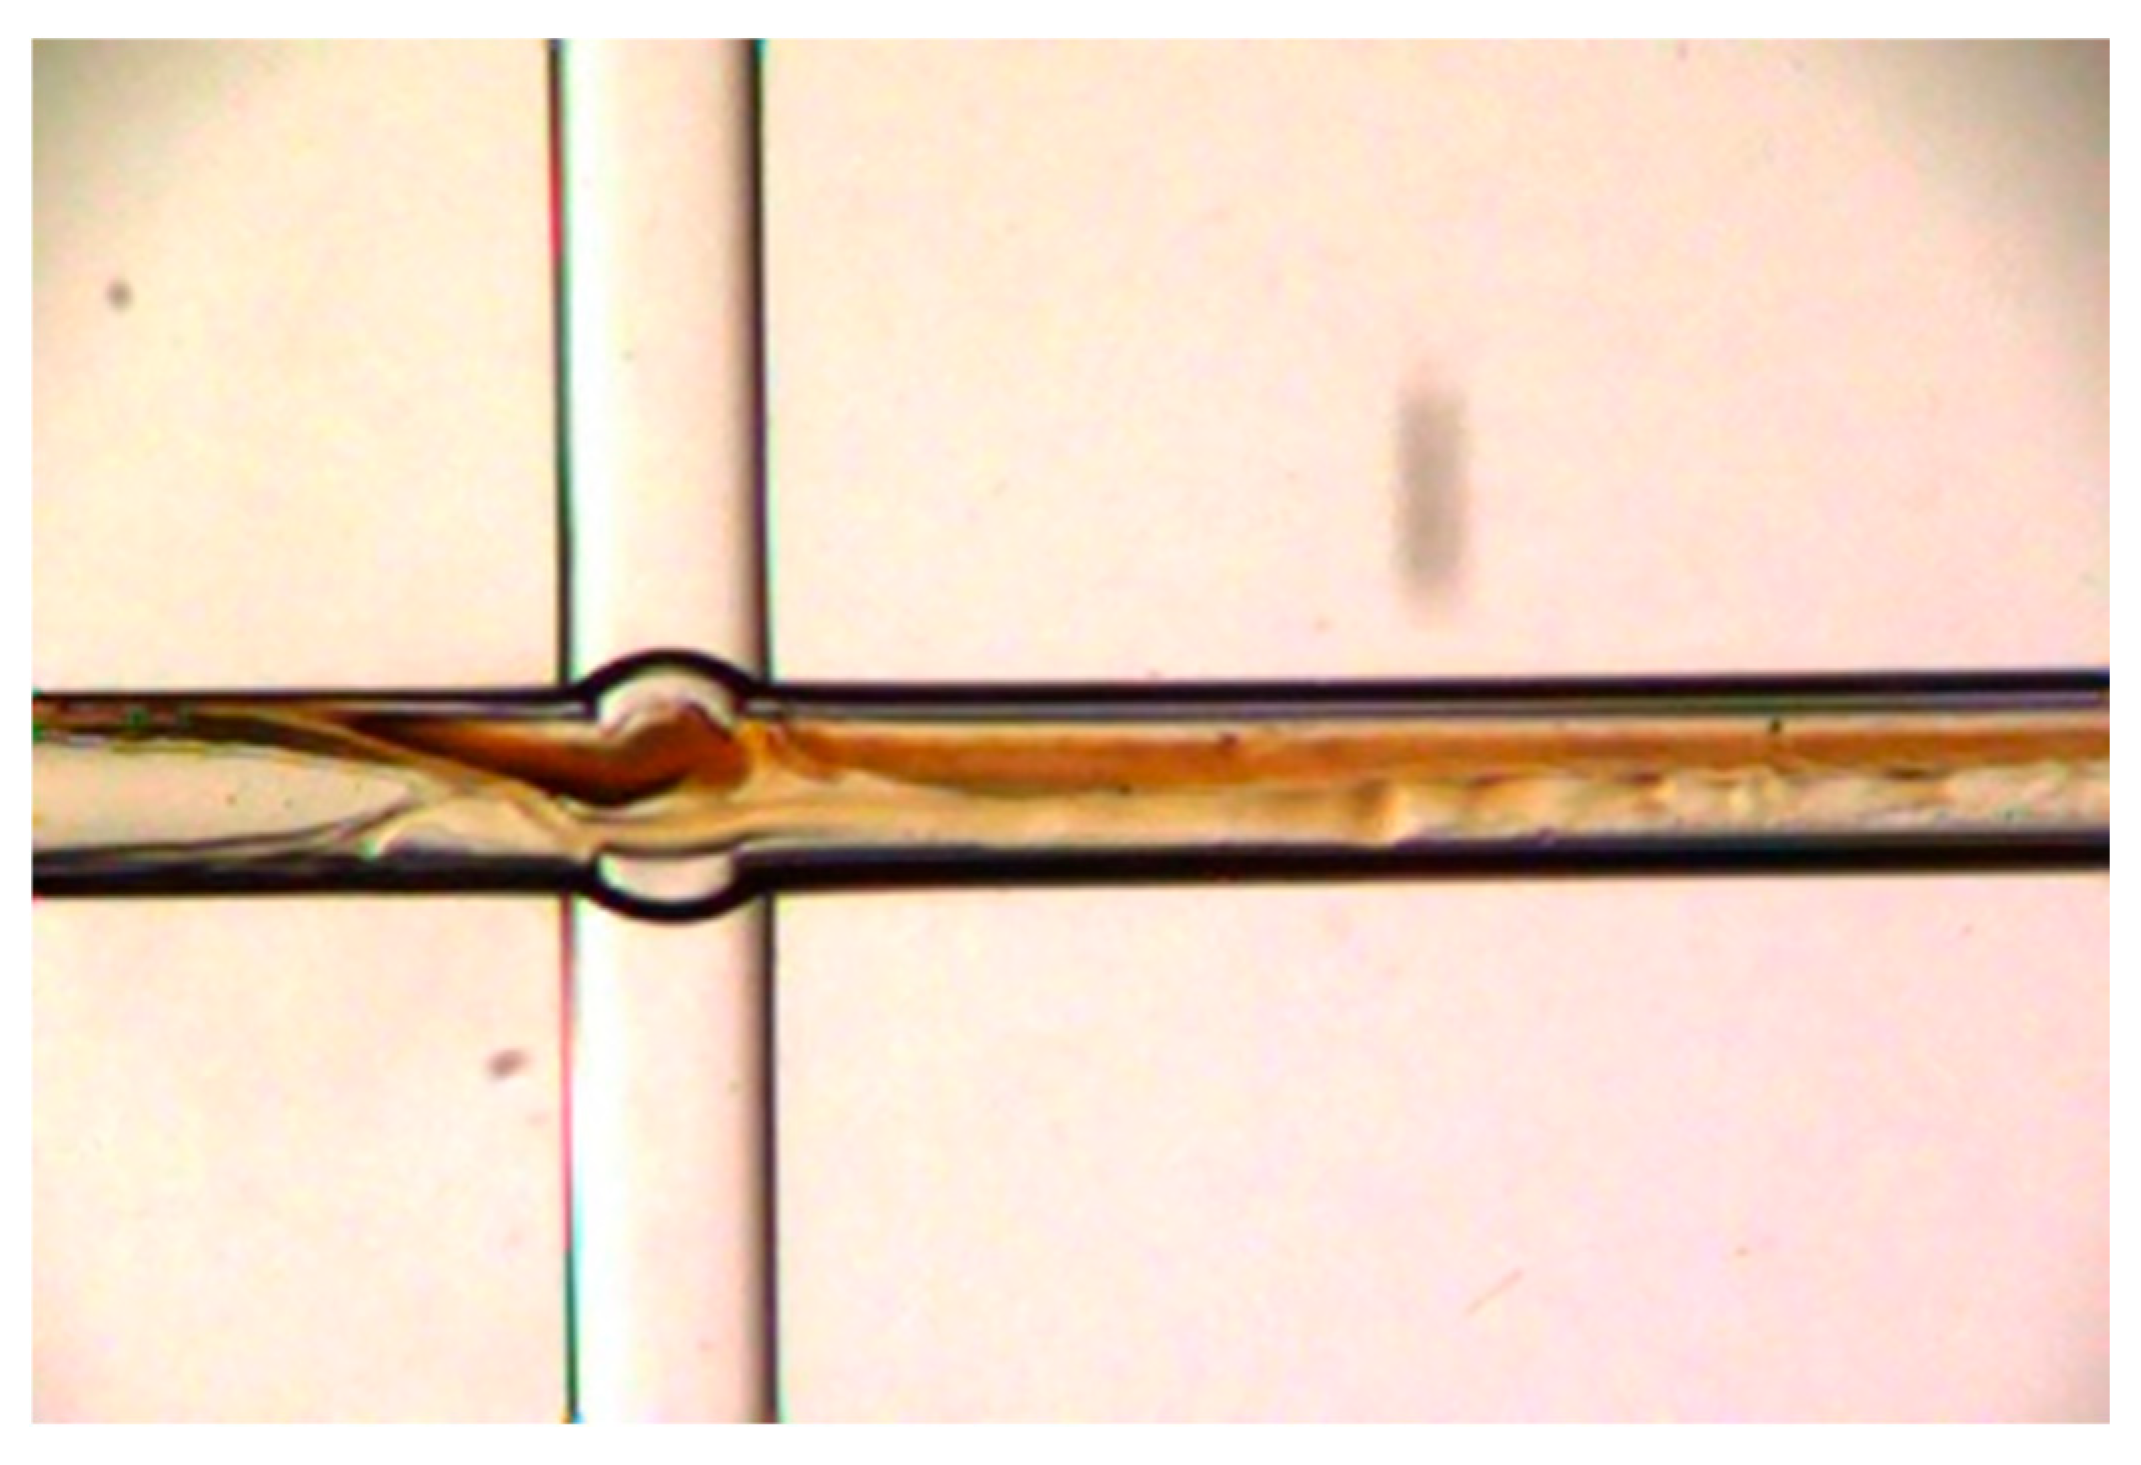
2.2. Synthesis of AOS in the Microchannel Reactor

AOS synthesis was conducted in a custom-built gas-liquid microsulfonation system featuring a cross-shaped microchannel chip. The proposed reaction mechanism, illustrated in Figure 1, involves a complex pathway with several intermediate and side reactions. Initially, SO3 undergoes electrophilic addition to the α-olefin, forming the unstable β-sultone intermediate. This intermediate can subsequently isomerize to various products, including olefin sulfonic acid, γ-sultone, δ-sultone, and dimeric sultones. Neutralization of the olefin sulfonic acid yields sodium olefin sulfonate. Under alkaline conditions, the sultones undergo hydrolysis and neutralization to form hydroxyalkanesulfonates, which can further convert to AOS at elevated temperatures.
The experimental setup, depicted in Figure 2, comprised an SO3 generator (FJEE-III, China Research Institute of Daily-use Chemical Industry) and a cross-shaped microchannel chip, depicted in Figure 3, which is fabricated from borosilicate glass through a glass etching process. The setup also included several PTFE tubes, a micro-syringe pump (LSP01-3A, Baoding Lange Constant Flow Pump Co., Ltd., Baoding, China), a constant-temperature water bath, a high-speed camera, an SO3 tail gas treatment unit, and a computer workstation. The system allowed precise control of the reaction temperature and gas-liquid flow rates. SO3 is generated by the catalytic conversion of SO2 with dry air in a reformer tower at a reaction temperature of 465 °C over a V2O5 catalyst, with the SO3 concentration and gas flow rate regulated by a mass flow controller. The liquid-phase reactant, 1-dodecene, was delivered via the micro-syringe pump and preheated to the reaction temperature within a PTFE tubing (1.6 mm O.D. × 0.6 mm I.D.).
The gas and liquid streams were introduced into the cross-shaped microchannel—the gas centrally and the liquid from the opposing ends—forming an annular flow regime, as shown in Figure 4, with a gas core surrounded by a liquid film. The reaction mixture then flowed into downstream PTFE tubing (1.6 mm O.D. × 0.6 mm I.D.) for further reaction; the length of the tubing was 2 m. This configuration, within the microchannel in chip and PTFE tubing, facilitated efficient mixing and rapid reaction. The product stream was collected, while the remaining gas flowed into the SO3 tail gas treatment unit. The preheating tubing, microchannel chip, and outlet tubing were immersed in a constant-temperature water bath. The sulfonation products were neutralized, hydrolyzed, and subsequently analyzed by liquid chromatography.

2.3. Product Analysis Methods

The active substance content of the sulfonated products was determined by high-performance liquid chromatography, (HPLC, LC-16, Shimadzu Co., Ltd., Suzhou, China) equipped with a differential refractive index detector. The chromatographic conditions are summarized in Table 1.
An external standard method was employed for quantification. A calibration curve was constructed by analyzing a series of AOS standard solutions of known concentrations under the specified chromatographic conditions (Table 1) and plotting peak areas against concentration. Sulfonated product samples were dissolved in methanol, filtered through a membrane filter, and analyzed by HPLC. The active substance content was calculated using Equation (1):
Y A O S = C A O S × V × D t m × 100 %
where YAOS is the content of the active substance, %; CAOS is the concentration of AOS in the sample, g/mL; V is the volume of the sample constant volume, mL; Dt is the dilution times; and m is the sampling mass of sulfonated product, g.

2.4. Box-Behnken Response Surface Experimental Design

To systematically investigate the influence of key operating parameters (gas-phase flow rate, reaction temperature, SO3/α-olefin molar ratio, and SO3 volume fraction) on the sulfonation of 1-dodecene with gaseous SO3 in a cross-shaped microreactor, response surface methodology (RSM) coupled with a Box-Behnken design (BBD) was employed. This approach facilitated the analysis of factor interactions and the determination of optimal operating conditions through multiple regression analysis. A four-factor, three-level BBD was implemented. The ranges for each factor, initially determined through single-factor experiments, are presented in Table 2.

3. Results and Discussion

3.1. Single-Factor Experimental Analysis

The influence of gas-phase flow rate, reaction temperature, SO3/α-olefin (AO) molar ratio, and SO3 volume fraction on the active substance content was initially investigated through single-factor experiments. The results are presented in Figure 5.

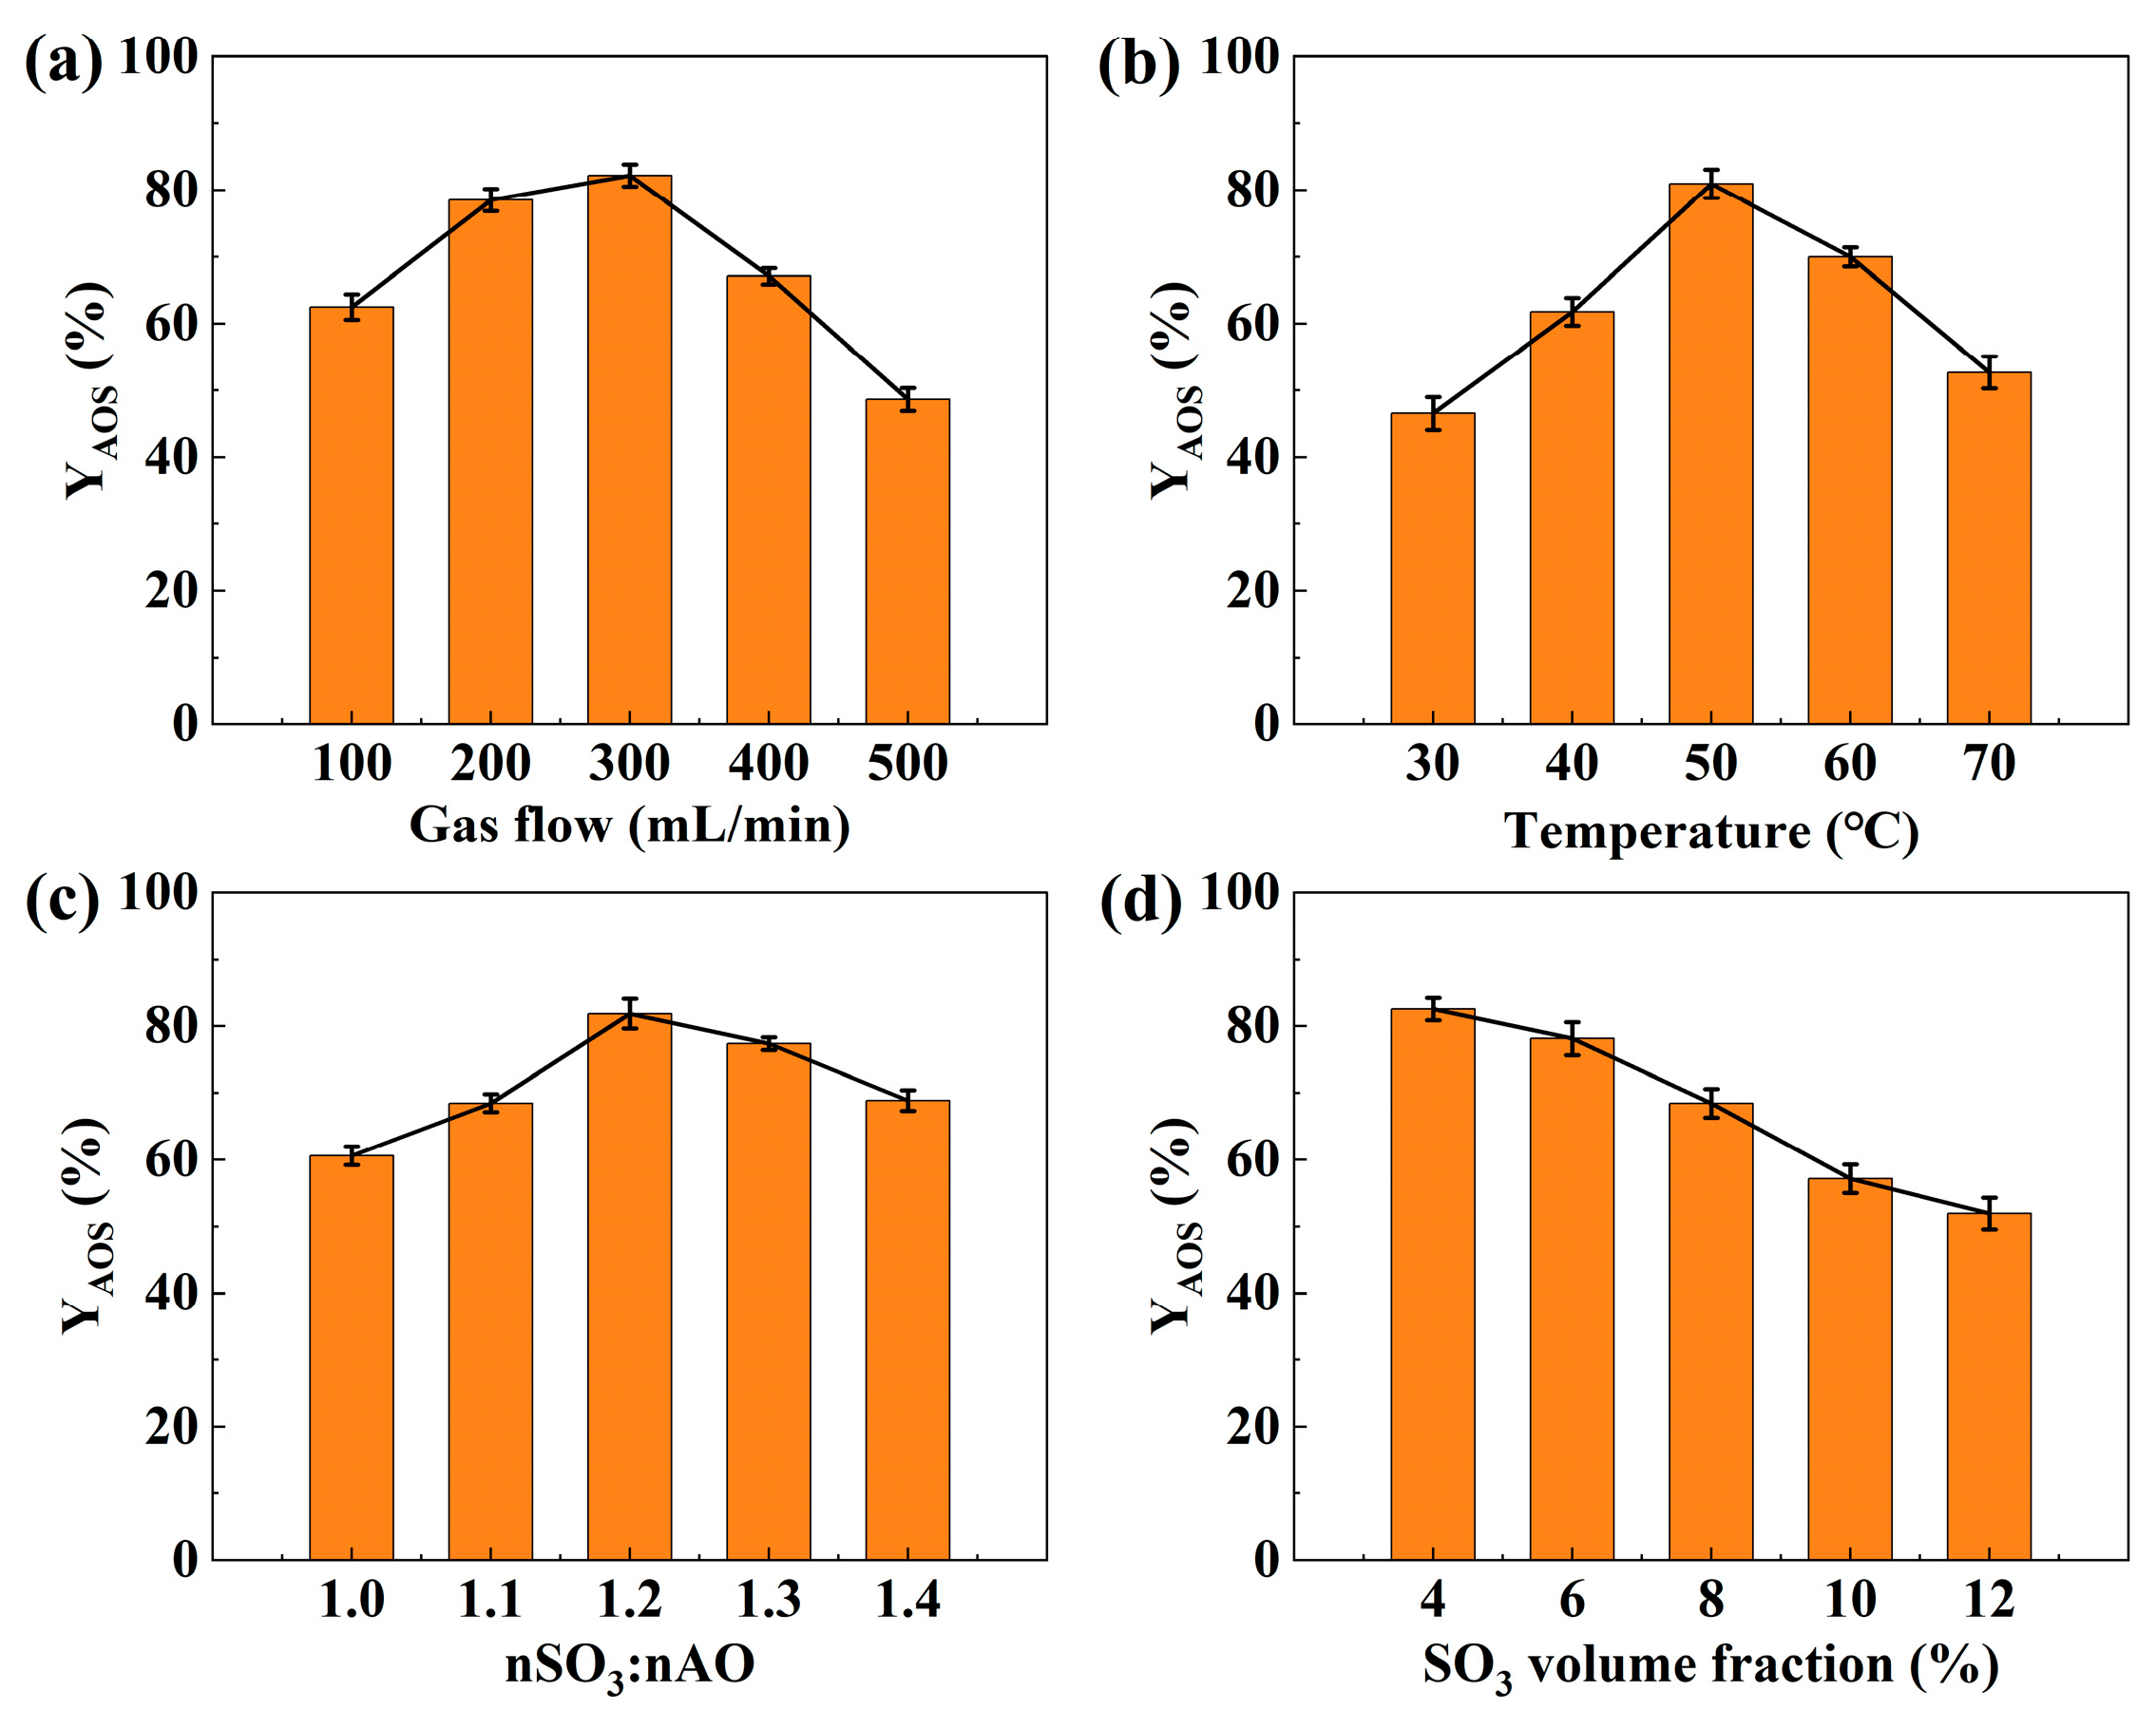
3.1.1. Effect of Gas-Phase Flow Rate

The SO3-air mixture flow rate is crucial for controlling the flow regime and mixing efficiency in gas-liquid sulfonation, the influence of this flow rate is particularly pronounced in microchannels. As this is a heterogeneous gas-liquid reaction, mixing directly impacts the reaction process. The effect of gas flow rate was investigated at a temperature of 50 °C, an SO3/AO molar ratio of 1.2, and an SO3 volume fraction of 4%. Increasing the gas flow rate from 100 mL/min to 300 mL/min enhanced the active substance content. This increase likely promoted turbulence within the annular flow, enlarging the gas-liquid interfacial area and thus improving mass transfer of SO3 from the gas to the liquid phase. However, further increasing the gas flow rate from 300 mL/min to 500 mL/min led to a decrease in active substance content. At higher gas velocities, increased fluctuations can destabilize the annular flow, potentially disrupting the liquid film and reducing mass transfer efficiency. Furthermore, higher flow rates shorten the residence time, limiting the residence time between SO3 and the α-olefin and promoting the escape of unreacted SO3.

3.1.2. Effect of Reaction Temperature

The sulfonation reaction is highly exothermic, with its rate strongly dependent on temperature. The reaction temperature was controlled using a constant-temperature water bath. The influence of temperature on active substance content was investigated at a gas flow rate of 300 mL/min, an SO3/AO molar ratio of 1.2, and an SO3 volume fraction of 4%. Increasing the temperature from 30 °C to 50 °C significantly enhanced the active substance content. This is consistent with the Arrhenius equation, where higher temperatures increase the reaction rate constant and accelerate the reaction, leading to higher α-olefin conversion. Additionally, the decreased liquid viscosity at elevated temperatures likely enhances SO3 diffusion within the liquid phase, further promoting the reaction. However, further temperature increases to 60 °C and 70 °C resulted in a significant decline in active substance content. This suggests that at higher temperatures, side reactions become more prominent, the byproducts primarily consist of disulfonates from oversulfonation and unconverted sulfonolactones, leading to increased byproduct formation and consequently reducing the active substance content. Therefore, an optimal temperature of approximately 50 °C is indicated for maximizing active substance content.

3.1.3. Effect of SO3/AO Molar Ratio

Stoichiometrically, the reaction between SO3 and AO requires a 1:1 molar ratio. However, due to mass transfer limitations and competing side reactions, excess SO3 is typically required to achieve optimal conversion. The SO3/AO molar ratio was controlled by adjusting the liquid flow rate. Its effect on the active substance content was investigated at a gas flow rate of 300 mL/min, a temperature of 50 °C, and an SO3 volume fraction of 4%. Increasing the molar ratio from 1.0 to 1.2 significantly enhanced the active substance content, reaching a maximum value. This increase can be attributed to the reduced liquid film thickness at lower liquid flow rates (corresponding to higher molar ratios), which shortens the gas-liquid mass transfer distance and facilitates SO3 transfer into the liquid phase. The resulting higher SO3 concentration in the liquid phase promotes more complete α-olefin conversion. However, further increases in the molar ratio to 1.3 and 1.4 led to a decline in active substance content. This suggests that excessive SO3 can lead to over-sulfonation and enhanced side reactions, increasing byproduct formation. Furthermore, the reduced liquid flow rate at higher molar ratios may destabilize the annular flow, resulting in non-uniform α-olefin distribution within the microchannel and hindering the reaction.

3.1.4. Effect of SO3 Volume Fraction

The mixture of SO3 and air was used as the sulfonating agent, with the SO3 volume fraction representing the sulfonating agent concentration. The effect of SO3 volume fraction on active substance content was investigated at a gas flow rate of 300 mL/min, a temperature of 50 °C, and an SO3/AO molar ratio of 1.2. Contrary to initial expectations, the active substance content decreased as the SO3 volume fraction increased from 4% to 12%. While a higher SO3 volume fraction should theoretically enhance the mass transfer driving force and reaction rate, maintaining a constant molar ratio at higher SO3 concentrations necessitates a corresponding increase in the liquid flow rate. This decrease in the gas-to-liquid flow ratio thickens the liquid film in the annular flow regime, increasing the liquid-phase mass transfer resistance. Consequently, SO3 accumulates at the gas-liquid interface, leading to a localized high-temperature zone due to the rapid exothermic reaction. This localized heating further promotes side reactions. Additionally, product accumulation at the interface hinders mass transfer, ultimately reducing the active substance content. These results indicate that an SO3 volume fraction of 4% provides optimal mass transfer efficiency under the investigated conditions.

3.2. BBD Response Surface Experiment Analysis

Optimization and analysis of AOS synthesis were performed using response surface methodology (RSM) coupled with a Box-Behnken design (BBD). The effects of gas flow rate, temperature, SO3/AO molar ratio, and SO3 volume fraction on the active substance content of AOS were investigated to determine the optimal process conditions. A four-factor, three-level BBD was employed. Table 3 presents the factors and their corresponding levels, which were determined based on preliminary single-factor experiments.

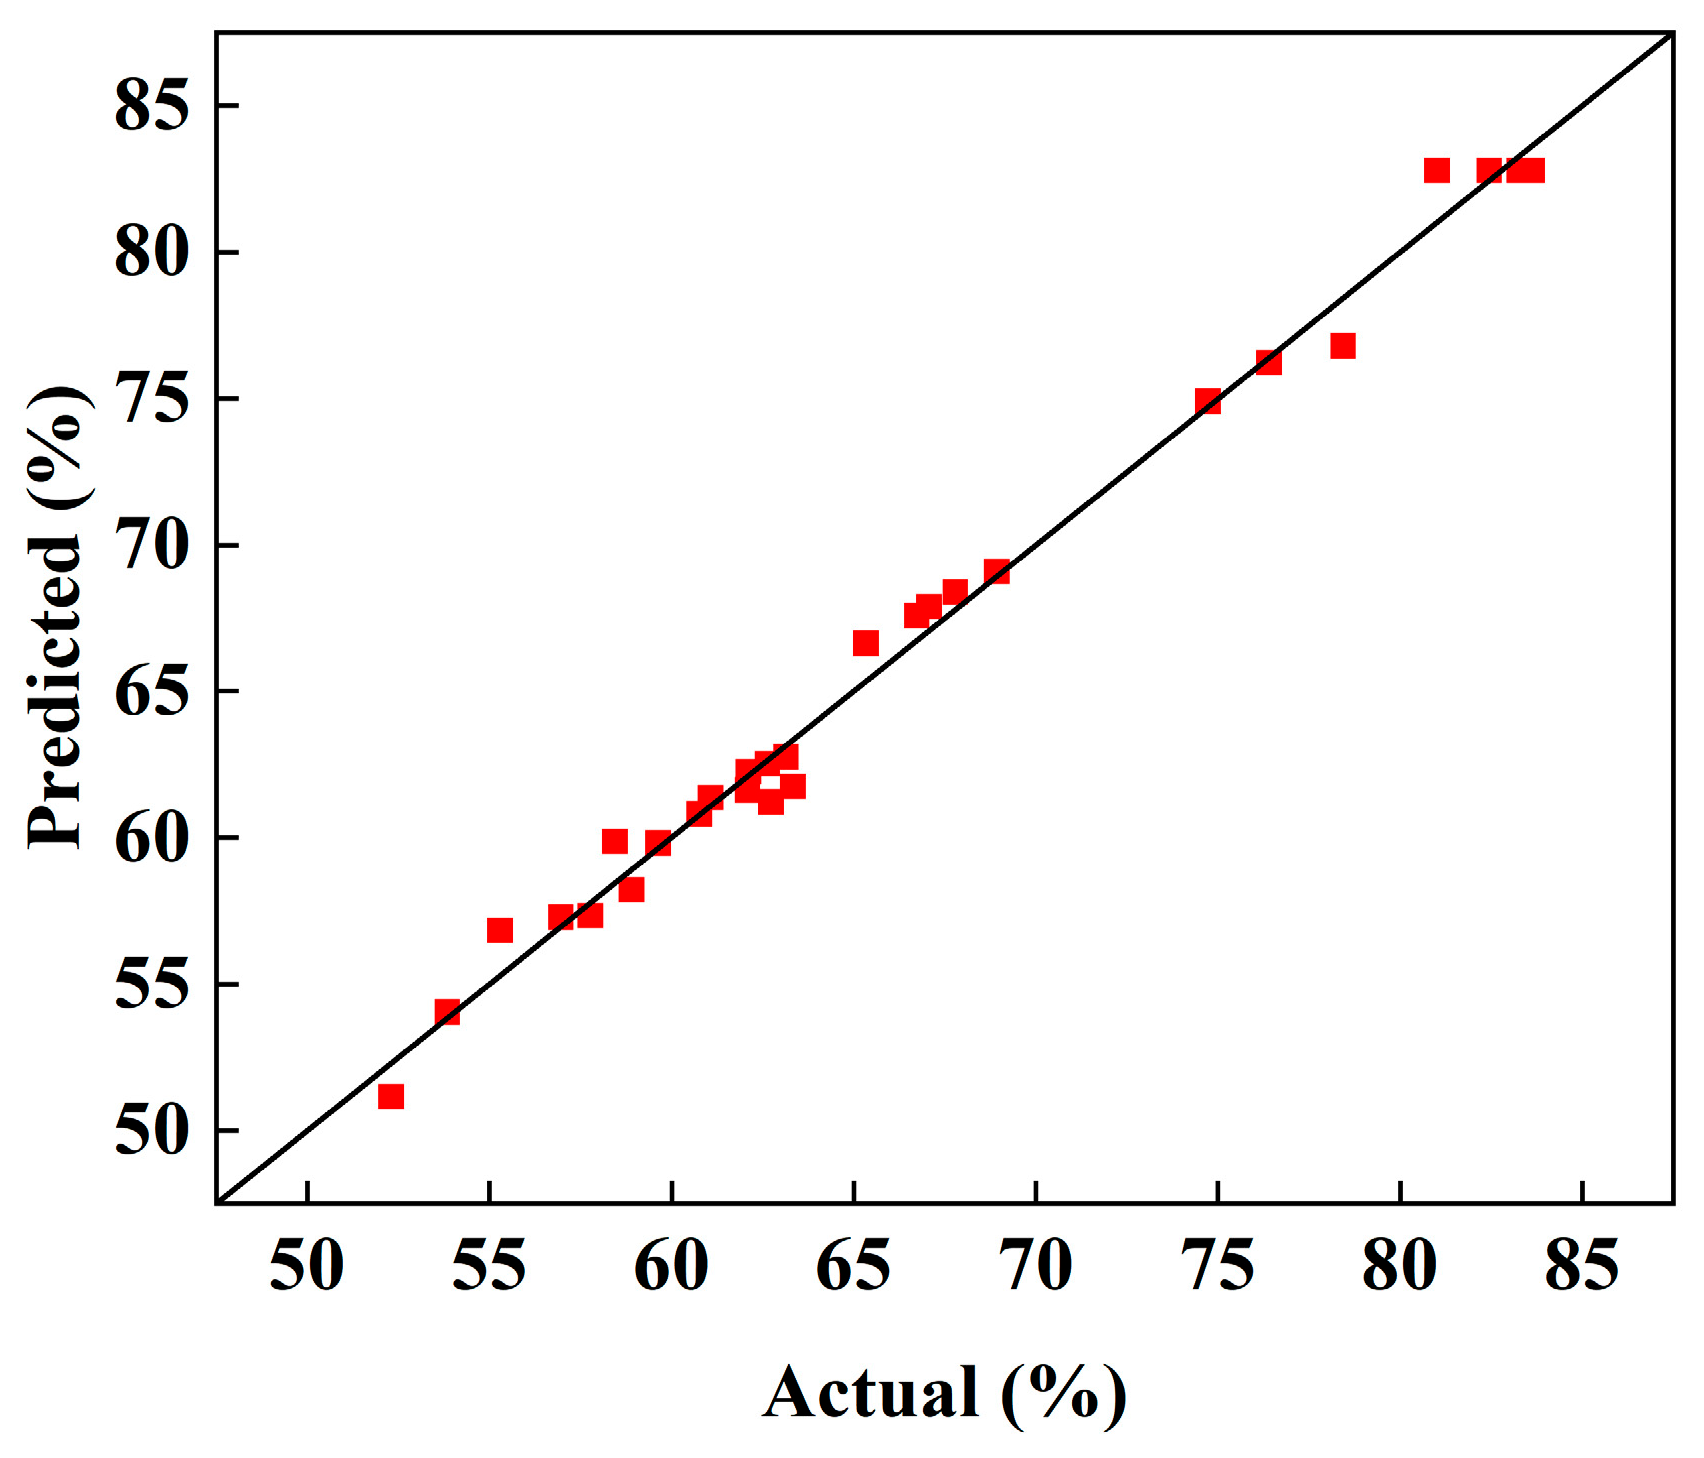
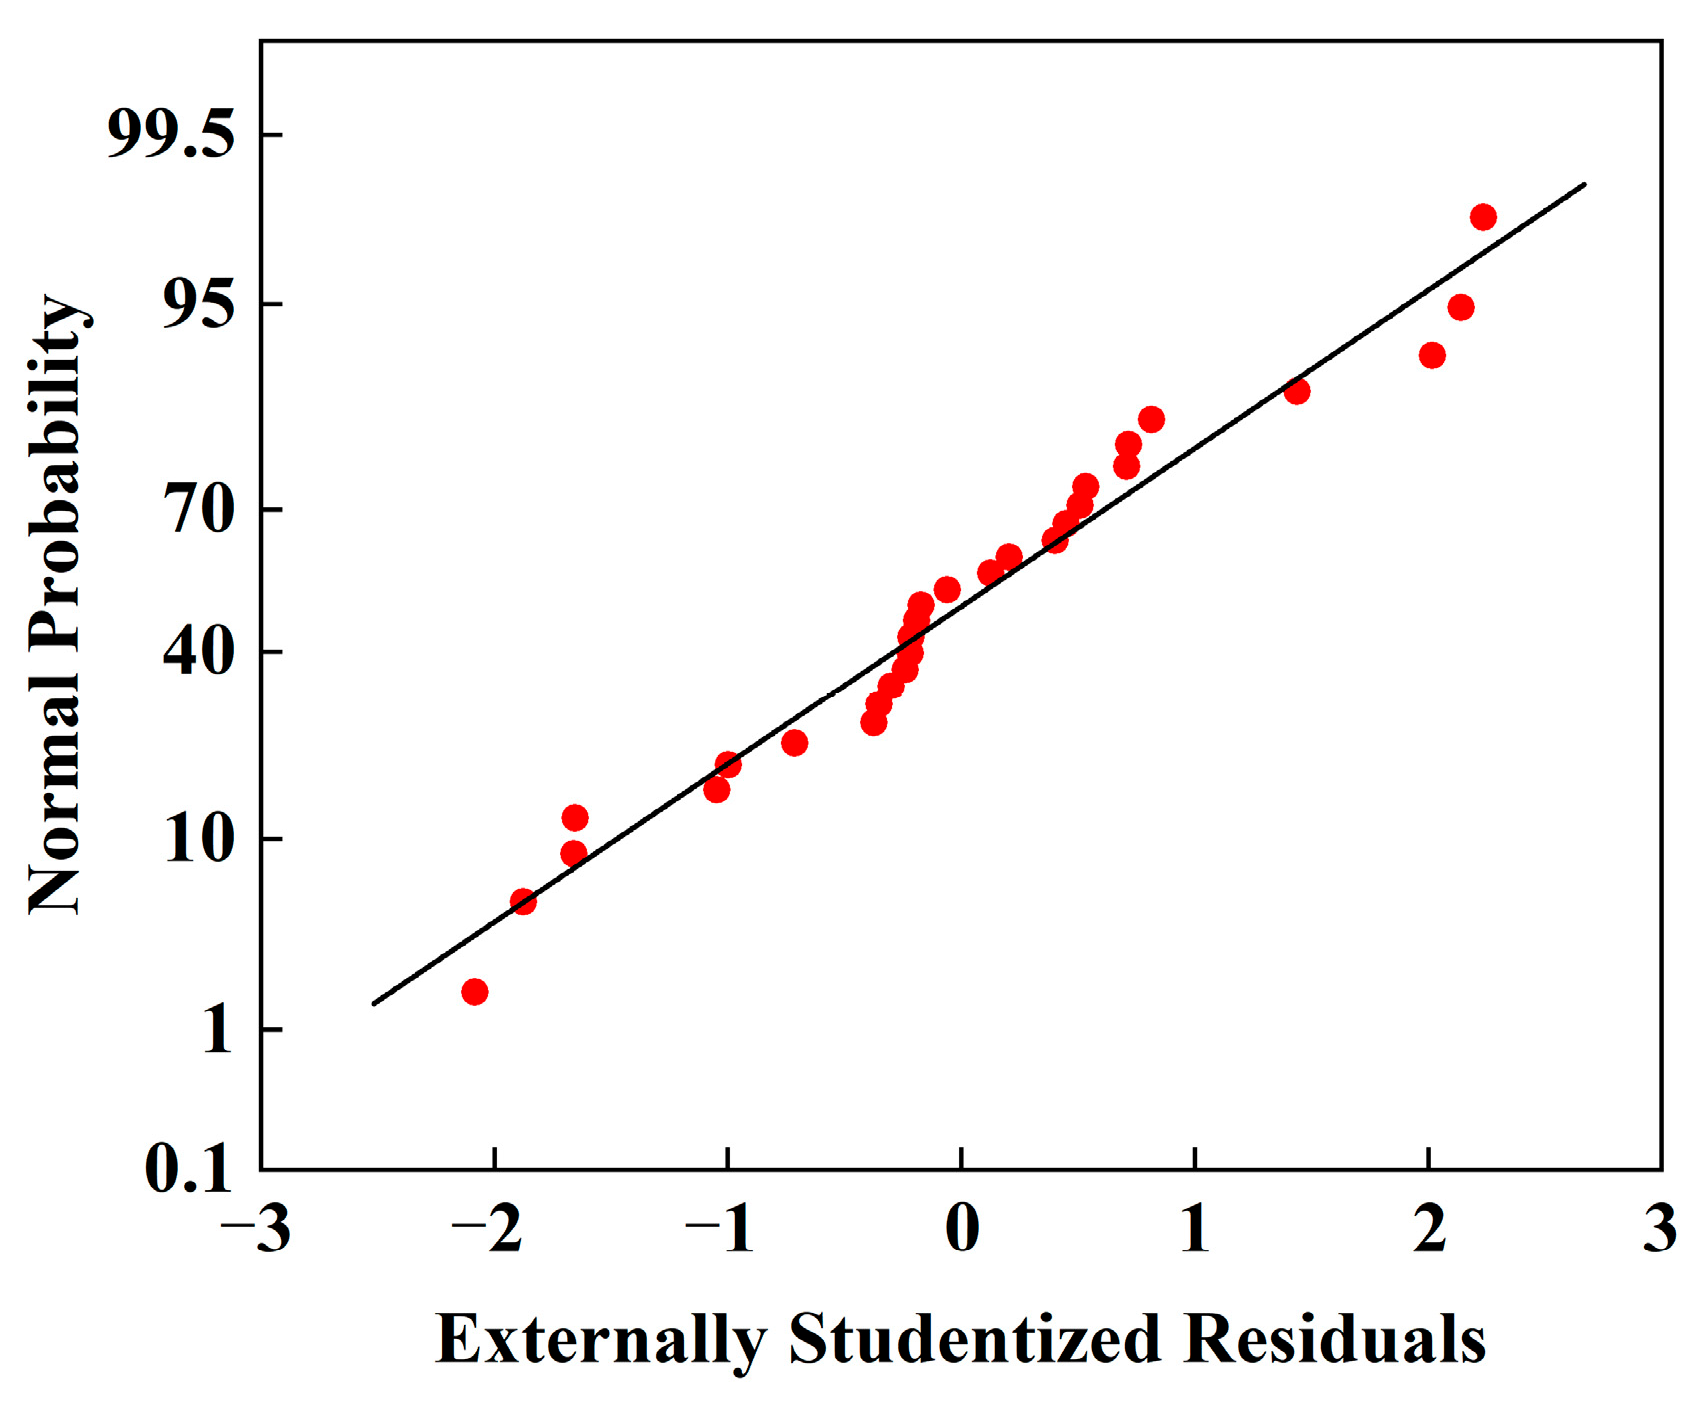
3.2.1. Model Construction and Fitting

Design-Expert software (Version 12, Stat-Ease Inc., Minneapolis, MN, USA) was used for the experimental design, model prediction, and statistical analysis. A four-factor, three-level BBD, comprising 29 randomized experiments that included five center point replicates for pure error estimation, was employed. Table 4 presents the coded factor levels, experimental active substance content, and predicted active substance content for each run. A quadratic polynomial regression model (Equation (2)) was developed to correlate the response with the independent variables:
Y = 80.39 4.96 A + 2.06 B + 2.08 C 4.42 D + 0.3125 A B 1.05 A C + 2.38 A D + 1.00 B C + 0.0625 B D 2.09 C D 8.38 A 2 7.11 B 2 5.55 C 2 2.64 D 2
where Y represents the active substance content of the product; A, B, C, and D represent the gas flow rate, temperature, SO3/AO molar ratio, and SO3 volume fraction, respectively; AB, AC, AD, BC, BD, and CD represent the interaction terms between the independent variables; and A2, B2, C2, and D2 represent the quadratic terms of the respective independent variables.
The significance of the quadratic regression model was evaluated using analysis of variance (ANOVA). The ANOVA results for optimizing active substance content are presented in Table 5. A large F-value indicates high statistical significance, while a p-value less than 0.05 indicates statistical significance. As shown in Table 5, the model F-value of 113.67 (p < 0.0001) confirms the significance of the model. The terms A (gas flow rate), B (temperature), C (SO3/AO molar ratio), D (SO3 volume fraction), AD, CD, A2, B2, C2, and D2 were statistically significant. The magnitude of the F-value for each term reflects its influence on active substance content, with the order of significance for individual factors being gas flow rate > SO3 volume fraction > temperature > SO3/AO molar ratio. The lack-of-fit F-value of 2.25 (p = 0.2263) indicates that the lack of fitness is not significant relative to pure error. The low p-value and small pure error suggest excellent repeatability of the experimental data.
The model’s goodness of fit was assessed using the coefficient of determination (R2) and the adjusted R2 (R2adj). As shown in Table 6, the R2 value of 0.9882 indicates a strong correlation between the independent variables and the response. The R2adj value of 0.9763 further supports the model’s adequacy, suggesting a good fit between the regression equation and the experimental data. The predicted R2pre (0.9415) is in reasonable agreement with the adjusted R2, with a difference of less than 0.2. The low coefficient of variation (CV) of 1.57% (<10%) indicates good model reproducibility. Furthermore, the adequate precision value (signal-to-noise ratio) of 29.9645 (>4) confirms the model’s adequacy for navigating the design space. Diagnostic plots, including predicted vs. actual values, normal probability plots, and externally studentized residuals, were examined to verify the model’s statistical adequacy.
The model’s statistical adequacy was assessed using diagnostic plots, including predicted vs. actual values (Figure 6), normal probability plots, and externally studentized residuals (Figure 7). As shown in Figure 6, the predicted and actual values are in good agreement. The normal probability plot (Figure 7) and the distribution of externally studentized residuals (within ±3) further confirm the model’s accuracy and validate the normality assumptions.

3.2.2. Response Surface Analysis

Three-dimensional (3D) response surface plots and their corresponding contour plots (Figure 8) were used to visualize the interactive effects of the independent variables on the active substance content of AOS. These plots provide insights into the significance of the interactions and their influence on AOS synthesis.
Figure 8a,b illustrates the interactions between gas flow rate and temperature and gas flow rate and SO3/AO molar ratio, respectively. In both cases, the active substance content initially increases and then decreases, forming a peak in the central region of the response surface. The elliptical contours, with their long axes oriented along the gas flow rate axis, suggest that gas flow rate has a more significant influence than temperature or molar ratio, and that the interactions between these factors are relatively weak. Figure 8c depicts the interaction between gas flow rate and SO3 volume fraction. The irregular shape of the response surface, with one diagonally rising sharply and the other falling, indicates a significant interaction between these two factors. At low SO3 volume fractions, the active substance content is highly sensitive to changes in gas flow rate, initially increasing and then decreasing significantly. This suggests that the gas flow rate is the dominant factor under these conditions. At higher SO3 volume fractions, the active substance content still exhibits an initial increase followed by a decrease with increasing gas flow rate, indicating that optimizing gas flow conditions can improve mass transfer even at suboptimal SO3 concentrations. However, low SO3 volume fractions are generally favored for achieving high active substance content. Optimizing the gas flow rate under these low SO3 volume fraction conditions maximizes the synergistic effect of these two parameters, leading to enhanced mass transfer and higher active substance content.
Figure 8d shows the interaction between temperature and SO3/AO molar ratio. The uniform slopes of the response surface and circular contours indicate a negligible interaction between these factors. Figure 8e,f illustrates the interactions of SO3 volume fraction with temperature and molar ratio, respectively. The stable trend of the temperature response surface with decreasing SO3 volume fraction (Figure 8e) suggests a weak interaction. In contrast, the sloped response surface and tilted elliptical contours in Figure 8f reveal a significant interaction between SO3 volume fraction and molar ratio. At a fixed SO3 volume fraction of 4%, the active substance content increases sharply as the molar ratio increases from 1.1 to 1.2, representing the steepest region of the response surface. This highlights the synergistic effect of these two factors in maximizing active substance content. However, further increasing the molar ratio from 1.2 to 1.3 leads to a decrease in active substance content, likely due to the increasing dominance of side reactions, which are not suppressed by the low SO3 volume fraction. At an SO3 volume fraction of 8%, the active substance content still exhibits an initial increase followed by a decrease with an increasing molar ratio, but the overall active substance content is lower, suggesting that the higher SO3 concentration limits the achievable active substance content.

3.2.3. Experimental Validation of Optimized Conditions

The validity of the RSM model was assessed by comparing experimental results with model predictions under optimized conditions. The optimized conditions for maximizing active substance content, determined using the model, are presented in Table 7, along with the corresponding predicted values.
To minimize experimental errors, triplicate experiments were conducted under the optimized conditions. The average experimental active substance content was 84.45%, which closely matched the predicted value of 85.14%. This strong agreement validates the RSM model and confirms the reliability of the optimized sulfonation conditions for α-olefins in the cross-shaped microreactor.
While the RSM optimization above focused solely on maximizing active substance content, it did not consider power consumption. To develop a more efficient, sustainable, and economical AOS process, a multi-objective optimization approach is necessary. This approach aims to maximize active substance content while simultaneously minimizing power consumption. However, these objectives are often conflicting, as increasing active substance content typically requires higher power input. Therefore, a multi-objective optimization algorithm is employed to navigate this trade-off and identify the Pareto optimal solutions.

3.3. Multi-Objective Optimization of Process Parameters Using NSGA-II and Entropy-Weighted TOPSIS

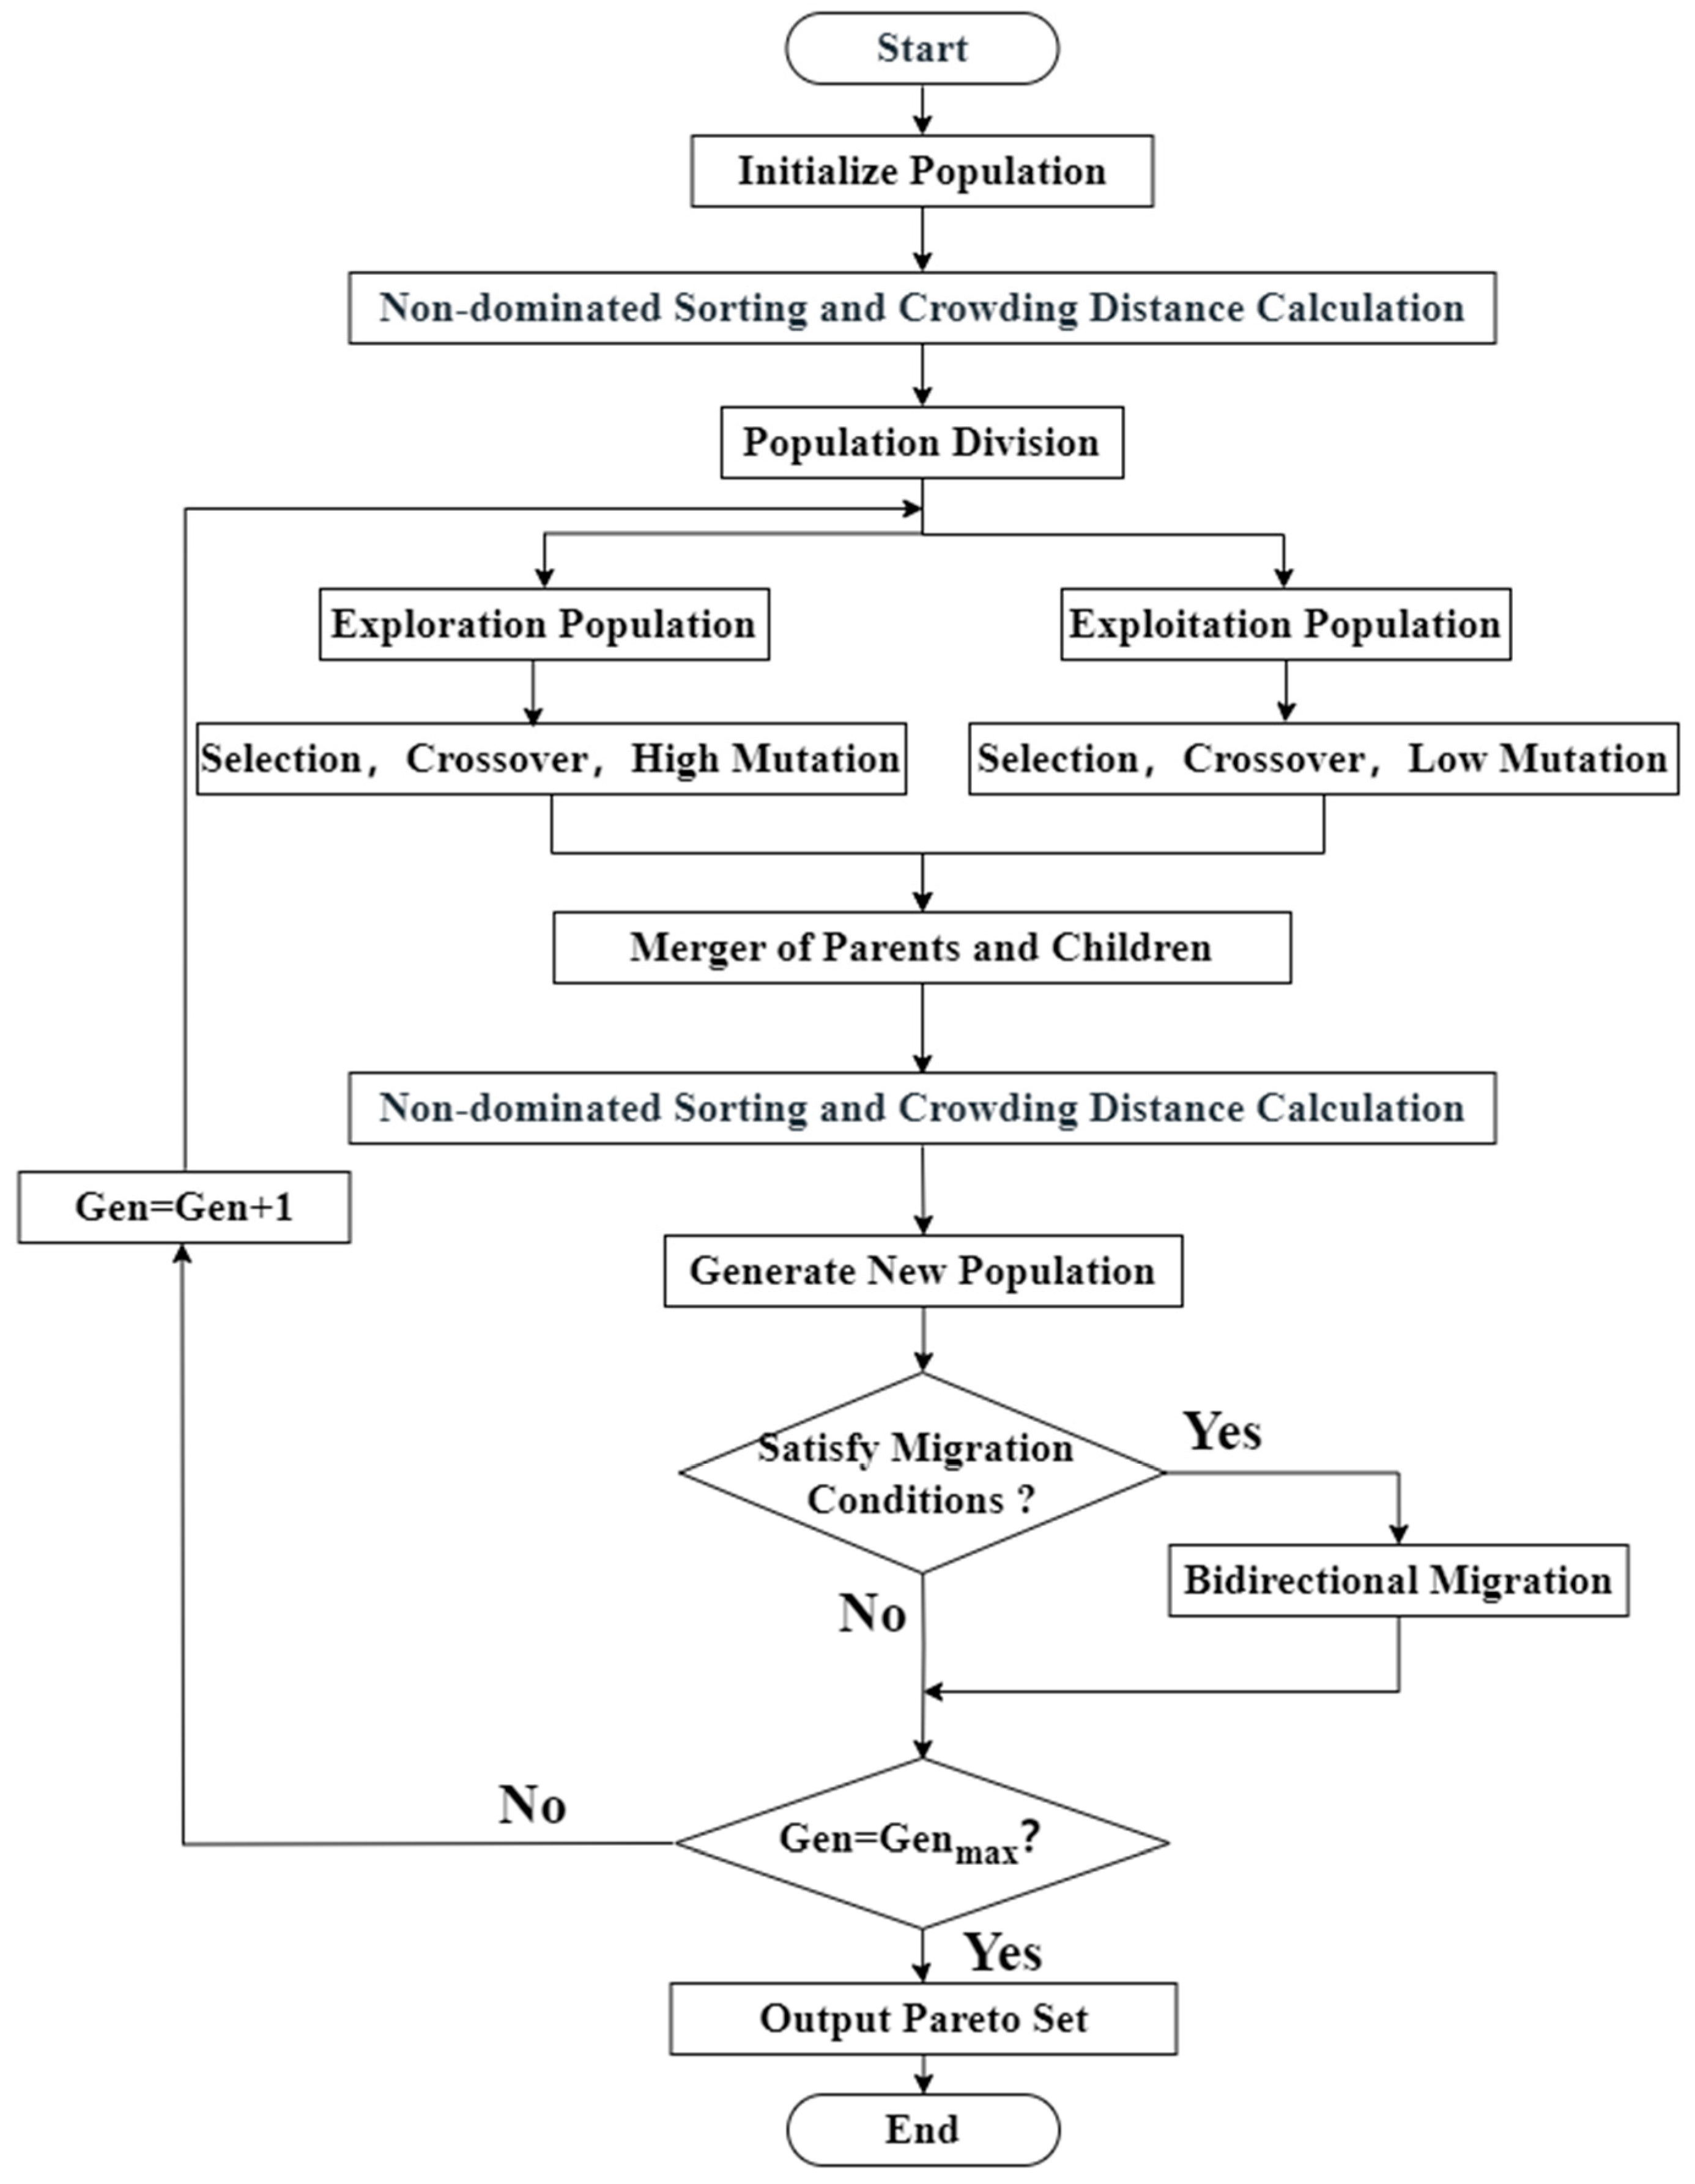
3.3.1. Multi-Objective Optimization of AOS Synthesis Using a Dual-Population NSGA-II and Entropy-Weighted TOPSIS

The non-dominated genetic algorithm II (NSGA-II) is a widely used multi-objective optimization algorithm known for its robustness and efficiency in generating Pareto optimal solutions [36,37]. Its core mechanisms include non-dominated sorting based on Pareto dominance and crowding distance calculation to maintain diversity within the Pareto front. To enhance global search capability and mitigate premature convergence, a dual-population strategy was incorporated into the standard NSGA-II algorithm. This strategy employs two independent sub-populations evolving in parallel, with periodic exchange of a small number of individuals to promote diversity and explore the search space more effectively. This improved NSGA-II algorithm was used to optimize both active substance content and power consumption, identifying reaction conditions that balance product quality and energy efficiency. This approach offers valuable guidance for industrial production. The structure of the improved NSGA-II algorithm is illustrated in Figure 9.
The entropy-weighted TOPSIS method is a multi-criteria decision-making approach that combines the objectivity of entropy weighting with the relative performance evaluation of TOPSIS [38]. Entropy weighting determines the weights of different criteria based on the variability of the corresponding data, thereby minimizing subjective bias. The TOPSIS method calculates the relative closeness of each solution in the Pareto front to the ideal solution. The solution with the highest relative closeness is then selected as the optimal solution.
Entropy weighting was employed to determine the weights of each objective function. First, the Pareto optimal solution set matrix X = (xij)m×n, where m is the number of solutions and n is the number of objectives, was normalized. Equations (3) and (4) were used to normalize the benefit-type (maximization) and cost-type (minimization) indicators, respectively, resulting in the normalized matrix R = (rij)m×n:
r i j = x i j min ( x j ) max ( x j ) min ( x j )
r i j = max ( x j ) x i j max ( x j ) min ( x j )
Next, the information entropy and entropy weights were calculated. Equation (5) was used to transform the normalized values rij into probabilities pij. The information entropy ej and entropy weight wj for the jth objective were then calculated using Equations (6) and (7), respectively:
p i j = r i j k = 1 m r k j
e j = 1 ln m i = 1 m p i j ln p i j
w j = 1 e j k = 1 n ( 1 e k )
The information entropy reflects the degree of variability or information content within the data for each indicator. A larger entropy weight indicates a greater influence of the corresponding objective in the overall evaluation. Finally, the normalized probabilities pij were weighed by the corresponding entropy weights wj to construct the weighted decision matrix vij according to Equation (8). This weighted matrix, incorporating both the indicator values and their relative importance, serves as the basis for the subsequent TOPSIS analysis.
v i j = w j p i j
The first step in the TOPSIS analysis involves determining the positive ideal solution (PIS) and negative ideal solution (NIS). The PIS, denoted as Vj+, is composed of the maximum values (max(vij)) for each indicator, representing the ideal scenario where all objectives are maximized. Conversely, the NIS, denoted as Vj, consists of the minimum values (min(vij)) for each indicator, representing the worst-case scenario.
Next, the Euclidean distances between each solution and the PIS (Di+) and NIS (Di) were calculated using Equations (9) and (10). These distances represent the proximity of each solution to the ideal and worst-case scenarios, respectively.
D i + = j = 1 n ( v i j V j + ) 2
D i = j = 1 n ( v i j V j ) 2
Finally, the relative closeness (Ci) of each solution to the PIS was calculated using Equation (11):
C i = D i D i + + D i
A higher relative closeness (Ci) indicates that the solution is closer to the PIS and farther from the NIS, representing a more desirable performance. The solutions were ranked based on their Ci values, allowing for the selection of the optimal solution.

3.3.2. Objective Function

This study aimed to optimize both active substance content and power consumption in gas-liquid microsulfonation using a multi-objective optimization approach. Two objective functions were defined, representing active substance content and power consumption, respectively. The active substance content objective function (Equation (12)) was derived from the response surface model, using the actual values (rather than coded values) of the independent variables: gas flow rate (A), temperature (B), SO3/AO molar ratio (C), and SO3 volume fraction (D).
Y = 1043.90292 + 0.497270 A + 6.004 B + 1417.0633 C + 15.20767 D + 0.000313 A B 0.105 A C + 0.011888 A D + 1.0025 B C 0.021875 B D 10.45000 C D 0.000846 A 2 0.069466 B 2 563.40833 C 2 0.619458 D 2
Power consumption during the sulfonation process primarily arises from the pressure drop associated with material transport and the electrical energy consumed by the pumps for water bath heating and reactant delivery. Therefore, the power consumption model described by Equation (13) was employed:
P = Δ p 1 Q g η 1 + Δ p 2 Q l η 2 + k S Δ T + P g + P l
where P is the total power consumption (kW), Δp is the gas-liquid pressure drop (determined from the pressure difference between the inlet and outlet piping), Qg and Ql are the gas and liquid flow rates, respectively, η1 and η2 are the efficiencies of the air compressor and syringe pump, respectively, k is the heat transfer coefficient of the water bath, S is the heat transfer area (the power consumed for water bath heating is assumed equal to the heat loss to the surroundings), and Pg and Pl are the base power consumption of the air compressor and syringe pump, respectively.
The physical parameters in Equation (13) were expressed in terms of the independent variables from the response surface model (A, B, C, and D) using the experimental conditions and equipment specifications. Substituting these relationships along with the measured pressure drops and temperature differences into Equation (13) yielded the power consumption model in terms of A, B, C, and D (Equation (14)).
X = 0.00718 A + 0.00177 A D C + 0.00213 ( B 25 ) + 1.5
Based on the response surface experiments, the following ranges were defined for the independent variables: gas flow rate (A) 200–400 mL/min, reaction temperature (B) 40–60 °C, SO3/AO molar ratio (C) 1.1–1.3, and SO3 volume fraction (D) 4–8%. A bi-objective optimization was performed, aiming to maximize active substance content (Y) and minimize power consumption (X).

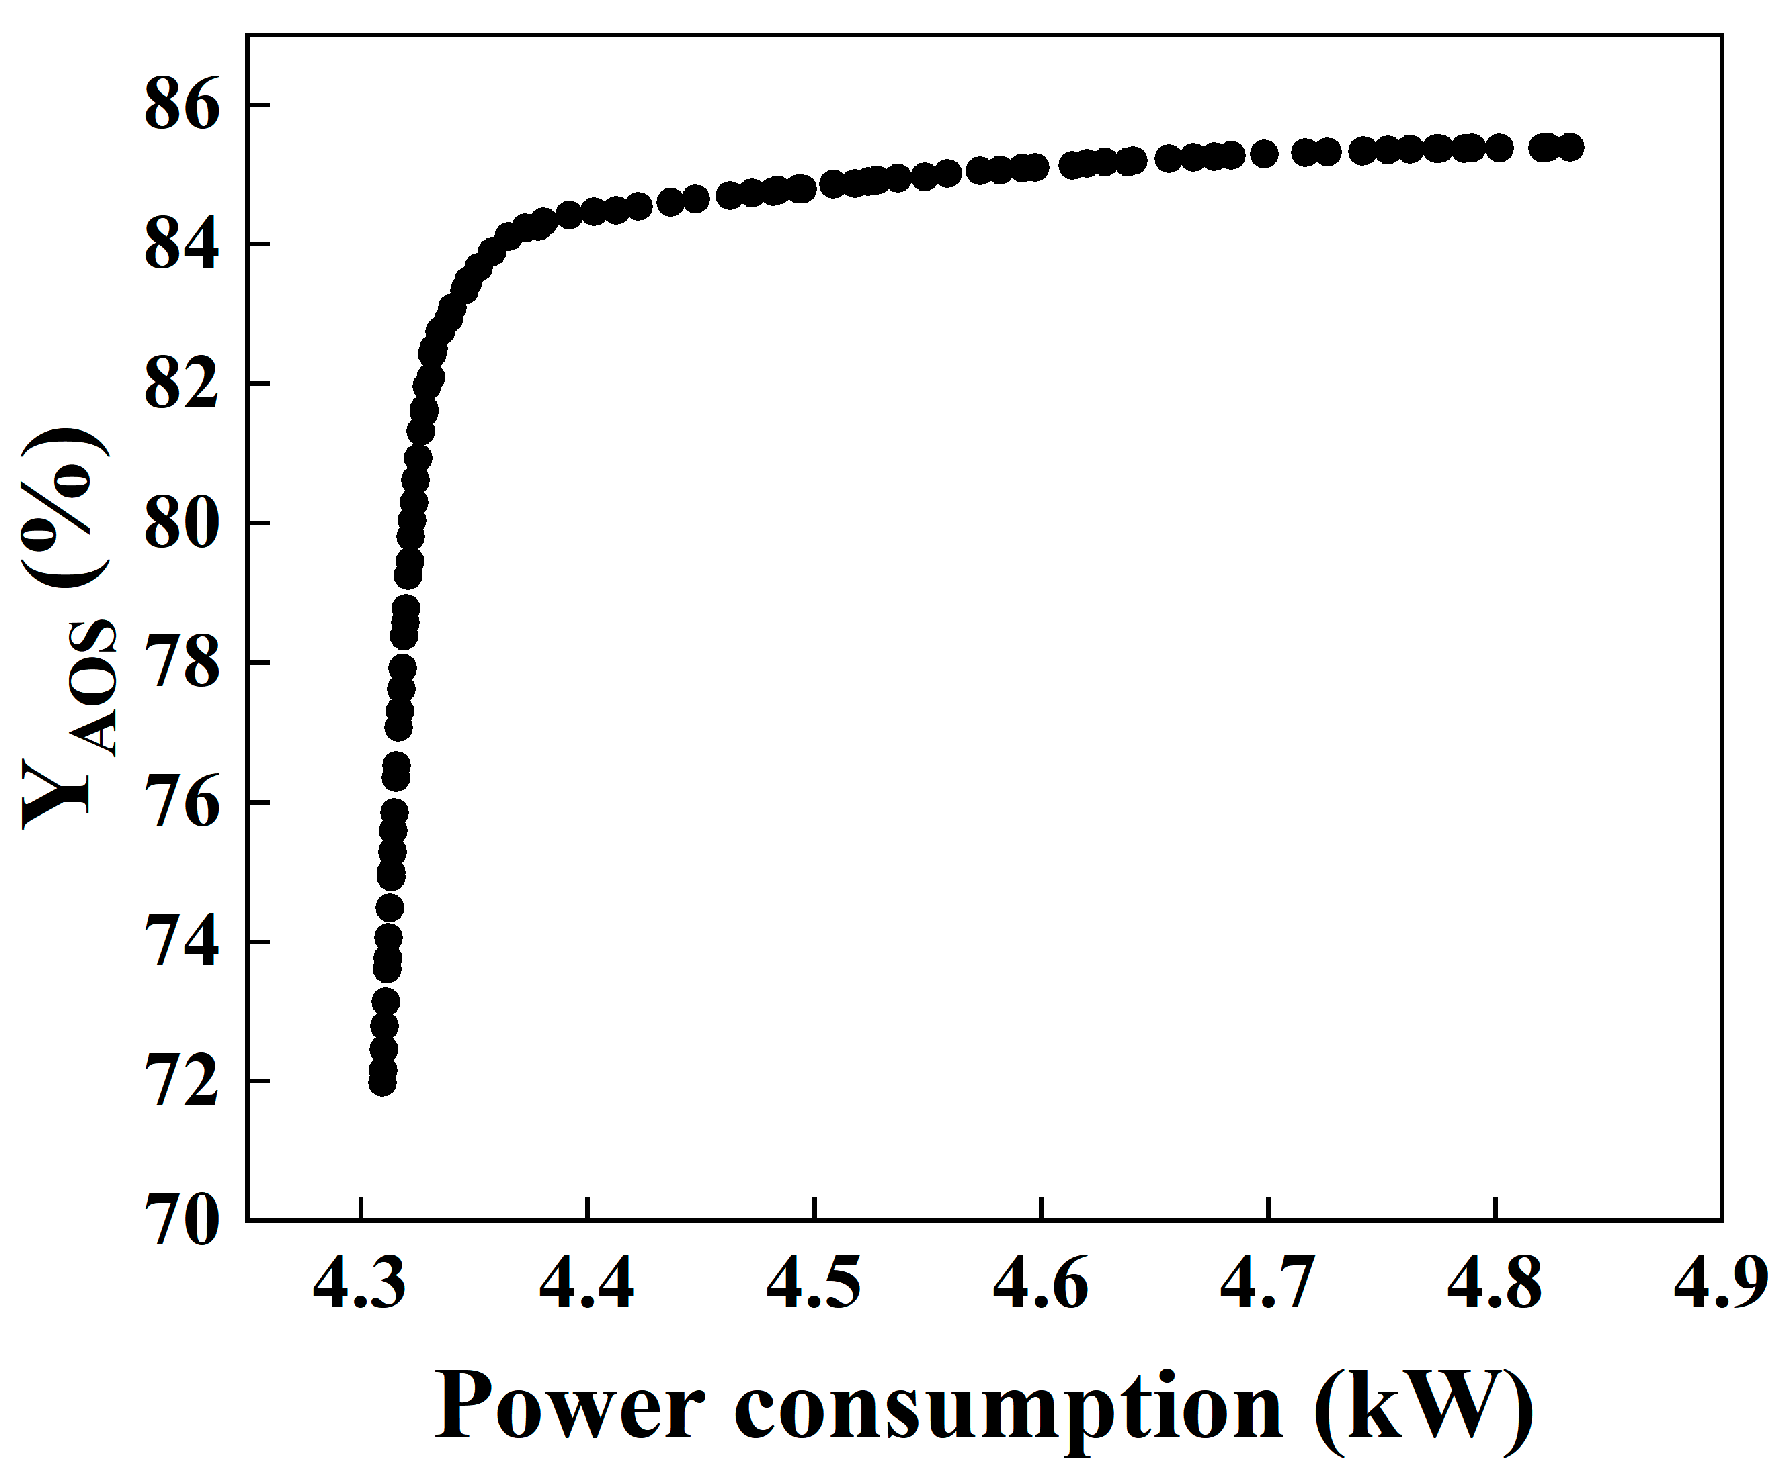
3.3.3. Optimization and Decision Results

The NSGA-II algorithm was implemented with the following parameters: crossover probability = 0.8, mutation probability (population 1) = 0.5, mutation probability (population 2) = 0.1, population size = 100, and number of generations = 200. The resulting Pareto front is shown in Figure 10. The optimal solution, identified from the Pareto front using the entropy-weighted TOPSIS method, is presented in Table 8.
Table 9 compares the optimal solution obtained from the multi-objective optimization (MOO) with the solution from the response surface methodology (RSM) maximizing active substance content. While the MOO solution resulted in a 3.8% decrease in active substance content compared to the RSM solution, it achieved a 10% reduction in power consumption. This demonstrates the effectiveness and feasibility of the multi-objective optimization approach in balancing active substance content and energy efficiency.

4. Conclusions

This study demonstrated the continuous-flow synthesis of α-olefin sulfonates (AOS) via gas-liquid sulfonation of SO3 and α-olefins (AO) in a cross-shaped microreactor. The rapid, highly exothermic reaction was systematically investigated and optimized. The results confirm that the cross-shaped microreactor provides excellent mass and heat transfer characteristics, significantly enhancing reaction efficiency and enabling the green and efficient synthesis of AOS.
A Box-Behnken design coupled with response surface methodology (RSM) was employed to investigate the effects of four key process parameters—gas flow rate, temperature, SO3/AO molar ratio, and SO3 volume fraction—on AOS active substance content. The order of significance of these factors was determined to be: gas flow rate > SO3 volume fraction > temperature > SO3/AO molar ratio. Significant interactions were observed between gas flow rate and SO3 volume fraction, and between SO3 volume fraction and molar ratio. The resulting quadratic regression model accurately predicted AOS active substance content (R2 > 0.94), with its validity and goodness of fit rigorously confirmed by ANOVA.
To improve process sustainability and economic viability, a power consumption model for the gas-liquid microsulfonation system was developed. Using this model and the previously established active substance content prediction model, a multi-objective optimization was performed using an improved dual-population NSGA-II algorithm. This optimization aims to simultaneously maximize active substance content and minimize power consumption. The entropy-weighted TOPSIS method was then applied to select the optimal operating conditions from the resulting Pareto front. The optimal conditions were determined to be: gas flow rate = 226 mL/min, temperature = 52 °C, SO3/AO molar ratio = 1.27, and SO3 volume fraction = 4%. Under these conditions, an active substance content of 83% was achieved while simultaneously reducing power consumption by 10% compared to the conditions that solely maximize active substance content. This demonstrates the successful application of the multi-objective optimization approach in balancing product yield and energy efficiency.
This study successfully demonstrated a novel continuous-flow process for AOS synthesis in a microreactor. By integrating response surface methodology, a multi-objective optimization algorithm (improved dual-population NSGA-II), and an entropy-weighted TOPSIS decision-making method, optimal operating conditions were identified that balance high active substance content with minimized power consumption. This work provides a strong theoretical and experimental foundation for the development of more efficient, economical, and environmentally friendly AOS microreactor synthesis technologies. Furthermore, it highlights the significant potential of combining process intensification with intelligent optimization algorithms for addressing complex chemical process optimization challenges.

Author Contributions

Y.L. contributed to experimental design, execution, the majority of the single-factor and response surface analyses, and drafted the manuscript. Y.M. participated in experimental execution and single-factor analysis. M.Q. contributed the multi-objective optimization algorithm and assisted with manuscript preparation. W.Z. (Wei Zhang) provided guidance on the research methodology, conceived the research idea, supervised the experiments, and secured funding. W.Z. (Wenjin Zhou) assisted with manuscript preparation. All authors have read and agreed to the published version of the manuscript.

Funding

This research was supported by the project of the National Natural Science Foundation of China (No. 22178241). Name of funder: National Natural Science Foundation of China.

Data Availability Statement

The original contributions presented in this study are included in the article. Further inquiries can be directed to the corresponding author.

Acknowledgments

All authors of this manuscript gratefully acknowledge the financial support from the project of the National Natural Science Foundation of China (No. 22178241).

Conflicts of Interest

The authors declare no conflicts of interest.

References

  1. Lin, J.; Chang, W. Evaluation of Foaming Chemical Composition and Performance of Commonly Used Detergents. Acad. J. Sci. Technol. 2023, 7, 243–247. [Google Scholar] [CrossRef]
  2. Farajzadeh, R.; Krastev, R.; Zitha, P.L.J. Foam Films Stabilized with Alpha Olefin Sulfonate (AOS). Colloids Surf. Physicochem. Eng. Asp. 2008, 324, 35–40. [Google Scholar] [CrossRef]
  3. Chakraborty, D.; Chukwuka, A.V.; Podder, S.; Sharma, P.; Bhowmick, S.; Mistri, T.K.; Saha, N.C. Effects of α-Olefin Sulfonate (AOS) on Tubifex Tubifex: Toxicodynamic-Toxicokinetic Inferences from the General Unified Threshold (GUTS) Model, Biomarker Responses and Molecular Docking Predictions. Ecotoxicology 2024, 33, 905–920. [Google Scholar] [CrossRef]
  4. Hu, J.; Fu, M.; Zhou, Y.; Wu, F.; Li, M. Experimental Study on SiO2 Nanoparticles-Assisted Alpha-Olefin Sulfonate Sodium (AOS) and Hydrolyzed Polyacrylamide (HPAM) Synergistically Enhanced Oil Recovery. Energies 2023, 16, 7523. [Google Scholar] [CrossRef]
  5. Verma, A.; Chauhan, G.; Ojha, K. Characterization of α-Olefin Sulfonate Foam in Presence of Cosurfactants: Stability, Foamability and Drainage Kinetic Study. J. Mol. Liq. 2018, 264, 458–469. [Google Scholar] [CrossRef]
  6. Yorke, K.; Potanin, A.; Jogun, S.; Morgan, A.; Shen, H.; Amin, S. High-Performance Sulphate-Free Cleansers: Surface Activity, Foaming and Rheology. Int. J. Cosmet. Sci. 2021, 43, 636–652. [Google Scholar] [CrossRef]
  7. Berger, P.D.; Lee, C.H. New Anionic Alkylaryl Surfactants Based on Olefin Sulfonic Acids. J. Surfactants Deterg. 2002, 5, 39–43. [Google Scholar] [CrossRef]
  8. Geng, Y.; Ling, S.; Huang, J.; Xu, J. Multiphase Microfluidics: Fundamentals, Fabrication, and Functions. Small 2020, 16, 1906357. [Google Scholar] [CrossRef]
  9. Chen, Z.; Liu, J.; Ni, L.; Jiang, J.; Yu, Y.; Pan, Y. Continuous-Flow Synthesis of Methyl Sulfone with Microchannel Reactors: A Safer and Efficient Production Strategy. Org. Process Res. Dev. 2023, 27, 1445–1454. [Google Scholar] [CrossRef]
  10. Chruściel, A.; Hreczuch, W. Kinetic Modelling and Improvement of the Ageing Step of Industrial Alkylbenzene Sulfonation Process. Chem. Eng. Process.-Process Intensif. 2022, 181, 109143. [Google Scholar] [CrossRef]
  11. Liu, L.; Liang, J.; Jiang, J.; Ni, L. Investigating the Inherent Safety Designs of Typical Exothermic Reaction Processes. J. Loss Prev. Process Ind. 2022, 76, 104586. [Google Scholar] [CrossRef]
  12. Wang, Y.-Y.; Zhang, D.-F.; Zhang, H.-R.; Liu, W.-J.; Chen, Z.-Q.; Jiang, J.-C.; Ni, L. Process Optimization and Thermal Hazard Study for the Preparation of TBPB by a Two–Step Reaction. Sustainability 2024, 16, 8568. [Google Scholar] [CrossRef]
  13. Ovchinnikova, E.V.; Vernikovskaya, N.V.; Gribovskii, A.G.; Chumachenko, V.A. Multichannel Microreactors for Highly Exothermic Catalytic Process: The Influence of Thermal Conductivity of Reactor Material and of Transport Phenomena inside the Channels on the Process Efficiency. Chem. Eng. J. 2021, 409, 128046. [Google Scholar] [CrossRef]
  14. Engelbrecht, N.; Everson, R.C.; Bessarabov, D.; Kolb, G. Microchannel Reactor Heat-Exchangers: A Review of Design Strategies for the Effective Thermal Coupling of Gas Phase Reactions. Chem. Eng. Process.-Process Intensif. 2020, 157, 108164. [Google Scholar] [CrossRef]
  15. Fuentes, I.; Mmbaga, J.P.; Hayes, R.E.; Gracia, F. Potential of Microreactors for Heat Transfer Efficient CO2 Methanation. Chem. Eng. Sci. 2023, 280, 119047. [Google Scholar] [CrossRef]
  16. Widianto, A.Y.; Lorenza, V.; Clarisa, C.; Valentino, R.; Elfa, C.; Sapei, L. Mass Transfer Phenomena of Partially Miscible Liquids under Liquid-Liquid Slug Flow in a Circular Microchannel. Chem. Eng. Res. Des. 2024, 205, 57–66. [Google Scholar] [CrossRef]
  17. Xue, X.; Xie, C.; Qian, G.; Qiu, M.; Jiang, R.; Pasha, M.; Shang, M.; Su, Y. Control over Selectivity for Demethylation in Dolutegravir Synthesis in Microreactors: Kinetics and Mechanisms. Chem. Eng. Sci. 2024, 284, 119453. [Google Scholar] [CrossRef]
  18. Zhan, W.; Wang, J.; He, C.; Jiang, B.; Zhu, C.; Ma, Y.; Fu, T. Kinetics of Glyoxal Oxidation by Nitric Acid in a Capillary Microreactor. Chem. Eng. Sci. 2023, 276, 118813. [Google Scholar] [CrossRef]
  19. Xu, Y.; Liu, S.; Meng, W.; Yuan, H.; Ma, W.; Sun, X.; Xu, J.; Tan, B.; Li, P. Continuous Sulfonation of Hexadecylbenzene in a Microreactor. Green Process. Synth. 2021, 10, 219–229. [Google Scholar] [CrossRef]
  20. Geng, Y.; Huang, J.; Tan, B.; Xu, Y.; Li, P.; Xu, J. Efficient Synthesis of Dodecylbenzene Sulfonic Acid in Microreaction Systems. Chem. Eng. Process.-Process Intensif. 2020, 149, 107858. [Google Scholar] [CrossRef]
  21. Yuan, M.; Feng, H.; Zhang, W.; Zheng, J.; Zhang, K.; Kong, X.; Han, N.; Dong, J. Gas-Liquid Sulfonation in T-Shaped Microchannel for DBSA Synthesis and Process Optimization with Response Surface Method. Chem. Eng. Process.-Process Intensif. 2022, 174, 108890. [Google Scholar] [CrossRef]
  22. Xu, N.; Yu, J.; Zhang, L.; Ma, X.; Zhang, Z.; Zhang, W.; Zhang, Y.; Fang, J. Study on Gas–Liquid Sulfonation Reaction under Annular Flow Pattern in Micro-Reactor: Mechanism, Model and Process Optimization. Chem. Eng. J. 2024, 498, 155611. [Google Scholar] [CrossRef]
  23. Ma, H.; Li, P.; Huang, A.; Zhao, W.; Zhang, X. The Kinetics Study on Sulfonation Reaction of Continuous Microfluidic Synthesis of 1-Tetradecene. Chem. Eng. Sci. 2024, 290, 119883. [Google Scholar] [CrossRef]
  24. Xu, Y.; Li, P.; Ma, H.; Huang, A.; Zhao, W.; Zhao, X. Multistep Cascade Continuous Flow Synthesis of AOS Based on Microreactor. Chem. Eng. Process.-Process Intensif. 2023, 192, 109505. [Google Scholar] [CrossRef]
  25. Huang, W.; Xiang, D. Optimal Design Framework and Techno-Economic-Environmental Assessment for Efficient Solvent Recovery Separation of Ethyl Acetate and Methanol. Sep. Purif. Technol. 2021, 260, 118210. [Google Scholar] [CrossRef]
  26. Qin, Y.; Huang, W.; Wang, Z.; Wang, C.; Wang, C.; Zhang, M.; Wu, S.; Wang, G.; Zhao, F. 1,2-Dichloroethane Causes Anxiety and Cognitive Dysfunction in Mice by Disturbing GABA Metabolism and Inhibiting the cAMP-PKA-CREB Signaling Pathway. Ecotoxicol. Environ. Saf. 2024, 279, 116464. [Google Scholar] [CrossRef]
  27. Yao, C.; Zhao, Y.; Ma, H.; Liu, Y.; Zhao, Q.; Chen, G. Two-Phase Flow and Mass Transfer in Microchannels: A Review from Local Mechanism to Global Models. Chem. Eng. Sci. 2021, 229, 116017. [Google Scholar] [CrossRef]
  28. Sobieszuk, P.; Pohorecki, R.; Cygański, P.; Grzelka, J. Determination of the Interfacial Area and Mass Transfer Coefficients in the Taylor Gas–Liquid Flow in a Microchannel. Chem. Eng. Sci. 2011, 66, 6048–6056. [Google Scholar] [CrossRef]
  29. Shrouf, F.; Ordieres-Meré, J.; García-Sánchez, A.; Ortega-Mier, M. Optimizing the Production Scheduling of a Single Machine to Minimize Total Energy Consumption Costs. J. Clean. Prod. 2014, 67, 197–207. [Google Scholar] [CrossRef]
  30. Asghar, I.; Sarkar, B.; Kim, S. Economic Analysis of an Integrated Production–Inventory System under Stochastic Production Capacity and Energy Consumption. Energies 2019, 12, 3179. [Google Scholar] [CrossRef]
  31. Khan, A.M.; Liang, L.; Mia, M.; Gupta, M.K.; Wei, Z.; Jamil, M.; Ning, H. Development of Process Performance Simulator (PPS) and Parametric Optimization for Sustainable Machining Considering Carbon Emission, Cost and Energy Aspects. Renew. Sustain. Energy Rev. 2021, 139, 110738. [Google Scholar] [CrossRef]
  32. Cui, Y.; Geng, Z.; Zhu, Q.; Han, Y. Review: Multi-Objective Optimization Methods and Application in Energy Saving. Energy 2017, 125, 681–704. [Google Scholar] [CrossRef]
  33. Sharma, S.; Kumar, V. A Comprehensive Review on Multi-Objective Optimization Techniques: Past, Present and Future. Arch. Comput. Methods Eng. 2022, 29, 5605–5633. [Google Scholar] [CrossRef]
  34. Alexandrova, A.A.; Koledin, S.N. Optimal Temperature Calculation for Multicriteria Optimization of the Hydrogenation of Polycyclic Aromatic Hydrocarbons by NSGA-II Method. Adv. Eng. Res. Rostov-Don 2024, 24, 109–118. [Google Scholar] [CrossRef]
  35. Verhellen, J. Graph-Based Molecular Pareto Optimisation. Chem. Sci. 2022, 13, 7526–7535. [Google Scholar] [CrossRef]
  36. Deb, K.; Agrawal, S.; Pratap, A.; Meyarivan, T. A Fast Elitist Non-Dominated Sorting Genetic Algorithm for Multi-Objective Optimization: NSGA-II. In Parallel Problem Solving from Nature PPSN VI; Lecture Notes in Computer Science; Schoenauer, M., Deb, K., Rudolph, G., Yao, X., Lutton, E., Merelo, J.J., Schwefel, H.-P., Eds.; Springer: Berlin/Heidelberg, Germany, 2000; Volume 1917, pp. 849–858. ISBN 978-3-540-41056-0. [Google Scholar]
  37. Zheng, W.; Doerr, B. Mathematical Runtime Analysis for the Non-Dominated Sorting Genetic Algorithm II (NSGA-II). Artif. Intell. 2023, 325, 104016. [Google Scholar] [CrossRef]
  38. Senthil Kannan, V.; Lenin, K.; Navneethakrishnan, P. Machining Parameters Optimization in Laser Beam Machining for Micro Elliptical Profiles Using TOPSIS Method. Mater. Today Proc. 2020, 21, 727–730. [Google Scholar] [CrossRef]
Figure 1. AOS synthesis mechanism.
Micromachines 16 00638 g001
Figure 2. Gas-liquid microsulfonation reaction system.
Micromachines 16 00638 g002
Figure 3. Cross-shaped microchannel chip.
Micromachines 16 00638 g003
Figure 4. Gas-liquid annular flow in microchannel.
Micromachines 16 00638 g004
Figure 5. Effect of various factors on the activity content: (a) effect of gas phase flow rate; (b) effect of reaction temperature; (c) effect of SO3/AO molar ratio; (d) effect of SO3 volume fraction.
Micromachines 16 00638 g005
Figure 6. Distribution of predicted and actual values.
Micromachines 16 00638 g006
Figure 7. Normal probability distribution of residuals.
Micromachines 16 00638 g007
Figure 8. The response surface plots illustrating the interactive effects of the process parameters on AOS synthesis in the microchannel reactor: (a) gas flow rate and temperature; (b) gas flow rate and SO3/AO molar ratio; (c) gas flow rate and SO3 volume fraction; (d) temperature and SO3/AO molar ratio; (e) temperature and SO3 volume fraction; and (f) SO3 volume fraction and SO3/AO molar ratio.
Micromachines 16 00638 g008
Figure 9. Flowchart of the improved NSGA-II algorithm.
Micromachines 16 00638 g009
Figure 10. Pareto solution set for power consumption and active substance content.
Micromachines 16 00638 g010
Table 1. HPLC analytical conditions.
Chromatographic ConditionsParameters
columnC18 column (250 × 4.6 × 5 μm)
mobile phasemethanol
detectordifferential refractive index detector
flow rate (mL/min)1
column temperature (°C)40
feed volume (μL)15
Table 2. Single-factor experimental variables and ranges.
VariablesUnitsRanges
gas-phase flow ratemL/min100, 200, 300, 400, 500
reaction temperature°C30, 40, 50, 60, 70
SO3/α-olefin molar ratio1.0, 1.1, 1.2, 1.3, 1.4
SO3 volume fraction%4, 6, 8, 10, 12
Table 3. Ranges of experimental and coded values used in BDD design.
VariablesUnitsLevel
−101
gas-phase flow ratemL/min200300400
reaction temperature°C405060
SO3/AO molar ratio1.11.21.3
SO3 volume fraction%468
Table 4. Response surface experimental data.
No.FactorsResponse Value Y (%)
ABCDExperimental ValuePredicted Value
1−1−10067.6168.11
21−10058.457.57
3−110071.2371.61
4110063.2762.32
500−1−171.8472.45
6001−180.980.79
700−1168.1367.79
8001168.8367.77
9−100−182.9381.12
10100−166.5766.46
11−100167.6467.53
12100160.7962.37
130−1−1064.464.59
1401−1068.2366.71
150−11065.4566.75
16011073.2972.88
17−10−1067.5768.29
1810−1060.1360.48
19−101074.2274.55
20101062.5862.54
210−10−173.2673.06
22010−177.4377.06
230−10165.0464.09
24010167.4668.34
25000079.0180.39
26000081.1380.39
27000080.7780.39
28000079.9480.39
29000081.1280.39
Table 5. Analysis of variance for response surface quadratic modeling.
SourceSquare SumDegrees of FreedomMean SquareF-Valuep-ValueSignificance
model1408.1614100.5863.9<0.0001significant
A294.621294.62187.19<0.0001significant
B51.05151.0532.43<0.0001significant
C51.96151.9633.01<0.0001significant
D234.441234.44148.95<0.0001significant
AB0.390610.39060.24820.6261
AC4.4114.412.80.1163
AD22.61122.6114.370.002significant
BC4.0214.022.550.1323
BD0.015610.01560.00990.922
CD17.47117.4711.10.0049significant
A2455.461455.46289.37<0.0001significant
B2328.211328.21208.52<0.0001significant
C2199.851199.85126.97<0.0001significant
D245.36145.3628.82<0.0001significant
residual22.04141.57
lost proposal18.7101.872.250.2263insignificant
pure error3.3340.8329
total deviation1430.228
Table 6. Analysis of the credibility of the model.
R2R2adjR2preCV (%)Signal-to-Noise Ratio
0.98820.97630.94151.5729.9645
Table 7. Experimental conditions for response surface model optimization.
Gas-Phase Flow Rate (mL/min)Reaction Temperature (°C)SO3/AO Molar RatioSO3 Volume Fraction (%)Active Substance Content (%)
266521.244.185.14
Table 8. The set of optimal solutions obtained by the decision.
Gas-Phase Flow Rate (mL/min)Reaction
Temperature (°C)
SO3/AO Molar RatioSO3 Volume Fraction (%)Active Substance Content (%)Power
Consumption (kW)
Proximity to the Optimal Level
22852.221.27481.314.3650.898
22751.361.274.180.614.3580.897
22951.241.25481.424.3720.895
22751.261.284.280.664.3520.892
22551.241.26480.734.3520.892
Table 9. Comparison between the dual objective solution and the response surface solution.
Type of ProgramGas-Phase Flow Rate (mL/min)Reaction
Temperature (°C)
SO3/AO Molar RatioSO3 Volume Fraction (%)Active Substance Content (%)Power
Consumption (kW)
MOO22852.221.27481.314.365
RSM266521.244.185.144.893
Disclaimer/Publisher’s Note: The statements, opinions and data contained in all publications are solely those of the individual author(s) and contributor(s) and not of MDPI and/or the editor(s). MDPI and/or the editor(s) disclaim responsibility for any injury to people or property resulting from any ideas, methods, instructions or products referred to in the content.

