
A Multi-Parameter Fusion Method for Cuffless Continuous Blood Pressure Estimation Based on Electrocardiogram and Photoplethysmogram


Abstract
:1. Introduction
- (1)
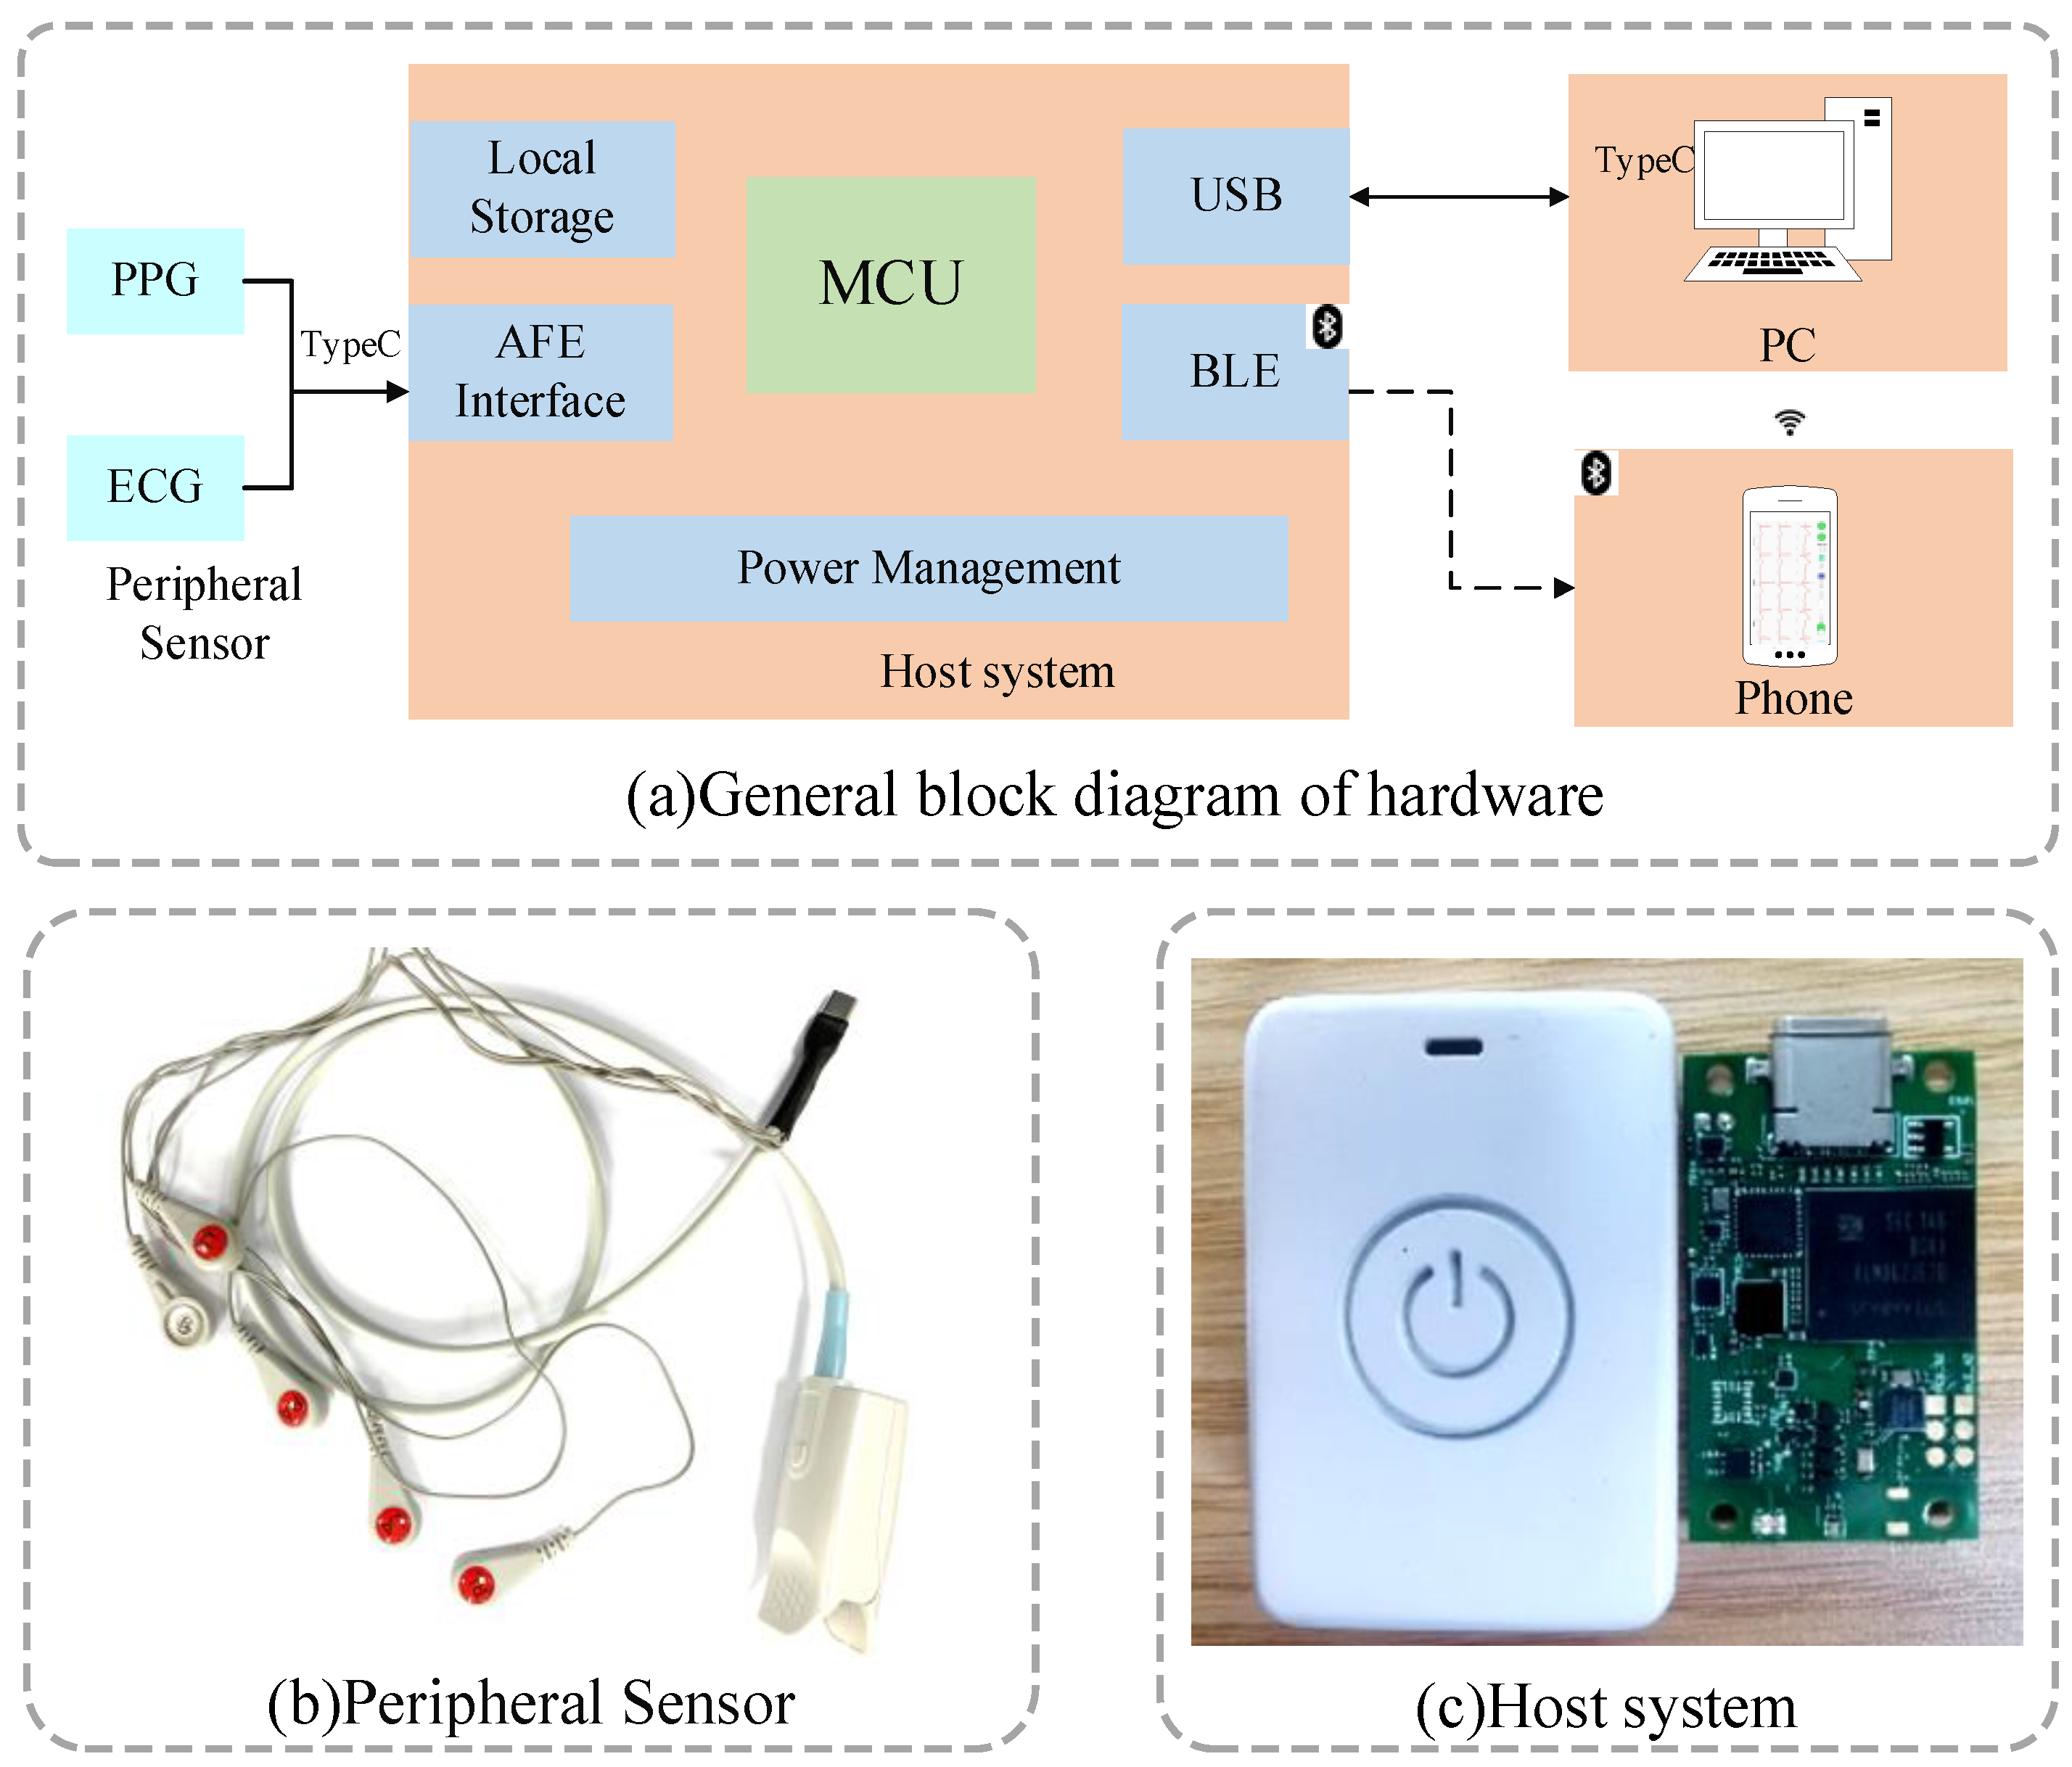
- We used a split design where the acquisition host and sensor were connected via a type-C interface. This not only ensured the quality of the collected signal but also facilitated the replacement of the sensor. The host can either transmit data wirelessly in real time or store data locally as a backup. The whole host size was only 42 mm × 29 mm × 13 mm and caused a little burden on the human body.
- (2)
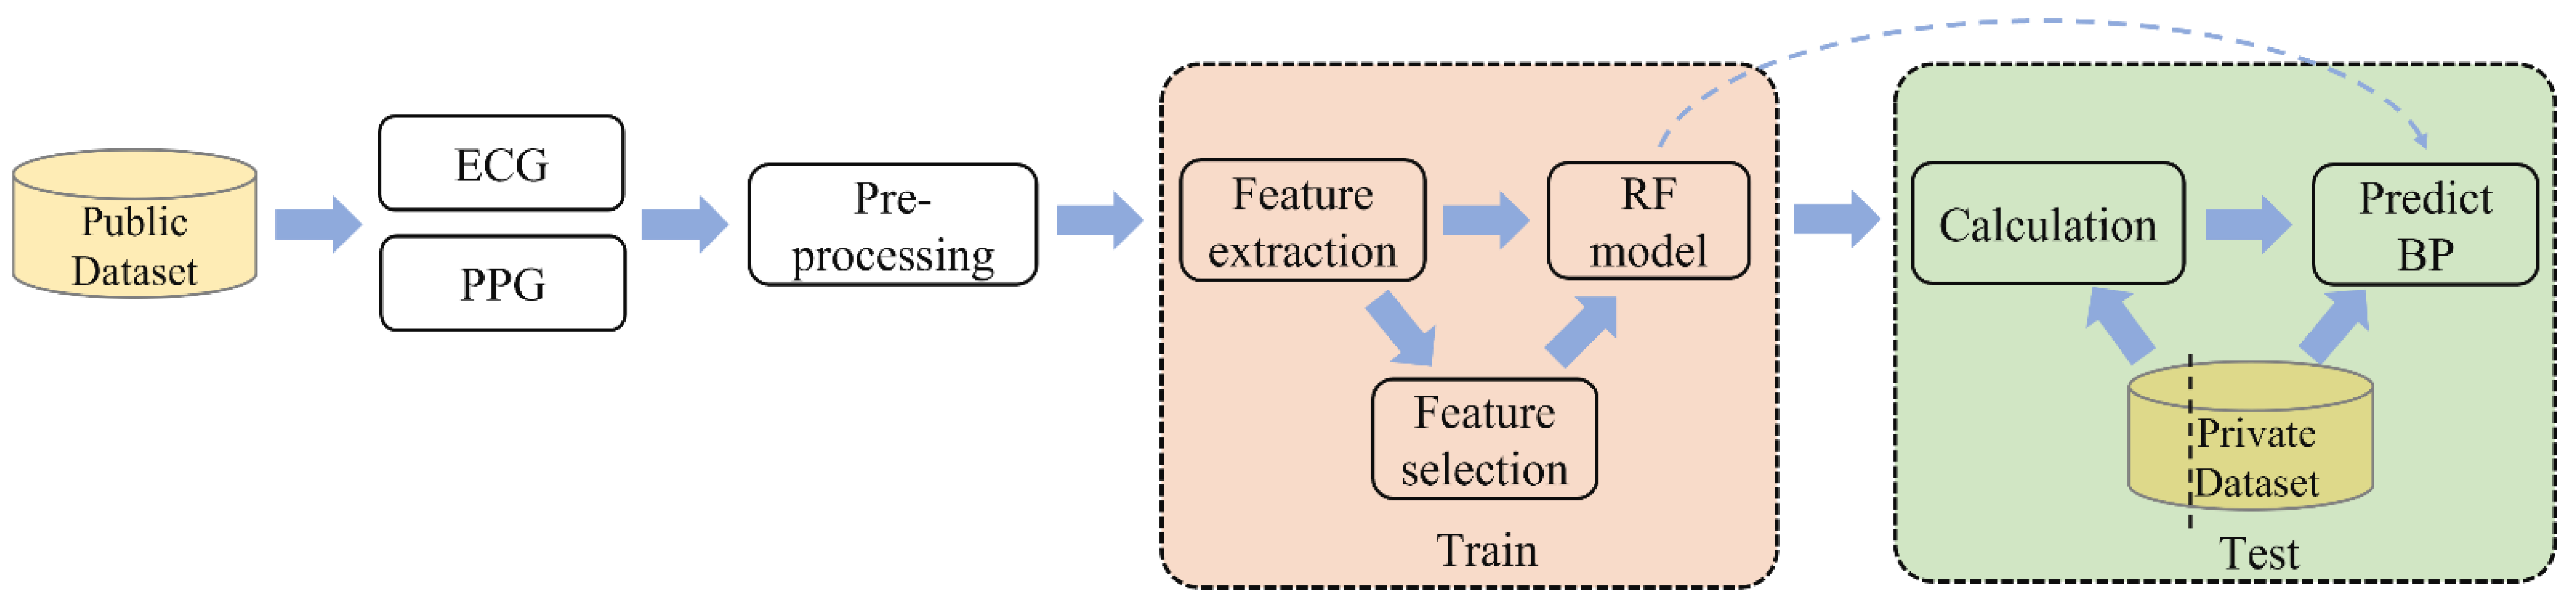
- We constructed a private database by self-collected data. Then, the model was trained on the MIMIC III dataset [30] (accessed on 10 January 2020) and tested on the private dataset, which avoided data leakage. After training, we calibrated the model with a quarter of the records in the testing set.
- (3)
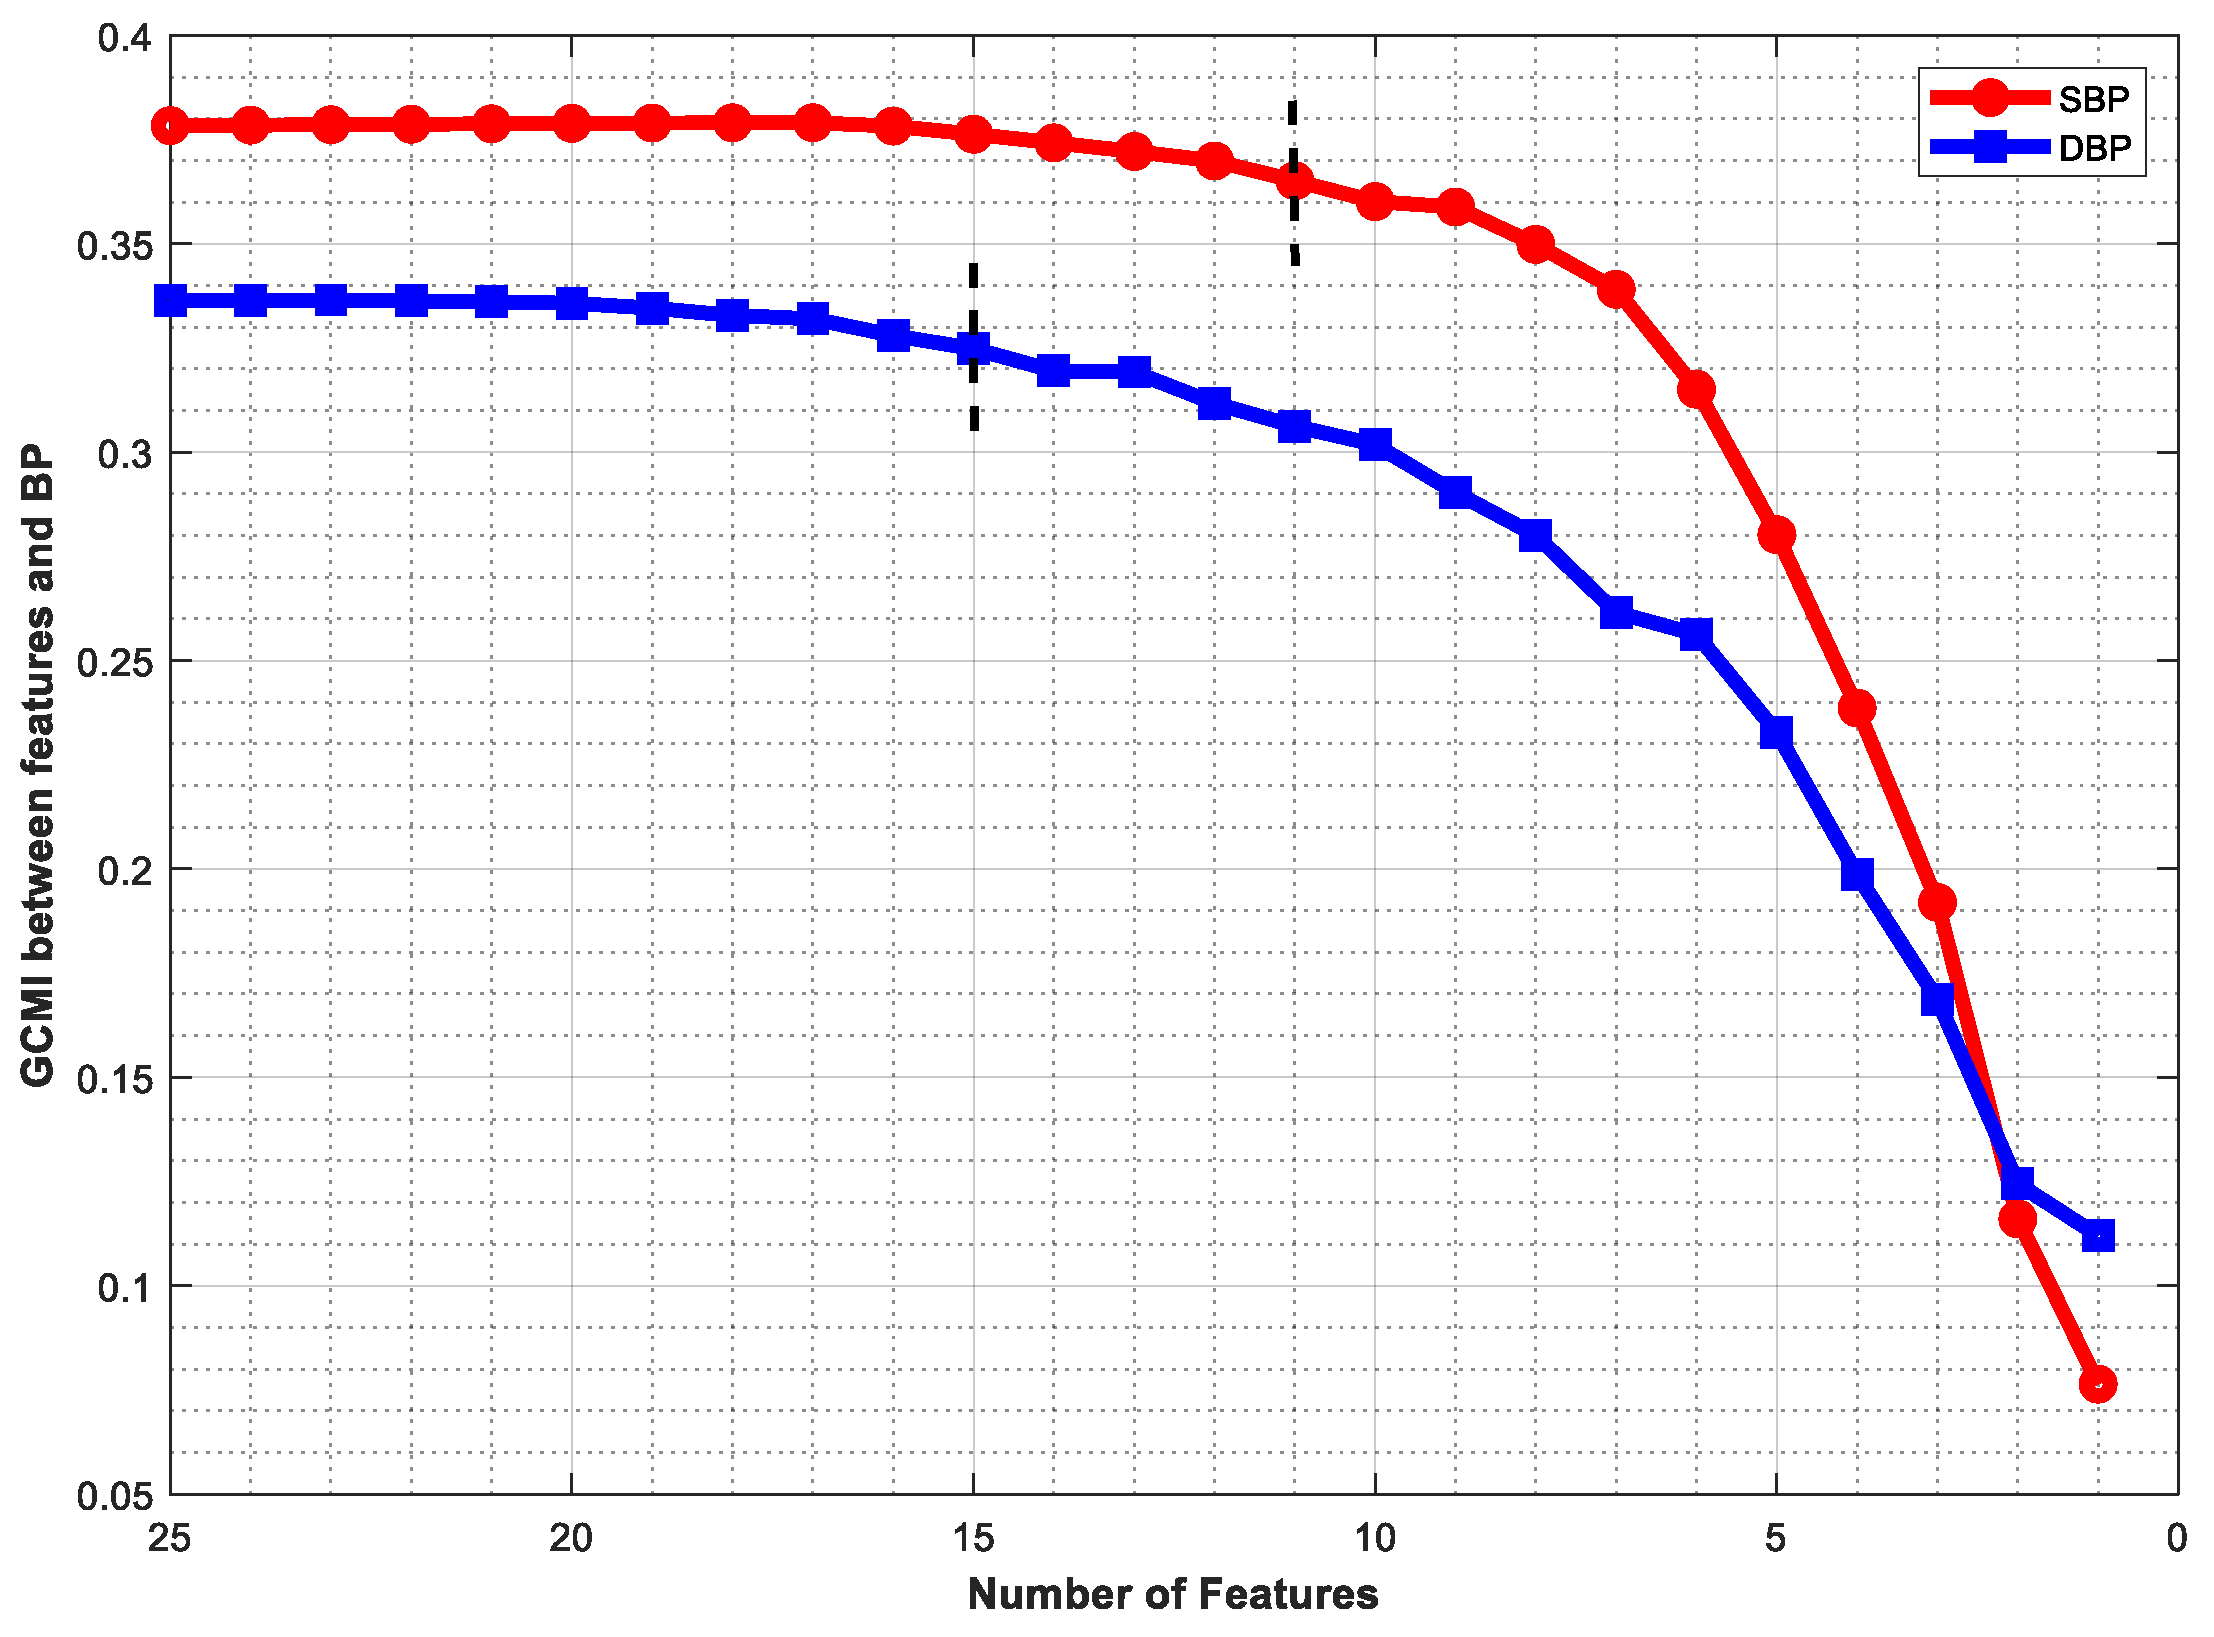
- Gaussian copula MI (GCMI) was used to rank the initial 25 features. Then, 11 and 15 features were retained for SBP and DBP prediction, respectively. The results showed that the optimal feature set improved performance.
2. Data Preparation
2.1. Cuff-Less Continuous BP Measurement System
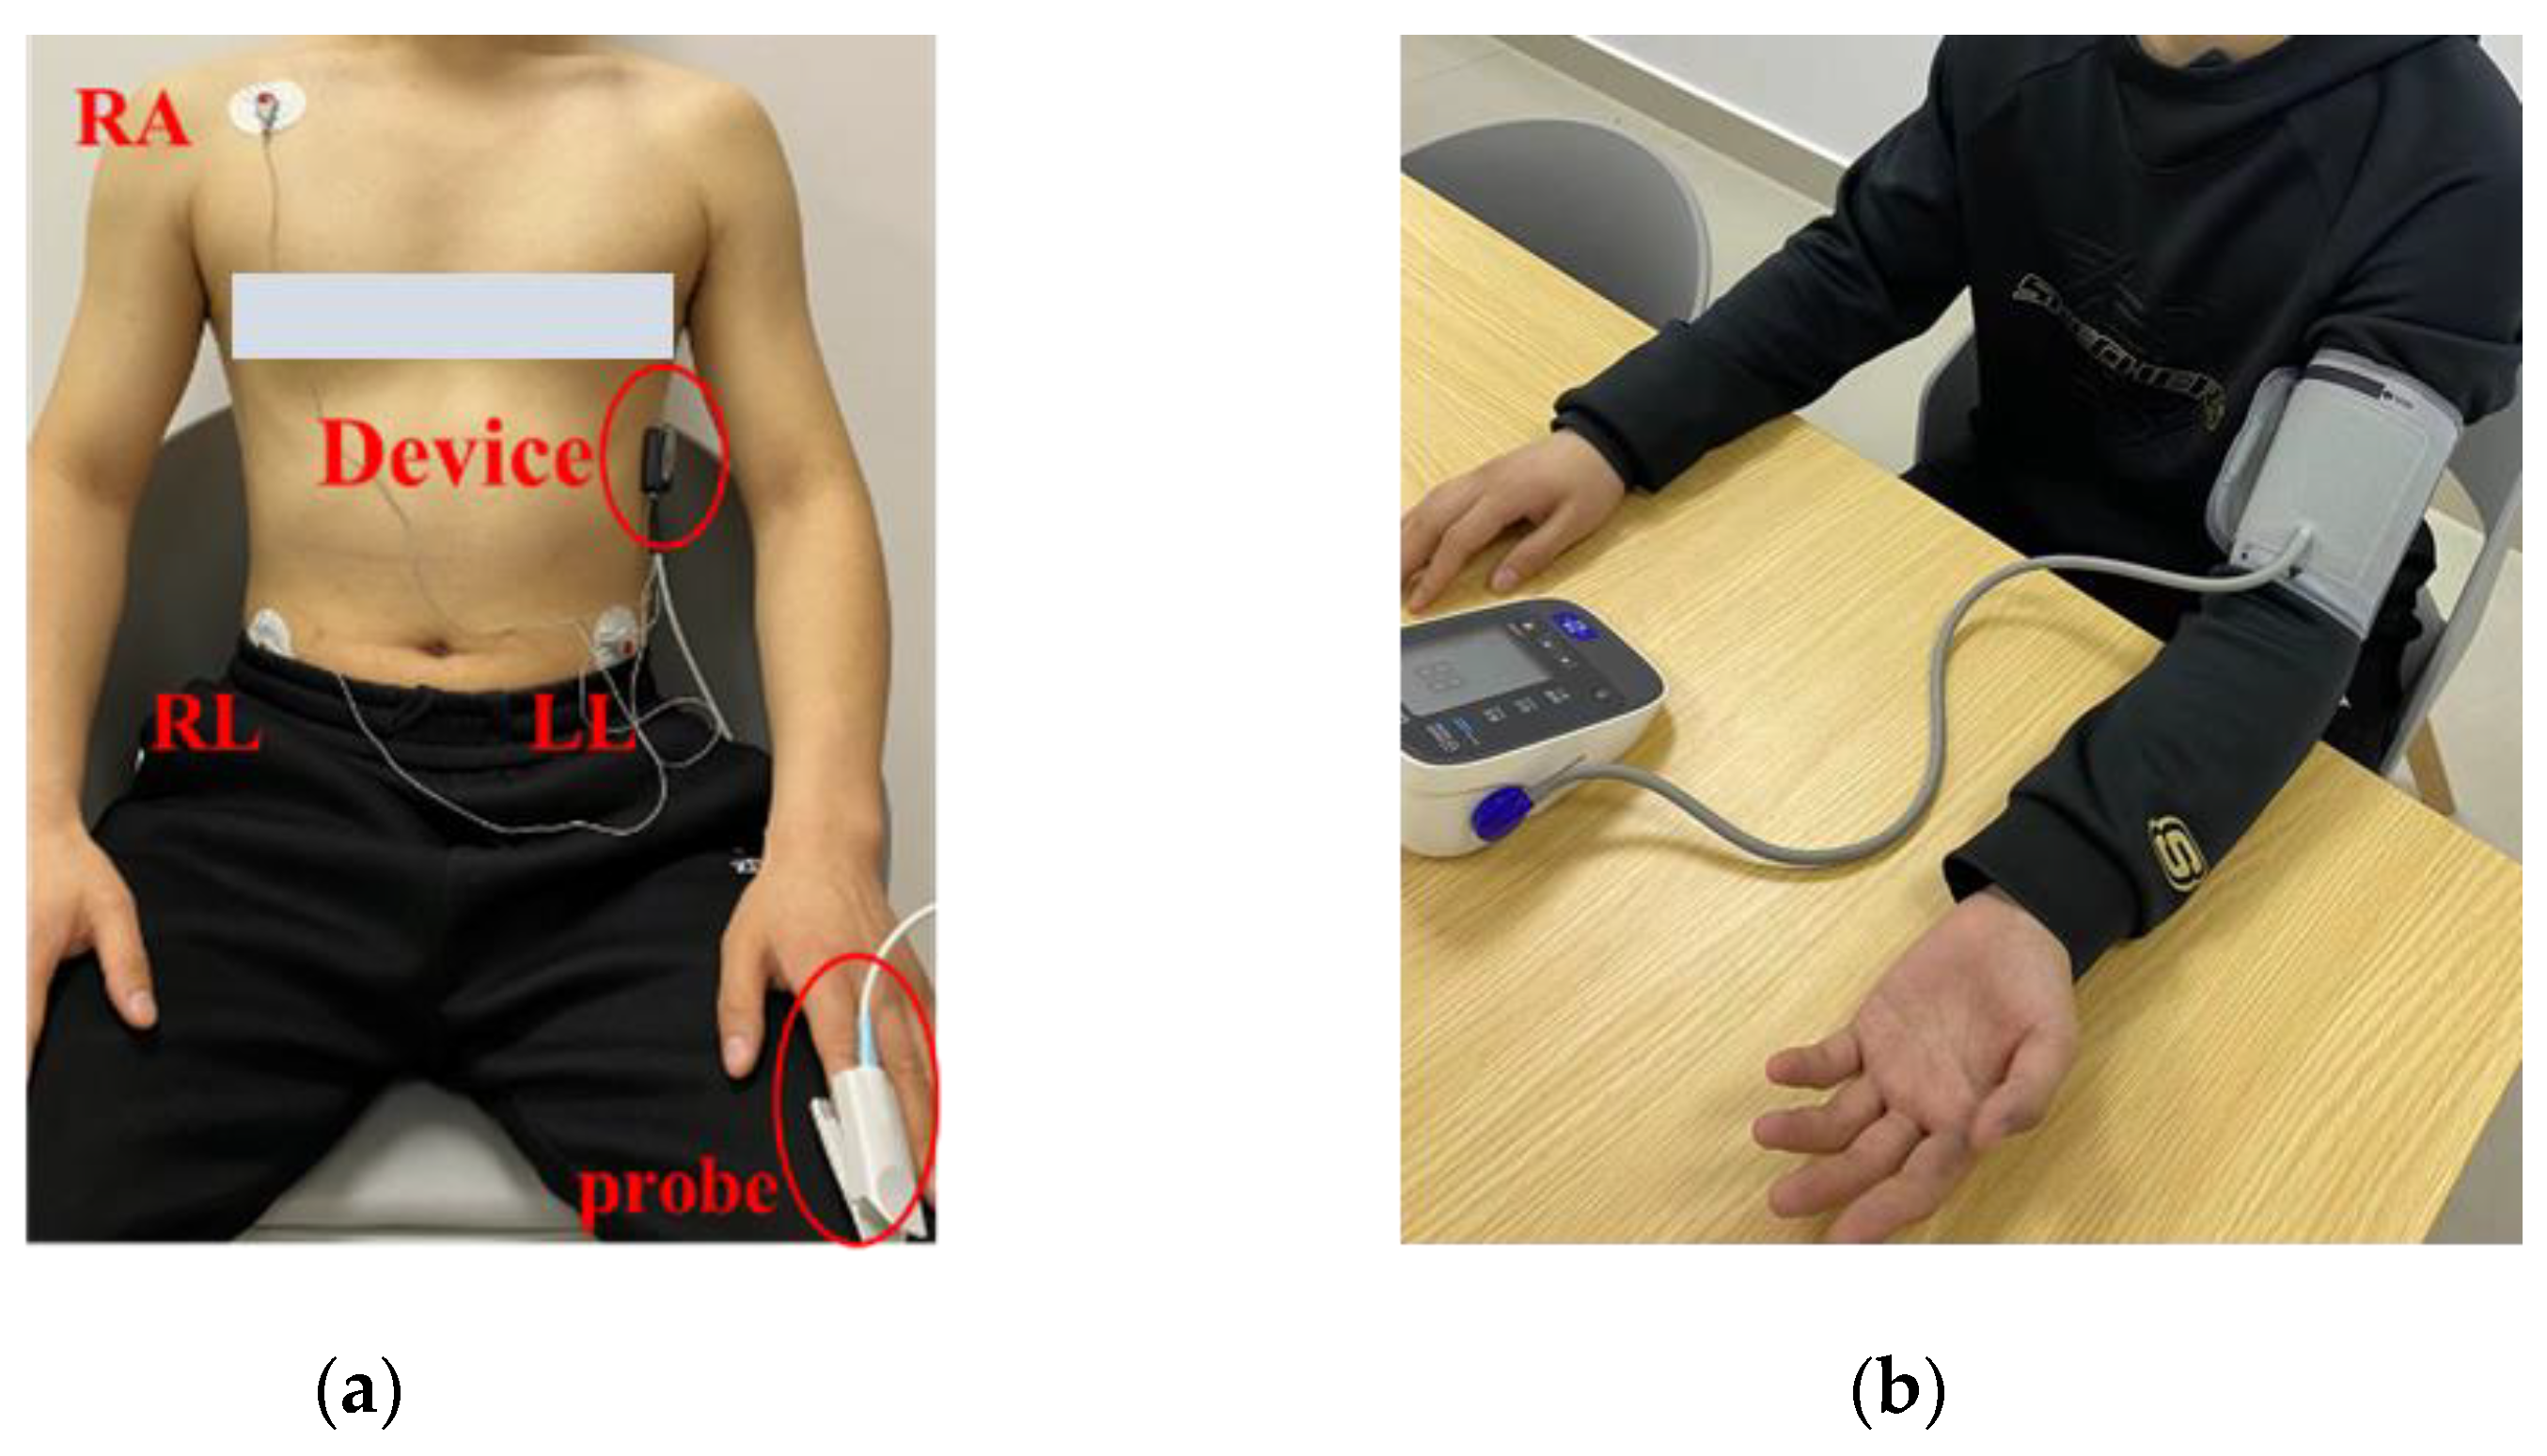
2.2. Data Collection
2.3. MIMIC-III Dataset
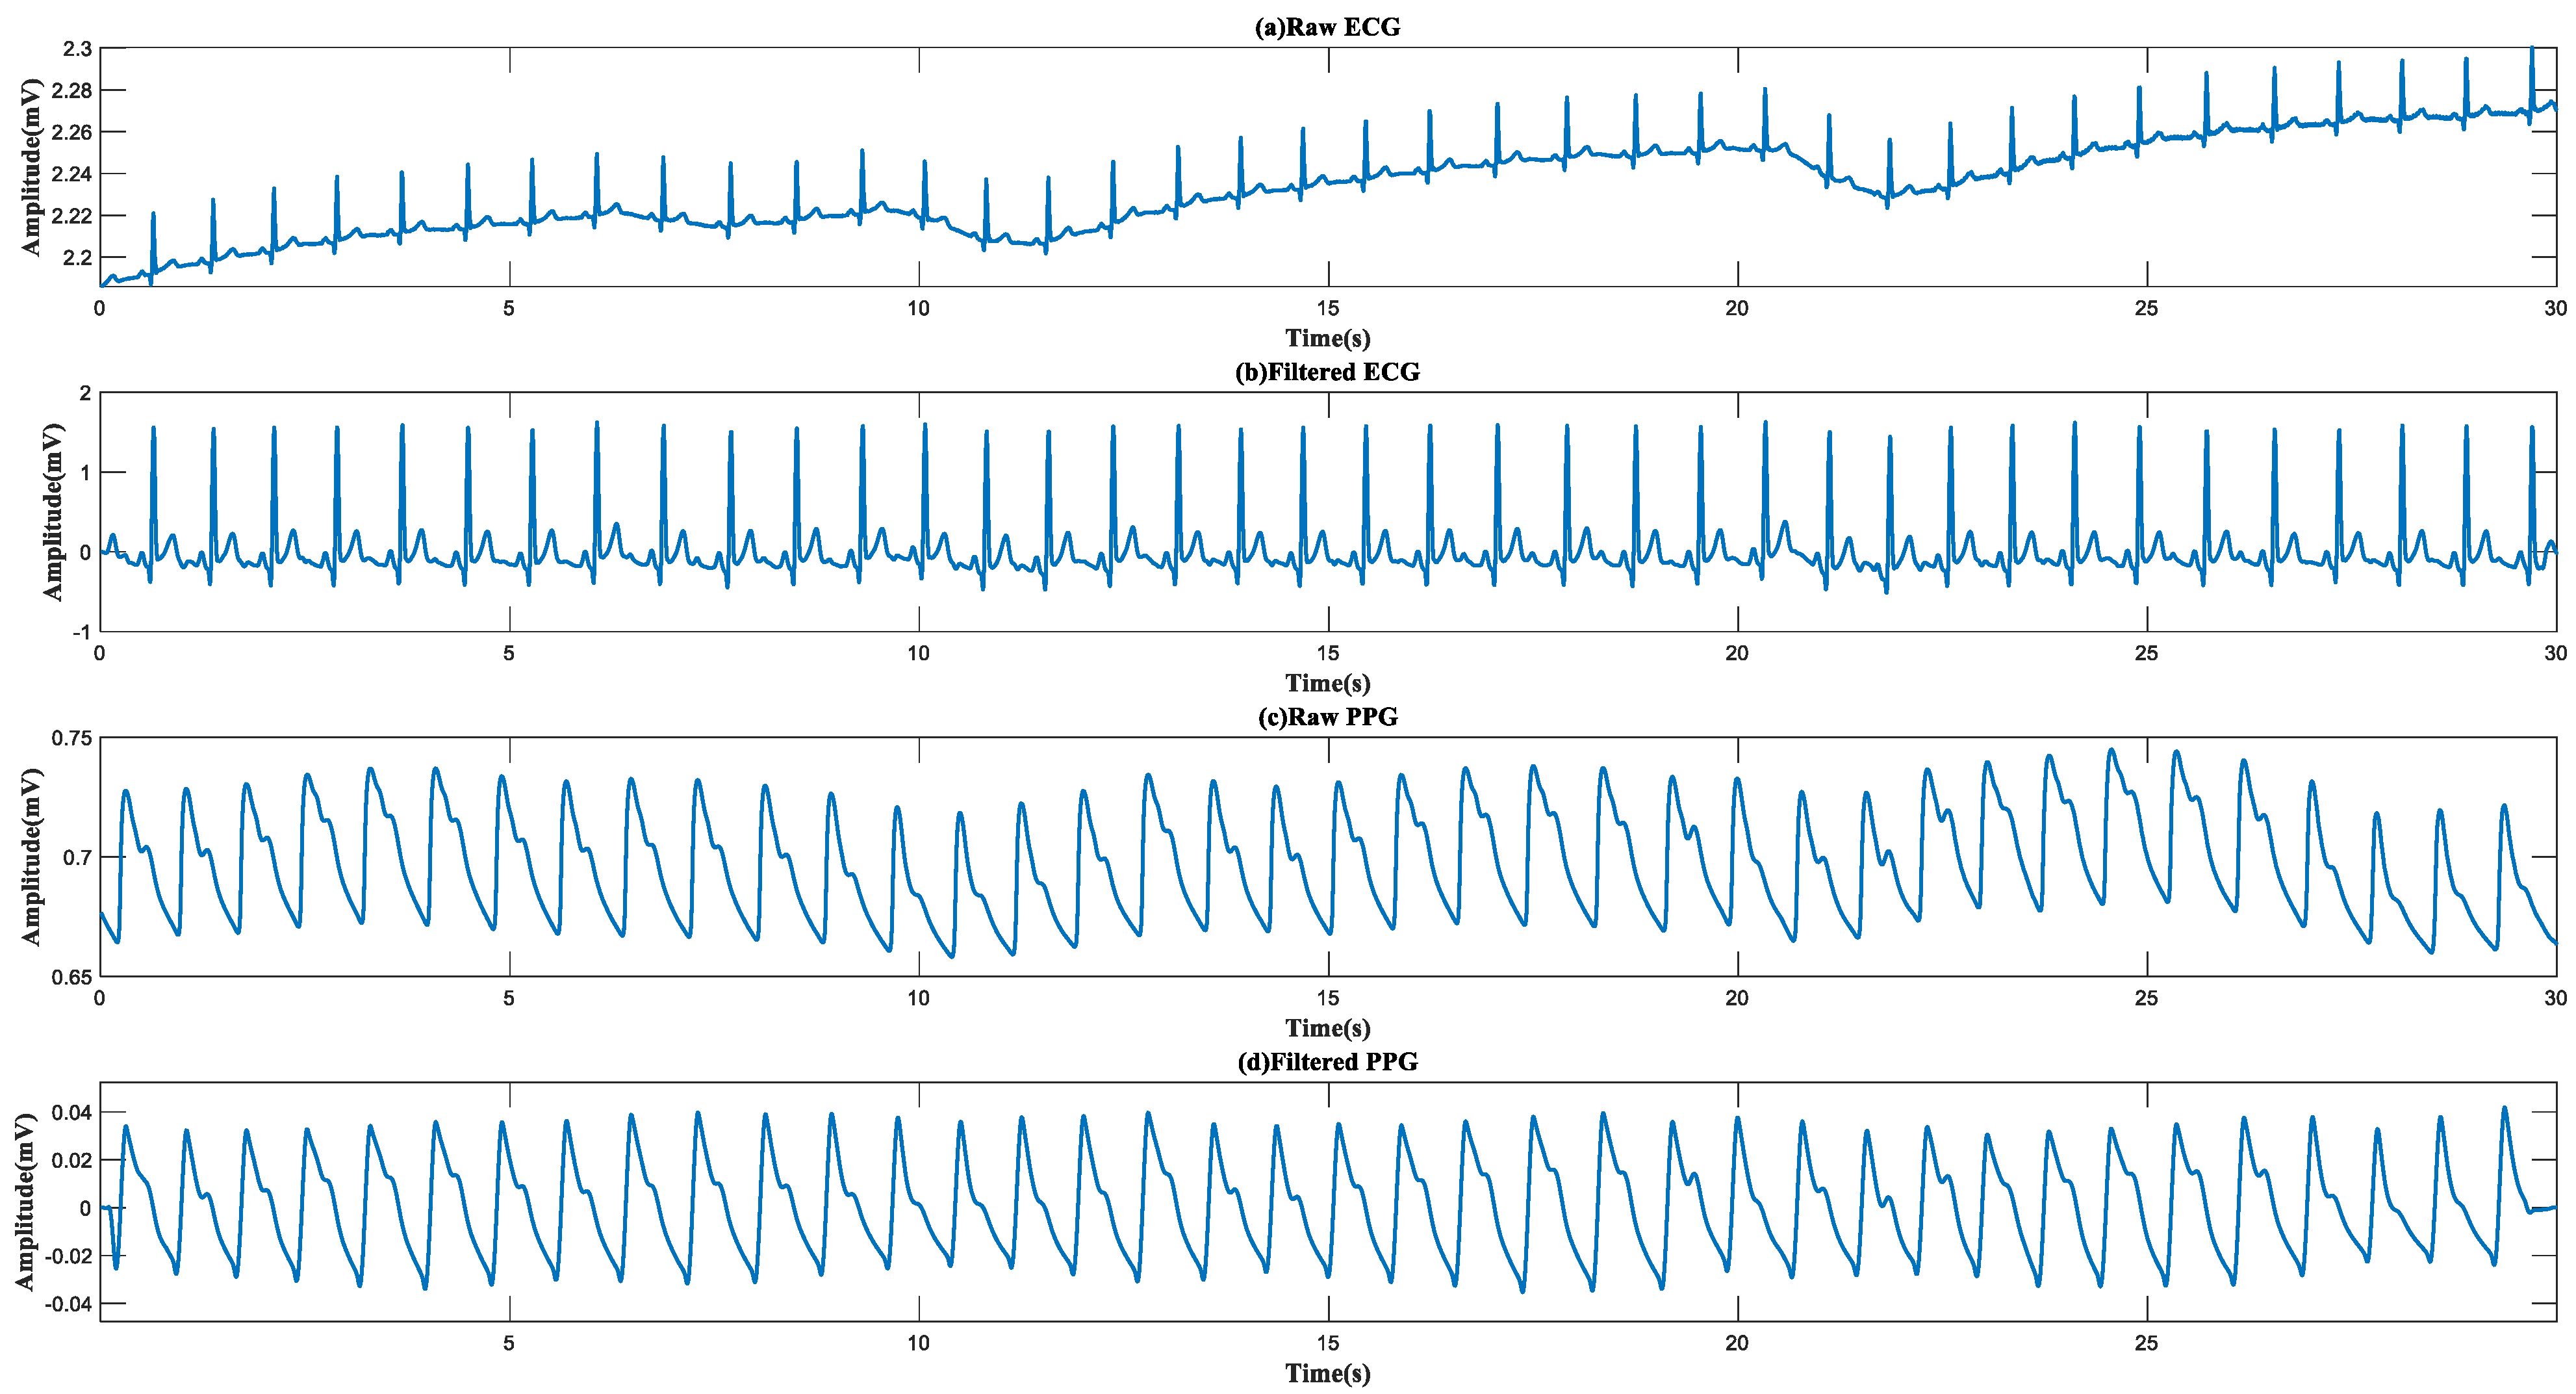
2.4. Preprocessing
3. Proposed Method
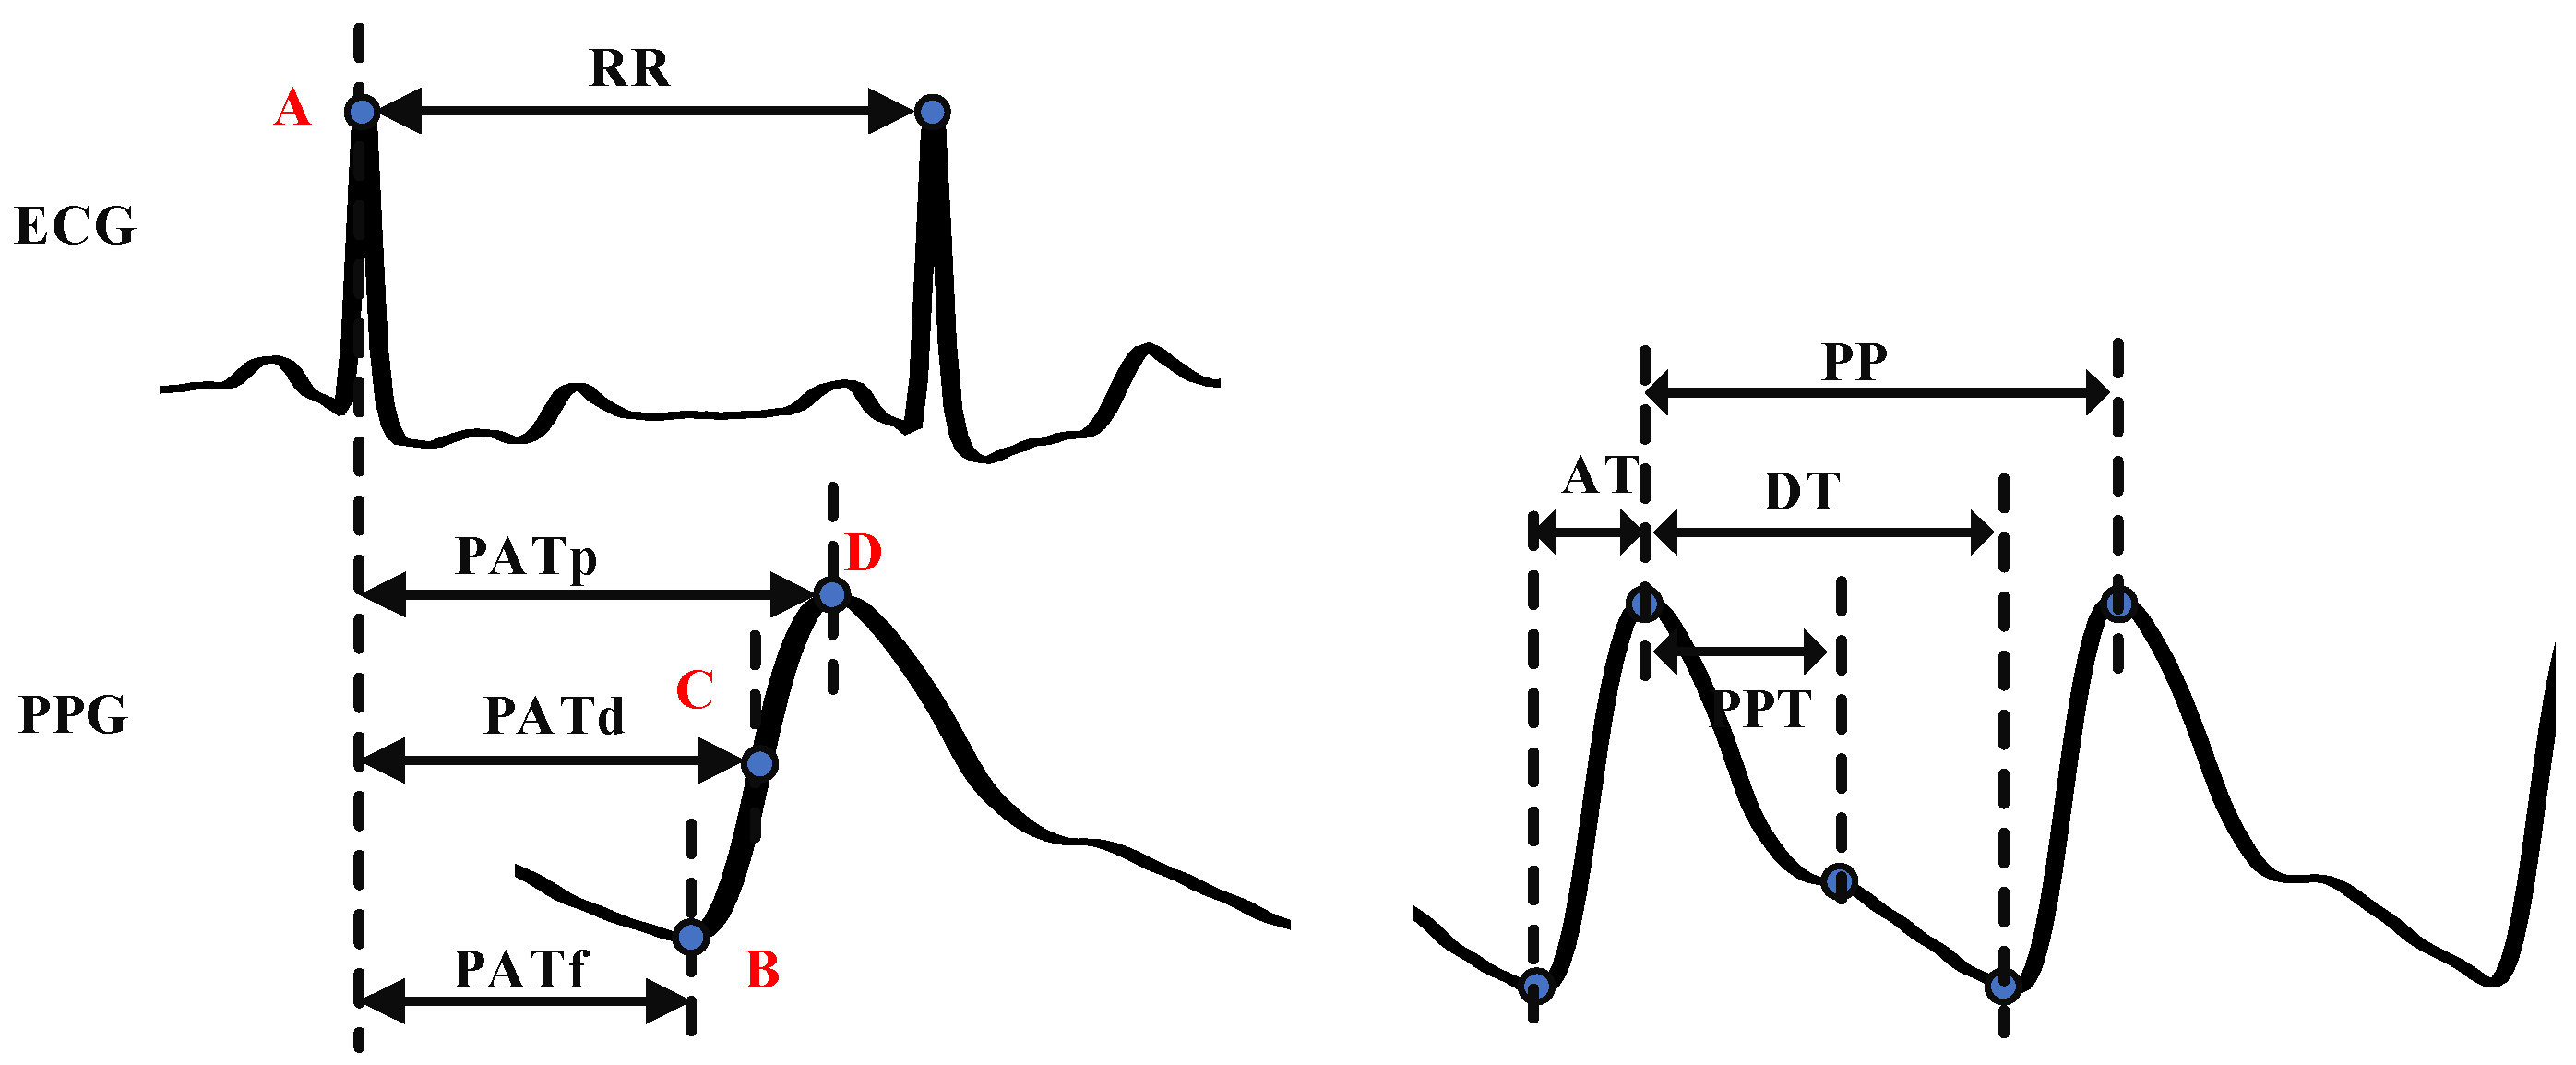
3.1. Feature Extraction
- Individual features
- 2.
- PAT
- 3.
- Other time-related features
- 4.
- Intensity-related features
- 5.
- K value
- 6.
- Other waveform features
3.2. Regression Model
3.3. GCMI
| Algorithm 1. GCMI-based feature selection method. |
| }, the label C |
| Output: Selected features F′ |
| Steps: |
| (1) For i = 1 to n, do |
| (2) |
| (3) end |
| (4) Repeat |
| (5) Calculate I1 = I (F′, C) |
| (6) For i = 1 to n, do |
| (7) , Calculate I2 = I (F2, C) |
| (8) end |
| (9) , then |
| (10) |min(I2) |
| (11) Until I1 − min (I2) > 0.002 |
| (12) Return F′ |
4. Results
4.1. Waveform Display
4.2. Feature Selection
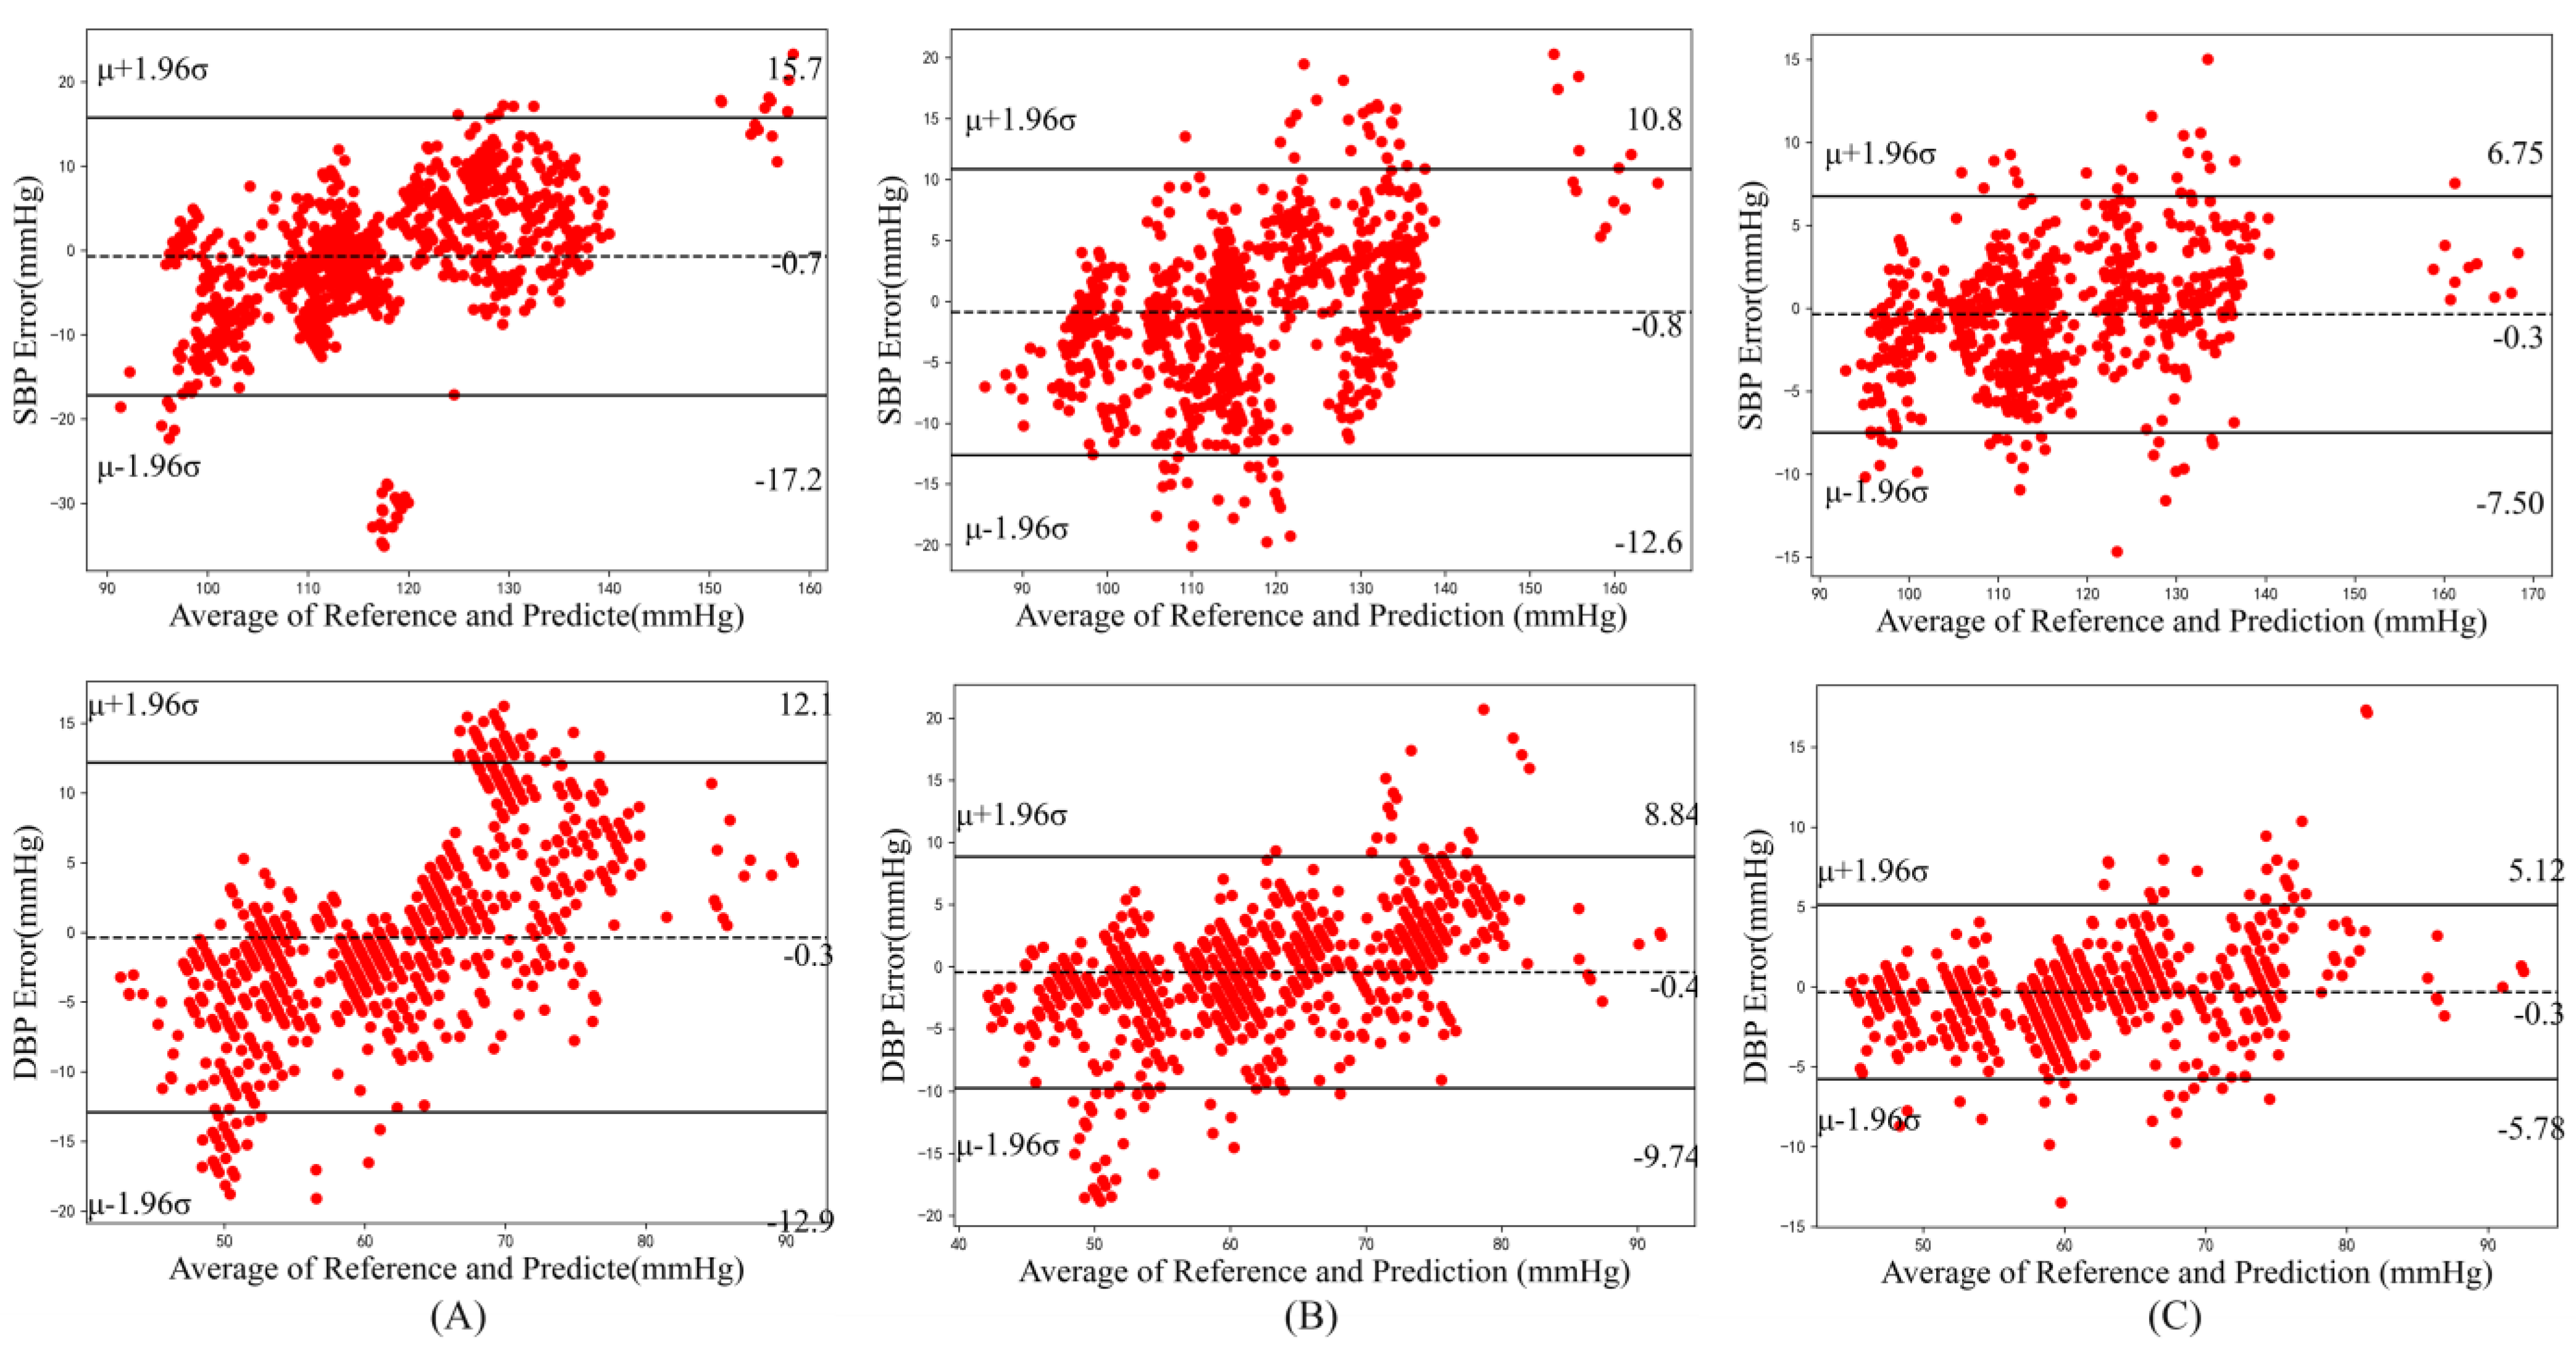
4.3. Model Performance
4.4. Comparison with Related Works
5. Discussion
6. Conclusions
Author Contributions
Funding
Data Availability Statement
Conflicts of Interest
References
- Kannel, W.B. Blood Pressure as a Cardiovascular Risk Factor. JAMA 1996, 275, 1571. [Google Scholar] [CrossRef] [PubMed]
- Macmahon, S.; Peto, R.; Collins, R.; Godwin, J.; Cutler, J.; Sorlie, P.; Abbott, R.; Neaton, J.; Dyer, A.; Stamler, J. Blood pressure, stroke, and coronary heart disease: Part 1, prolonged differences in blood pressure: Prospective observational studies corrected for the regression dilution bias. Lancet 1990, 335, 765–774. [Google Scholar] [CrossRef] [PubMed]
- Group, S.R. A randomized trial of intensive versus standard blood-pressure control. N. Engl. J. Med. 2015, 373, 2103–2116. [Google Scholar] [CrossRef]
- Thomopoulos, C.; Parati, G.; Zanchetti, A. Effects of blood pressure lowering on outcome incidence in hypertension: Effects of more vs. less intensive blood pressure lowering and different achieved blood pressure levels–updated overview and meta-analyses of randomized trials. J. Hypertens. 2016, 34, 613–622. [Google Scholar] [CrossRef]
- Olesen, T.B.; Pareek, M.; Stidsen, J.V.; Blicher, M.K.; Rasmussen, S.; Vishram-Nielsen, J.; Maagaard, L.; Olsen, M.H. Association between antecedent blood pressure, hypertension-mediated organ damage and cardiovascular outcome. Blood Press. 2020, 29, 232–240. [Google Scholar] [CrossRef]
- Natarajan, K.; Block, R.C.; Yavarimanesh, M.; Chandrasekhar, A.; Mestha, L.K.; Inan, O.T.; Hahn, J.-O.; Mukkamala, R. Photoplethysmography Fast Upstroke Time Intervals Can Be Useful Features for Cuff-Less Measurement of Blood Pressure Changes in Humans. IEEE Trans. Biomed. Eng. 2022, 69, 53–62. [Google Scholar] [CrossRef]
- Sharifi, I.; Goudarzi, S.; Khodabakhshi, M.B. A novel dynamical approach in continuous cuffless blood pressure estimation based on ECG and PPG signals. Artif. Intell. Med. 2019, 97, 143–151. [Google Scholar] [CrossRef] [PubMed]
- Gupta, K.; Bajaj, V.; Ansari, I.A. A support system for automatic classification of hypertension using BCG signals. Expert Syst. Appl. 2023, 214, 119058. [Google Scholar] [CrossRef]
- Agham, N.D.; Chaskar, U.M. Learning and non-learning algorithms for cuffless blood pressure measurement: A review. Med. Biol. Eng. Comput. 2021, 59, 1201–1222. [Google Scholar] [CrossRef]
- Martinez-Ríos, E.; Montesinos, L.; Alfaro-Ponce, M.; Pecchia, L. A review of machine learning in hypertension detection and blood pressure estimation based on clinical and physiological data. Biomed. Signal Process. Control 2021, 68, 102813. [Google Scholar] [CrossRef]
- Maqsood, S.; Xu, S.; Tran, S.; Garg, S.; Springer, M.; Karunanithi, M.; Mohawesh, R. A survey: From shallow to deep machine learning approaches for blood pressure estimation using biosensors. Expert. Syst. Appl. 2022, 197, 116788. [Google Scholar] [CrossRef]
- Rachim, V.P.; Chung, W.Y. Multimodal Wrist Biosensor for Wearable Cuff-less Blood Pressure Monitoring System. Sci. Rep. 2019, 9, 7947. [Google Scholar] [CrossRef] [PubMed]
- Bui, N.; Pham, N.; Barnitz, J.J.; Zou, Z.; Nguyen, P.; Truong, H.; Kim, T.; Farrow, N.; Nguyen, A.; Xiao, J.; et al. eBP: A Wearable System For Frequent and Comfortable Blood Pressure Monitoring From User’s Ear. In Proceedings of the 25th Annual International Conference on Mobile Computing and Networking, Association for Computing Machinery, Los Cabos, Mexico, 21–25 October 2019. [Google Scholar]
- Mukkamala, R.; Hahn, J.-O.; Inan, O.T.; Mestha, L.K.; Kim, C.-S.; Toreyin, H.; Kyal, S. Toward Ubiquitous Blood Pressure Monitoring via Pulse Transit Time: Theory and Practice. IEEE Trans. Biomed. Eng. 2015, 62, 1879–1901. [Google Scholar] [CrossRef] [PubMed]
- Kachuee, M.; Kiani, M.M.; Mohammadzade, H.; Shabany, M. Cuffless Blood Pressure Estimation Algorithms for Continuous Health-Care Monitoring. IEEE Trans. Biomed. Eng. 2017, 64, 859–869. [Google Scholar] [CrossRef]
- Nabeel, P.M.; Kiran, V.R.; Joseph, J.; Abhidev, V.V.; Sivaprakasam, M. Local Pulse Wave Velocity: Theory, Methods, Advancements, and Clinical Applications. IEEE Rev. Biomed. Eng. 2020, 13, 74–112. [Google Scholar] [CrossRef]
- Chen, W.; Kobayashi, T.; Ichikawa, S.; Takeuchi, Y.; Togawa, T. Continuous estimation of systolic blood pressure using the pulse arrival time and intermittent calibration. Med. Biol. Eng. Comput. 2000, 38, 569–574. [Google Scholar] [CrossRef]
- Jia, L. Biomechanics and Blood Pressure with Modeling of Pulse Wave Velocity Based on Multiple Linear Regression. In Advanced Materials Research; Trans Tech Publications: Zurich, Switzerland, 2014; pp. 261–264. [Google Scholar]
- Zhang, Y.; Zhou, C.; Huang, Z.; Ye, X. Study of cuffless blood pressure estimation method based on multiple physiological parameters. Physiol. Meas. 2021, 42, 055004. [Google Scholar] [CrossRef]
- Thambiraj, G.; Gandhi, U.; Mangalanathan, U.; Jose, V.J.M.; Anand, M. Investigation on the effect of Womersley number, ECG and PPG features for cuff less blood pressure estimation using machine learning. Biomed. Signal Process. Control 2020, 60, 101942. [Google Scholar] [CrossRef]
- Wang, B.; Huang, Z.; Wu, J.; Liu, Z.; Liu, Y.; Zhang, P. Continuous Blood Pressure Estimation Using PPG and ECG Signal; Springer International Publishing: Berlin, Germany, 2019; pp. 61–74. [Google Scholar]
- Hsu, Y.C.; Li, Y.H.; Chang, C.C.; Harfiya, L.N. Generalized Deep Neural Network Model for Cuffless Blood Pressure Estimation with Photoplethysmogram Signal Only. Sensors 2020, 20, 5668. [Google Scholar] [CrossRef]
- Chen, S.; Ji, Z.; Wu, H.; Xu, Y. A Non-Invasive Continuous Blood Pressure Estimation Approach Based on Machine Learning. Sensors 2019, 19, 2585. [Google Scholar] [CrossRef]
- Chowdhury, M.H.; Shuzan, N.I.; Chowdhury, M.E.; Mahbub, Z.B.; Uddin, M.M.; Khandakar, A.; Reaz, M.B.I. Estimating Blood Pressure from the Photoplethysmogram Signal and Demographic Features Using Machine Learning Techniques. Sensors 2020, 20, 3127. [Google Scholar] [CrossRef] [PubMed]
- Tobore, I.; Liew, M.S.; Yuhang, L.; Al-Handarish, Y.; Kandwal, A.; Nie, Z.; Wang, B. Deep Learning Intervention for Health Care Challenges: Some Biomedical Domain Considerations. JMIR Mhealth Uhealth 2019, 7, e11966. [Google Scholar] [CrossRef] [PubMed]
- Yu, M.; Huang, Z.; Zhu, Y.; Zhou, P.; Zhu, J. Attention-based residual improved U-Net model for continuous blood pressure monitoring by using photoplethysmography signal. Biomed. Signal Process. Control 2022, 75, 103581. [Google Scholar] [CrossRef]
- Wang, C.; Yang, F.; Yuan, X.; Zhang, Y.; Chang, K.; Li, Z. An End-to-End Neural Network Model for Blood Pressure Estimation Using PPG Signal; Springer: Singapore, 2020; pp. 262–272. [Google Scholar]
- Senturk, U.; Polat, K.; Yucedag, I. A non-invasive continuous cuffless blood pressure estimation using dynamic Recurrent Neural Networks. Appl. Acoust. 2020, 170, 107534. [Google Scholar] [CrossRef]
- Ince, R.A.; Giordano, B.L.; Kayser, C.; Rousselet, G.A.; Gross, J.; Schyns, P.G. A statistical framework for neuroimaging data analysis based on mutual information estimated via a gaussian copula. Hum. Brain Mapp. 2017, 38, 1541–1573. [Google Scholar] [CrossRef]
- Johnson, A.E.W.; Pollard, T.J.; Shen, L.; Lehman, L.-W.H.; Feng, M.; Ghassemi, M.; Moody, B.; Szolovits, P.; Celi, L.A.; Mark, R.G. MIMIC-III, a freely accessible critical care database. Sci. Data 2016, 3, 160035. [Google Scholar] [CrossRef]
- Ziarani, A.K.; Konrad, A. A nonlinear adaptive method of elimination of power line interference in ECG signals. IEEE Trans. Biomed. Eng. 2002, 49, 540–547. [Google Scholar] [CrossRef]
- Yin, S.; Li, G.; Luo, Y.; Lin, L. Cuff-less continuous blood pressure measurement based on multiple types of information fusion. Biomed. Signal Process. Control 2021, 68, 102549. [Google Scholar] [CrossRef]
- Member, S.; IEEE; Pan, J.; Tompkins, W.J. A Real-Time QRS Detection Algorithm. IEEE Trans. Biomed. Eng. 2007, 32, 230–236. [Google Scholar]
- Elgendi, M.; Norton, I.; Brearley, M.; Abbott, D.; Schuurmans, D. Systolic peak detection in acceleration photoplethysmograms measured from emergency responders in tropical conditions. PLoS ONE 2013, 8, e76585. [Google Scholar] [CrossRef]
- Mitchell, G.F.; Parise, H.; Benjamin, E.J.; Larson, M.G.; Keyes, M.J.; Vita, J.A.; Vasan, R.S.; Levy, D. Changes in arterial stiffness and wave reflection with advancing age in healthy men and women: The Framingham Heart Study. Hypertens. Off. J. Am. Heart Assoc. 2004, 43, 1239–1245. [Google Scholar] [CrossRef] [PubMed]
- Schiffrin, E.L. Vascular stiffening and arterial compliance: Implications for systolic blood pressure. Am. J. Hypertens. 2004, 17, 39S–48S. [Google Scholar] [CrossRef] [PubMed]
- Dillon, J.B.; Hertzman, A.B. The form of the volume pulse in the finger pad in health, arteriosclerosis, and hypertension. Am. Heart J. 1941, 21, 172–190. [Google Scholar] [CrossRef]
- Alty, S.R.; Angarita-Jaimes, N.; Millasseau, S.C.; Chowienczyk, P.J. Predicting arterial stiffness from the digital volume pulse waveform. IEEE Trans. Biomed. Eng. 2007, 54, 2268–2275. [Google Scholar] [CrossRef]
- Ding, X.-R.; Zhang, Y.-T. Photoplethysmogram intensity ratio: A potential indicator for improving the accuracy of PTT-based cuffless blood pressure estimation. In Proceedings of the 2015 37th Annual International Conference of the IEEE Engineering in Medicine and Biology Society (EMBC), Milan, Italy, 25–29 August 2015; pp. 398–401. [Google Scholar]
- Ding, X.-R.; Zhang, Y.-T.; Liu, J.; Dai, W.-X.; Tsang, H.K. Continuous Cuffless Blood Pressure Estimation Using Pulse Transit Time and Photoplethysmogram Intensity Ratio. IEEE Trans. Biomed. Eng. 2016, 63, 964–972. [Google Scholar] [CrossRef]
- Breiman, L. Random forests. Mach. Learn. 2001, 45, 5–32. [Google Scholar] [CrossRef]
- Kraskov, A.; Stogbauer, H.; Grassberger, P. Estimating mutual information. Phys. Rev. E Stat. Nonlin Soft Matter Phys. 2004, 69, 066138. [Google Scholar] [CrossRef]
- Liu, H.; Sun, J.; Liu, L.; Zhang, H. Feature selection with dynamic mutual information. Pattern Recognit. 2009, 42, 1330–1339. [Google Scholar] [CrossRef]
- Pandit, J.A.; Lores, E.; Batlle, D. Cuffless Blood Pressure Monitoring: Promises and Challenges. Clin. J. Am. Soc. Nephrol. 2020, 15, 1531–1538. [Google Scholar] [CrossRef]
- El-Hajj, C.; Kyriacou, P.A. Deep learning models for cuffless blood pressure monitoring from PPG signals using attention mechanism. Biomed. Signal Process. Control 2021, 65, 102301. [Google Scholar] [CrossRef]
- Moon, J.H.; Kang, M.-K.; Choi, C.-E.; Min, J.; Lee, H.-Y.; Lim, S. Validation of a wearable cuff-less wristwatch-type blood pressure monitoring device. Sci. Rep. 2020, 10, 19015. [Google Scholar] [CrossRef] [PubMed]
- Guo, Y.; Liu, X.; Peng, S.; Jiang, X.; Xu, K.; Chen, C.; Wang, Z.; Dai, C.; Chen, W. A review of wearable and unobtrusive sensing technologies for chronic disease management. Comput. Biol. Med. 2021, 129, 104163. [Google Scholar] [CrossRef] [PubMed]
- Mancia, G.; De Backer, G.; Dominiczak, A.; Cifkova, R.; Fagard, R.; Germano, G.; Grassi, G.; Heagerty, A.M.; Kjeldsen, S.E.; Laurent, S.; et al. 2007 ESH-ESC practice guidelines for the management of arterial hypertension: ESH-ESC task force on the management of arterial hypertension. J. Hypertens. 2007, 25, 1751–1762. [Google Scholar] [CrossRef]
- Hoque, N.; Bhattacharyya, D.K.; Kalita, J.K. MIFS-ND: A mutual information-based feature selection method. Expert Syst. Appl. 2014, 41, 6371–6385. [Google Scholar] [CrossRef]


| Index | Feature | Definition |
|---|---|---|
| 1 | Gender | Gender of subjects |
| 2 | Age | Age of subjects |
| 3 | Weight | Weight of subjects |
| 4 | PATp | Pulse transit time from the R peak of ECG to the peak point of PPG |
| 5 | PATf | Pulse transit time from the R peak of ECG to the valley point of PPG |
| 6 | PATd | Pulse transit time from the R peak of ECG to the maximum difference point of PPG |
| 7 | HR | Heart rate |
| 8 | PP | The peak-to-peak interval of PPG |
| 9 | PPT | The time interval from the first peak point to the second peak or the inflection point of PPG |
| 10 | PIRp | PPG intensity ratio of the peak point to valley point |
| 11 | PIRmd | PPG intensity ratio of the maximum difference point to the valley point |
| 12 | PIavg | The average amplitude of PPG |
| 13 | PIsd | The standard deviation of PPG |
| 14 | PImax | The maximum amplitude of PPG |
| 15 | PImin | The minimum amplitude of PPG |
| 16 | SA | The sum of ascending branch value of PPG |
| 17 | AA | The average of ascending branch value of PPG |
| 18 | SD | The sum of descending branch value of PPG |
| 19 | AD | The average descending branch value of PPG |
| 20 | SR | The sum ratio of ascending branch value to descending branch value of PPG |
| 21 | K | K value of PPG |
| 22 | AT | Ascending time of PPG |
| 23 | DT | Descending time of PPG |
| 24 | AS | The ascending slope of PPG |
| 25 | DS | The descending slope of PPG |
| SBP | DBP | |||||
|---|---|---|---|---|---|---|
| Age | AA | DS | Gender | HR | AD | |
| Weight | SD | Age | K | SR | ||
| Feature | PATf | AD | Weight | PIsd | AT | |
| HR | SR | PATf | AA | AS | ||
| PIsd | AT | PATd | SD | DS |
| Feature Selection | MAE ± STD (mmHg) | |
|---|---|---|
| SBP | No | 9.12 ± 9.83 |
| Yes | 7.93 ± 9.12 | |
| DBP | No | 8.31 ± 9.23 |
| Yes | 7.63 ± 8.61 |
| MAE ± STD | The Proportion of MAE | Grade | |||
|---|---|---|---|---|---|
| (mmHg) | ≤5 mmHg | ≤10 mmHg | ≤15 mmHg | ||
| SBP | 5.21 ± 5.98 | 65% | 86% | 97% | A |
| DBP | 4.15 ± 5.66 | 72% | 89% | 98% | A |
| - | 60% | 85% | 95% | A | |
| BHS | - | 50% | 75% | 90% | B |
| - | 40% | 65% | 85% | C | |
| Calculation | Works | Feature | Methods | SBP (mmHg) | DBP (mmHg) | ||
|---|---|---|---|---|---|---|---|
| Num.* | MAE | STD | MAE | STD | |||
| No | Ours | 11/15 * | RF | 7.93 | 9.12 | 7.63 | 8.61 |
| Kachuee [15] | 15/15 | Adaboost | 11.17 | 10.09 | 5.35 | 6.14 | |
| Zhang [19] | 20/20 | Adaboost | 10.03 | 14.43 | 5.35 | 8.33 | |
| Yes | Ours | 11/15 | RF | 5.21 | 5.98 | 4.15 | 5.66 |
| Zhang [19] | 20/20 | Adaboost | 7.73 | 7.96 | 4.30 | 4.50 | |
| Geerthy [20] | 23/17 | RF | 9.00 | - | 5.48 | - | |
| Kachuee [15] | 15/15 | Adaboost | 8.21 | 5.45 | 4.31 | 3.52 | |
| El-Hajj [45] | 22/22 | Bi-GRU | 2.58 | 3.35 | 1.26 | 1.63 | |
Disclaimer/Publisher’s Note: The statements, opinions and data contained in all publications are solely those of the individual author(s) and contributor(s) and not of MDPI and/or the editor(s). MDPI and/or the editor(s) disclaim responsibility for any injury to people or property resulting from any ideas, methods, instructions or products referred to in the content. |
© 2023 by the authors. Licensee MDPI, Basel, Switzerland. This article is an open access article distributed under the terms and conditions of the Creative Commons Attribution (CC BY) license (https://creativecommons.org/licenses/by/4.0/).
Share and Cite
Ma, G.; Zhang, J.; Liu, J.; Wang, L.; Yu, Y. A Multi-Parameter Fusion Method for Cuffless Continuous Blood Pressure Estimation Based on Electrocardiogram and Photoplethysmogram. Micromachines 2023, 14, 804. https://doi.org/10.3390/mi14040804
Ma G, Zhang J, Liu J, Wang L, Yu Y. A Multi-Parameter Fusion Method for Cuffless Continuous Blood Pressure Estimation Based on Electrocardiogram and Photoplethysmogram. Micromachines. 2023; 14(4):804. https://doi.org/10.3390/mi14040804
Chicago/Turabian StyleMa, Gang, Jie Zhang, Jing Liu, Lirong Wang, and Yong Yu. 2023. "A Multi-Parameter Fusion Method for Cuffless Continuous Blood Pressure Estimation Based on Electrocardiogram and Photoplethysmogram" Micromachines 14, no. 4: 804. https://doi.org/10.3390/mi14040804
APA StyleMa, G., Zhang, J., Liu, J., Wang, L., & Yu, Y. (2023). A Multi-Parameter Fusion Method for Cuffless Continuous Blood Pressure Estimation Based on Electrocardiogram and Photoplethysmogram. Micromachines, 14(4), 804. https://doi.org/10.3390/mi14040804