Article

Optimum Design of a Composite Optical Receiver by Taguchi and Fuzzy Logic Methods

1
Department of Ophthalmology, Shanghai General Hospital, School of Medicine, Shanghai Jiaotong University, Shanghai 200080, China
2
Shanghai Engineering Research Center of Ultra-Precision Optical Manufacturing, School of Information Science and Technology, Fudan University, Shanghai 200433, China
*
Author to whom correspondence should be addressed.
Micromachines 2021, 12(12), 1434; https://doi.org/10.3390/mi12121434
Submission received: 22 October 2021 / Revised: 17 November 2021 / Accepted: 19 November 2021 / Published: 23 November 2021
(This article belongs to the Special Issue Design and Manufacture of Micro-Optical Lens)

Abstract

:
This paper investigates a composite optical receiver for an indoor visible light communication (VLC) system. The optical gain, received power, and signal-to-noise ratio (SNR) are considered to be optimized. However, it is difficult to find a balance between them in general design and optimization. We propose the Taguchi and fuzzy logic combination method to improve multiple performance characteristics effectively in the optical receiver. The simulated results indicate that the designed receiver has the characteristics of an optical gain of 10.57, a half field of view (HFOV) of 45°, a received power of 6.4635 dBm, a signal-to-noise ratio (SNR) of 89.8874 dB, and a spot size of 2 mm. The appropriate weights of the three performance characteristics for the inputs of the fuzzy controllers increase the optical gain by 13.601 dB, and the received power and SNR by 11.097 dB and 0.373 dB, respectively. Therefore, the optical receiver optimally designed by the Taguchi and fuzzy logic methods can significantly meet the requirements of an indoor VLC system.

1. Introduction

In the 1980s, solid-state lighting for illuminance was gradually replaced with the development of high-efficiency yellow, red, and orange light-emitting diodes (LEDs) [1,2]. As LED lights have some obvious advantages in their low carbon emissions, contain no mercury, and are power efficient and durable, they have been widely utilized in medical applications, indoor farming and plantation, information display, and so on [3,4]. Additionally, the potential function of simultaneously offering illuminance and communication with high response sensitivity and switching frequency can significantly solve the scarcity of radio frequency (RF), and provide a reliable communication system [5,6,7]. Thus, visible light communication (VLC) technology came into being.
VLC is a new paradigm that can completely change the future of wireless communication. With the characteristics of a high communication rate, unlimited bandwidth, and being free from electromagnetic interference, VLC systems have been applied in intelligent transportation [8], indoor wireless communication [9,10,11], smart cities [10], human sensing [11], vehicular communication [12], and location in robotics/warehouses [13]. VLC systems consist of a transmitter, an optical receiver such as a photodetector or image sensor, and a free-space optical communication channel. Presently, various pieces of research have mainly focused on the channel coding, modulation mode, and layout optimization of the light source, but not on the optical receiving system in VLC [14]. However, a suitable optical receiver designed for the VLC system can significantly improve the receiving energy, optical gain, and signal-to-noise ratio (SNR), and can provide a guarantee for a high communication rate [15,16]. The optical receiver is often utilized to collect and transmit more lights to the photoelectric detector [17], and it requires high optical gain and a wide FOV. In most cases, the receivers only consist of a filter and a cover lens, and the communication quality cannot be guaranteed. Some traditional optical receivers, such as compound parabolic concentrator (CPC), have a tradeoff between FOV and optical gain [18,19,20]. The Cassegrain antenna has quite a small FOV and cannot meet the requirements of the VLC systems [21]. The Fresnel lens has a strict limitation on the incidence angle [22,23]. Additionally, some novel optical receiving systems have been proposed, such as the continuous zoom antenna designed for mobile VLC [16], the gradient-index lens with a CPC shape [15], and the planer concentrator for the improvement of FOV and received power [24].
In this regard, we have previously proposed a novel optical receiving antenna based on a compound parabolic concentrator for an indoor VLC system, and analyzed the optical gain, received power, and SNR distribution [22]. Our results show that the designed optical receiver is effective in collecting energy from the Lambert source. However, the spot size is 8 mm and the received power is dispersed over the receiving surface. According to the optical characteristics of the designed receiver, for a fixed FOV, the larger the exit surface, the more energy can be collected. However, due to the small physical size of the detector, the energy focused on the receiver cannot be effectively used in the communication system. Moreover, the previously proposed receiver was optimized by the Taguchi method, which aims to deal with the optimization of single performance characteristics. For the optimization of processes with multiple performance characteristics, the usual suggestions are left to engineering judgment, and are verified by experiments. Thus, it is difficult to find a balance between multiple performance characteristics such as FOV, optical gain, received power, and SNR. Optimizing only one certain optical characteristic may not meet the image quality requirements, which hinders the improvement of the optical performances of the receiver and the communication stability of the VLC system. The definition of performance characteristics, such as the lower the better or the higher the better, contain a certain degree of uncertainty and ambiguity. Thus, besides proposing novel design ideas, it is necessary to optimize multiple quality characteristics with the appropriate method for an optical receiver.
Therefore, we propose and demonstrate a novel composite optical receiver with the Taguchi and fuzzy logic combination method. The proposed novel optical receiver is composed of two stages: the lens-walled CPC and the hemispherical lens (HL). The effects of varying the bottom wall height H, rotation degree β, spacing distance L between the two stages, and hemispherical radius R are studied to improve the characteristics of the receiver. By utilizing the Taguchi and fuzzy logic methods, the optimization of complex multi-performance characteristics can be transformed into the optimization of single multiple performance characteristics indices (MPCI), which have the potential to efficiently and reliably obtain a wide FOV, high optical gain, well-received power, and SNR. The results indicate that the optimized receiver has a wider FOV, higher gain, and ensures better received power and SNR than the initial structure by utilizing the proposed optimization method. Furthermore, the optical efficiency and received spot area have been improved simultaneously. The design scheme of the composite optical receiver is briefly described in Section 2. Section 3 proposes the Taguchi and fuzzy logic methods applied to the receiver optimization and evaluation. Section 4 presents the channel performance evaluation and comparison. Finally, the conclusions are illustrated in Section 5.

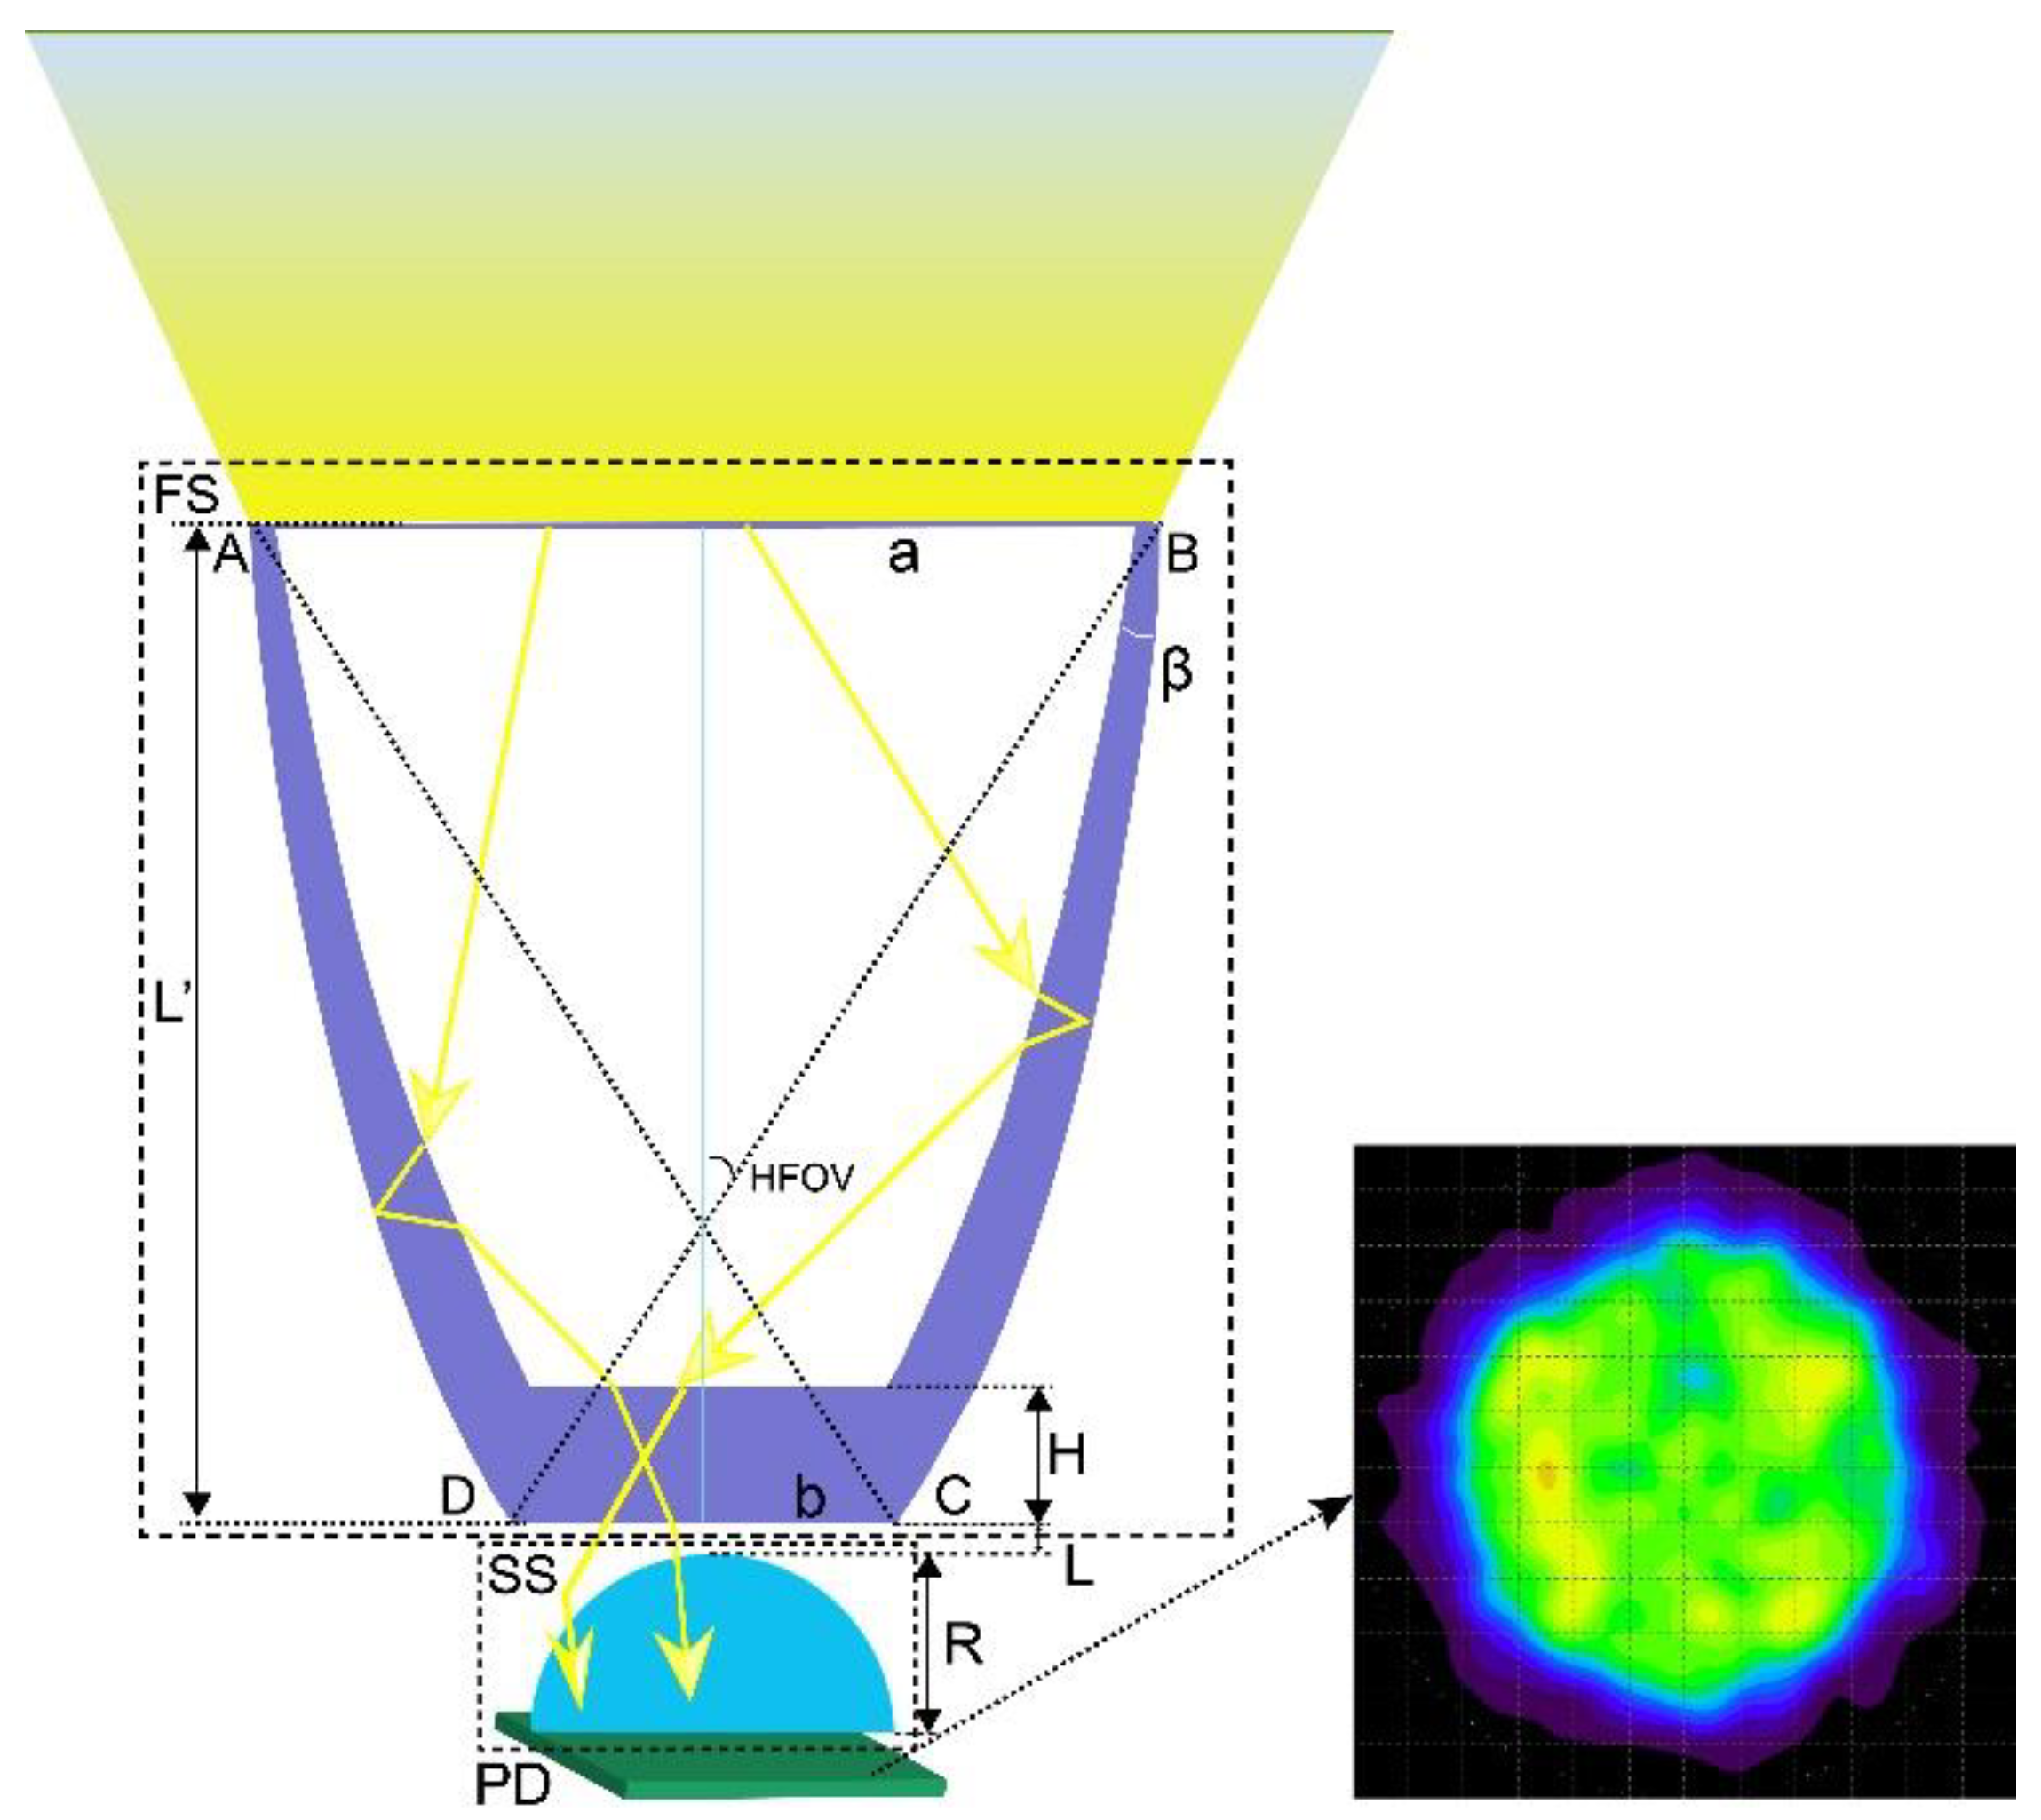
2. Design of the Composite Optical Receiver

The traditional mirror CPC is a non-imaging concentrator designed with the principle of edge rays [25]. In 1974, Prof. Winston invented the CPC, which consists of two symmetrical paraboloids rotating around a symmetry axis. Until now, many kinds of research have been about the application of CPC in VLC systems [26]. However, the research indicates that the tradeoff between the optical gain and FOV of CPC limits the optical performance. Therefore, several novel optical receivers based on gradient-index lenses [15], continuous zoom lenses [16], and CPC structures [18] have been proposed, which can effectively improve the FOV and guarantee a high optical gain, ensuring better received power and SNR. However, the light spots obtained by the proposed structures are relatively scattered, and the optical energy distribution is not concentrated enough, while the photodetector size is quite small in VLC systems. Increasing the concentration ratio and reducing the spot area is significant to improve the utilization of optical energy and ensure the stability of the communication. However, there have been some limitations on obtaining the best structure combinations of receivers effectively with multiple quality characteristics. Meanwhile, in the field of optical receiver design for VLC systems, there is hardly any research regarding receiver optimization or optimization methods, while an appropriate optimization methodology can significantly improve the efficiency of the receiver design and obtain better communication performance in VLC systems. Therefore, we further propose the composite optical receiver, and mainly research the optimization method based on Taguchi and fuzzy logic.
Figure 1 presents the proposed optical receiver for indoor VLC systems, combining the best of both the lens-walled CPC in [22] and the hemispherical lens (HL). The rays track through the lens-walled CPC with reflection and refraction, which is incident on the surface of the HL. The rays can be focused into a small area, which significantly improves the optical energy receiving efficiency. Furthermore, the proposed optical receiver consists of four parameters: the bottom wall’s height H, rotation degree β, spacing distance L, and hemispherical radius R, which can be optimized by Taguchi and fuzzy logic methods to obtain the best structural parameter combination. The initial structure of the receiver in this study has the following parameters: a β of 3°, H of 4.0 mm, L of 2.0 mm, and R of 3.5 mm, and all these parameters need further optimization.
Parameters a and b are the radius of the inlet and outlet of the CPC, respectively; the concentration Cg can be expressed as [18]:
C g   =   a b   =   1 s i n θ m a x
where θmax represents the HFOV of the CPC, and any ray with an incident angle smaller than the half acceptance angle θmax can reach the outlet aperture of the CPC.
The focal length of the parabolae AC and BD can be calculated by Equation (2):
f   =   b 1   +   s i n θ m a x
Meanwhile, according to the calculated f and HFOV, the height of the CPC can be expressed by Equation (3) as:
L   =   b ( 1   +   sin θ max ) cos θ m a x sin 2 θ m a x   =   f cos θ m a x sin 2 θ m a x
The CPC with a length of L is called the standard CPC. However, in practical applications, the CPC is often truncated; that is, the upper part of the CPC is cut off and the length is reduced. The interception ratio of the CPC can be expressed as k:
k   =   L L
where L’ is the height of the CPC after truncation, and appropriate truncation has little influence on the performance of the CPC. The lens-walled CPC is formed by rotating a symmetrical mirror CPC around the top end points A and B, respectively, toward the inside by a certain rotation degree β. The area between the original CPC curves and the new CPC curves is the lens, which is filled with the material of PMMA. The outside surface of the lens is layered with a reflective coating, which allows rays to experience both reflection and refraction.
Shown in Table 1 are the basic parameters of the CPC structure applied in this paper. We set the HFOV to be 20°. The HL is a widely-used non-imaging concentrator with omnidirectional gain and a wide FOV. Figure 2 presents the schematic diagram of the HL. The refractive index of the HL is n2 and the medium index is n1. The radius of the HL is represented as R. Assuming a light incident at point C with an incident angle α1 on the HL, it is refracted to point A with a refractive angle of α2. The relationship between α1 and α2 is represented as follows [17]:
sin α 1 sin α 2   =   n 2 n 1
The deflection angle is
α   =   α 1     α 2   =   α 1     s i n 1 ( n 1 sin α 1 n 2 )
Upon applying the sine theorem to triangles CBO and CAO, the relationship between the different angles and sides can be expressed as follows:
sin α 1 𝑂 B ¯   =   sin CBO R sin α 2 𝑂 A ¯   =   sin CAO R
where CBO   =   α 1     α 2   +   CBO .
Therefore, the length of 𝑂 A ¯ can be calculated as
𝑂 A ¯   =   R sin α 2 sin α 1 α 2 + COB
Furthermore, the deflection distance of the incident light in the HL can be expressed as follows:
l   =   𝑂 B ¯     R   n 1   sin α 1 n 2   α 1     s i n 1 n 1 sin α 1 n 2   +   s i n 1 ( R sin α 1 𝑂 B ¯ )
As illustrated in Equation (9), if a light ray is incident on the HL with a certain angle α1, then the deflection distance l mainly depends on the R , n 1 and n 2 , which significantly reduce the spot area by choosing suitable materials of the HL.

3. Optimization of the Composite Optical Receiver

There are four parameters of the composite optical receiver which significantly affect the performance characteristics, as discussed in Section 2. The software of Tracepro and Matlab were utilized to perform the optimization and evaluation of the proposed composite optical receiver in indoor VLC systems. The simulation was operated in a 5 m × 5 m × 3 m room with four 60 × 60 LEDs array units, as shown in Figure 3. The LED’s optical power is 20 mW, the center intensity is 0.73 cd, and the LED unit spacing is 10 mm. The LED array was placed by the principle of minimum mean square error of illumination, and the center coordinates of the four LEDs array units were (0.815, 0.815), (4.185, 0.815), (4.185, 4.185), and (0.815, 4.185), respectively.
Four structural parameters have effects on the optical receiver, which means many experimentations need to be explored. Meanwhile, multiple performance characteristics cannot simultaneously achieve the optimal solution. However, the Taguchi method can effectively obtain a large amount of experimental information with the least number of experiments, and can interpret experimental results faster than traditional methods. Furthermore, fuzzy logic control can be utilized to model uncertain and complicated issues. Fuzzy logic can effectively define the relationship between the system input and the expected output, and can convert the evaluation result into a total evaluation coefficient of MPCI. Therefore, we combine the advantages of Taguchi experiments and the fuzzy logic method to optimize and evaluate the designed optical receiver.

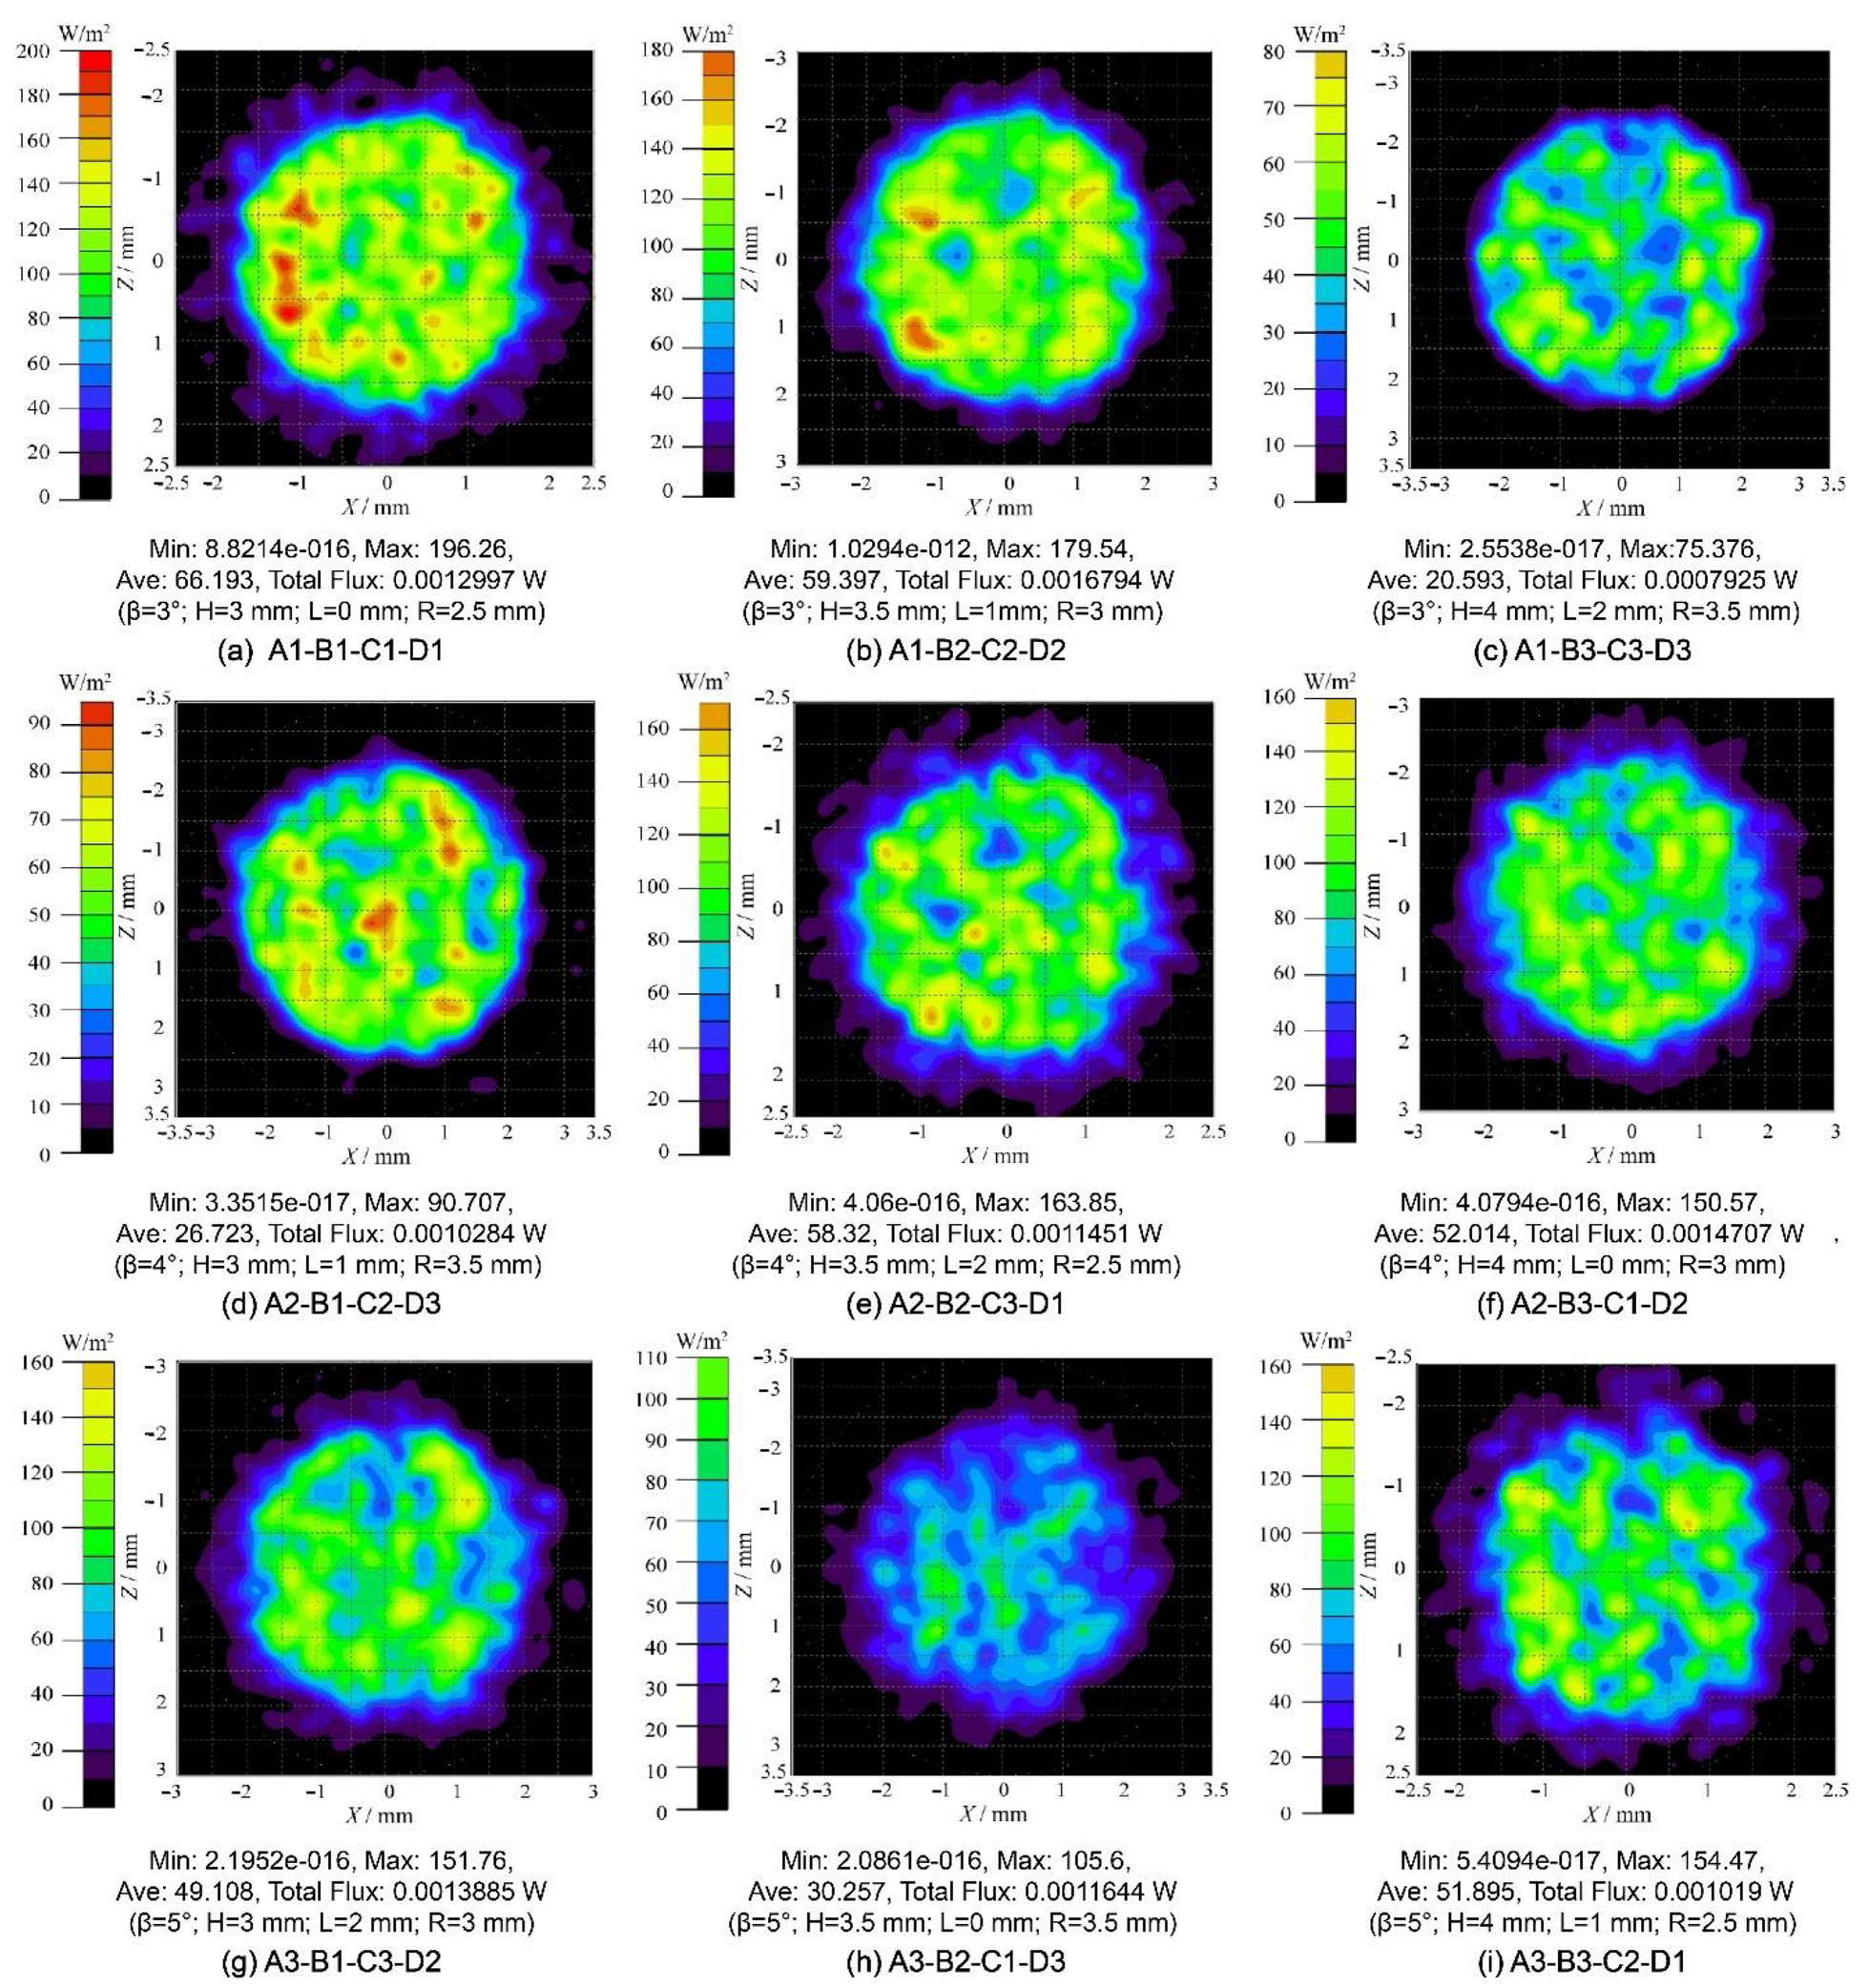
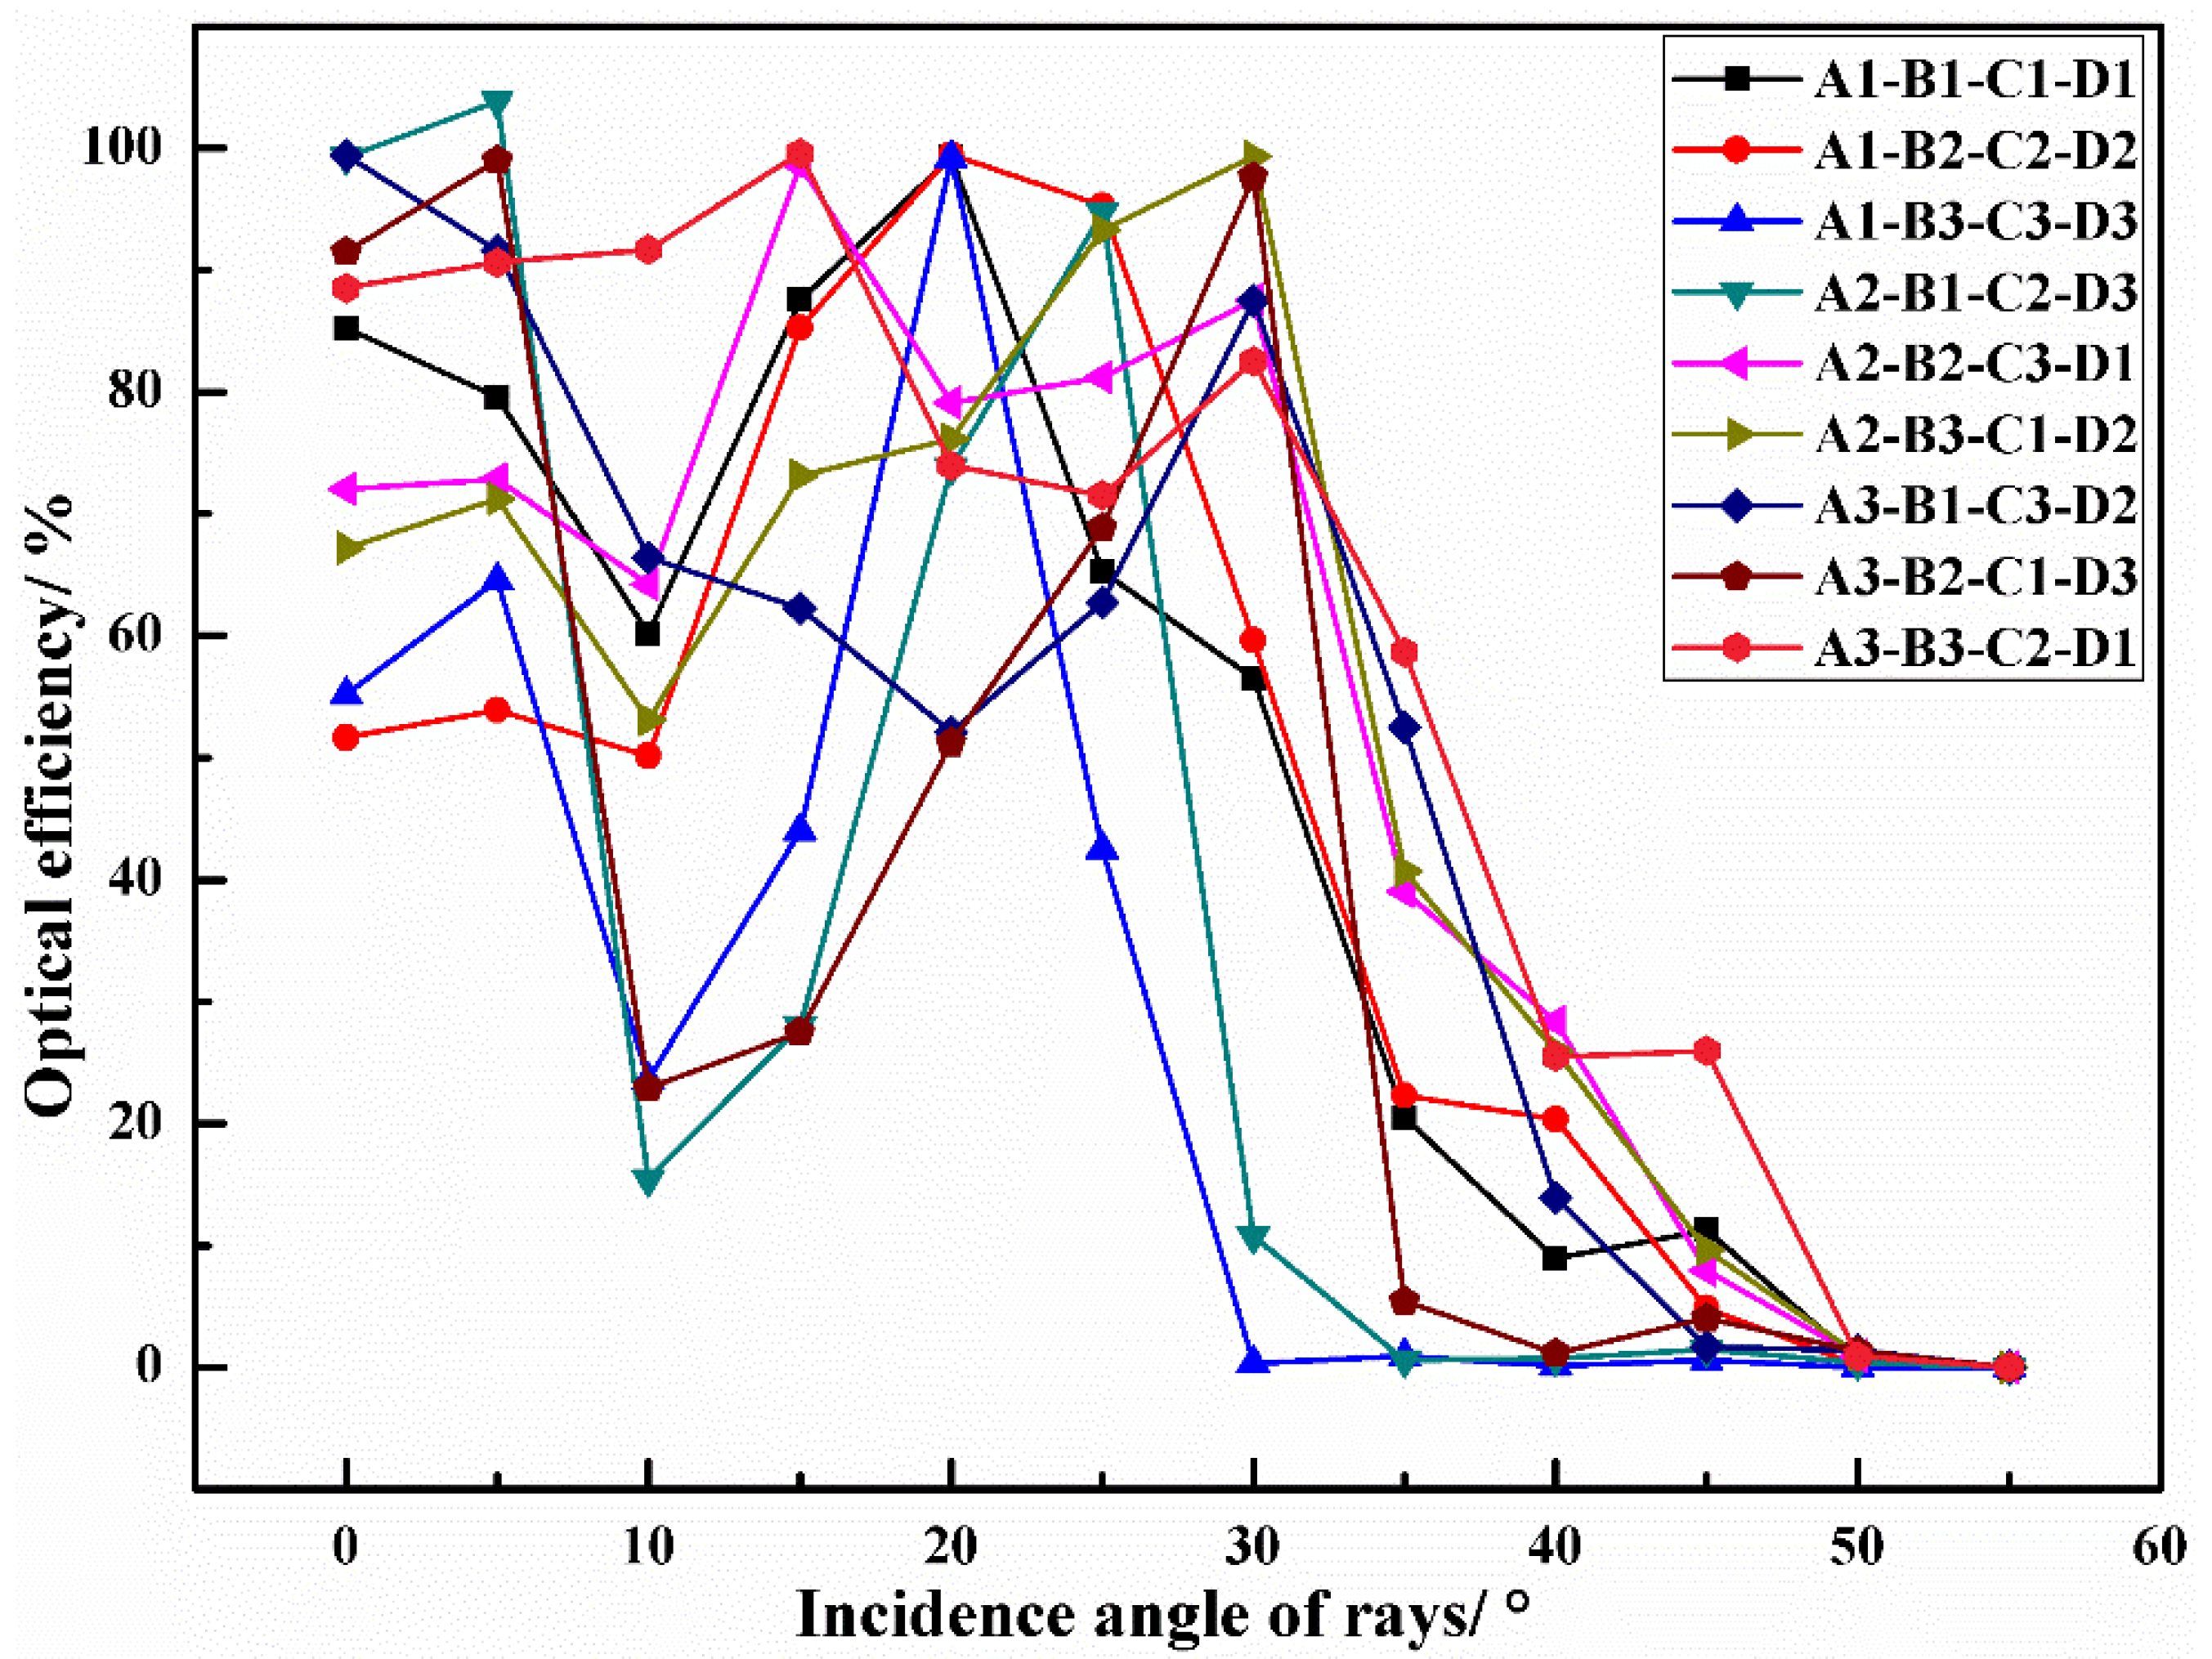
3.1. Taguchi Experimentation

The target of the Taguchi experiment is the achievement of optimum performances by applying suitable parameter combinations, utilizing an orthogonal array to analyze the results of different combinations [27]. The Taguchi method has the advantages of reducing production time and costs by utilizing the orthogonal array [28]. The most influential parameters are arranged in an orthogonal array, thus greatly reducing the number of experiments. Meanwhile, these parameters are commonly referred to as “control factors”, and each of these parameters can have a specified number of design settings, called “level settings” [27,28,29]. As shown in Table 2, in the Taguchi experiments, the quality characteristics of the optical receiver are determined by four factors, namely: (A) the rotation angle β; (B) the bottom wall’s height H; (C) the spacing distance L; (D) the hemispherical radius R. Each of these four factors is assigned three possible level settings.
The objective quality characteristics include optical gain G, the received power P, and the SNR of the optical receiver. As shown in Table 3, the Taguchi experiment is configured in the L9 (34) orthogonal array. Meanwhile, in Taguchi’s method, a loss function is defined to calculate the simulated noise intensity, which represents the deviation between the experimental value and the expected value, and its unit is the decibel (dB). Regardless of the characteristics of the serial number, the larger the serial number, the smaller the change and the higher the quality. Additionally, the S/N ratio is summarized as “the larger the better” or “the smaller the better”, which is expressed as follows [30]:
Larger   the   better :   η   =   10 l o g i = 1 n 1 y i 2 n
Smaller   the   better :   η   =   10 l o g i = 1 n y i 2 n
where y i represents the values of the G, P, or SNR related to the i-th trial, and n represents the total number of Taguchi experiments.
Consequently, the larger-the-better S/N ratio is utilized to evaluate the control factorial combinations in the increase of the G, P, and SNR for the optical receiver. In this paper, A1 means control factor A (Rotation degree β) and the level setting “1” (β = 3°), and so do other combinations of letters and numbers. As presented in Figure 4, the S/N ratio at different levels varies with different control factor combinations. By identifying the maximum S/N ratio, the optimal structural parameters can be obtained conveniently. Therefore, the most effective parameter combination for G optimization is: A1 (β = 3°), B2 (H= 3.5 mm), C1 (L = 0), and D1 (R = 2.5 mm). The experiment was verified by the parameter combination A1-B2-C1-D1, and it was found that G is 8.62, which is significantly higher than other combinations shown in Table 3. Thus, from the point of view of G, the parameter combination A1-B2-C1-D1 stands for the optimum structure. Similarly, the optimal structural parameter combination of optimization P is determined by: A1 (β = 3°), B3 (H = 4.0 mm), C2 (L = 1.0 mm), and D1 (R = 2.5 mm). The p-value of the structure settings A1-B3-C2-D1 is 5.0730 dBm, which is higher than the p-value of other original Taguchi experiments. However, under these structural parameters, G is just 6.84. In addition, the most effective structural parameters for the optimization of the SNR are: A1 (β = 3°), B1 (H = 3.0 mm), C3 (L = 2.0 mm), and D3 (R = 3.5 mm). The SNR value of this structure combination is 86.4925 dB, while the G is 7.94, and the P is 4.3285 dBm. The structure settings A1-B1-C3-D3 have great performance on the SNR, whereas the G and P cannot maintain a high level simultaneously. The received irradiance distribution of the optical receiver is presented in Figure 5. In the Taguchi experiment, the optical receiving energy and spot area vary with different parameter combinations. The different sizes and shapes of the spots indicate that the receptacles set by different structures have different abilities to concentrate light energy. The structural settings A1-B1-C1-D1 and A1-B2-C2-D2 both have smaller spot sizes and greater optical energy. Figure 6 shows the optical efficiency with different combinations of structural parameters in the Taguchi experiment. The optical efficiency with different experimental settings has similar trends. However, there are also significant differences between the nine experimental settings for the FOV attribute. In the case of A3-B3-C2-D1, the optical efficiencies are 58.66%, 25.51% and 25.97% when the incident angles are 35°, 40° and 45°, respectively. In the case of A3-B1-C3-D2, the optical efficiency is 52.46%, 13.93% and 1.70% respectively, whereas in A1-B3-C3-D3, the optical efficiency with these three incident angles is close to 0. Different Taguchi experimental combinations have different optical efficiency performances; the designed optical receiver can significantly improve the FOV. In some structural settings, even if the incident angle is large enough, the optical efficiency can still be maintained up to 40%.

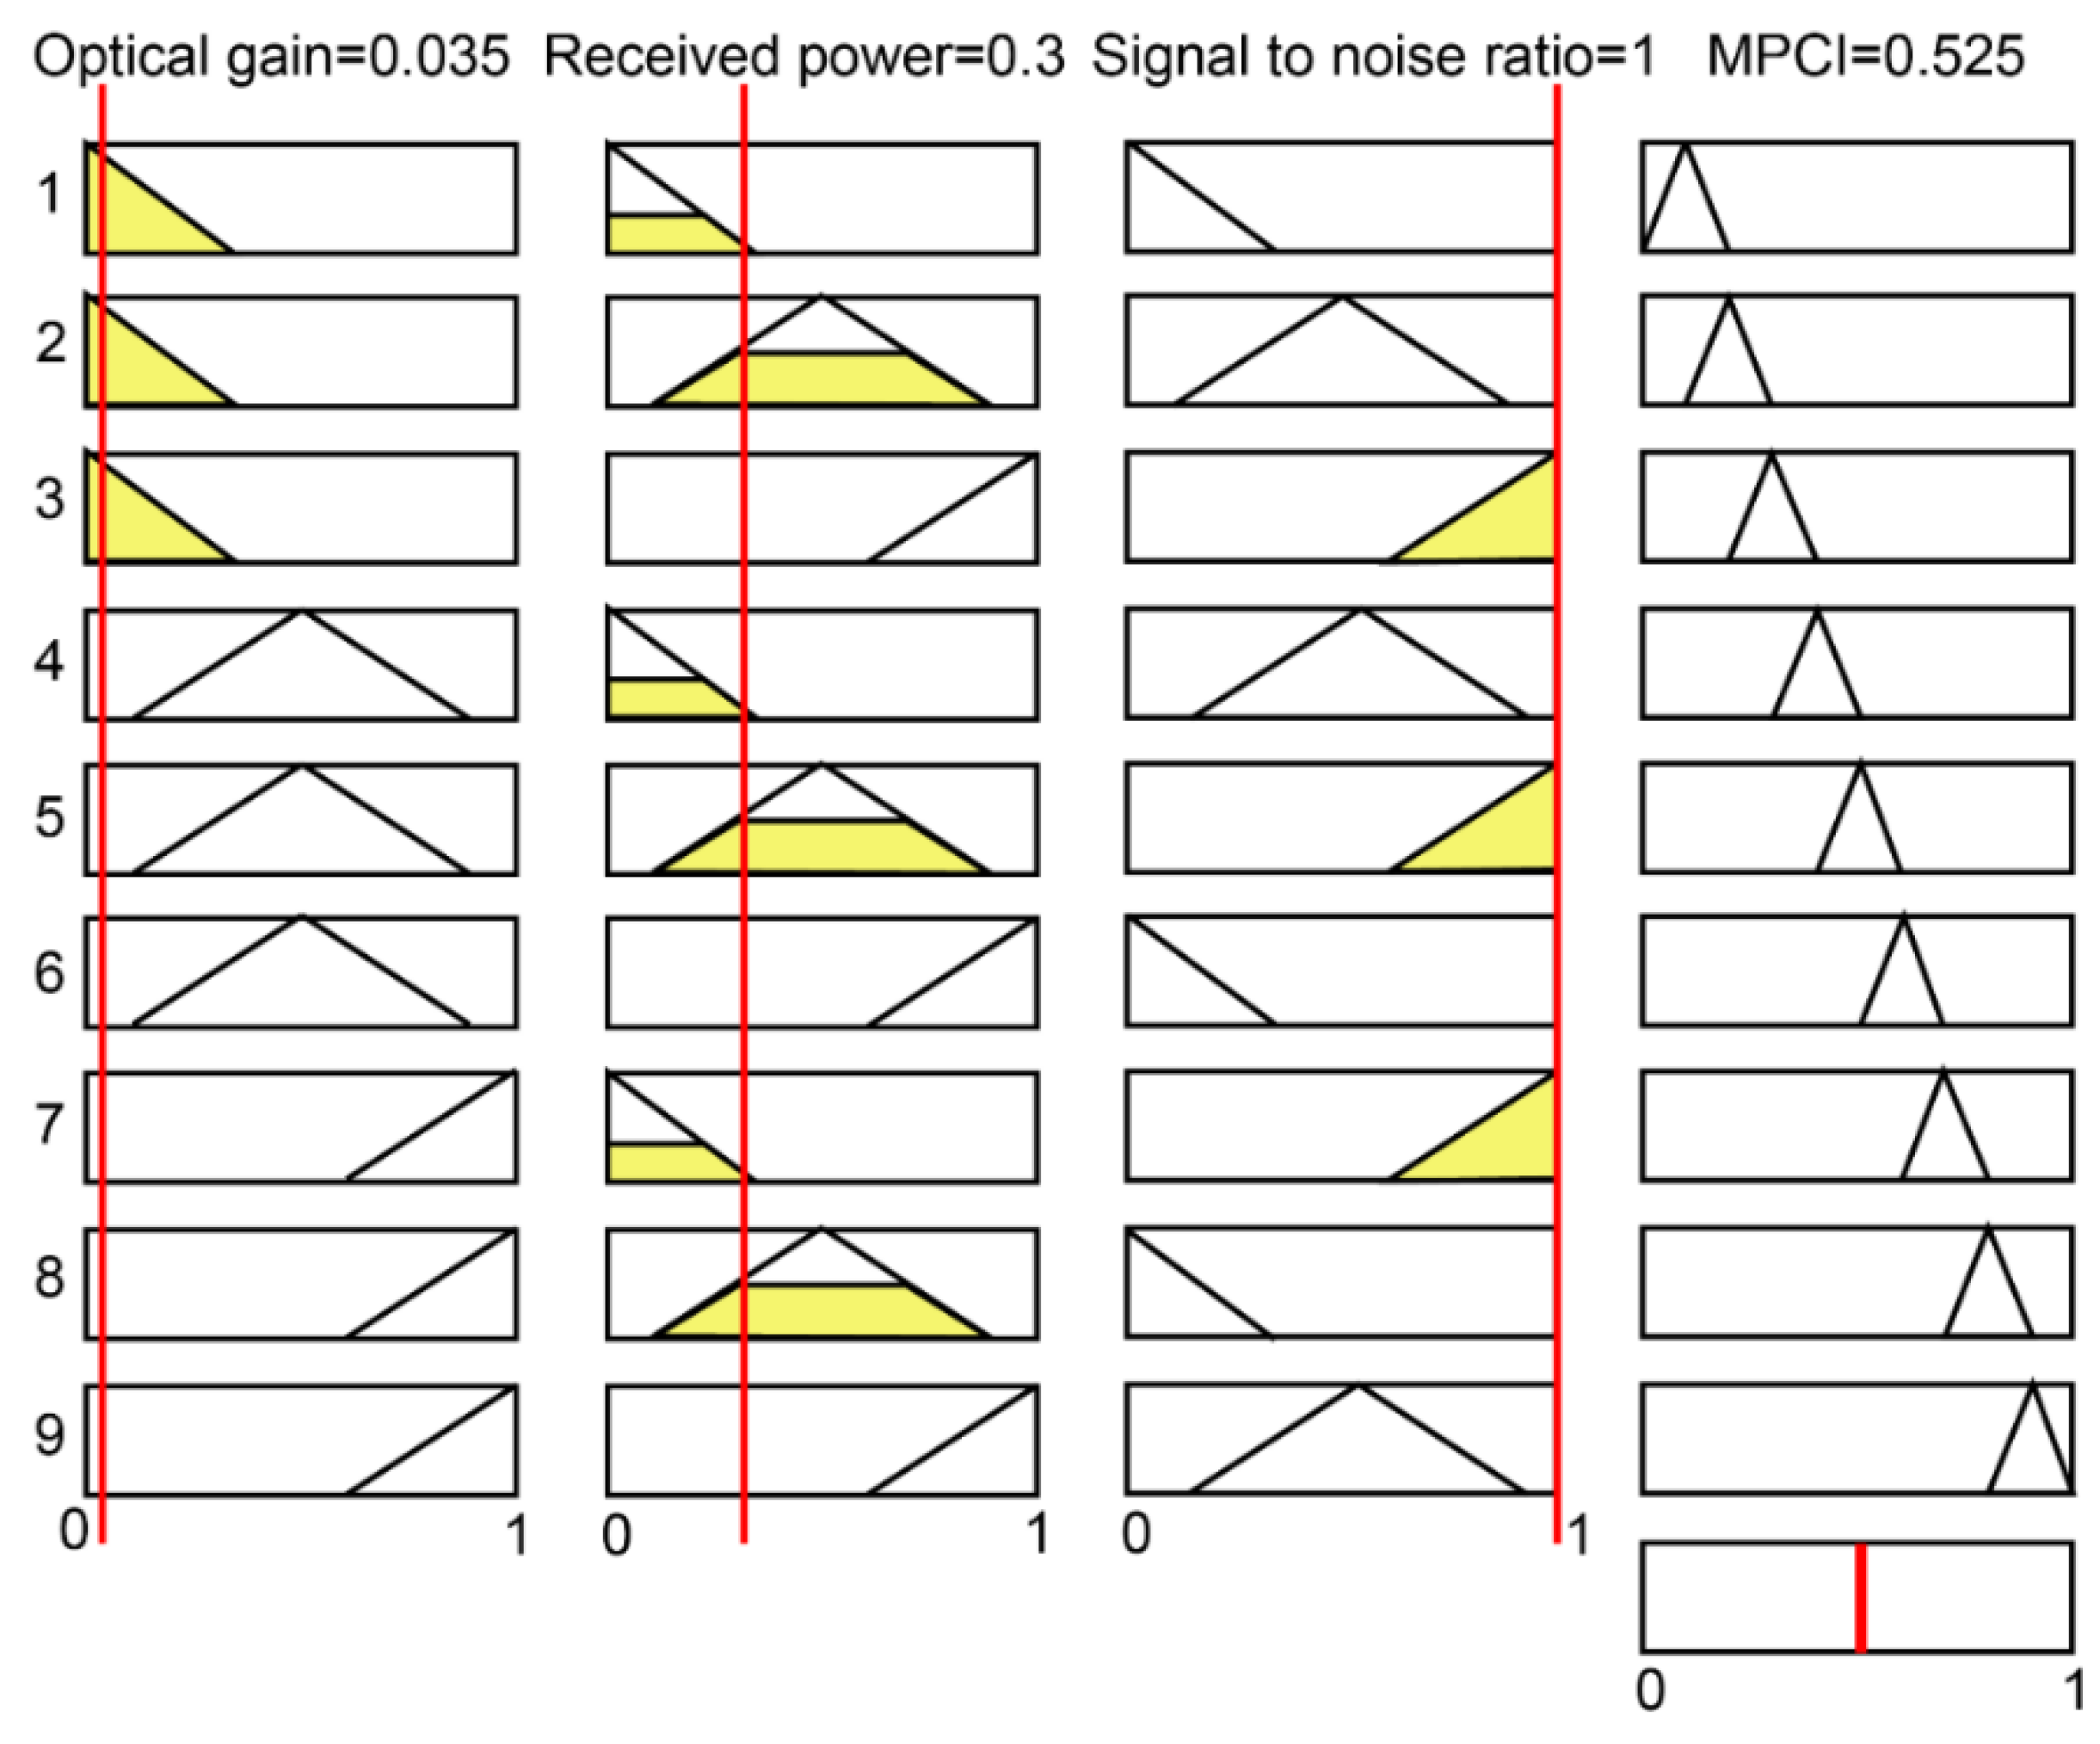
3.2. Fuzzy Logic Method

Fuzzy logic is a mathematical theory of imprecise reasoning. It uses language terms to simulate the human reasoning process, and is appropriate for the definition of the connection system’s input and output [31,32]. Fuzzy controllers and fuzzy reasoning can deal with uncertainty, and have been widely used in some complex industrial systems [33]. The fuzzy logic system mainly consists of an inference engine containing a rule base and a database, a fuzzifier, and a de-fuzzifier [32]. The performance evaluation can be normalized after the Taguchi experiment. Then, the crisp inputs can be converted into fuzzy sets by the fuzzifier with the membership function, and the inference engine can obtain fuzzy values by performing fuzzy reasoning on fuzzy rules. In addition, the fuzzy value is converted into a clear output by utilizing the de-fuzzifier. In general, the membership function can determine the fuzzy value by defining the membership degree of the object, but the standard method cannot choose the appropriate membership function shape for the fuzzy set of control variables. In this paper, the Mamdani implication method is used to make fuzzy inferences on the fuzzy rules. Each fuzzy rule with the statement of “if–then” can be represented as [32]
R u l e   1 : I f   Y 1   i s   D 1   a n d   Y 2   i s   E 1   a n d   Y 3   i s   F 1 ,           t h e n   Z 1   i s   G 1 ; R u l e   2 : I f   Y 1   i s   D 2   a n d   Y 2   i s   E 2   a n d   Y 3   i s   F 2 ,           t h e n   Z 1   i s   G 2 ; R u l e   n : I f   Y 1   i s   D n   a n d   Y 2   i s   E n   a n d   Y 3   i s   F n ,           t h e n   Z 1   i s   G n ;
where Y1, Y2, and Y3 represent the inputs; Z1 is the output; and Di, Ei, and Fi represent the fuzzy subsets defined by membership functions μDi, μEi, and μFi, respectively. Figure 7a,b shows the membership functions, which use triangular membership functions. The M rule is based on the Mamdani implication reasoning method to reason a set of disjunctive rules, which can be represented as follows:
μ G 0 Z   =   ( μ D 1 Y 1     μ E 1 Y 2     μ F 1 Y 3     μ G 1 Z )       ( μ D n Y 1     μ E n Y 2     μ F n Y 3     μ G n Z )
Figure 7c illustrates the flow chart using fuzzy logic theory. In this study, the fuzzy value is transformed into a clear output value by defuzzification. In addition, the center of gravity method is the most commonly used fuzzy output function defuzzification method in this research. Moreover, the fuzzy inference output μ G 0 Z i can be converted to the non-fuzzy value Z0, and its expression is as follows:
Z 0   =   i = 1 k Z i μ G 0 Z i i = 1 k μ G 0 Z i
Before fuzzy logic analysis, the initial SNR of the G, P, and SNR obtained in the Taguchi experiment should be normalized between 0 and 1 for the consideration of smaller ranges. The Y i k describes the S/N ratio of the G, P, and SNR, and k denotes the values of G, P, and SNR. The normalization can be represented as follows:
Y i ^ k   =   Y i k     m i n k Y i k m a x k Y i k m i n k Y i k
Figure 8 presents the schematic diagram of the flowchart for the Taguchi and fuzzy logic methods. The methods proposed to optimize the optical receiver are composed of the following steps:
(a)
Choose the orthogonal array L9(34) as the starting point of the Taguchi experiments.
(b)
Convert each quality feature to S/N (Table 3), and then normalize (Table 4).
(c)
Set the input and output membership functions and fuzzy rules (Table 5).
(d)
Start to calculate the fuzzy controller (fuzzy reference, defuzzification interface).
(e)
Calculate the values of MPCI (Table 6).
(f)
Perform an analysis of variance (ANOVA) on the main component points.
(g)
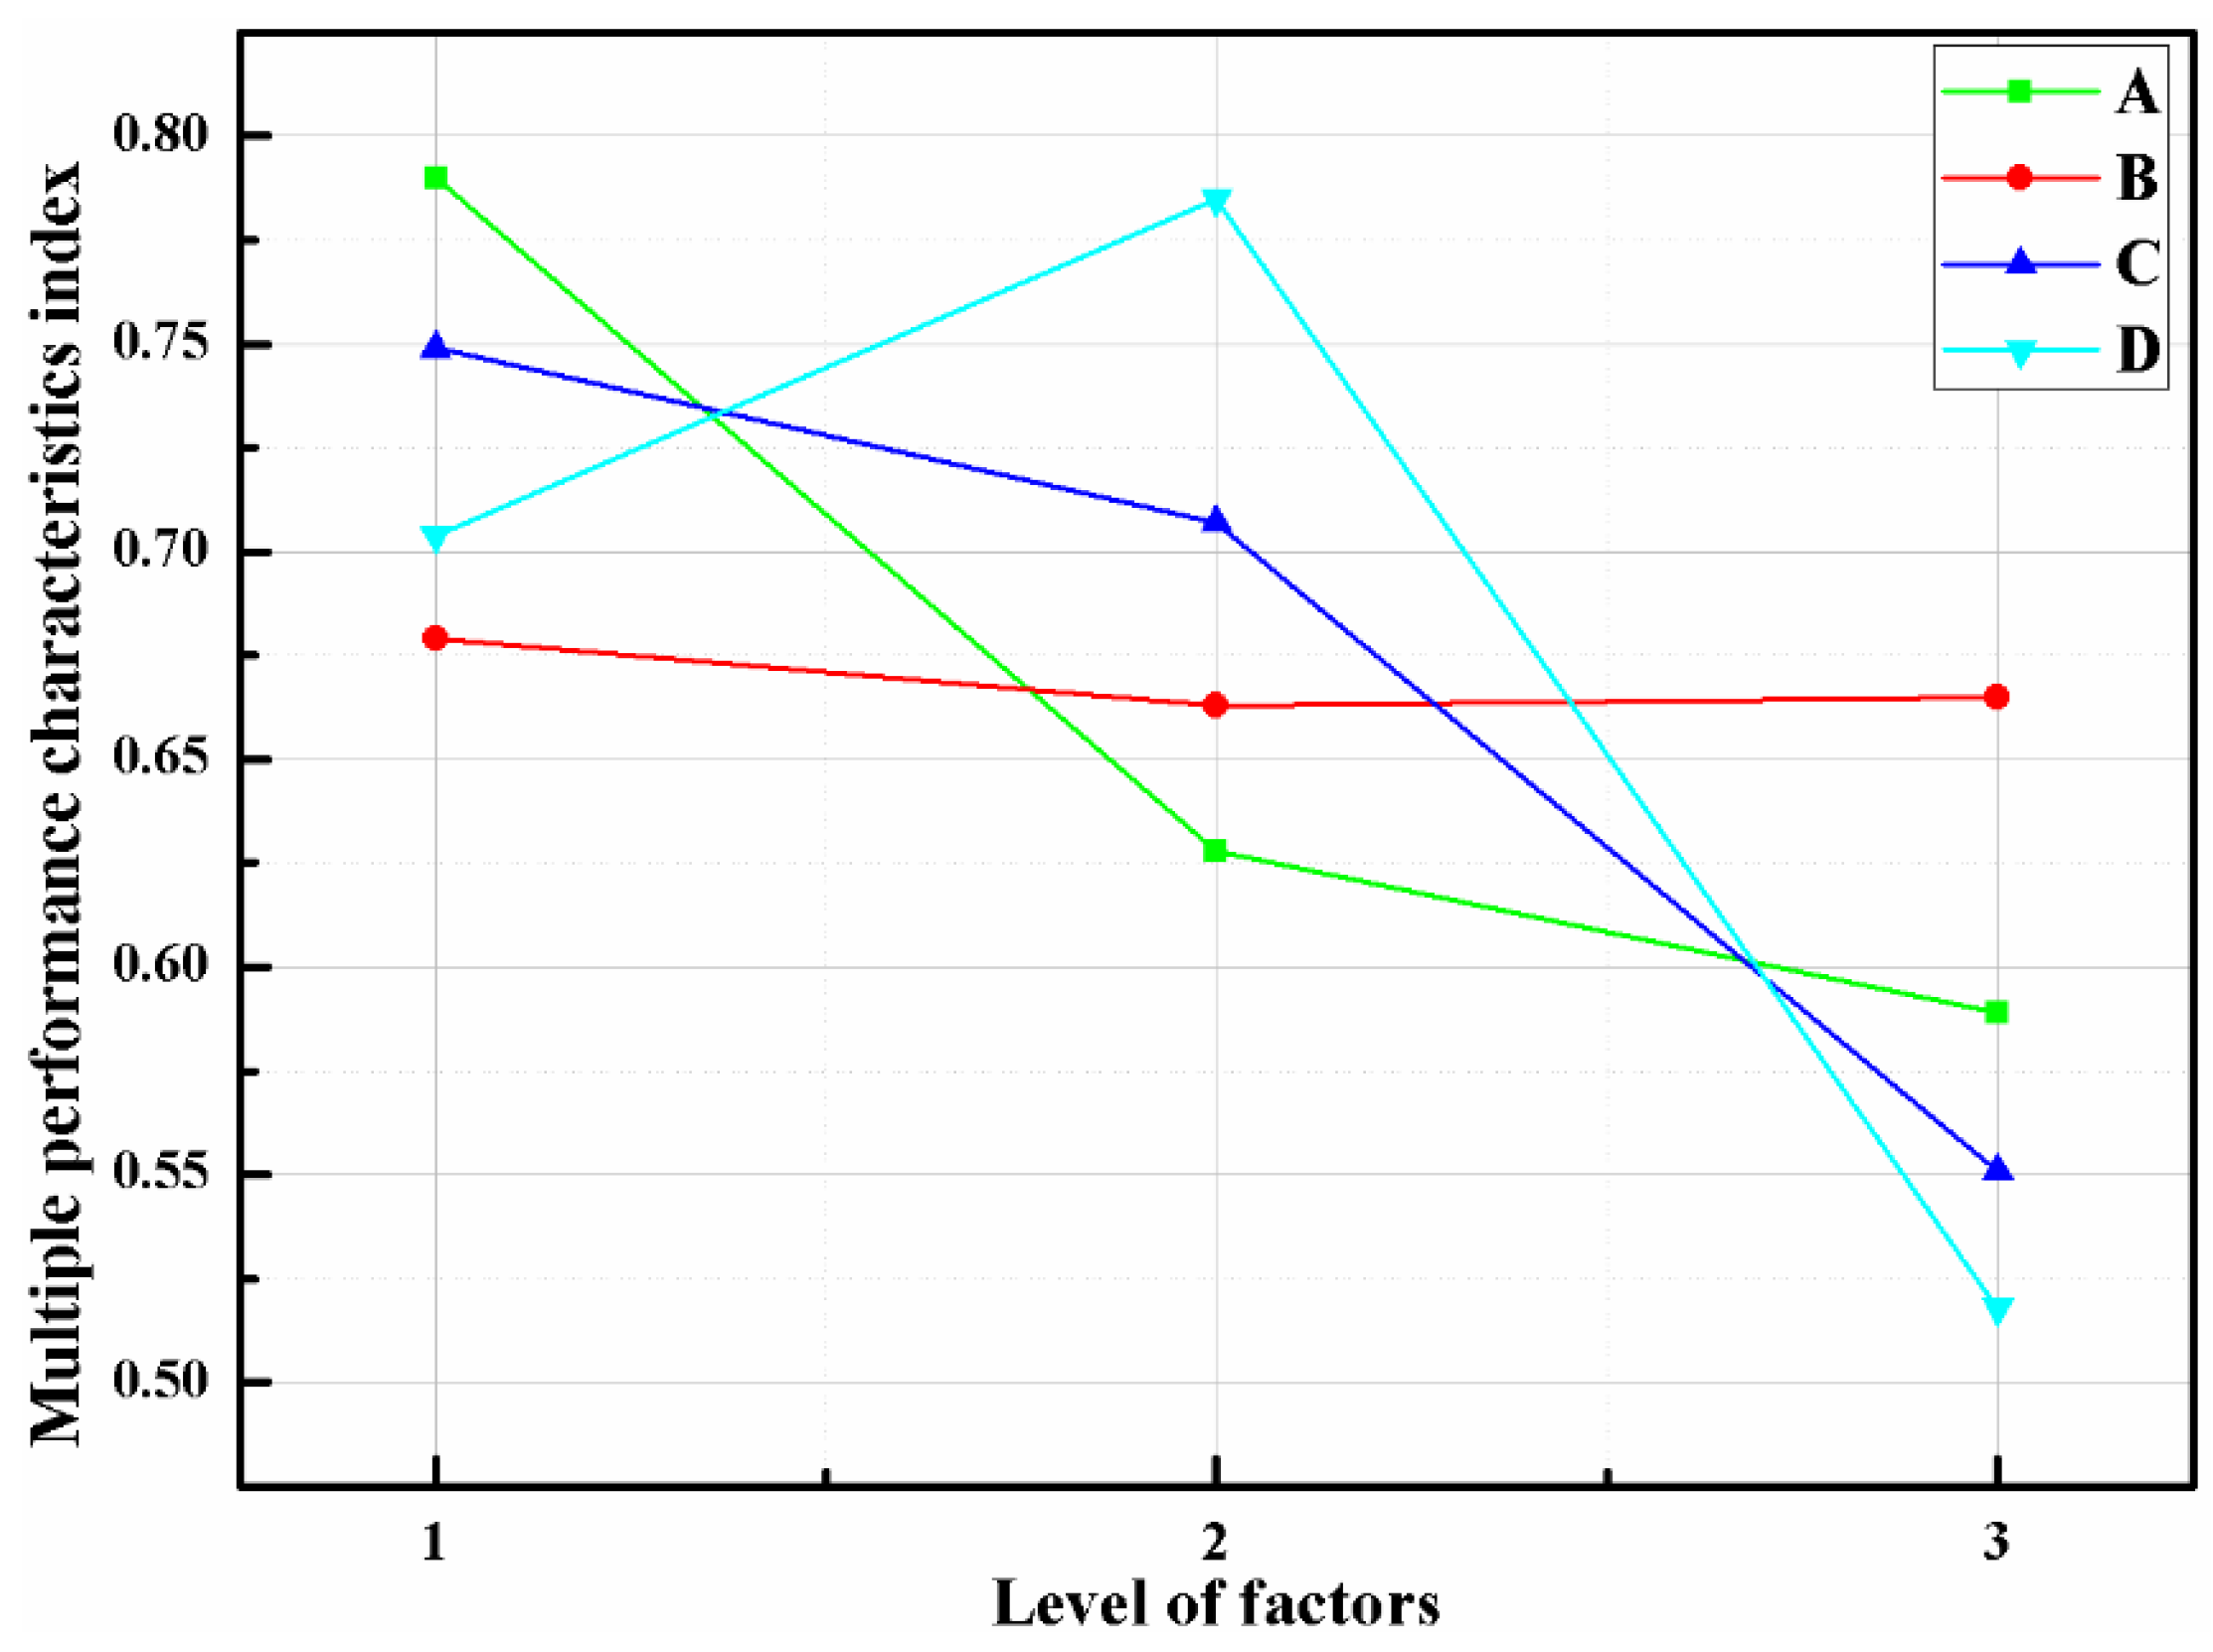
Draw MPCI response tables and charts to determine the best combination of parameters.
(h)
Perform confirmation tests.
Table 4 lists the normalized results of G, P, and SNR. In order to optimize the multiple performance characteristics of the optical receiver, the input of the fuzzy logic structure can be integrated as the total evaluation coefficient of the MPCI. As shown in Figure 7c, the G, P, and SNR are the input variables of the fuzzy logic unit for the final total of the MPCI value. There are three fuzzy sets for the inputs S, M, and L, while the outputs have nine sets: VS, NS, S, ND, M, HD, L, HL, and VL. Presented in Table 5 are the fuzzy rules used for the fuzzy logic controller. The MPCI values of the Taguchi experiments are presented in Table 6. For instance, Figure 9 describes the fuzzy logic reasoning procedures for the optical receiver; the normalization values of the G, P, and SNR are 0.035, 0.3, and 0, respectively, and the MPCI value is 0.525. Furthermore, as presented in Table 7, by calculating the average value of control factors A, B, C, and D on MPCI, the influence of them can be obtained conveniently. Figure 10 shows the response graph of the MPCI values with the control factors A (rotation angle β), B (bottom wall height H), C (spacing distance L), and D (hemispherical radius R) at the three-level settings. The results show that the optimal level of each control factor is A1 (β = 3°), B1 (H = 3.0 mm), C1 (L = 0), and D2 (R = 3.0 mm) for the maximum MPCI values. In addition, a larger MPCI value indicates a smaller difference in the performance characteristics. Meanwhile, the relative importance of the β, H, L, and R for the G, P, and SNR must be known, in order to determine the optimal parameter combinations more accurately.

3.3. Variance Analysis

Variance analysis can significantly separate the changes caused by experimental errors, and can determine the changes of various control factors [34]. The analysis of variance is similar to the “max–min” analysis shown in Table 7. The variance analysis results are presented in Table 8. Through the analysis of variance, we can see the influence of the control factors on a variety of performance characteristics. Factor D accounted for 39.23% of the total variance of MPCI. Meanwhile, the contribution of factors A, B, and C accounted for 29.46%, 2.34%, and 28.97%, respectively. In addition, the analysis results are similar to the results in Table 7.
As presented in Table 9, the optimum parameter combination is A1-B1-C1-D2. The confirmation operation of the initial structure and the optimized design structure of the optical receiver are compared. Figure 11 presents the sectional view of the CPC, the initial structure, and the optimally designed structure. The S/N ratios of the optimally designed optical receiver have increases of approximately 13.601, 11.097, and 0.373 corresponding to the G, P, and SNR, respectively. Figure 12 presents the optical efficiency data for different optical receiving devices in this study, which indicates that the optimally designed optical receiver has a significantly larger FOV. The optical efficiency remains at a fairly high level even though the incident angle is up to 45°. As the incidence angles are 35°, 40°, and 45°; the optical efficiencies of the initial structure are 0.92%, 0.12%, and 0.58%; and the optical efficiencies of the optimally designed structure are 56.70%, 48.97%, and 28.35%, respectively. The FOV of the optimally designed receiver can increase by nearly 40° over the initial structure. In addition, the spot areas of different conditions are shown in Figure 13. The energy received by the CPC is scattered in the surrounding area, and the uniformity of the spot energy distribution is poor. The initial structure has a smaller spot than the CPC, but the G is just 2.21. In comparison, the spot radius of the optimally designed optical receiver is just 2 mm, and the G is 10.57, which is 4.78 times the initial structure. Therefore, the above analysis results illustrate that the proposed optimization method can effectively obtain the optimum structure parameter combination of the optical receiver.

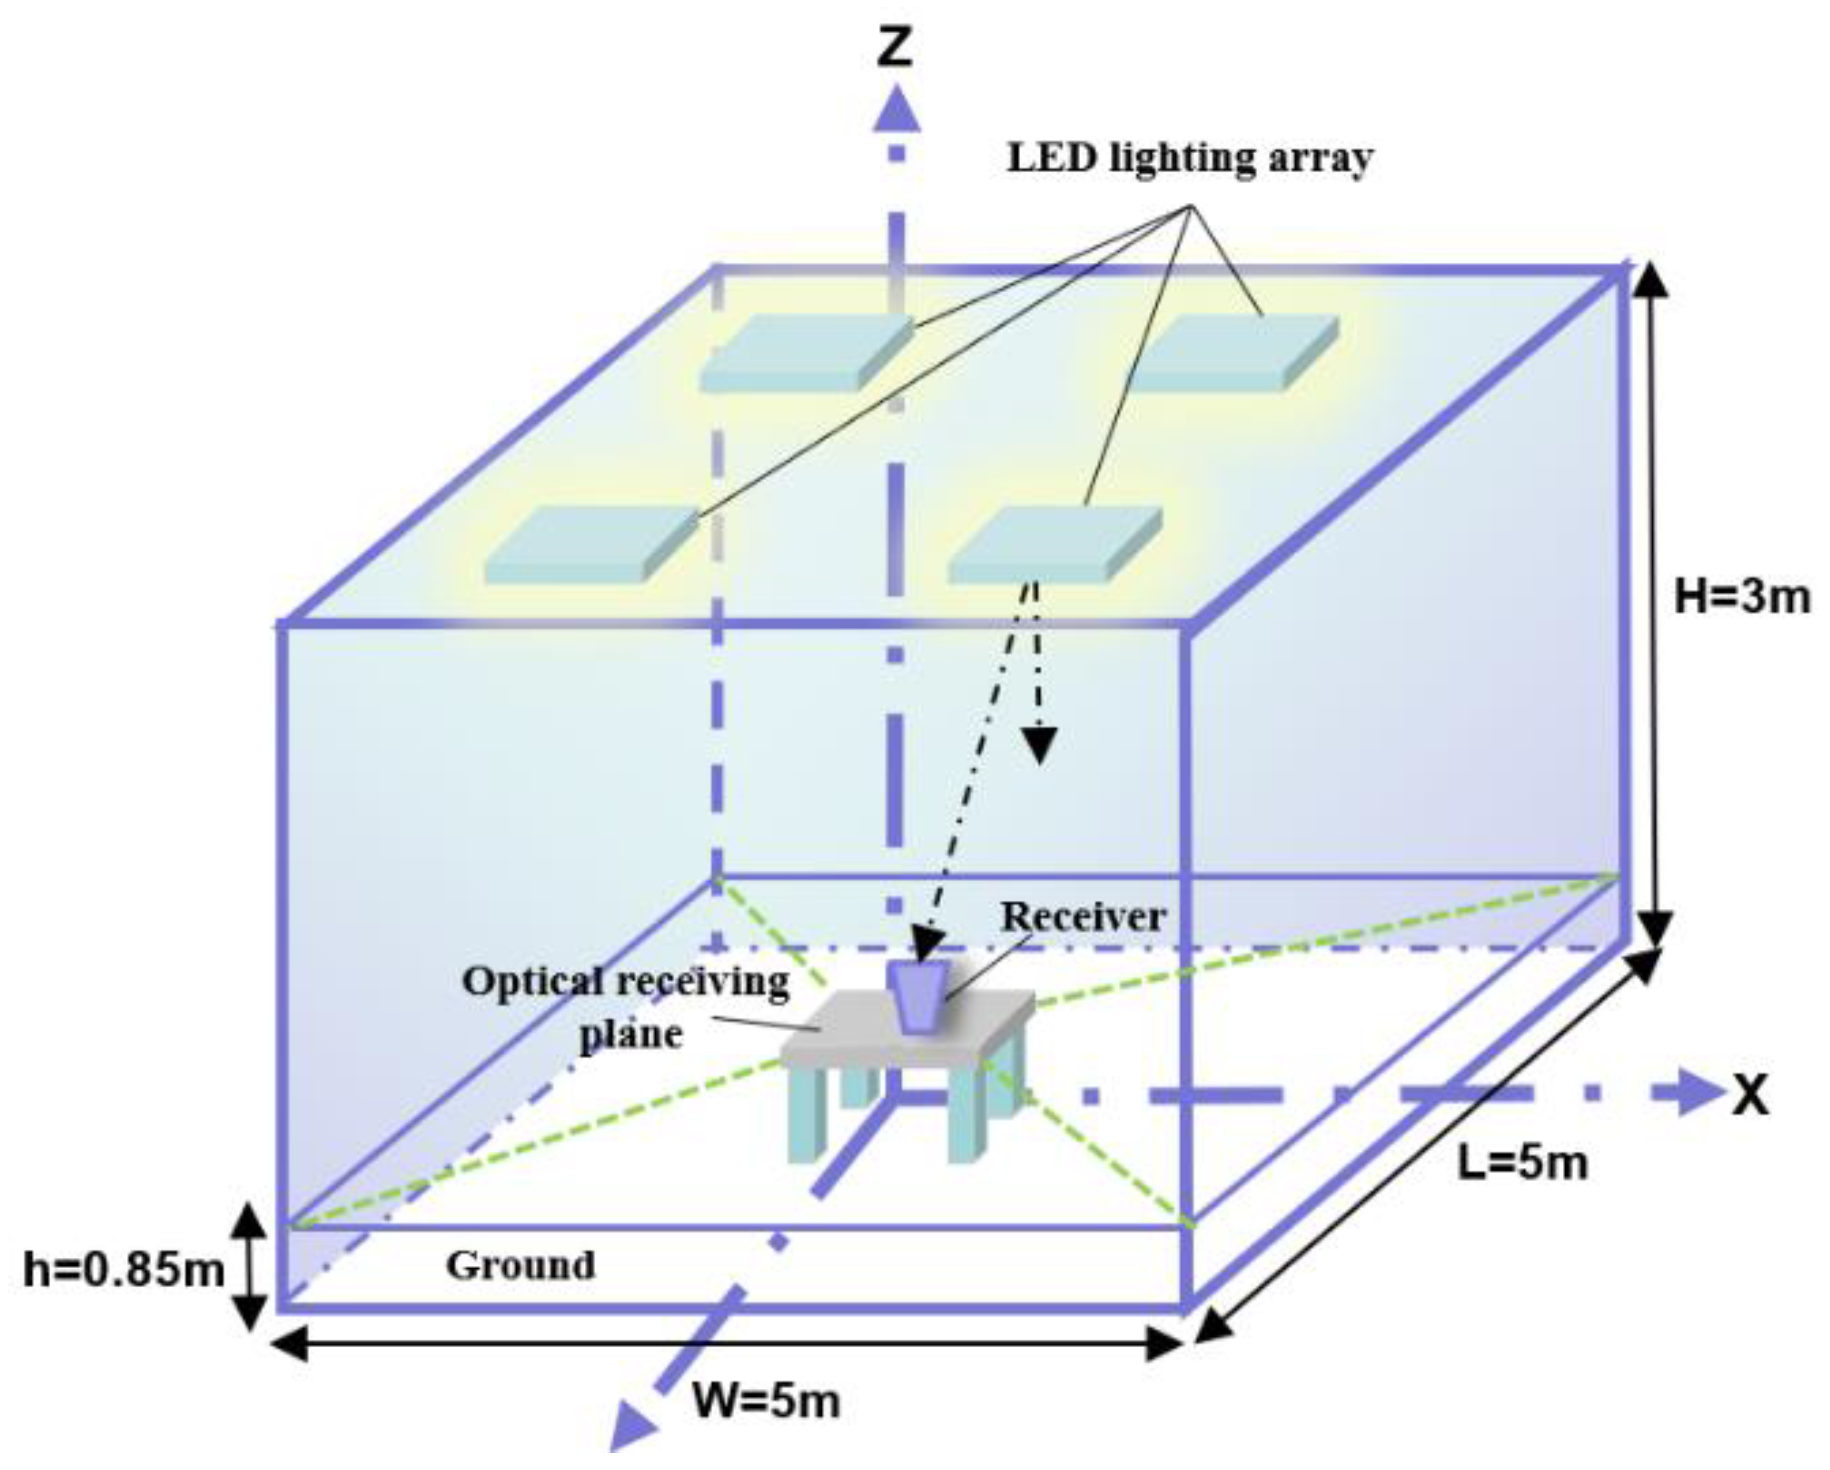
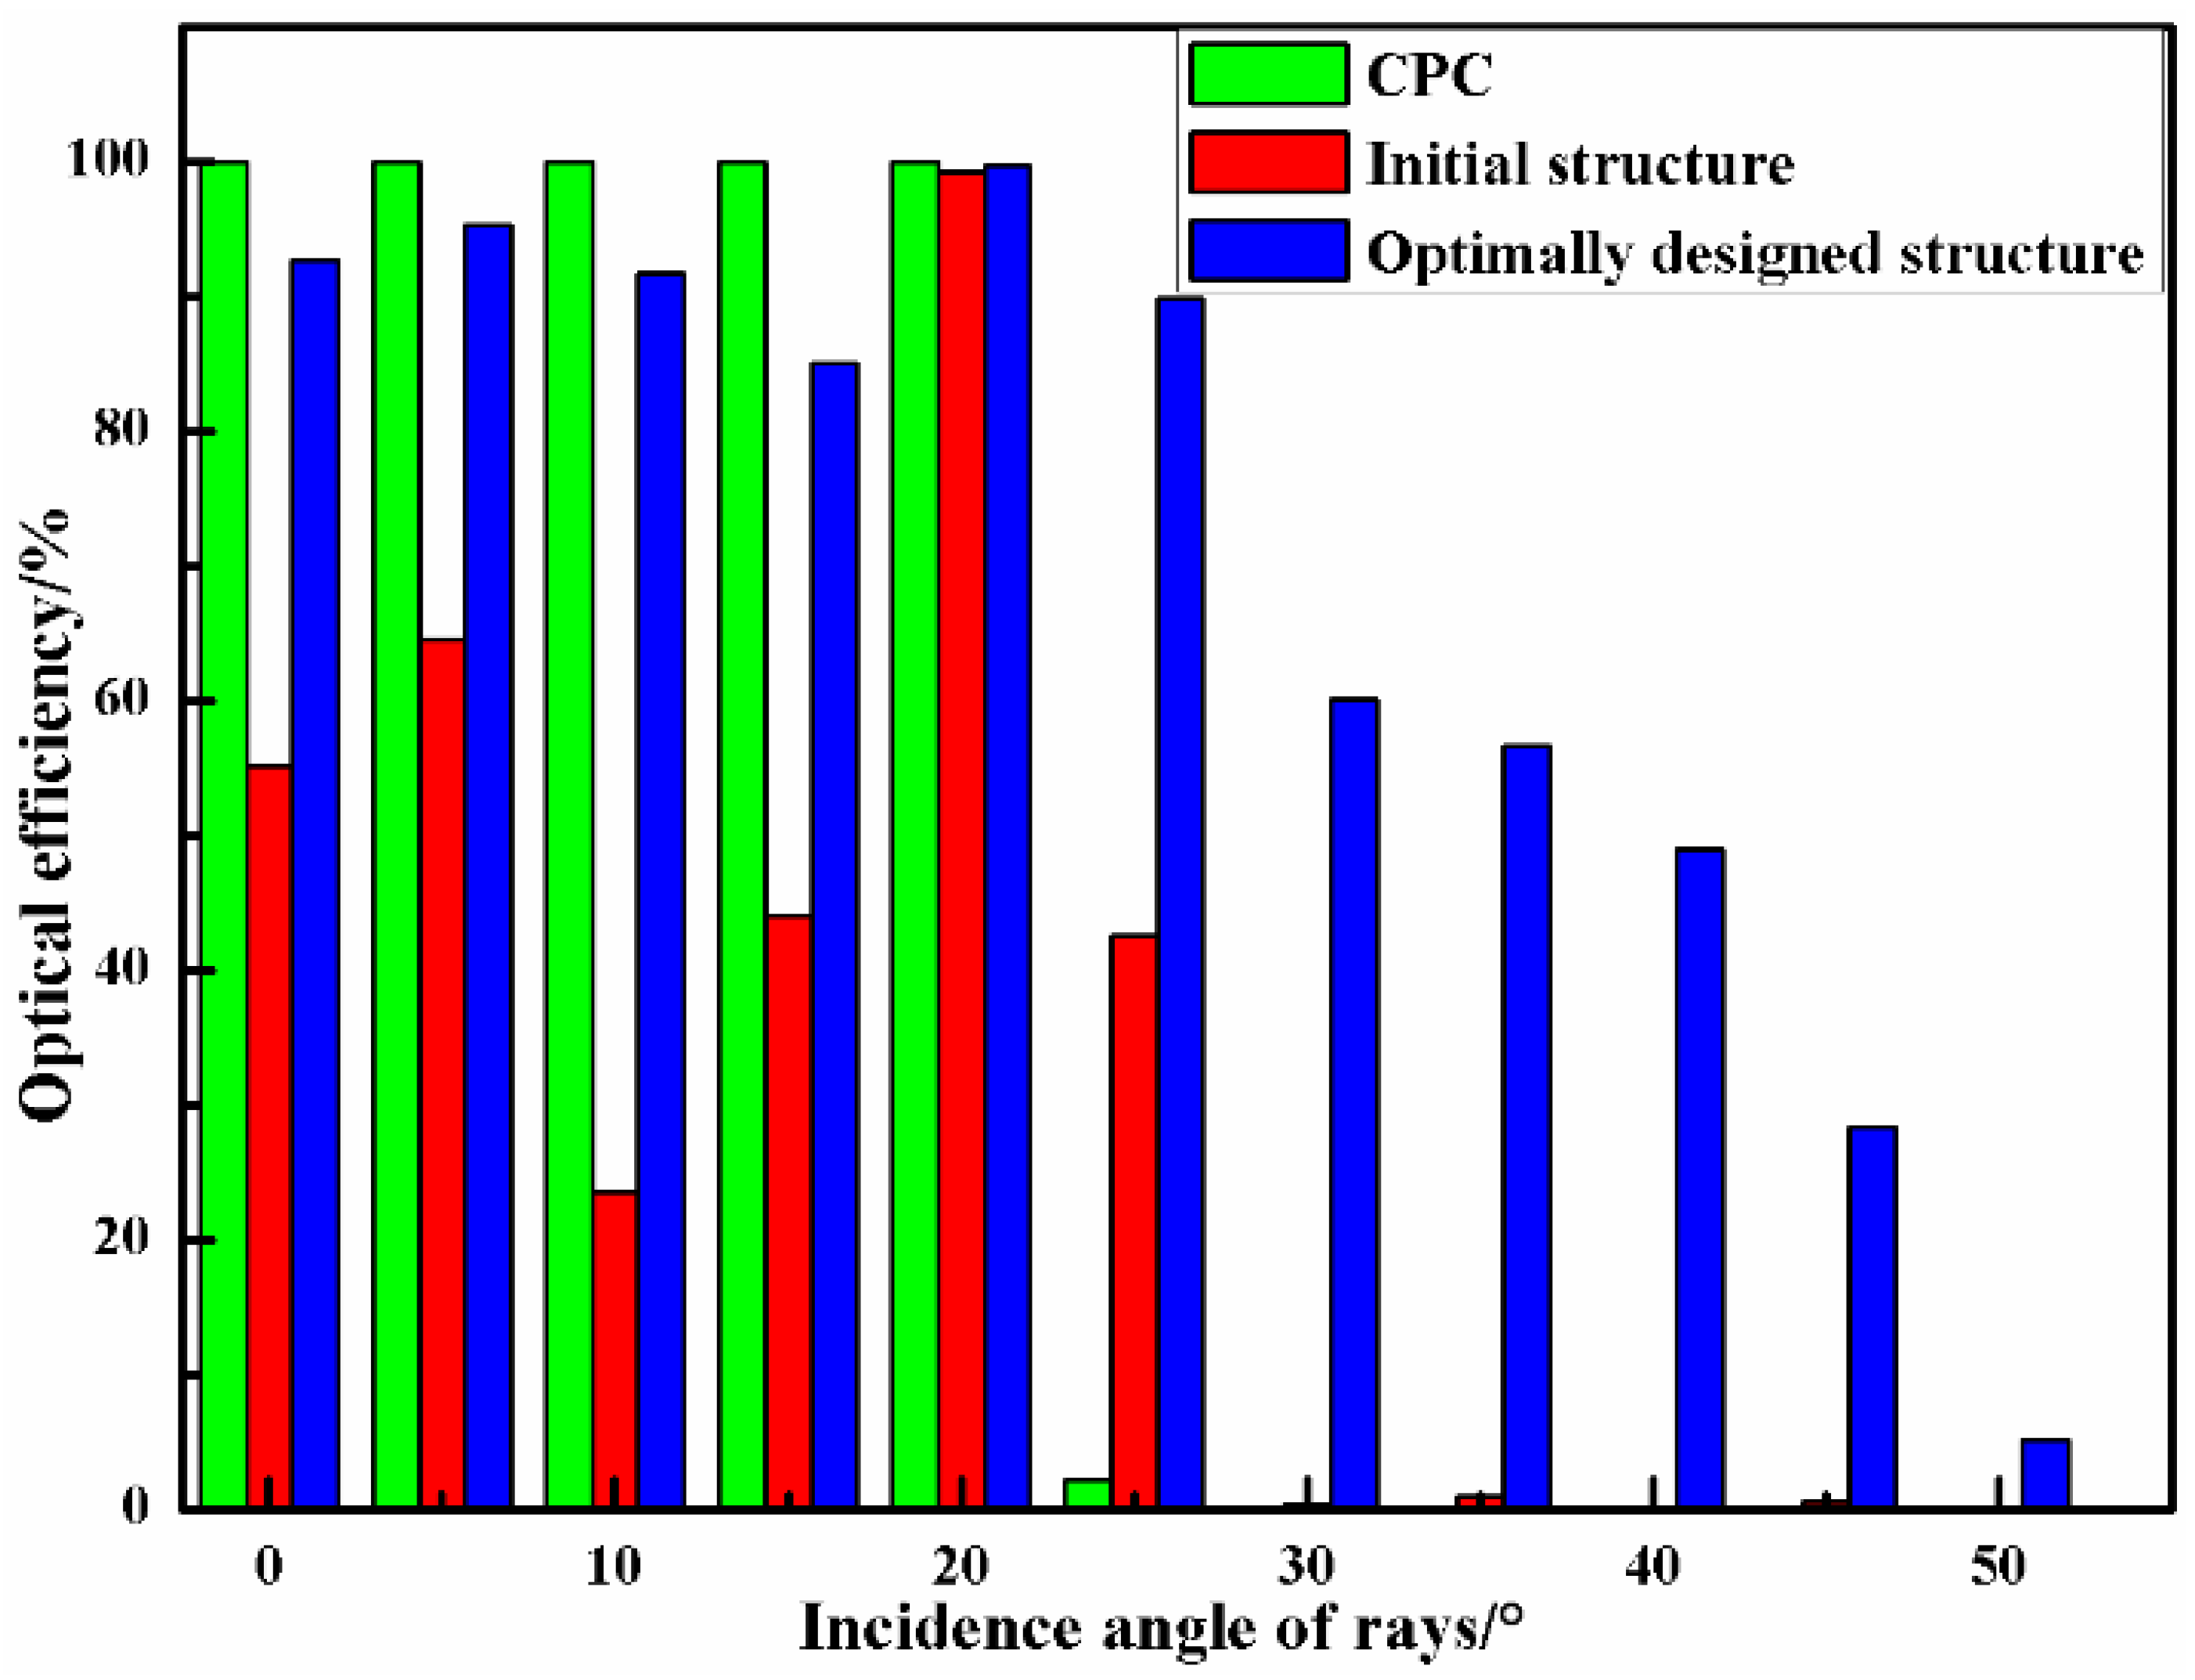
4. Channel Simulation and Analysis with the Optical Receiver

The software of Tracepro and Matlab were utilized to perform the channel modeling and analysis of the indoor VLC system. The LED arrays were set corresponding to the principle of the minimum mean square error of illumination [20], and the center coordinates of the four LED array units are A (0.815, 0.815), B (4.185, 0.815), C (4.185, 4.185) and D (0.815, 4.185), respectively.

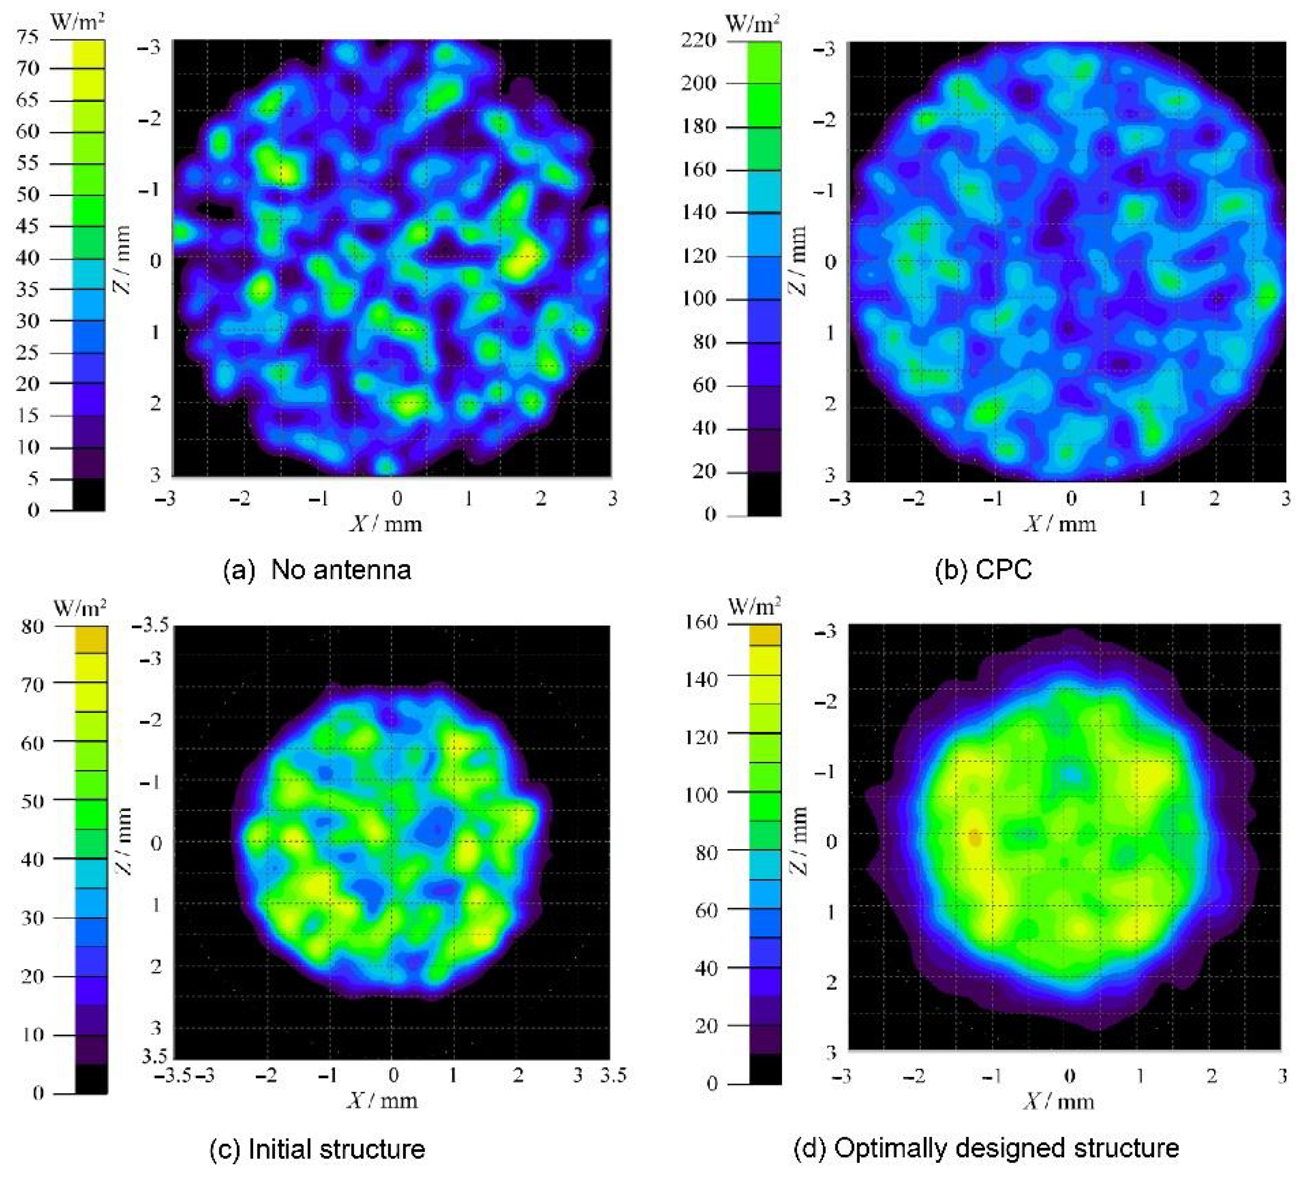
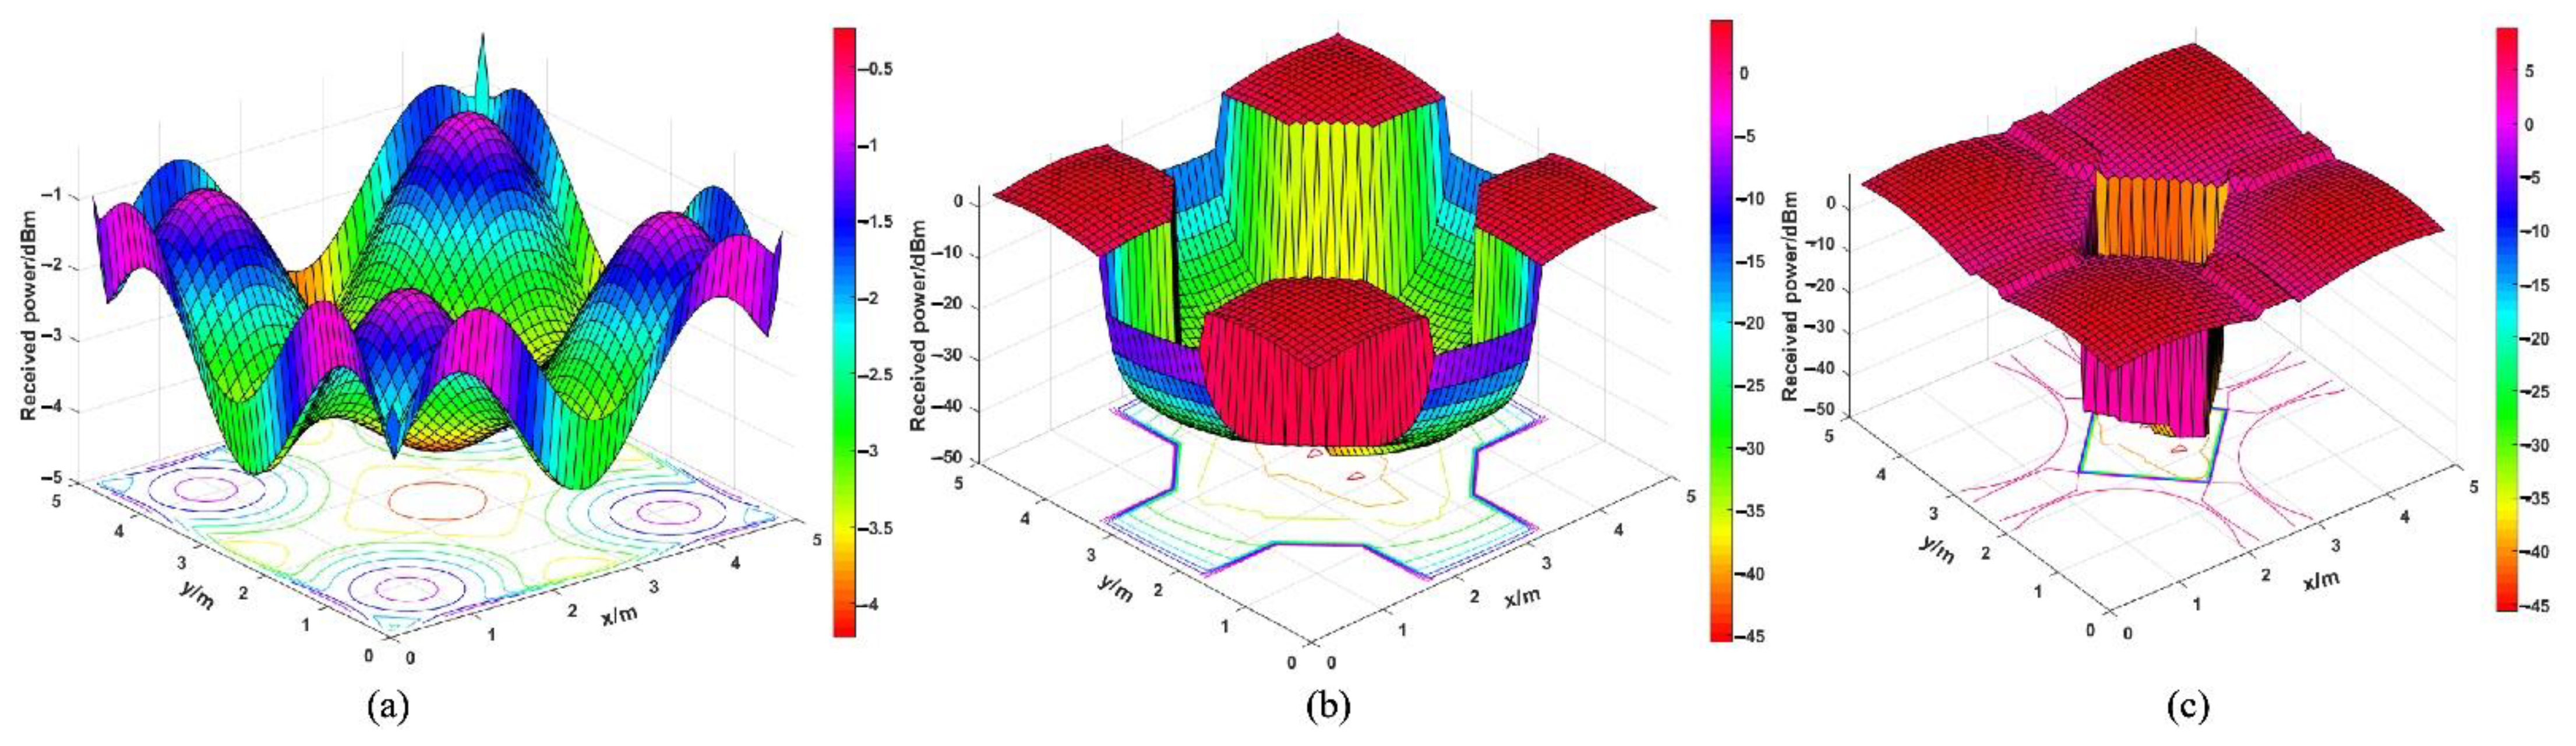
4.1. Analysis of the Optical Received Power

In the VLC system, LED lights have the function of illuminance and communication simultaneously; the gain of the channel is directly related to the impulse response, and can be represented as follows [25]:
H 0   =   h t d t
In an optical link, the channel DC gain can be expressed following Equation (17) [35]:
H L O S 0   =   i = 1 N m   +   1 A R 2 π L i 2 c o s m ( ϕ i ) T s θ i g ( θ i ) c o s ( θ i ) 0 , , 0     θ i     θ c θ i     θ c
where i is the i-th LED, TS(θi) is the filter gain, ϕi is the angle of irradiance, g(θi) is the DC gain of the concentrator, AR is the physical area of the detector in a PD, and θc is the HFOV of the optical receiving end. The optical concentrator can be expressed as follows [35]:
g θ i   =   n 2 s i n 2 ( θ c ) 0 , , 0     θ i     θ c θ i     θ c
where n represents the refractive index.
The received optical power can be expressed as follows:
P R ( L O S )   =   P S H L O S 0
where Ps represents the electric power of a single LED.
The direct line-of-sight (LOS) occupies more than 95% of the optical power, and a wall reflection accounts for probably 3.37%, while the secondary wall reflection only accounts for 1.27% of the non-direct line-of-sight (NLOS) based on the study of Toshihiko [35]. Therefore, the secondary wall reflection is negligible, and the gain of the channel can be represented by following Equation (20):
d H N L O S 0   =   i = 1 N m   +   1 A R 2 π D 1 , i 2 D 2 2 ρ c o s m ( ϕ i ) c o s ( γ 1 , i ) c o s ( γ 2 ) T S θ g ( θ ) c o s ( θ ) d A w a l l 0 , , 0     θ     θ i θ     θ i
where D1,i represents the distance between the i-th LED and a certain point on the wall, γ1,i is the angle between the light incident on the wall of the i-th LED emitting unit, ρ is the wall reflectivity, and dAwall is the reflective area of a small region.
The receiving power of the indoor VLC system can be represented as follows:
P R N L O S   =   P S d H N L O S 0
Thus, the total optical receiving power of the optical receiving system can be expressed as follows:
P   =   P S H L O S 0   +   P S d H N L O S 0
Figure 14 shows the received power distribution for different parameter combinations. It can be seen that different structure settings may have large differences regarding the optical received power. Table 10 presents the maximum, mean, and minimum values of the optical received power under different conditions. Figure 15a shows the power distribution in the room when the optical receiving antenna is not installed: the minimum value of the received power is −4.2258 dBm, the maximum value is −0.2428 dBm, and the mean value is −2.5052 dBm. The received power presents a received power distribution with lower power at the edge position, with higher values from the near position of the LEDs array in the room. A position close to the LED array has a smaller incidence angle of rays, such that the optical receiving system can receive more rays successfully. Figure 15b,c shows the received power distribution of the CPC and the optimally designed structure, respectively. When the optimal structure is utilized, the minimum value of the received power is 8.9900 dBm, the maximum value is −45.6190 dBm, and the mean value is 6.4635 dBm. Moreover, when compared with the initial structure, the mean received power increases by 458.80%, and the maximum value increases by 308.90%.
As the optimal receiving antenna has a large FOV and a uniform distribution of spot energy, the communication dead zone can be significantly reduced.

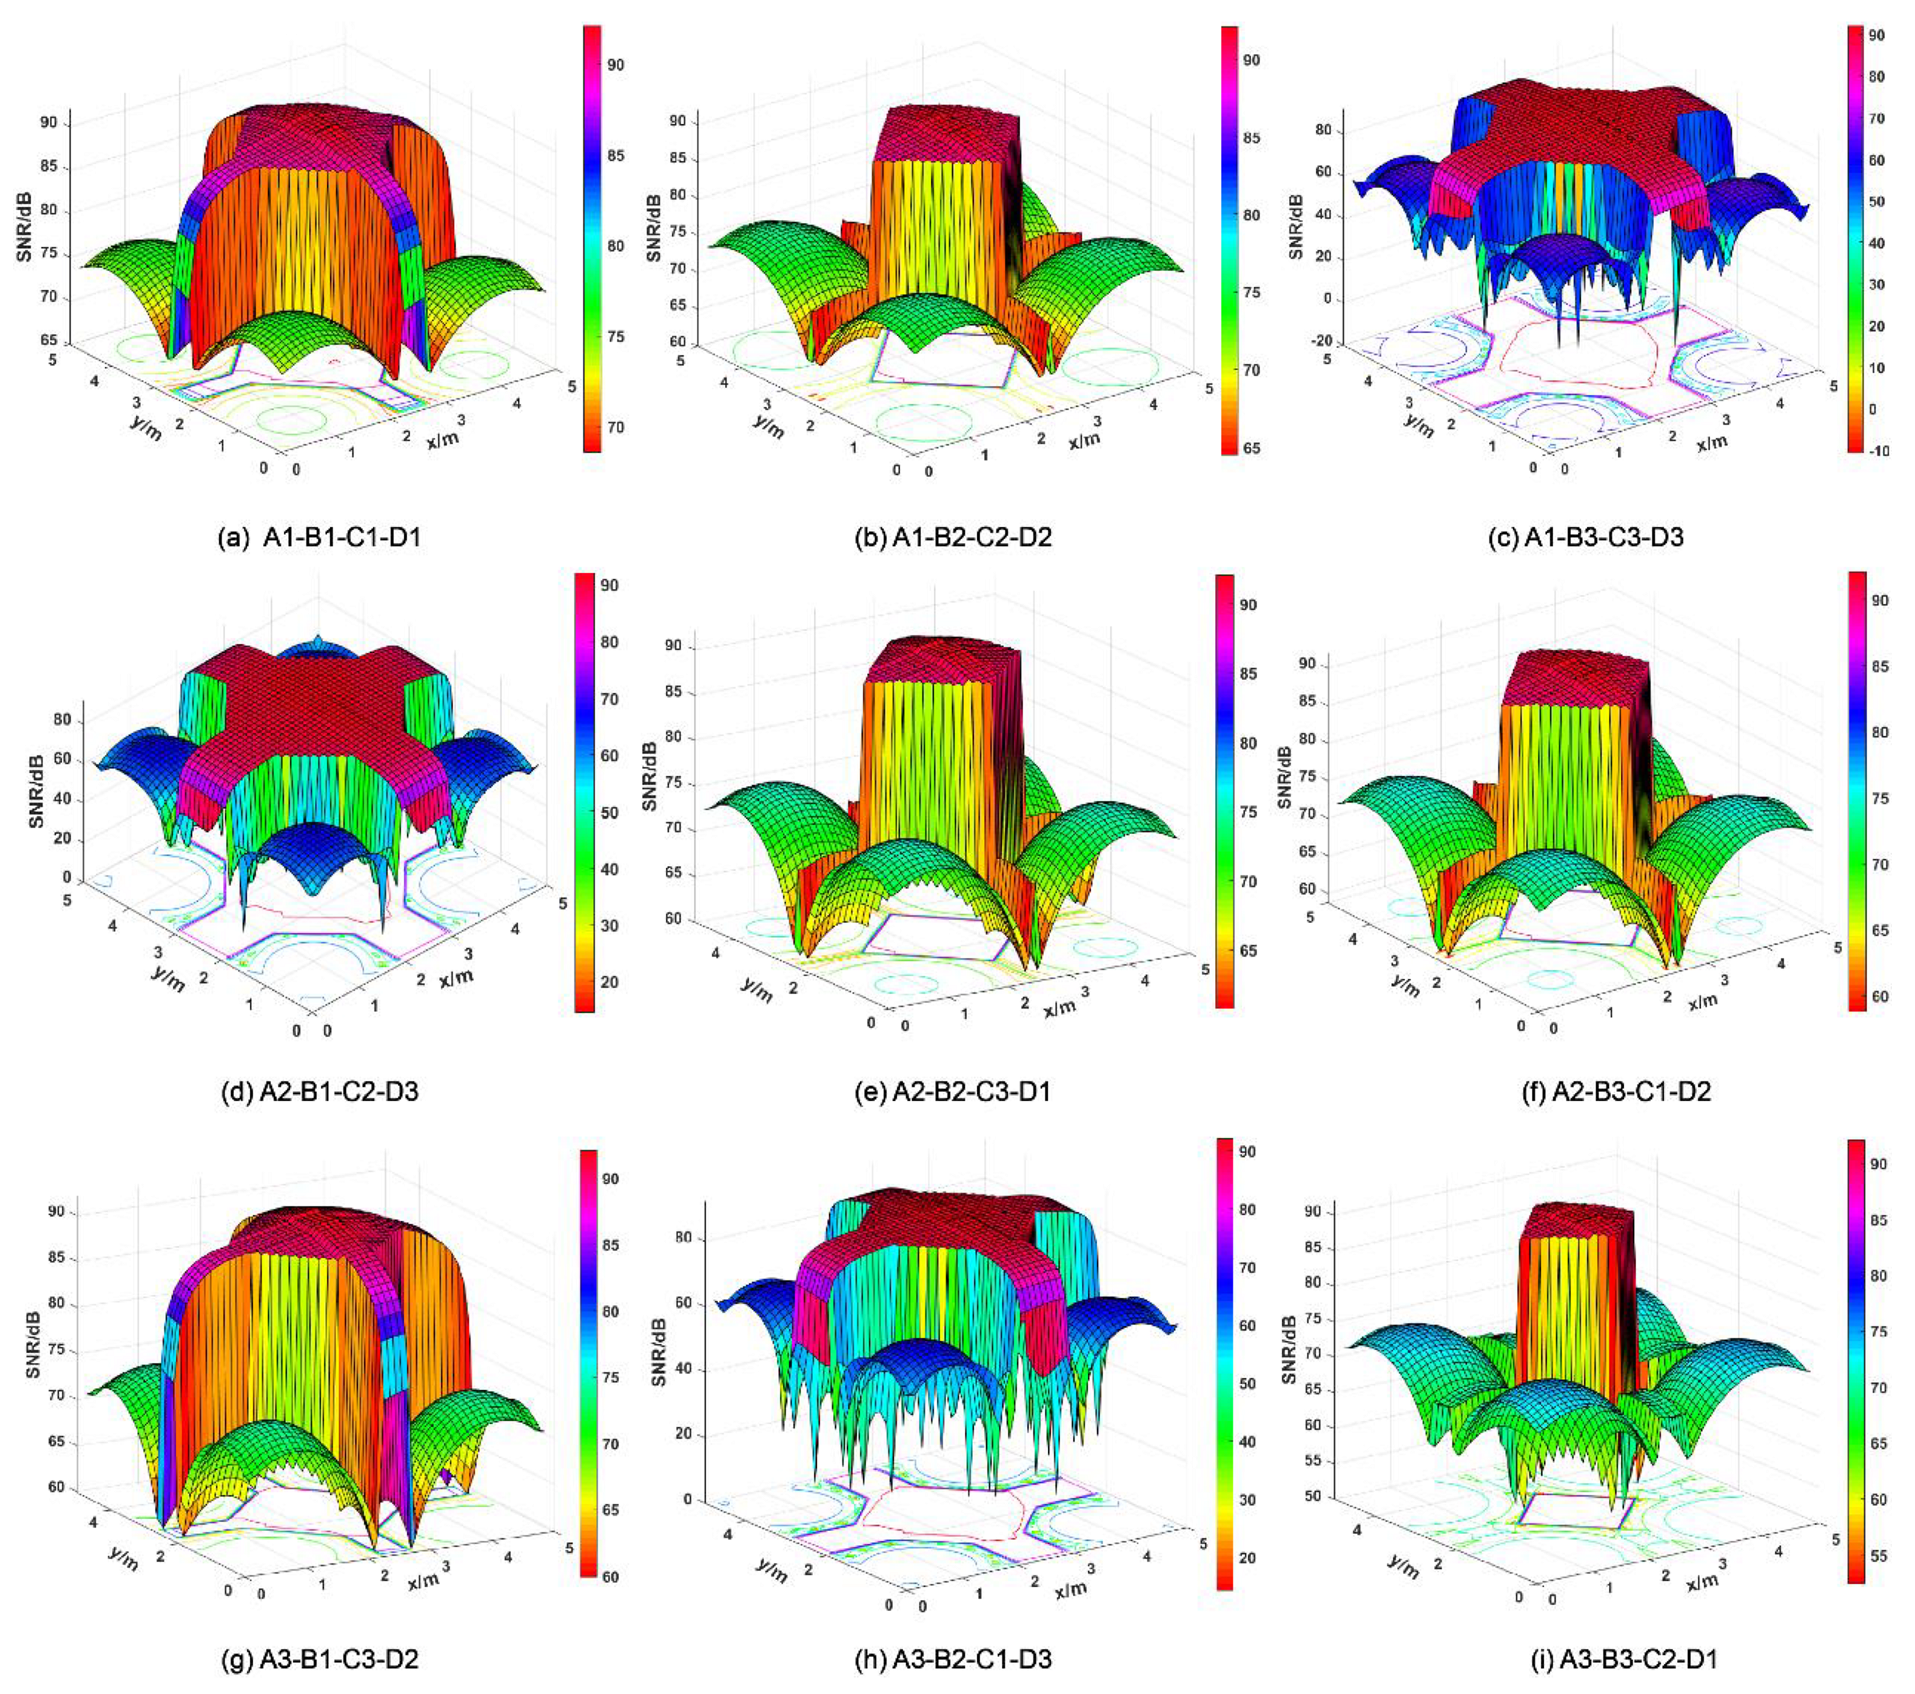
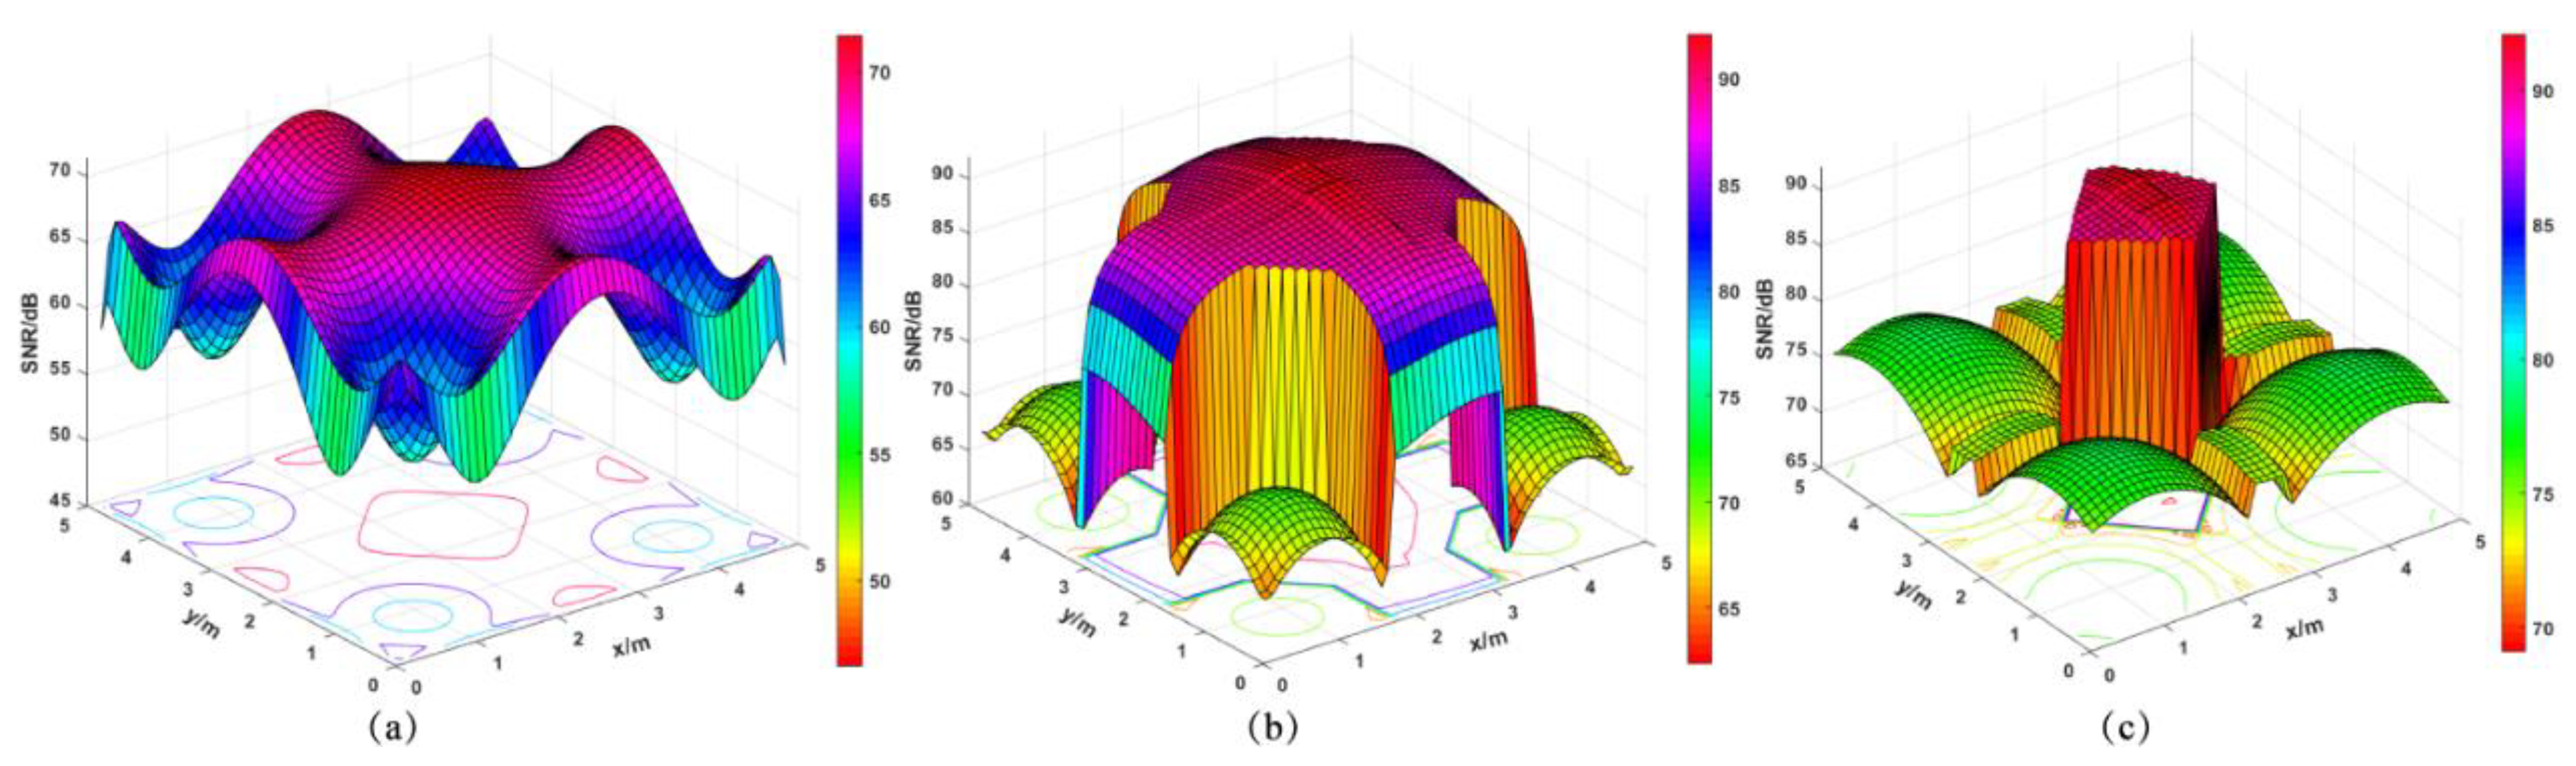
4.2. Analysis of the SNR Distribution

The noise of the indoor VLC system is mainly additive white Gaussian noise, including shot noise and pre-amplifier noise. The communication quality of the system is mainly affected by shot noise, and the photon generated by the background light is much larger than the signal itself. Therefore, the noise generated by the signal itself can be neglected when the background light is strong [36]. When the background light is weak, the pre-amplifier noise is mainly considered. Shot noise can be expressed as follows:
δ s h o t 2   =   2 q γ ( P R ( s i g n a l )   +   P R I S I ) B   +   2 q I b g I 2 B
where Ibg is the background current, I2 is noise bandwidth factors, B is the equivalent noise bandwidth, and q is the electronic charge.
The thermal noise is expressed as follows [36]:
δ t h e r m a l 2   =   8 π k T k η A R I 2 B 2 G   +   16 π 2 k T k Γ η 2 A R 2 I 3 B 3 / g m
where k is Boltzmann’s constant, gm is the FET transconductance, G is the open-loop voltage gain, Γ is the FET channel noise factor, and TK is the absolute temperature.
Thus, the total noise of the system can be obtained as follows:
N t o t a l   =   δ s h o t 2   +   δ t h e r m a l 2   +   γ 2 P R ( I S I )
Furthermore, the SNR expression of the indoor VLC system can be represented as:
S N R   =   γ 2 P R s i g n a l 2 δ s h o t 2   +   δ t h e r m a l 2   +   γ 2 P R ( I S I )
The simulation was conducted by using Matlab to compute the SNR distribution in the room according to Equation (26), and the specific values of the parameters are listed in Table 11, respectively.
The SNR in the three cases of an unmounted optical antenna, a mounted CPC, a mounted initial structure, and an optimally designed structure is obtained by calculation, as shown in Table 12. Figure 16 presents the SNR distribution for different parameter combinations. Figure 17a shows the SNR distribution in the room when the optical receiving antenna is not installed; the minimum value of the received power is −4.2258 dBm, the maximum value is −0.2428 dBm, and the mean value is −2.5052 dBm. Figure 17b,c shows the SNR distribution of the CPC and the optimally designed optical receiver, respectively. The SNR is calculated by Equation (22), and the results show that the maximum value of SNR is 92.1048 dB, the minimum value is 69.0869 dB, and the mean value is 89.8874 dB. Compared with the case of receiving rays directly without any antenna, the maximum SNR increases by 20.53%, the minimum SNR increases by 48.16%, and the mean SNR increases by 33.49%. Moreover, when compared with the initial structure, the minimum SNR increases by 377.38% and the mean SNR increases by 4.39%. In the OOK modulated VLC systems, the minimum required value of SNR is 13.6 dB [37]. As can be seen from Figure 17c, the SNR distribution in the room meets the communication requirements. The optimally designed structure with Taguchi and fuzzy logic methods can significantly ensure that more rays can be collected, and can improve the SNR performance.
Finally, the comparison of the optical receiver characteristics using the traditional CPC, the lens-walled structure, and the proposed system were investigated, as presented in Table 13. The relative parameters values of the proposed optical receiver are an FOV of 90°, an optical gain of 10.57, a spot size of 2 mm, a received power of 6.4635 dBm, and an SNR of 89.8874 dB, while those of the traditional CPC are 40°, 3.85, 3 mm, 0.3267 dBm and 68.5486 dB, and those of the lens-walled structure are 80°, 8.62, 4 mm, 5.9484 dBm and 82.8563 dB, respectively. This further proves that the proposed composite optical receiver based on the Taguchi and fuzzy logic methods can improve the optical characteristics and eusure better communication quality.

5. Conclusions

In this study, we investigated a composite optical receiver for indoor VLC systems, which can significantly extend the FOV and ensure better channel performance. Furthermore, the Taguchi and fuzzy logic combination method was proposed to improve multiple performance characteristics effectively in the optical receiver, and to meet the communication requirements in VLC. The effects of different β, H, L, and R on the improvement of the optical efficiency and the channel performance of an indoor VLC system using optical receivers were investigated. Meanwhile, the optical and channel performances of the CPC, the initial structure, and the optimized structure of the optical receiver were compared. The simulation results indicate that the optimum composite optical receiver is at the structure parameter combination of A1 (β = 3°), B1 (H = 3.0 mm), C1 (L = 0), and D2 (R = 3.0 mm), which can achieve a G of 10.57, an HFOV of 45°, a P of 6.4635 dBm, an SNR of 89.8874 dB, and a spot size of 2 mm. The FOV increased by 80.00% in comparison with the initial structure, and the mean received power rose by 458.80%. Furthermore, the SNR rises by 33.49% in comparison with directly receiving lights. Therefore, the optical receiver optimally designed by Taguchi and the fuzzy logic methods can significantly meet the requirements of an indoor VLC system.

Author Contributions

N.W.: Conceptualization, Investigation, Validation, Writing–Review and Editing; X.P.: Conceptualization, Methodology, Investigation, Validation, and Writing—original draft; L.K.: Writing–Review and Editing, Supervision, Funding acquisition. All authors have read and agreed to the published version of the manuscript.

Funding

No funding for this work.

Institutional Review Board Statement

Not applicable.

Informed Consent Statement

Not applicable.

Data Availability Statement

The data presented in this study are available in this published article.

Conflicts of Interest

The authors declare that they have no known competing financial interests or personal relationships that could have appeared to influence the work reported in this paper.

References

  1. Sun, X.; Kong, L.; Xu, M. Uniform Illumination for Nonplanar Surface Based on Freeform Surfaces. IEEE Photonics J. 2019, 11, 1–11. [Google Scholar] [CrossRef]
  2. Sun, X.; Kong, L.; Zhou, P.; Xu, M. A design of compound tailored illumination by a total-internal-reflection lens for machine vision. Light. Res. Technol. 2021, 0, 1–17. [Google Scholar] [CrossRef]
  3. Liu, X. Gbps Long-Distance Real-Time Visible Light Communications Using a High-Bandwidth GaN-Based Micro-LED. IEEE Photonics J. 2017, 9, 1–9. [Google Scholar] [CrossRef]
  4. Gao, Q.; Gong, C.; Xu, Z.Y. Joint transceiver and offset design for visible light communications with input-dependent shot noise. IEEE Trans. Wirel. Commun. 2017, 16, 2736–2747. [Google Scholar] [CrossRef] [Green Version]
  5. Barolet, D. Light-emitting diodes (LEDs) in dermatology. Semin. Cutan. Med. Surg. 2008, 27, 227–238. [Google Scholar] [CrossRef]
  6. Li, X.; Hussain, B.; Wang, L.; Jiang, J.; Yue, C.P. Design of a 2.2-mW 24-Mb/s CMOS VLC Receiver SoC with Ambient Light Rejection and Post-Equalization for Li-Fi Applications. J. Lightwave Technol. 2018, 36, 2366–2375. [Google Scholar] [CrossRef]
  7. Yang, J. Highly Uniform White Light-Based Visible Light Communication Using Red, Green, and Blue Laser Diodes. IEEE Photonics J. 2018, 10, 1–8. [Google Scholar] [CrossRef]
  8. Arnon, S. Optimised optical wireless car-to-traffic-light communication. Trans. Emerg. Telecommun. Technol. 2014, 25, 660–665. [Google Scholar] [CrossRef]
  9. Hou, Y.A.; Xiao, S.L.; Zheng, H.F.; Hu, W.S. Multiple Access Scheme Based on Block Encoding Time Division Multiplexing in an Indoor Positioning System Using Visible Light. J. Opt. Commun. Netw. 2015, 7, 489–495. [Google Scholar] [CrossRef]
  10. Gismalla1, M.S.M.; Abdullah, M.F.L.; Ahmed, M.S.; Mabrouk, W.A.; AL-Fadhali, N.; Saeid, E.; Supa’at, A.S.M.; Das, B. Design and Analysis of Different Optical Attocells Deployment Models for Indoor Visible Light Communication System. Int. J. Integr. Eng. 2021, 13, 253–264. [Google Scholar] [CrossRef]
  11. Gismalla, M.S.M.; Abdullah, M.F.L.; Das, B.; Mabrouk, W.A.; Mahfouz, N.E. Design of an optical attocells configuration for an indoor visible light communications system. Int. J. Electron. Commun. 2019, 112, 152946. [Google Scholar] [CrossRef]
  12. Yaqoob, I.; Hashem, I.A.T.; Mehmood, Y. Enabling communication technologies for smart cities. IEEE Commun. Mag. 2017, 55, 112–120. [Google Scholar] [CrossRef]
  13. Li, T.; An, C.; Tian, Z. Human sensing using visible light communication. In Proceedings of the ACM 21st Annual International Conference on Mobile Computing and Networking, Paris, France, 7–11 September 2015; pp. 331–344. [Google Scholar]
  14. Tang, X.; Le, M.H.; Viriyasitavat, W. Car-to-Car Visible Light Communications. In Visible Light Communications; CRC Press: Boca Raton, FL, USA, 2017. [Google Scholar]
  15. Luo, J.; Fan, L.; Li, H. Indoor positioning systems based on visible light communication: State of the art. IEEE Commun. Surv. Tutor. 2017, 19, 2871–2893. [Google Scholar] [CrossRef]
  16. Huang, N.; Wang, X.D.; Chen, M. Transceiver Design for MIMO VLC Systems with Integer-Forcing Receivers. IEEE J. Sel. Areas Commun. 2017, 36, 66–77. [Google Scholar] [CrossRef]
  17. Wang, D.; Lan, T. Design of a gradient-index lens with a compound parabolic concentrator shape as a visible light communication receiving antenna. Appl. Opt. 2018, 57, 1510–1517. [Google Scholar] [CrossRef] [PubMed]
  18. Zhang, X.B.; Tang, Y.; Cui, L. Continuous zoom antenna for mobile visible light communication. Appl. Opt. 2015, 54, 9606–9612. [Google Scholar] [CrossRef] [PubMed]
  19. Wang, Y.; Lan, T.; Ni, G.Q. Optical receiving system based on a compound parabolic concentrator and a hemispherical lens for visible light communication. Appl. Opt. 2016, 55, 10229–10238. [Google Scholar] [CrossRef]
  20. Wang, Y.; Lan, T.; Li, X. Design research and performance analysis of compound parabolic concentrators as optical antennas in visible light communication. Acta Phys. Sin. 2015, 64, 124212. [Google Scholar] [CrossRef]
  21. Wang, Y.; Lan, T.; Ni, G.Q. Design and analysis of composite optical receiver for indoor visible light communication. Acta Phys. Sin. 2017, 66, 084207. [Google Scholar] [CrossRef]
  22. Peng, X.; Kong, L. Design and optimization of optical receiving antenna based on compound parabolic concentrator for indoor visible light communication. Opt. Commun. 2020, 44, 125447. [Google Scholar] [CrossRef]
  23. Yu, M.Y.; Yang, H.J.; Jiang, P. On-axial defocused characteristic analysis for Cassegrain antenna in optical communication. Optik 2016, 127, 1734–1737. [Google Scholar] [CrossRef]
  24. Li, X.; Lan, T.; Wang, Y.; Wang, L.H. Design and study of Fresnel lens for an antenna in indoor visible light communication system. Acta Phys. Sin. 2015, 64, 024201. [Google Scholar]
  25. Wei, X.H.; He, Y.H.; Liu, Z.K. Fizeau interferometer with binary phase Fresnel-zone plate reference for precision measurement of large convex lens. Opt. Lasers Eng. 2018, 110, 348–355. [Google Scholar] [CrossRef]
  26. Yin, P.; Xu, X.P.; Jiang, Z.G. Design and Performance Analysis of Planar Concentrators as Optical Antennas in Visible Light Communication. Acta Opt. Sin. 2018, 38, 0406004. [Google Scholar]
  27. Li, L.F.; Wang, B.; Pottas, J. Design of a compound parabolic concentrator for a multi-source high-flux solar simulator. Sol. Energy 2019, 183, 805–811. [Google Scholar] [CrossRef]
  28. Winston, R. Principles of solar concentrators of a novel design. Sol. Energy 1974, 16, 89–95. [Google Scholar] [CrossRef]
  29. Ni, X.S.; Zhou, Z.G.; Wen, X.W. The use of Taguchi method to optimize the laser welding of sealing neuro-stimulator. Opt. Lasers Eng. 2011, 49, 297–304. [Google Scholar]
  30. Hernandez, B.A.; Gill, H.S.; Gheduzzi, S. Laser parameters optimization of surface treating of Al 6082-T6 with Taguchi method. Opt. Laser Technol. 2019, 120, 105714. [Google Scholar]
  31. Parinam, S.; Kumar, M.; Kumari, N. An improved optical parameter optimisation approach using Taguchi and genetic algorithm for high transmission optical filter design. Optik 2019, 182, 382–392. [Google Scholar] [CrossRef]
  32. Xie, H.L.; Wei, J.J.; Wang, Z.X. Design and performance research on eliminating multiple reflections of solar radiation within compound parabolic concentrator (CPC) in hybrid CPV/T system. Sol. Energy 2016, 129, 126–146. [Google Scholar] [CrossRef]
  33. Jean, M.D.; Lin, B.T.; Chou, J.H. Design of a fuzzy logic approach for optimization reinforced zirconia depositions using plasma sprayings. Surf. Coat. Technol. 2006, 201, 3129–3138. [Google Scholar] [CrossRef]
  34. Sun, J.H.; Fang, Y.C.; Hsueh, B.R. Combining Taguchi with fuzzy method on extended optimal design of miniature zoom optics with liquid lens. Optik 2012, 123, 1768–1774. [Google Scholar] [CrossRef]
  35. Ergun, B.; Sahin, C.; Ustuntas, T. Segmentation and determination of grid points of curve points in terrestrial laser scanning data for regular curve surfaces via C-means integrated fuzzy logic approach. Opt. Lasers Eng. 2014, 52, 261–268. [Google Scholar] [CrossRef]
  36. Tarng, Y.S.; Yang, W.H.; Juang, S.C. The Use of Fuzzy Logic in the Taguchi Method for the Optimisation of the Submerged Arc Welding Process. Int. J. Adv. Manuf. Technol. 2000, 16, 688–694. [Google Scholar] [CrossRef]
  37. Komine, T.; Nakagawa, M. Fundamental analysis for visible-light communication system using LED lights. IEEE Trans. Consum. Electron. 2004, 50, 100–107. [Google Scholar] [CrossRef]
Figure 1. Schematic diagram of the proposed composite optical receiver. FS: first stage of the receiver; SS: second stage of the receiver; AB: incident plane; DC: exit facet of the FS; a: inlet radius; b: outlet radius; β: rotation degree of the FS; H: bottom wall’s height of the FS; L: spacing distance between the FS and SS; R: hemispherical radius of the SS.
Micromachines 12 01434 g001
Figure 2. Diagram of the HL.
Micromachines 12 01434 g002
Figure 3. The communication model in the VLC systems.
Micromachines 12 01434 g003
Figure 4. S/N ratio of the different characteristics. (a) S/N ratio of the G at different levels; (b) S/N ratio of the P at different levels; (c) S/N ratio of the SNR at different levels.
Micromachines 12 01434 g004
Figure 5. Diagram of the received irradiance distribution for the different parameter combinations of the optical receiver.
Micromachines 12 01434 g005
Figure 6. The relationship between the light efficiency and the incident angle under different structural settings of the optical receiver.
Micromachines 12 01434 g006
Figure 7. Membership functions for the quality characteristics of the G, P, and SNR (a); membership functions for the multi-response performance index (b); structure of the fuzzy logic unit (c).
Micromachines 12 01434 g007
Figure 8. Schematic diagram of the flowchart for the Taguchi and fuzzy logic methods.
Micromachines 12 01434 g008
Figure 9. The fuzzy logic reasoning procedures for the optical receiver.
Micromachines 12 01434 g009
Figure 10. Response graph of the MPCI values with the control factors A (rotation angle β), B (bottom wall height H), C (spacing distance L), and D (hemispherical radius R) at the three level settings.
Micromachines 12 01434 g010
Figure 11. The sectional view of the following optical receiver structures: (a) CPC; (b) initial structure; (c) optimally designed structure.
Micromachines 12 01434 g011
Figure 12. Optical efficiency comparison of the CPC, initial structure, and optimally designed structure for the optical receiver.
Micromachines 12 01434 g012
Figure 13. Diagram of the spot areas: no receiver (a); CPC (b); initial structure (c); optimally designed structure (d).
Micromachines 12 01434 g013
Figure 14. Diagram of the received power distribution for different parameter combinations.
Micromachines 12 01434 g014
Figure 15. Diagram of the received power distribution: no antenna (a), the initial structure (b), the optimally designed structure (c).
Micromachines 12 01434 g015
Figure 16. Diagram of the SNR distribution for different parameter combinations.
Micromachines 12 01434 g016
Figure 17. Diagram of the SNR distribution: no antenna (a), the initial structure (b), the optimally designed structure (c).
Micromachines 12 01434 g017
Table 1. Parameters of CPC.
Outlet Radius b/mmInlet Radius a/mmHFOV/°Length L’/mmFocal Length f/mm
38.820224
Table 2. Control factors and level settings (L9).
Control FactorsLevels
123
ARotation degree β (°)3.04.05.0
BBottom wall’s height H (mm)3.03.54.0
CSpacing distance L (mm)0.01.02.0
DHemispherical radius R (mm)2.53.03.5
Table 3. Taguchi experiments and the performance evaluation.
Exp. No.Control FactorsPerformance Evaluation of Different Characteristics
ABCDGS/N of GP /dBmS/N of PSNR/ dBS/N of SNR
13.03.00.02.58.0818.1534.575413.20984.851438.573
23.03.51.03.07.6417.6614.747513.52983.189838.401
33.04.02.03.52.216.880−1.80145.11286.110938.701
44.03.01.03.52.427.670−1.40722.96786.114638.702
54.03.52.02.56.5416.3074.072412.19783.098338.392
64.04.00.03.06.1715.8123.819511.64083.066838.389
75.03.02.03.05.1614.2452.62788.39284.698138.557
85.03.50.03.52.568.152−0.8355−1.56185.593138.649
95.04.01.02.55.6114.9783.712311.39381.266138.198
Table 4. Normalization of the different quality characteristics.
Exp. No.Control FactorsQuality Characteristics
ABCDGPSNR
13.03.00.02.510.9790.744
23.03.51.03.00.92510.404
33.04.02.03.500.4420.998
44.03.01.03.50.0350.3001
54.03.52.02.50.7370.9120.385
64.04.00.03.00.6750.8750.378
75.03.02.03.00.5020.6590.713
85.03.50.03.50.05900.894
95.04.01.02.50.5790.8580
Table 5. Fuzzy rules for the input and output of the receiver structures.
Test No.PC1PC2PC3MPCI
1SSSVS
2SMMNS
3SLLS
4MSMND
5MMLM
6MLSHD
7LSLL
8LMSHL
9LLMVL
Table 6. Results of the MPCI for the Taguchi experiments.
Exp. No.PC1PC2PC3MPCI
11.0000.9790.7440.914
20.9251.0000.4040.938
30.0000.4420.9980.517
40.0350.3001.0000.525
50.7370.9120.3850.539
60.6750.8750.3780.821
70.5020.6590.7130.597
80.0590.0000.8940.511
90.5790.8580.0000.658
Table 7. Response of the MPCI tables.
ABCD
Level 10.7900.6790.7490.704
Level 20.6280.6630.7070.785
Level 30.5890.6650.5510.518
max-min0.2010.0160.1980.268
Rank2431
Table 8. Variance analysis on the MPCI results.
FactorsSum of SquaresDegree of FreedomMean of SquaresContributions (%)
A8.83724.41929.46%
B0.70320.3522.34%
C8.69124.34628.97%
D11.76825.88439.23%
Table 9. Comparison between the initial structure and the optimally designed structure.
CharacteristicsInitial Structure
A1-B3-C3-D3
Optimally Designed Structure
A1-B1-C1-D2
Gain
G6.88020.48113.601
P5.11216.20911.097
SNR38.70139.0740.373
Table 10. Receiving power comparison of different antenna structures.
SystemsPRmax
[dBm]
PRmin
[dBm]
PRave
[dBm]
No-antenna−0.2428−4.2258−2.5052
CPC4.1929−45.61900.3267
Initial structure2.1986−45.6190−1.8014
Optimally designed structure8.9900−45.61906.4635
Table 11. The simulation and design parameters of the indoor VLC system.
Parameter TypesParameter Values
FET channel noise factor Γ1.5
Background current Ibg5.1 mA
Fixed capacitance of photodetector per unit area η112 pF/cm2
Noise bandwidth factors I20.562
FET transconductance gm30 Ma
Noise bandwidth factors I3 [35]0.0868
Open-loop voltage gain G10.0
Equivalent noise bandwidth B100 Mbit/s
Absolute temperature TK298 K
Table 12. Signal-to-noise ratio comparison of different antenna structures.
SystemsSNRRmax
[dB]
SNRRmin
[dB]
SNRRave
[dB]
No-antenna71.440146.628667.3383
CPC92.104862.337386.7153
Initial structure92.104814.472286.1109
Optimally designed structure92.104869.086989.8874
Table 13. Comparison results of three different design methods.
Optical ReceiverFOV
[°]
Optical
Gain
Spot Size
[mm]
Received Power
[dBm]
SNR
[dB]
CPC403.8530.326768.5486
Lens-walled structure808.6245.948482.8563
Proposed optical receiver9010.5726.463589.8874
Publisher’s Note: MDPI stays neutral with regard to jurisdictional claims in published maps and institutional affiliations.

