Implementation of a Savvy Mobile ECG Sensor for Heart Rhythm Disorder Screening at the Primary Healthcare Level: An Observational Prospective Study


Abstract
1. Introduction
2. Participants and Methods
2.1. Study Design
2.2. Analysis
- -
- t-test of independent samples or ANOVA for normally distributed numerical variables;
- -
- Mann–Whitney U-test for abnormally distributed numerical variables;
- -
- Pearson chi-squared test for descriptive variables or Fisher’s exact test as a correction for smaller samples.
3. Results
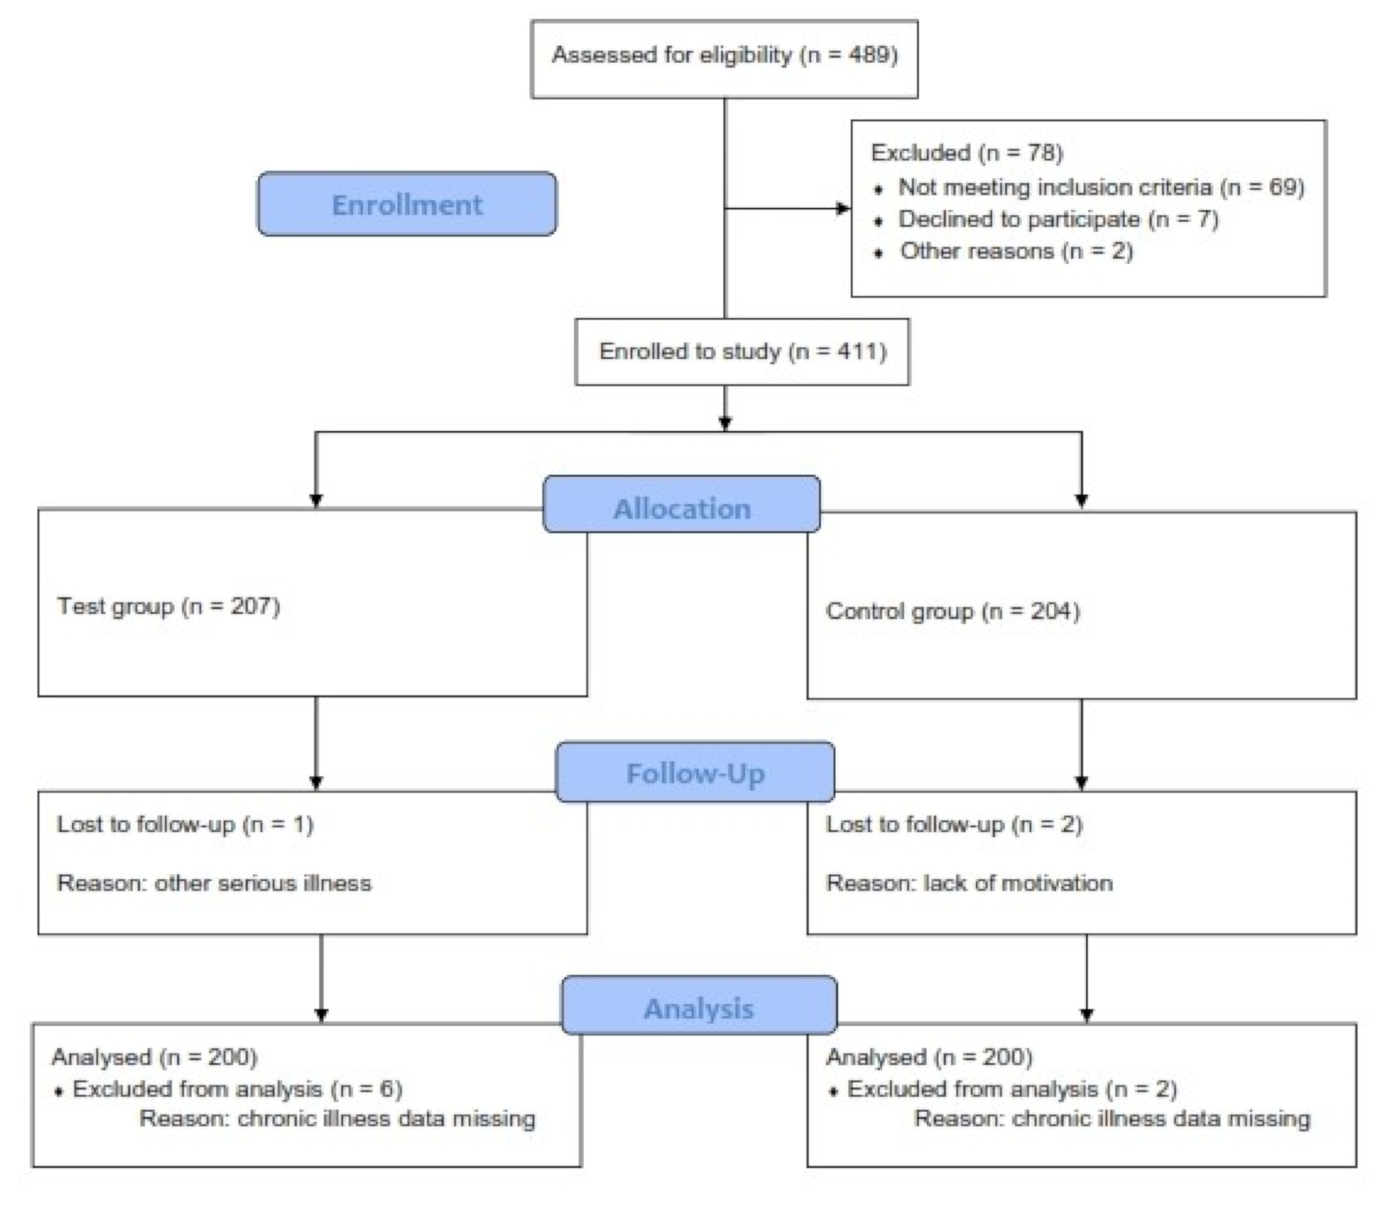
3.1. Participants
3.2. Descriptive Data
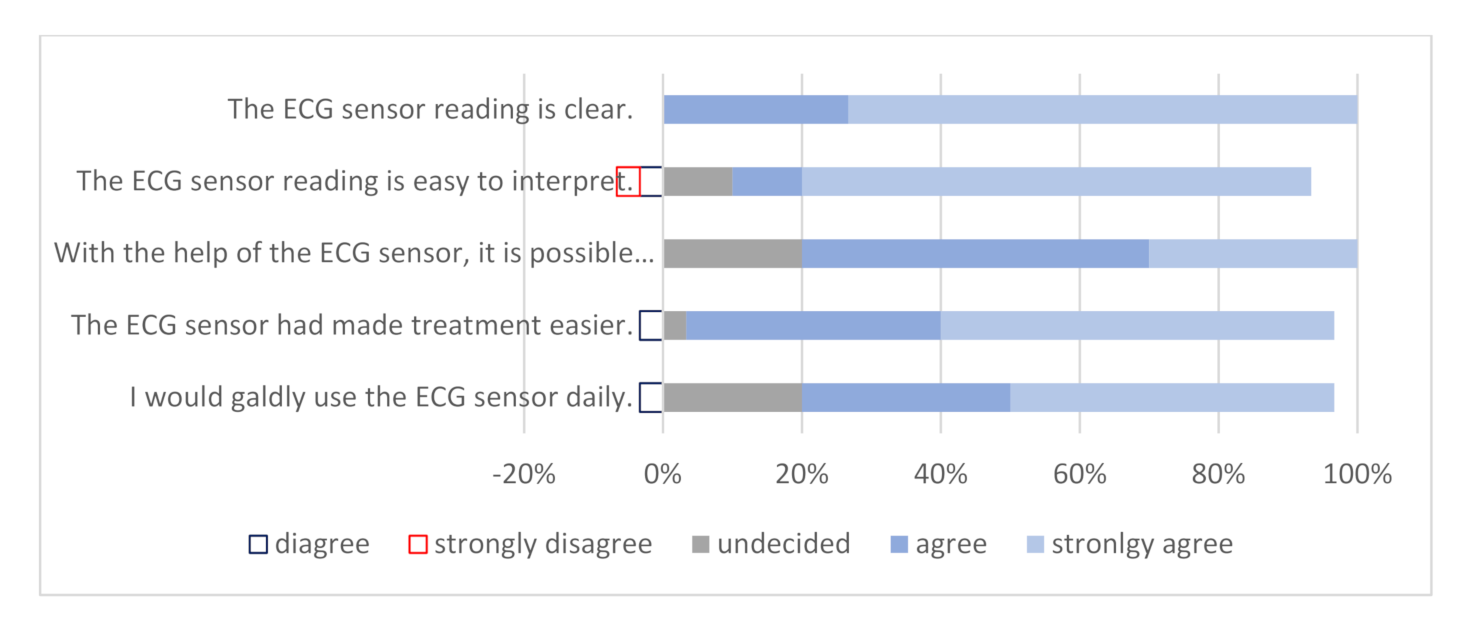
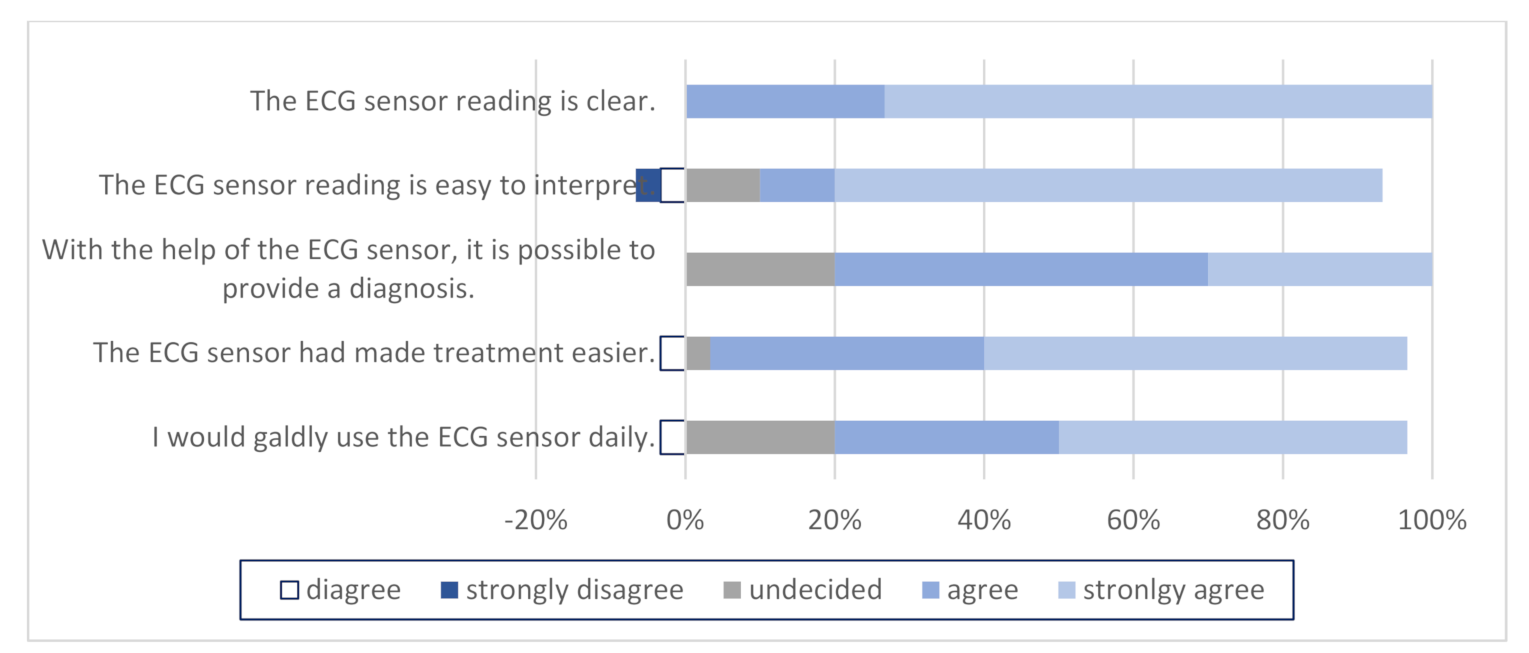
3.3. Questionnaires
4. Discussion
5. Conclusions
Author Contributions
Funding
Institutional Review Board Statement
Informed Consent Statement
Conflicts of Interest
Statement of Human and Animal Rights
References
- Levy, S.; Olshansky, B. Arrhythmia Management for Primary care Clinicians. Uptodate 2017; Topic 961. Version 11.0. Available online: https://www.uptodate.com/contents/arrhythmia-management-for-the-primary-care-clinicia. (accessed on 30 November 2020).
- Yasa, E.; Ricci, F.; Holm, H.; Persson, T.; Melander, O.; Sutton, R.; Fedorowski, A.; Hamrefors, V. Cardiovascular Autonomic Dysfunction Is the Most Common Cause of Syncope in Paced Patients. Front. Cardiovasc. Med. 2019, 6, 154. [Google Scholar] [CrossRef] [PubMed]
- Wong, B.M.; Green, M.S.; Stiell, I.G. Rate Control Management of Atrial Fibrillation With Rapid Ventricular Response in the Emergency Department. Can. J. Cardiol. 2020, 36, 509–517. [Google Scholar] [CrossRef]
- Hill, N.R.; Ayoubkhani, D.; McEwan, P.; Sugrue, D.M.; Farooqui, U.; Lister, S.; Lumley, M.; Bakhai, A.; Cohen, A.T.; O’Neill, M.; et al. Predicting atrial fibrillation in primary care using machine learning. PLoS ONE 2019, 14, e0224582. [Google Scholar] [CrossRef] [PubMed]
- Piwonska, A.; Piwonski, J.; Szczesniewska, D.; Drygas, W. Population prevalence of electrocardiographic abnormalities: Results of the Polish WAW-KARD study. Kardiol. Pol. 2019, 77, 859–867. [Google Scholar] [CrossRef] [PubMed]
- Data and Statistics on Cardiovascular Disease. Available online: http://www.euro.who.int/en/health-topics/noncommunicable-diseases/cardiovascular-diseases/data-and-statistics (accessed on 30 November 2020).
- Hu, M.X.; Lamers, F.; De Geus, E.J.C.; Penninx, B. Influences of lifestyle factors on cardiac autonomic nervous system activity over time. Prev. Med. 2017, 94, 12–19. [Google Scholar] [CrossRef]
- Gou, Y.; Lane, D.A.; Wang, L.; Chen, Y.; Lip, G.Y.H. Mobile health (mHealth) technology for improved screening, patient in-volvement and optimising integrated care in atrial fibrillation: The mAFA (mAF-App) II randomised trial. Int. J. Clin. Pract. 2019, 73, e13352. [Google Scholar]
- OECD Health Statistics 2019. Available online: http://www.oecd.org/els/health-systems/health-data.htm (accessed on 30 November 2020).
- WHO–Global Health Observatory Data. Available online: http://www9.who.int/gho/publications/world_health_statistics/2019/en/ (accessed on 30 November 2020).
- Pépin, J.L.; Bruno, R.M.; Yang, R.Y.; Vercamer, V.; Jouhaud, P.; Escourrou, P.; Boutouyrie, P. Wearable Activity Trackers for Monitoring Adherence to Home Confinement During the COVID-19 Pandemic Worldwide: Data Aggregation and Anal-ysis. J. Med. Internet Res. 2020, 22, e19787. [Google Scholar] [CrossRef]
- French, P.J. In-Vivo Microsystems: A Review. Sensors 2020, 20, 4953. [Google Scholar] [CrossRef]
- Tamayol, A.; Akbari, M.; Zilberman, Y.; Comotto, M.; Lesha, E.; Serex, L.; Bagherifard, S.; Chen, Y.; Fu, G.; Ameri, S.K.; et al. Flexible pH-Sensing Hydrogel Fibers for Epidermal Applica-tions. Adv. Healthc. Mater. 2016, 5, 711–719. [Google Scholar] [CrossRef]
- De Graaf, G.; Cruz, D.K.; Haartsen, J.C.; Hooijschuur, F.; French, P.J. Heart Rate Extraction in a Headphone Using Infrared Thermometry. IEEE Trans. Biomed. Circuits Syst. 2019, 13, 1052–1062. [Google Scholar] [CrossRef]
- Chen, Y.; Fu, G.; Zilberman, Y.; Ruan, W.; Ameri, S.K.; Zhang, Y.S.; Miller, E.; Sonkusale, S. Low cost smart phone diagnostics for food using paper-based colorimetric sensor arrays. Food Control. 2017, 82, 227–232. [Google Scholar] [CrossRef]
- Rashovksa, A.; Depolli, M.; Tomašič, I.; Avbelj, V.; Trobec, R. Medical-grade ECG sensor for long-term monitoring. Sensors 2020, 20, 1695. [Google Scholar]
- Savvy. Navodila za uporabo Personal Cardiac Activity monitoring system. Available online: http://www.savvy.si (accessed on 30 November 2020).
- Scalvini, S.; Zanelli, E.; Conti, C.; Volterrani, M.; Pollina, R.; Giorando, A.; Glisenti, F. Assesment of prehospital chest pain using tele-cardiology. J. Telemed. Telecare 2002, 8, 231–236. [Google Scholar] [CrossRef] [PubMed]
- Sørensen, J.T.; Terkelsen, C.J.; Nørgaard, B.L.; Trautner, S.; Hansen, T.M.; Bøtker, H.E.; Lassen, J.F.; Andersen, H.R. Urban and rural implementation of pre-hospital diagnosis and direct referral for primary percutaneous coronary intervention in patients with acute ST-elevation myocardial infarction. Eur. Hear. J. 2010, 32, 430–436. [Google Scholar] [CrossRef] [PubMed]
- Chan, A.W.; Kornder, J.; Elliott, H.; Brown, R.I.; Dorval, J.-F.; Charania, J.; Zhang, R.; Ding, L.; Lalani, A.; Kuritzky, R.A.; et al. Improved Survival Associated With Pre-Hospital Triage Strategy in a Large Regional ST-Segment Elevation Myocardial Infarction Program. JACC Cardiovasc. Interv. 2012, 5, 1239–1246. [Google Scholar] [CrossRef]
- Halcox, J.P.J.; Wareham, K.; Cardew, A.; Gilmore, M.; Barry, J.P.; Phillips, C.; Gravenor, M.B. Assessment of remote hearth rhythm sampling using the AliveCor Heart Monitor to screen for atrial fibrillation. Circulation 2017, 136, 1784–1794. [Google Scholar] [CrossRef]
- Klein-Wiele, O.; Faghih, M.; Dreesen, S.; Urbien, R.; Abdelghafor, M.; Kara, K.; Schulte-Hermes, M.; Garmer, M.; Grönemeyer, D.; Hailer, B. A novel cross-sector telemedical approach to detect arrhythmia in primary care patients with palpitations using a patient-activated event recorder. Cardiol. J. 2016, 23, 422–428. [Google Scholar] [CrossRef][Green Version]
- Sutton, R.; Mears, R.; Kohno, R.; Benditt, D. Ambulatory electrocardiogram monitoring for syncope and collapse: A com-parative assessment of clinical practice in UK and Germany. EP Europace 2018, 20, 2021–2027. [Google Scholar] [CrossRef]
- Benditt, D.G.; Adkisson, W.O.; Sutton, R.; Mears, R.K.; Sakaguchi, S. Ambulatory diagnostic ECG monitoring for syncope and collaps: An assessment of clinical practice in the United States. Pacing Clin. Electrophysial. 2018, 41, 203–220. [Google Scholar] [CrossRef]
- Leijdekkers, P.; Gay, V.; Barin, E. Trail results of a novel cardiac rhythm management system using smart phones and wireless ECG sensors. In Ambient Assistive Health and Wellness Management in the Heart of the City; Lecture Notes in Computer Science; Mokhtari, M., Khalil, I., Bauchet, J., Zhang, D., Nugent, C., Eds.; Springer: Berlin/Heidelberg, Germany, 2009; Volume 5597. [Google Scholar]
- Boatin, A.; Poncette, A.-S.; Kim, J.W.; Subbe, C.; Weenk, M.; Bredie, S.J.; Koeneman, M.; Hesselink, G.; Van Goor, H.; Van De Belt, T.H. Continuous Monitoring of Vital Signs in the General Ward Using Wearable Devices: Randomized Controlled Trial. J. Med. Internet Res. 2020, 22, e15471. [Google Scholar] [CrossRef]
- Brunetti, N.D.; Dellegrottaglie, G.; Lopriore, C.; Di Giuseppe, G.; De Gennaro, L.; Lanzone, S.; Di Biase, M. Prehospital Telemedicine Electrocardiogram Triage for a Regional Public Emergency Medical Service: Is It Worth It? A Preliminary Cost Analysis. Clin. Cardiol. 2014, 37, 140–145. [Google Scholar] [CrossRef] [PubMed]
- Snider, A.; Papaleo, M.; Beldner, S.; Park, C.; Katechis, D.; Galinkin, D.; Fein, A. Is Telemetry Monitoring Necessary in Low-Risk Suspected Acute Chest Pain Syndromes? Chest 2002, 122, 517–523. [Google Scholar] [CrossRef] [PubMed]
- Steinhubl, S.R.; Waalen, J.; Edwards, A.M.; Ariniello, L.M.; Mehta, R.R.; Ebner, G.S.; Carter, C.; Baca-Motes, K.; Felicione, E.; Sarich, T.; et al. Effect of a Home-Based Wearable Continuous ECG Monitoring Patch on Detection of Undiagnosed Atrial Fibrillation: The mSToPS Randomized Clinical Trial. JAMA 2018, 320, 146–155. [Google Scholar] [CrossRef] [PubMed]
- World Health Organization. Cardiovascular Diseases—Prevention and Control; WHO Library Cataloguing-in-Publication Data; World Health Organization: Geneva, Switzerland, 2007; ISBN 9789241547178. [Google Scholar]
- Nacional institut of Public Health Republic of Slovenia. Drinking habbits of Slovene People. Available online: https://www.nijz.si/sites/www.nijz.si/files/uploaded/pivske_navade_slovencev_1.pdf (accessed on 30 November 2020).
- American Medical Association. Getting the Most for Our Health Care Dollars: Strategies to Address Rising Health Care Costs. Available online: http://www.ama-assn.org/resources/doc/health-care-costs/strategies-rising-costs.pdf (accessed on 30 November 2020).
- De Smedt, D.; Kotseva, K.; De Bacquer, D.; Wood, D.; De Backer, G.; Dallongeville, J.; Seppo, L.; Pajak, A.; Reiner, Z.; Vanuzzo, D.; et al. Cost-effectiveness of optimising prevention in patients with coronary heart disease: The EUROASPIRE III health economics project. Eur. Heart J. 2012, 33, 2865–2872. [Google Scholar] [PubMed]
- Mistry, H. Systematic review of studies of the cost-effectiveness of telemedicine and telecare: Changes in the economic ev-idence over twenty years. J. Telemed. Telecare 2012, 18, 1–6. [Google Scholar] [CrossRef] [PubMed]
- Whitten, P.; Mair, F.S.; Haycox, A.; May, C.R.; Williams, T.L.; Hellmich, S. Systematic review of cost effectiveness studies of telemedicine interventions. BMJ 2002, 324, 1434–1437. [Google Scholar] [CrossRef] [PubMed]
- Roehrig, C.; Miller, G.; Lake, C.; Bryant, J. National Health Spending By Medical Condition, 1996–2005. Heath Aff. 2009, 28, w358–w367. [Google Scholar] [CrossRef] [PubMed]
- Chernew, M.E.; Hirth, R.A.; Cutler, D.M. Increased Spending On Health Care: Long-Term Implications For The Nation. Health Aff. 2009, 28, 1253–1255. [Google Scholar] [CrossRef]
- Bodenheimer, T.; Fermandez, A. High and rising health care costs, part 4: Can costs be controlled while preserving quality? Ann. Intern Med. 2005, 143, 26–31. [Google Scholar]
- Nuti, S.; Vainieri, M.; Frey, M. Healthcare resources and expenditure in financial crisis: Scenarios and managerial strategies. J. Matern. Neonatal Med. 2012, 25, 40–43. [Google Scholar] [CrossRef]
- Nacional Institut of Public Health Republic of Slovenia. Health Informatics. Available online: https://www.nijz.si/sl/ezdravje (accessed on 30 November 2020).
- Lieberman, J. How telecardiology is aiding prompt ECG diagnosis in primary care. Br. J. Community Nurs. 2006, 13, 123–136. [Google Scholar] [CrossRef] [PubMed]
- Orchard, J.; Freedman, S.B.; Lowres, N.; Peiris, D.; Neubeck, L. iPhone ECG screening by practice nurses and receptionists for atrial fibrillation in general practice: The GP-SEARCH qualitative pilot study. Aust. Fam. Phys. 2014, 43, 315–319. [Google Scholar]


| Categorical Variables | n (%) | |
|---|---|---|
| Sex | male | 14 (47) |
| female | 16 (53) | |
| Medical specialty | resident | 1 (3) |
| family medicine specialists | 21 (70) | |
| without specialty | 8 (26) | |
| Numerical variables | Mean ± SD | |
| Age (years) | 41.87 ± 15.15 | |
| Years of service (years) | 17.9 ± 11.17 | |
| Test Group | Control Group | Statistical Significance | ||
|---|---|---|---|---|
| Categorical Variables | n (%) | n (%) | ||
| Gender | male | 57 (28.5) | 44 (22) | NS a |
| female | 143 (71.5) | 156 (78) | NS a | |
| Level of education | primary or high school | 110 (55) | 129 (65) | NS a |
| university, PhD | 90 (45) | 71 (35) | NS a | |
| Working status | working | 94 (47) | 92 (46) | NS a |
| unemployed or retired | 106 (53) | 108 (54) | NS a | |
| Lifestyle | smoking | 41 (20.5) | 92 (46) | p < 0.001 a |
| harmful alcohol consumption | 130 (65) | 120 (60) | NS a | |
| Associated diseases | hypertension | 47 (27) | 73 (36) | NS a |
| diabetes | 28 (14) | 26 (13) | NS a | |
| Numerical variables | Mean ± SD | Mean ± SD | ||
| Age (years) | 47.98 ± 17.37 | 51.61 ± 15.10 | NS b | |
| Body mass index (kg/m2) | 26.2 ± 5.26 | 25.2 ± 3.11 | NS c | |
| Systolic blood pressure (mm Hg) | 127.74 ± 14.94 | 140.12 ± 10.61 | NS c | |
| Anamnestic Suspicion n (%) | Clinical Suspicion n (%) | Both n (%) | Statistical Significance | ||
|---|---|---|---|---|---|
| Test group | all | 91 (45) | 68 (34) | 41 (20) | p < 0.001 |
| female | 68 (47) | 45 (31) | 30 (21) | NS a | |
| male | 23 (40) | 23 (40) | 11 (19) | ||
| Control group | all | 132 (66) | 32 (16) | 36 (18) | p < 0.001 |
| female | 100 (64) | 20 (12) | 36 (23) | p < 0.001 a | |
| male | 32 (73) | 12 (27) | 0 (0) |
| Rhythm Disorder Present | Treatment—Observation n (%) | Treatment—New Drug Administration n (%) | Referral to a Cardiologist n (%) | ||
|---|---|---|---|---|---|
| Test group | all | 52 (26) | 110 (55) | 55 (27.5) | 23 (11.5) |
| female | 36 (18) | 78 (39) | 37 (18.5) | 16 (8) | |
| male | 16 (8) | 32 (16) | 18 (9) | 7 (3.5) | |
| Control group | all | 64 (32) | 124 (62) | 8 (4) | 64 (32) |
| female | 40 (20) | 108 (54) | 0 (0) | 44 (22) | |
| male | 24 (12) | 16 (8) | 8 (4) | 20 (10) | |
| Statistical significance | all | NS | NS | p < 0.001 | p < 0.001 |
| female | NS | NS a | p < 0.001 a | p = 0.009 a | |
| male | NS | NS a |
Publisher’s Note: MDPI stays neutral with regard to jurisdictional claims in published maps and institutional affiliations. |
© 2021 by the authors. Licensee MDPI, Basel, Switzerland. This article is an open access article distributed under the terms and conditions of the Creative Commons Attribution (CC BY) license (http://creativecommons.org/licenses/by/4.0/).
Share and Cite
Vodička, S.; Susič, A.P.; Zelko, E. Implementation of a Savvy Mobile ECG Sensor for Heart Rhythm Disorder Screening at the Primary Healthcare Level: An Observational Prospective Study. Micromachines 2021, 12, 55. https://doi.org/10.3390/mi12010055
Vodička S, Susič AP, Zelko E. Implementation of a Savvy Mobile ECG Sensor for Heart Rhythm Disorder Screening at the Primary Healthcare Level: An Observational Prospective Study. Micromachines. 2021; 12(1):55. https://doi.org/10.3390/mi12010055
Chicago/Turabian StyleVodička, Staša, Antonija Poplas Susič, and Erika Zelko. 2021. "Implementation of a Savvy Mobile ECG Sensor for Heart Rhythm Disorder Screening at the Primary Healthcare Level: An Observational Prospective Study" Micromachines 12, no. 1: 55. https://doi.org/10.3390/mi12010055
APA StyleVodička, S., Susič, A. P., & Zelko, E. (2021). Implementation of a Savvy Mobile ECG Sensor for Heart Rhythm Disorder Screening at the Primary Healthcare Level: An Observational Prospective Study. Micromachines, 12(1), 55. https://doi.org/10.3390/mi12010055