Article

Influence of Piezoelectric Properties on the Ultrasonic Dispersion of TiO2 Nanoparticles in Aqueous Suspension

1
Naosafety Team, Safety Measurement Institute, Korea Research Institute of Standards and Science, Daejeon 34113, Korea
2
Department of Thermal Systems, Korea Institute of Machinery and Materials, Daejeon 34103, Korea
*
Author to whom correspondence should be addressed.
These authors contributed equally to the work.
Micromachines 2021, 12(1), 52; https://doi.org/10.3390/mi12010052
Submission received: 30 November 2020 / Revised: 29 December 2020 / Accepted: 29 December 2020 / Published: 5 January 2021

Abstract

:
In this study, the soft-type and hard-type lead zirconate titanate (PZT) ceramics were compared in order to create an optimal system for ultrasonic dispersion of nanoparticles, and sound pressure energy for each PZT ceramic was analyzed and closely examined with ultrasonic energy. TiO2 was water-dispersed using the soft-type and hard-type PZT transducer, possessing different characteristics, and its suspension particle size and distribution, polydispersity index (PDI), zeta potential, and dispersion were evaluated for 180 days. Furthermore, it was confirmed that the particles dispersed using the hard-type PZT transducer were smaller than the particles dispersed using the soft-type PZT by 15 nm or more. Because the hard-type PZT transducer had a lower PDI, uniform particle size distribution was also confirmed. In addition, by measuring the zeta potential over time, it was found that the hard-type PZT transducer has higher dispersion safety. In addition, it was confirmed that the ultrasonically dispersed TiO2 suspension using a hard-type PZT transducer maintained constant particle size distribution for 180 days, whereas the suspension from the soft-type PZT aggregated 30 days later. Therefore, the hard-type PZT is more suitable for ultrasonic dispersion of nanoparticles.

1. Introduction

Well-distributed suspensions are useful in a wide variety of applications, such as food, medicine, paints, and fuel. Proper dispersion is crucial during the preparation, crushing, mixing, and formation of raw materials to prevent uneven distribution or the formation of particle agglomerates that are too large to stay in suspension. Therefore, the understanding and application of particle dispersion methodologies is important. The conventional physical and mechanical dispersion methods such as ball milling and jet milling contaminate the dispersion of nanoparticles due to high milling speed and ineffectiveness [1,2]. Interest in fundamental and applied research on nanoparticle dispersion using ultrasonic waves has been increasing. Cavitation used for ultrasonic dispersion is caused by sound pressure that repeats per second [3]. The inflow of sufficient sound pressure into the target liquid results in cavitation, which is caused by local pressure changes in the acoustics field and results in the formation, growth, vibration, collapse, and destruction of small bubbles or high-energy gas. The effect of cavitation yields sufficient energy to form bubbles in a liquid under negative pressure. Each bubble then develops in the rarefaction phase and collapses in the compression phase of the wave. Extreme temperature (more than 10,000 K) and pressure (more than 400 MPa) occur around the collapsing bubble [4,5,6,7,8]. The high energy generated during the collapse can be used to disperse particles in suspensions. However, aggregation control of nanoparticles in a colloidal state is insufficient when using the conventional bath or horn-type ultrasonic dispersion equipment for various reasons such as uneven dispersion performance due to unidirectional energy transfer and the inability to control heat generated when the equipment is operated. Therefore, it is necessary to develop ultrasonic dispersion technology for dispersing nanoparticles and an understanding of piezoelectric materials is essential.
Piezoelectric material develops a potential across its boundaries when subjected to a mechanical stress (or pressure) and vice versa. When an electric field is applied to the material, a mechanical deformation ensues. In particular, the converse piezoelectric effects could be used in ultrasonic dispersion equipment [9]. Based on the converse piezoelectric effect, an ultrasonic transducer produces cavitation effects. In particular, lead zirconate titanate (Pb[Zr(1−x)Tix]O3 or PZT) is a suitable material for ultrasonic transducers because of its high piezoelectric constant, relative transients, and electromagnetic binding factors [10]. Such lead-based complex perovskites have been extensively investigated from both the academic and commercial perspectives. The most widely studied and used PZT configuration is located near the morphotropic phase boundary (MPB) between the tetragonal and rhombohedral phases. To meet the requirements of specific applications, the properties of PZT ceramics are usually improved using dopants. In general, donor additives induce “soft” piezoelectric behavior with high dielectric and piezoelectric activities suitable for sensor and actuator applications. In contrast, acceptor additives cause “hard” piezoelectric behavior that is suitable for ultrasonic motor applications [11,12,13,14,15,16,17,18,19,20]. It is important to select a piezoelectric material that is suitable for the specific field of application and to study the characteristics of the piezoelectric material depending on the specifications. The differences between the characteristics of soft and hard PZT imply that they exhibit different dispersion performances when used for ultrasonic dispersion. In this paper, ring-shaped piezoelectric ceramics made of hard PZT and soft PZT were used for ultrasonic dispersion.
Applications of ring-shaped transducers range from the latest scientific developments of scanning tunneling microscopy (STM) and atomic force microscopy (AFM) to medical diagnostics and therapeutics. Other applications include micro-positioners and vibration detection, ultrasonic pumps and liquid atomizers, phonograph pickups, and hydrophones [21]. A more suitable material for the ring-shaped ultrasonic system was selected via an ultrasonic dispersion experiment of TiO2 nanoparticles using the ring-shaped piezoelectric ceramics. After the dispersion of TiO2 nanoparticle colloid, the dispersion performance for each material was evaluated through particle size distribution and dispersion stability analysis for 180 days.

2. Experimental Procedure

2.1. PZT Materials and Characterization

In this study, two commercially available PZT ceramics from DONGIL TECH. Co., Ltd. (Hwaseong, Korea) and Piezo Technologies (Indianapolis, IN, USA), respectively, were used for the ring-shaped transducers. Each transducer was manufactured from different PZT ceramics; detailed specifications are listed in Table 1. Scanning electron microscopy (SEM, Hitachi, Tokyo, Japan) micrographs of the two PZT ceramics were randomly acquired at 15 kV and magnifications of 3000× and 10,000×.

2.2. Polarization and Piezoelectric Properties

In this study, the ring-shaped PZT ceramics was customized after COMSOL simulation to determine the resonance mode and the electromechanical properties of the PZT ceramics that are used for ultrasonic transducers.
The circumference surfaces of the ring-shaped PZT ceramics were uniformly coated with silver paste to form electrodes and then annealed for 10 min at 600 °C, as shown in Figure 1. Each sample was then placed in a silicone oil bath at 120 °C for ceramic polarization, and an electric field of 4.5 kV mm−1 was applied for 30 min (poling time) to induce piezoelectric properties.
After sufficiently cooling the samples, the capacitance C (nF) of the ceramics was measured from the amount of electric charge Q (C) and the applied voltage V (V). The relative dielectric constant εr was calculated from the applied voltage, electrode area A (mm2) of the sample, and distance L (mm) of the two substrates according to the following Equation (1):
C = Q/V = εr A/L.
To measure the electrical properties of the ring-shaped PZT ceramics, the electrodes were screen-printed with conductive silver paste [22]. Table 1 presented a list of the piezoelectric properties of the ceramics. The dielectric constant of hard PZT ceramics is significantly lower than that of soft PZT. Generally, PZT ceramics with a high dielectric constant degrade the polarizing efficiency and have low polarizing electric fields, leading to deterioration of the piezoelectric properties.

2.3. Experimental Setup

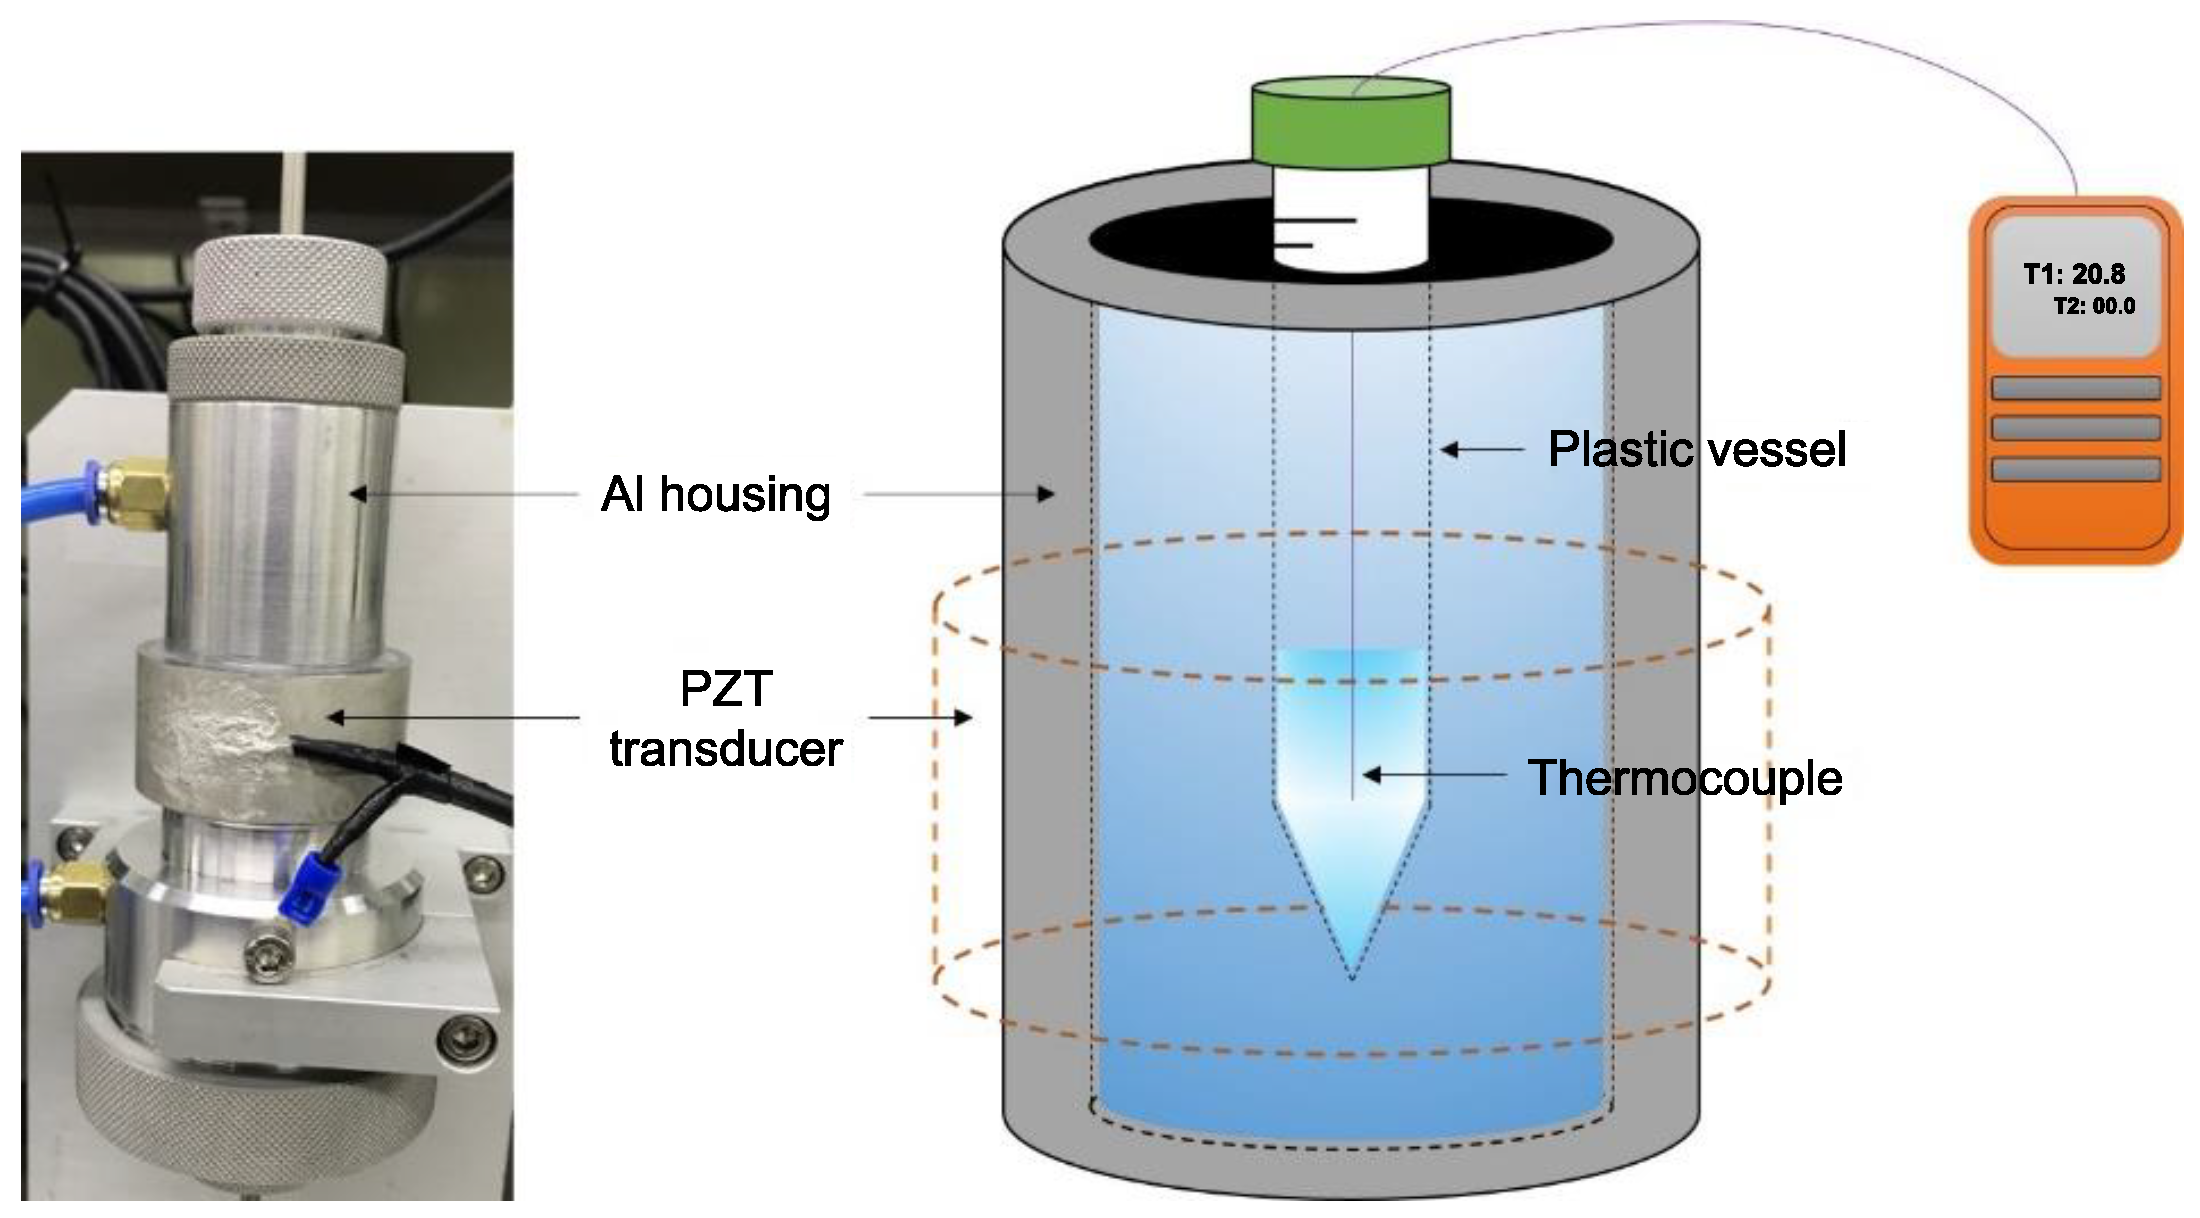
2.3.1. Measurement of Ultrasonic Power

Ultrasonic treatment is typically performed in a liquid, with a metering method employed to calibrate its ultrasonic output power [23]. In this work, the amount of power used in ultrasound treatment was measured via calorimetry with distilled water as the medium, and the experimental setup is shown in Figure 2.
The PZT transducers were driven at a resonant frequency. The ring-shaped piezoelectric ceramic was fastened to aluminum housing for the dispersion test. In the process, the resonance point of each PZT changed. The resonance frequencies of the soft/hard PZT ceramics before and after fastening to the housing are shown in Table 2.
A 50 mL plastic container was filled with 4 mL of distilled water, and a thermocouple was inserted through a hole into the water in the container. The initial temperature of distilled water was 18 °C, and the temperature was recorded every 10 s until it stabilized. The experiment was terminated when the temperature of distilled water dropped below 60 °C. When heated through a PZT transducer for a certain period of time, the temperature of distilled water in the closed plastic container increased. The output, Q, of the system was calculated using Equation (2).
Q = mCp⋅ΔTt,
where m (g) is the total mass of water, Cp is the specific heat capacity of water (4.18 J/g·°C) and ΔTt (°C/s) represents the temperature gradient [24].

2.3.2. Measurement of Acoustic Pressure

The acoustic pressure was measured using a hydrophone (Sonicheck-15, UL-TECH. Co., Ltd., Uiwang, Korea) near the distilled water at the center of the case, as shown in Figure 3. To determine the key point on which to optimize the ultrasonic dispersion system, a specific area with high ultrasonic activity was identified. Over the past decade, several researchers have measured the acoustic pressure to obtain the ultrasonic activation energy [25,26,27]. This information can be used to optimize future ultrasonic dispersion applications by selecting areas with high acoustic pressure and hence areas with high cavitation effects. In this work, the acoustic pressure was measured to study the acoustic energy of the ultrasonic dispersion system discussed.

2.3.3. Ultrasonic Dispersion

The dispersion performance was evaluated by dispersing TiO2 nanoparticles by ultrasound treatment using a focused ultrasonic dispersion method in water without surfactants. In this method, acoustic energy is focused onto the center of a ring-shaped piezoelectric ceramic. Furthermore, as the driving temperature of the equipment is controlled using cooling water, nanoparticle dispersion up to the desired scale via long-time treatment is feasible. The amplified energy is transferred to the piezoelectric ceramic through the function generator and amplifier, and the sound energy is concentrated at the center of the ring. Particles are dispersed by passing the suspension through the focused ultrasonic wave, and because all the fluid circulates and passes through this section, a uniform particle dispersion is possible. In addition to controlling the heat that is generated during sonication, the cooling water circulating through the PZT transducer acts as a medium for generating ultrasonic waves and delivering sound pressure to the center of the colloid sample, thus allowing for the control of the dispersion conditions. Figure 4 shows a schematic diagram of the ultrasonic dispersion equipment for TiO2 nanoparticle, which is used in this study. The ultrasonic dispersion conditions are presented in Table 3, and the materials used for the ultrasonic dispersion experiment are detailed in Table 4.
After dispersion, the particle size distribution was analyzed using a centrifuge particle size meter (DC 24000, CPS Instruments, Prairieville, LA, USA). To measure the particle size, 1 wt.% of the sample was diluted 20 times with deionized water. Further, the zeta potential was measured using a size detector (Zetasizer Nano ZS, Malvern Panalytical, Malvern, UK).

3. Results and Discussion

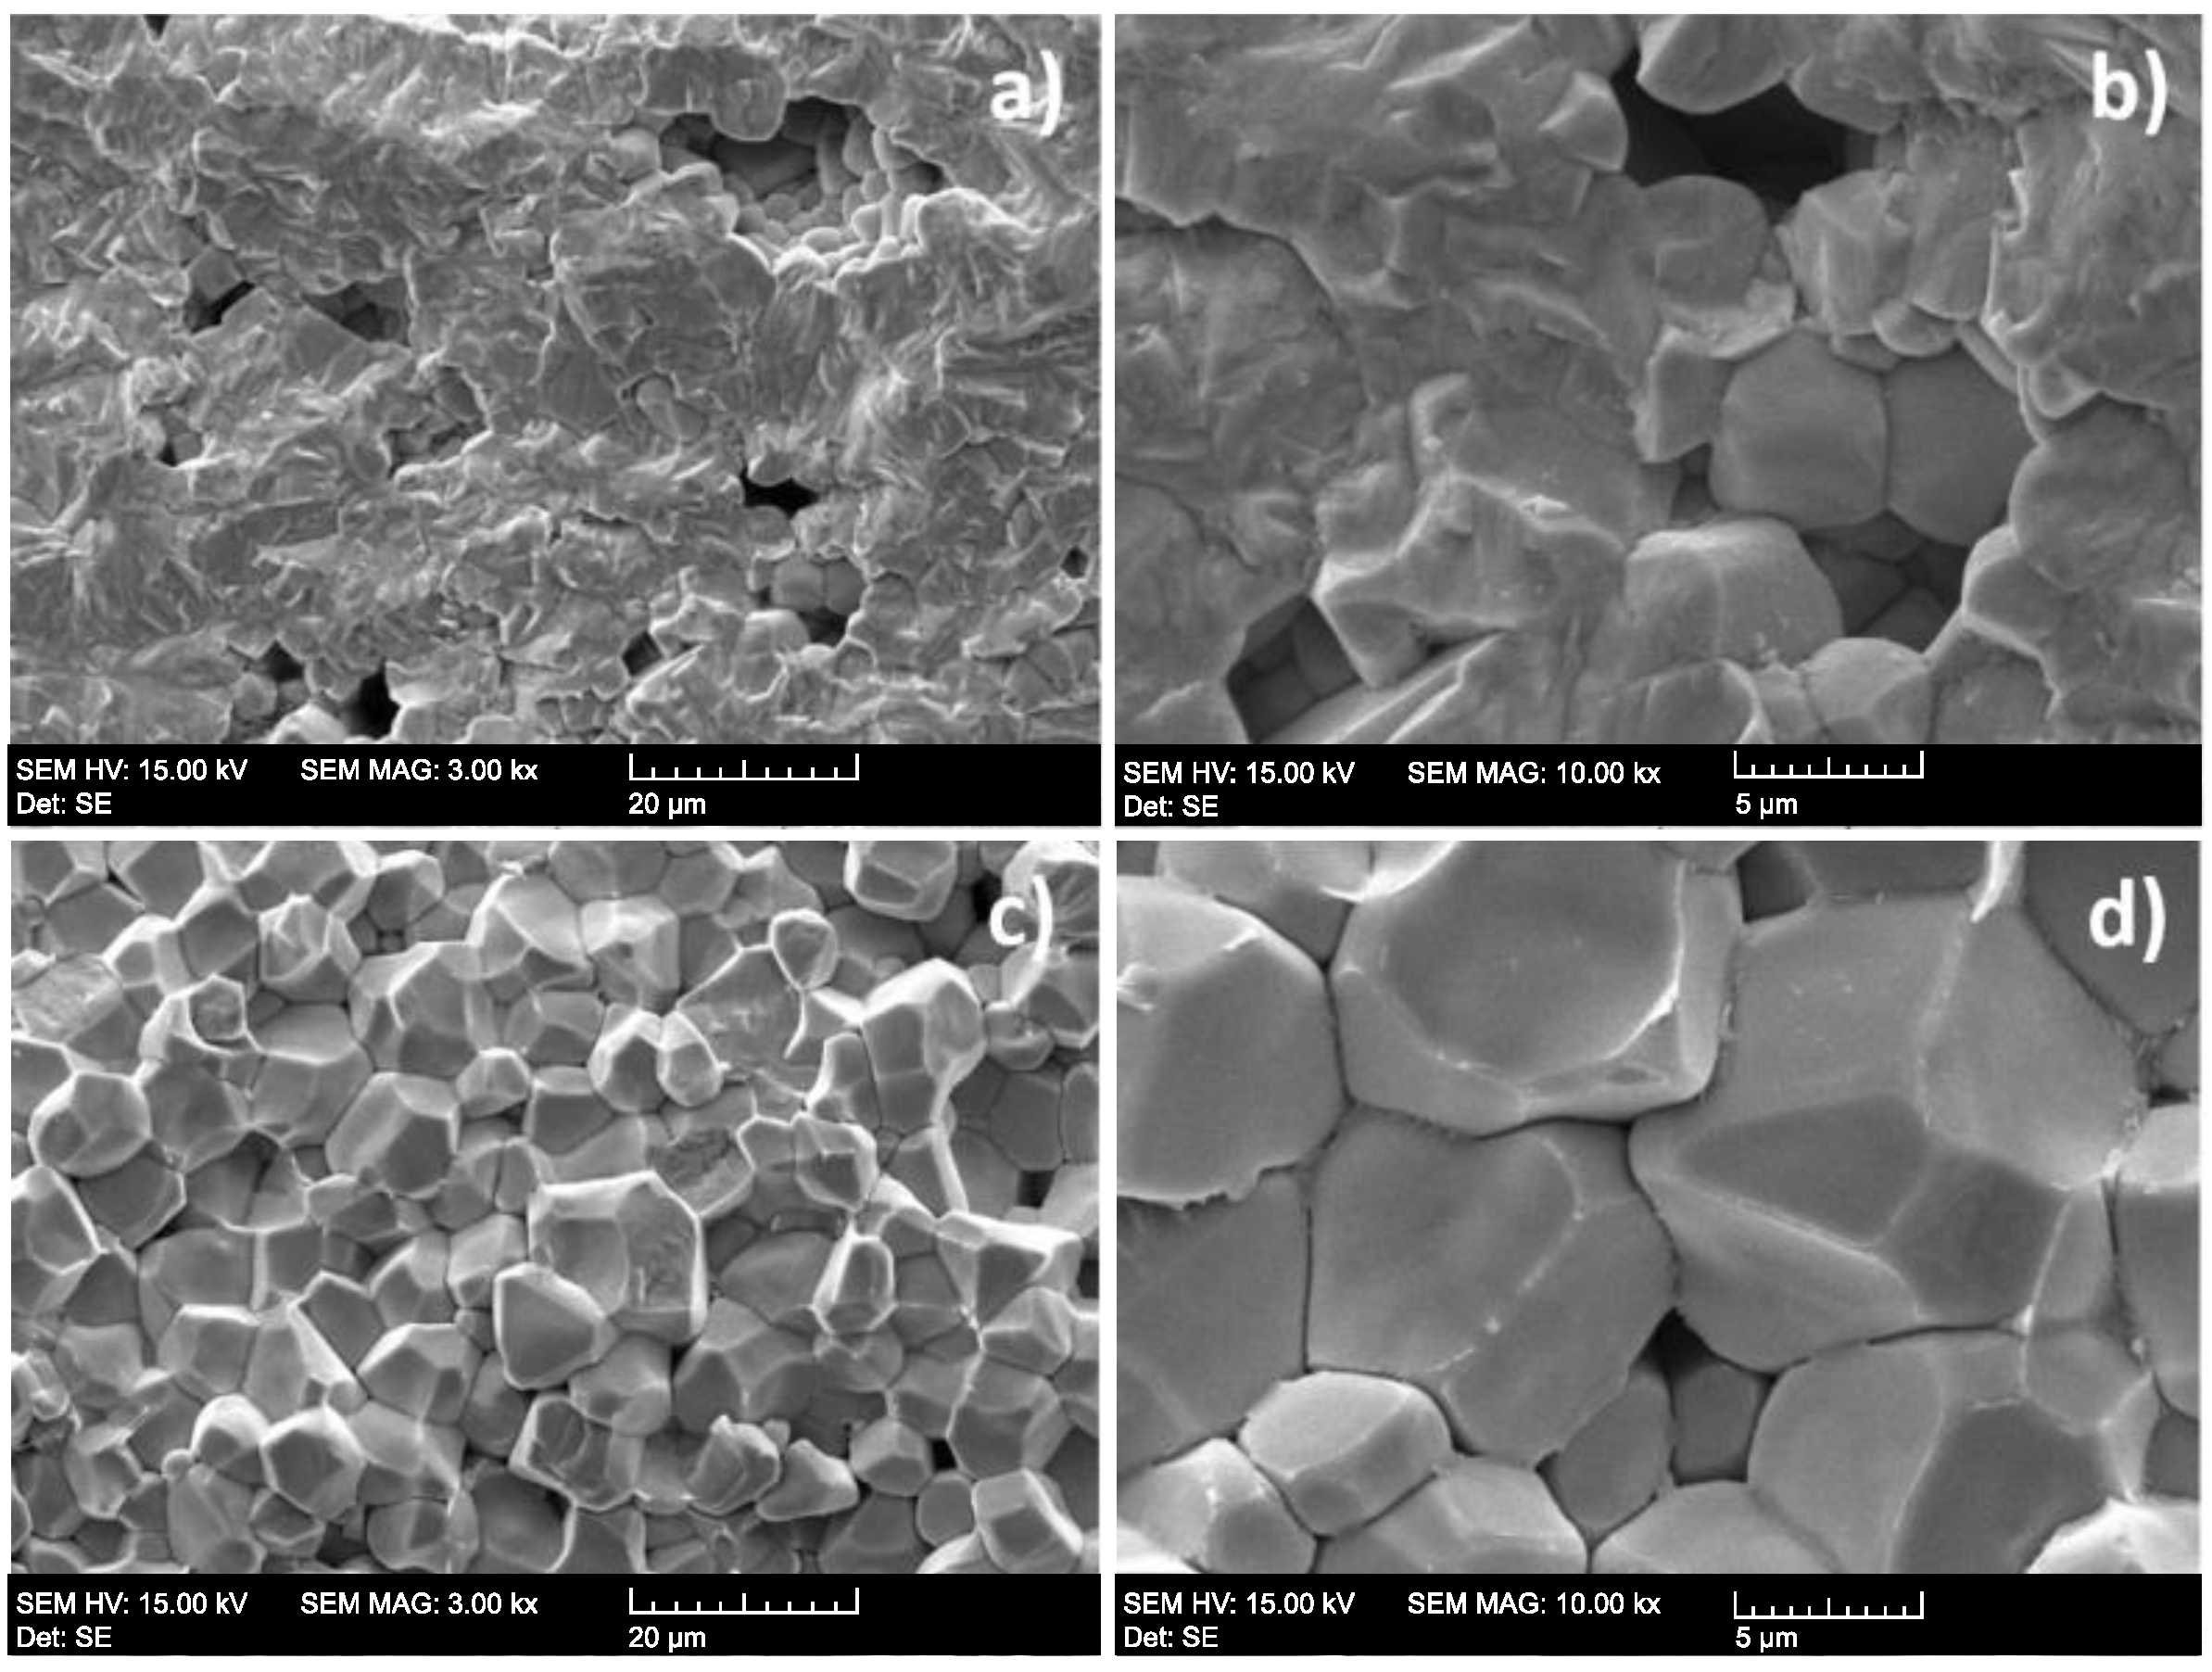
3.1. Characterization of PZT Ceramics

Figure 5 shows SEM images of the two PZT ceramics. The soft PZT ceramic showed an inhomogeneous microstructure with grains measuring below 1 μm, while the hard PZT ceramic presented a more homogeneous microstructure with grains measuring up to 10 μm. Furthermore, the soft PZT ceramic exhibited slightly higher porosity than the hard PZT. Sokol et al. reported that the presence of fine grains reduces interparticle spacing, improving the piezoelectric properties [28].

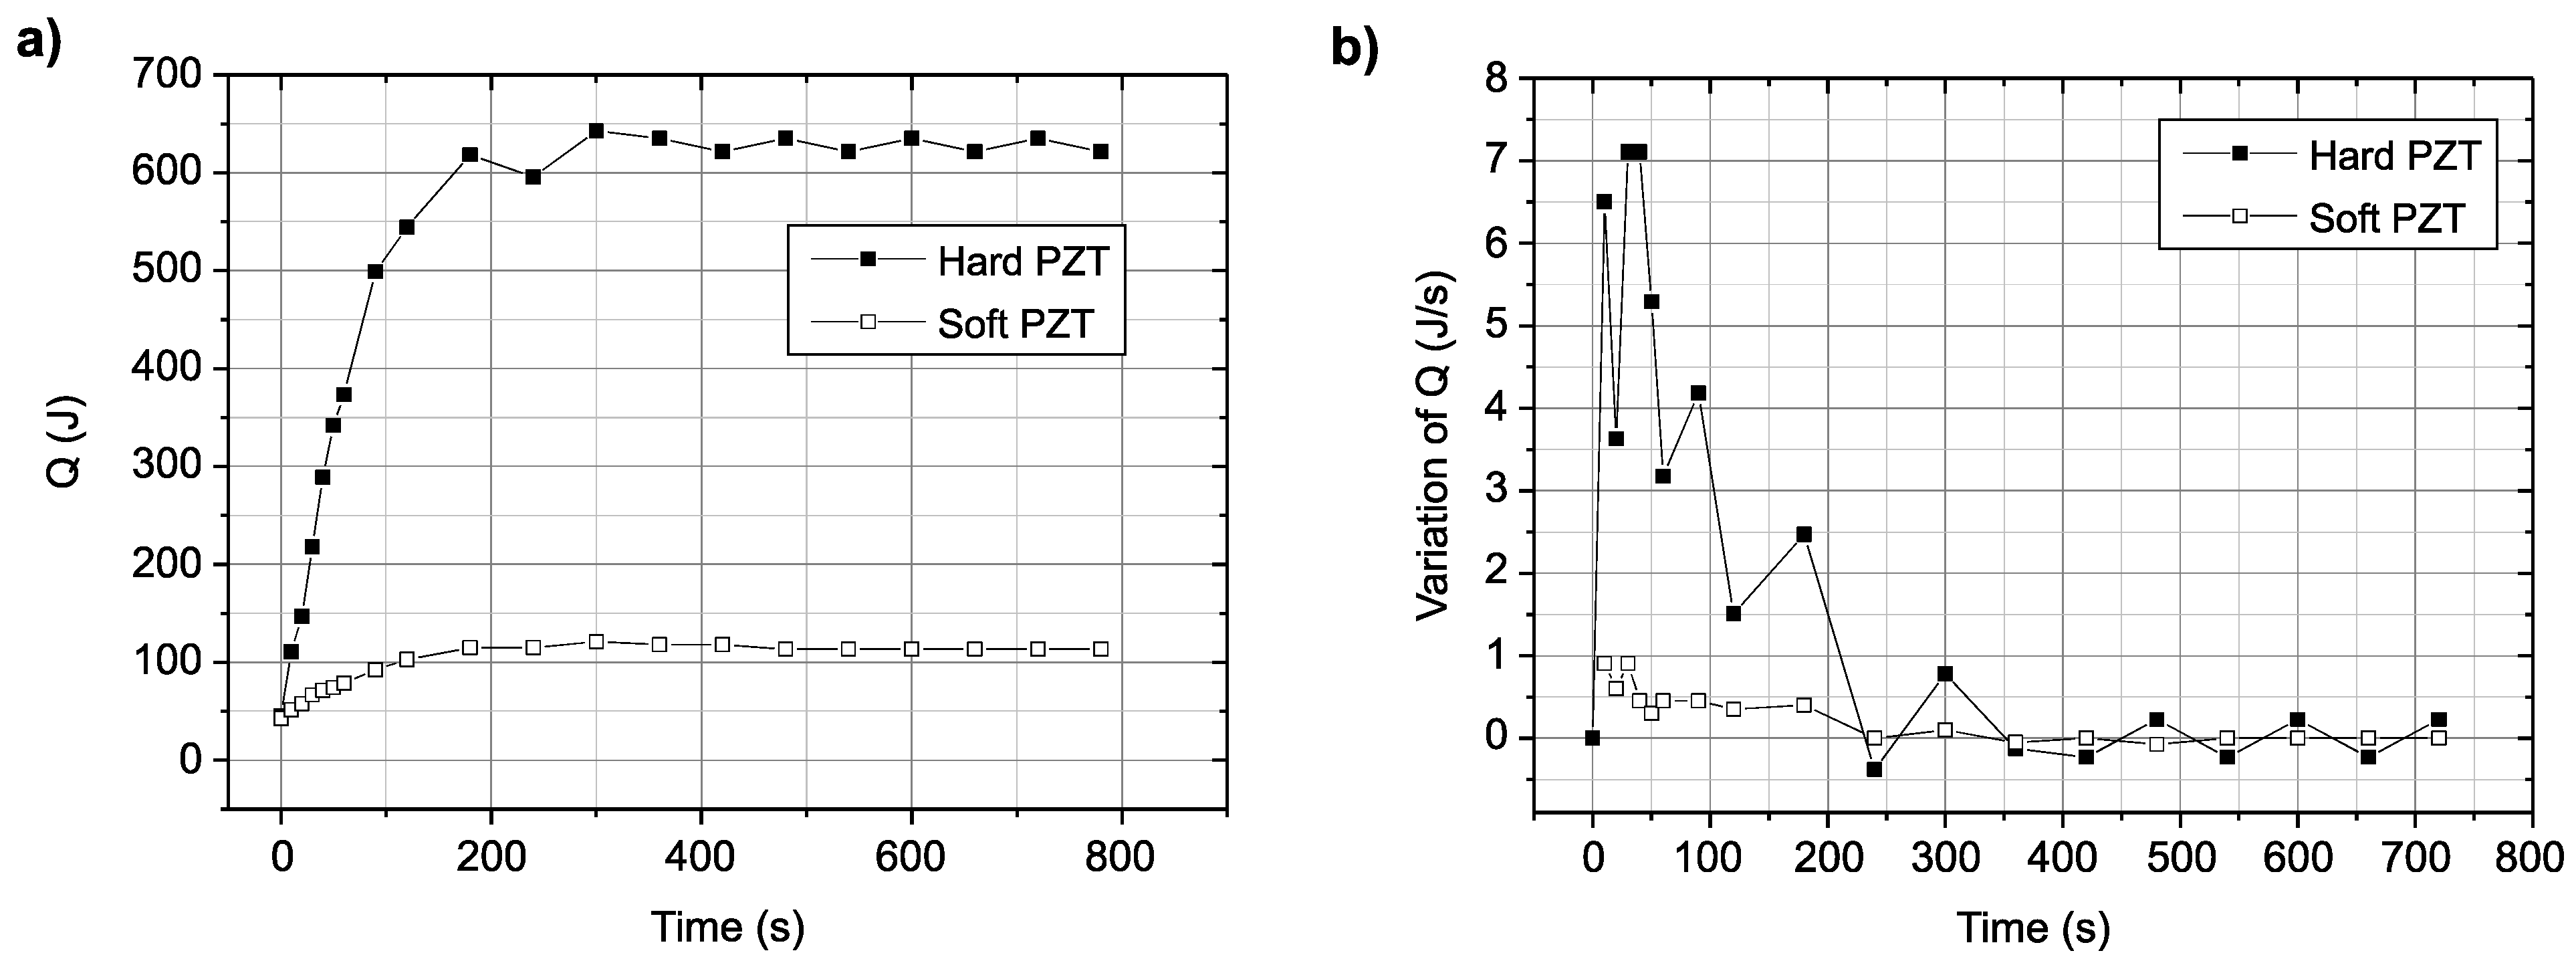
3.2. Calculation of Ultrasonic Power by the Calorimetry Method

In general, the amount of energy used in ultrasound treatment can be determined by calculating the change in temperature of the target liquid caused by ultrasonic irradiation, which is typically evaluated via calorimetry. In this work, the delivered acoustic power was also determined calorimetrically [24,29,30,31,32], and the results of calorimetry using ultrasonic transducers with different resonant frequencies are shown in Figure 6. The quantity of heat was calculated using Equation (2). With the hard PZT transducer, the temperature increased rapidly in the initial 200 s and then stabilized. In contrast, the change in temperature with the soft PZT transducer was not significant. Thus, the hard PZT transducer is superior to the soft PZT in terms of ultrasonic power.

3.3. Measurement of Acoustic Pressure

Acoustic pressure measurements were performed to define the ultrasonic energy of the ultrasonic dispersion system. The measured voltage could be used to convert the output of the hydrophone into a pressure value using the expression.
P = Vmeasure/Msensitivity,
where P (Pa) is the acoustic pressure, Vmeasure is the voltage (mV) measured by the hydrophone and Msensitivity is the sensitivity (mV/Pa) of the hydrophone. In fact, the sensitivity is the characteristic value of the materials, and thus the measured voltage could be proportional to the acoustic pressure. Figure 7 shows the measured voltage of the ultrasonic system at the resonant frequency of each PZT transducer. The tendencies for both PZT transducers were the same, i.e., the higher the applied voltage, the higher the measured voltage. However, under the same applied voltage (VRMS), the measured voltage values of the hard and soft PZT displayed a big difference. The value measured at the center of the ring-shaped piezoelectric ceramic for the hard PZT was about 20–110 mV, while the value measured for the soft PZT was less than 35 mV, showing relatively weak voltage compared to the hard PZT. This indicates that an increase in the input voltage (VRMS) does not result in a corresponding increase in the cavitation activity [33].

3.4. Focused Ultrasonic Dispersion of TiO2 Nanoparticles in Water

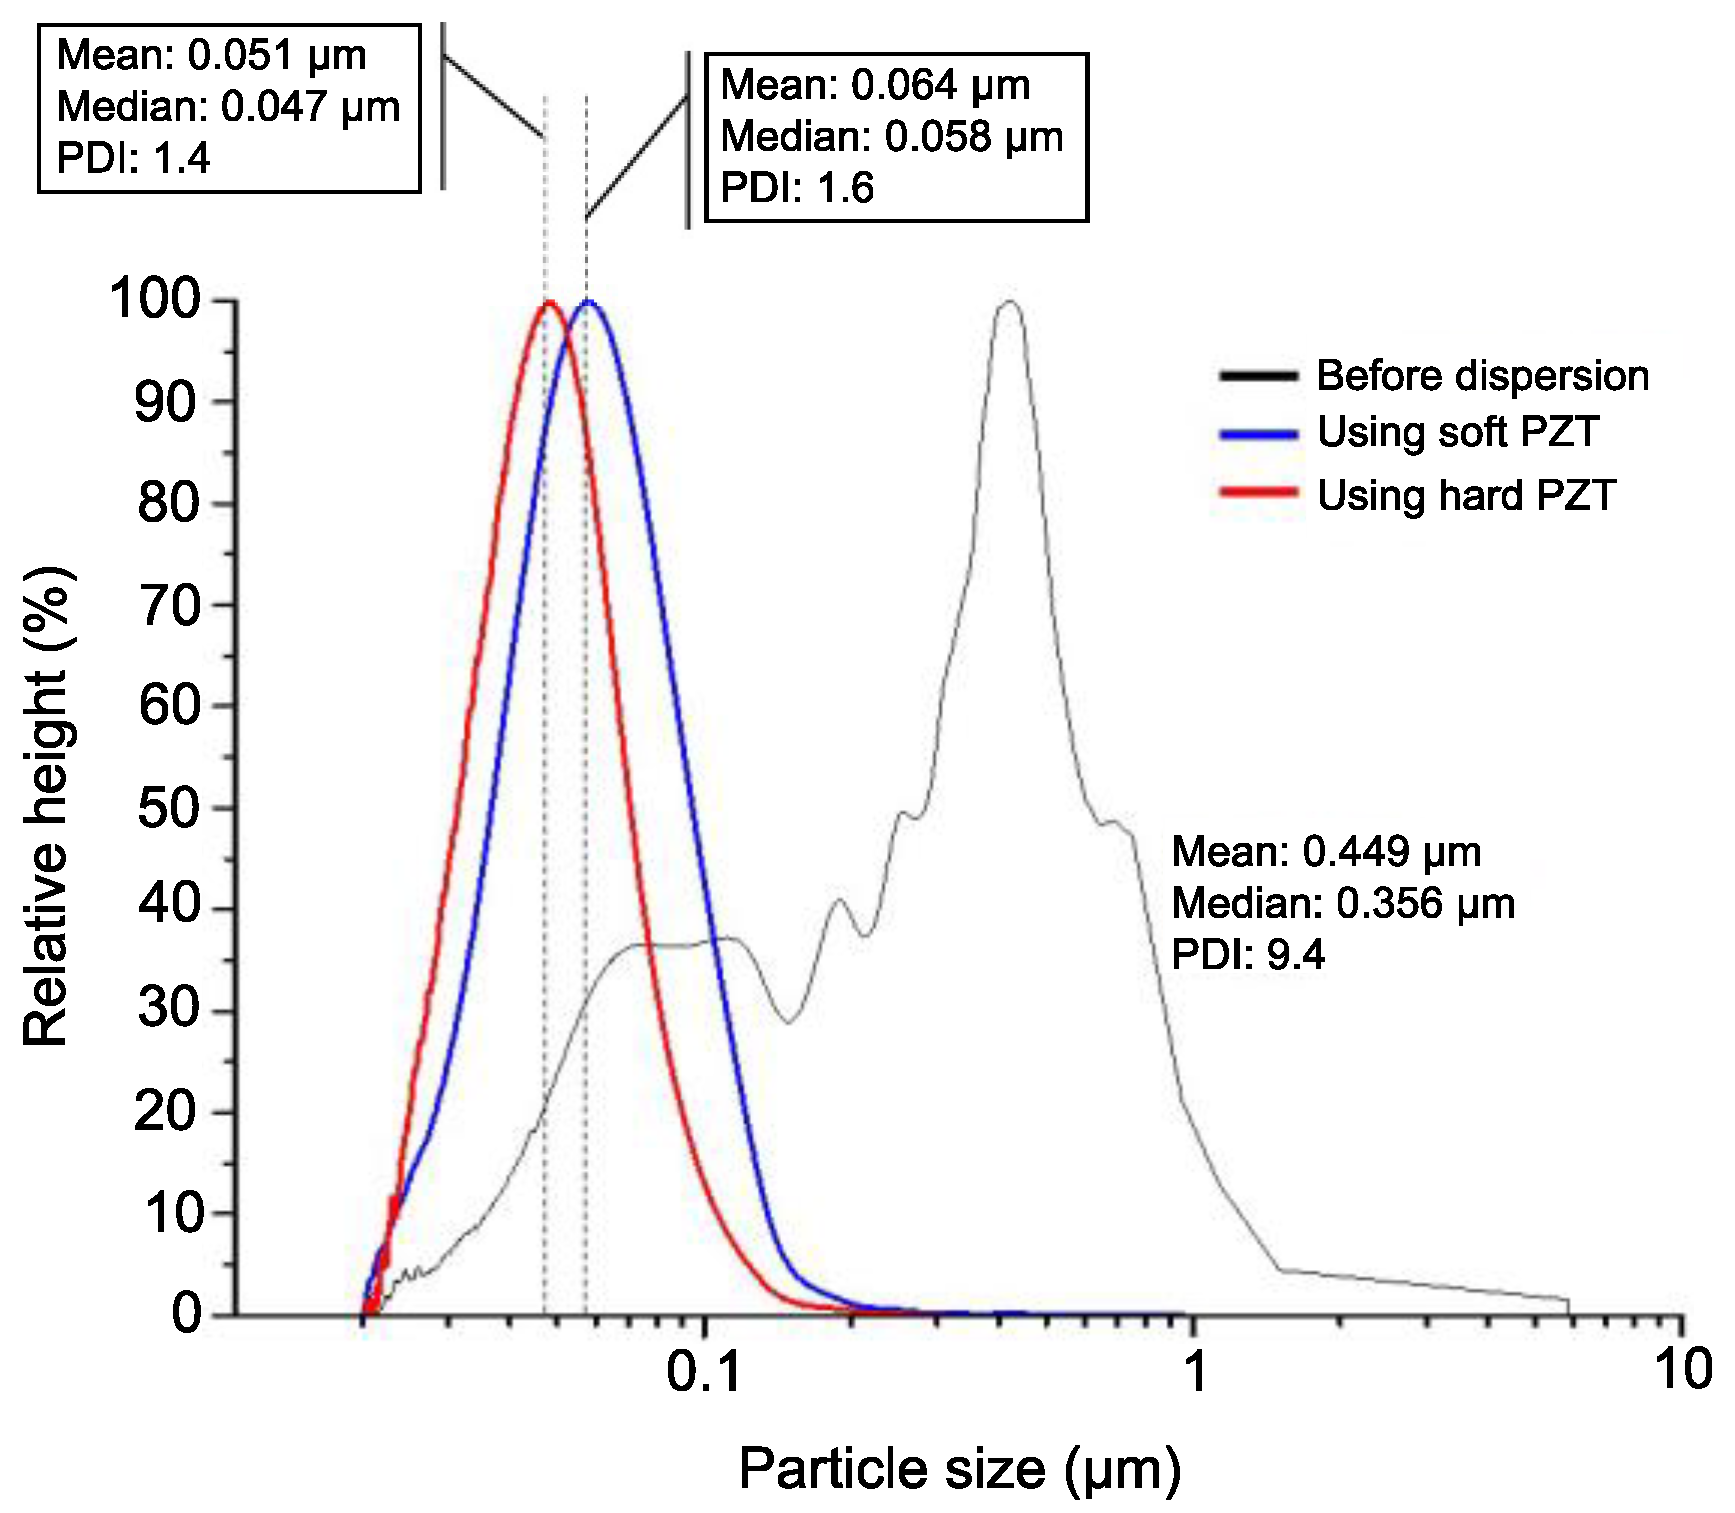
3.4.1. Size Distribution

To confirm the dispersion performance of two PZT transducers, the particle size distribution of the TiO2 colloid after dispersion was determined at different centrifugal using a centrifuge particle size meter, which is more accurate than the conventional laser diffraction method [34] because in a colloid, the particle size distribution depends on both particle size and particle weight. Figure 8 shows the particle size distribution and the polydispersity index (PDI) before and after dispersion with both PZT transducers.
In Figure 8, the black line shows the particle size distribution before ultrasonic dispersion, revealing the amount of TiO2 nanoparticles agglomerated in water. This distribution was significantly wide, ranging from less than 100 nm to approximately 6 μm. After dispersion with PZT transducer, the average particle sizes were 64 and 51 nm, respectively. The PDI is a measure of the broadness of particle distribution; the larger the PDI, the broader the particle distribution. The PDI of the TiO2 solution before ultrasonic dispersion was 9.4. In contrast, the PDIs after ultrasonic dispersion were only 1.4 (hard PZT transducer) and 1.6 (soft PZT transducer), indicating that the particle size was more uniform owing to ultrasonic dispersion. The difference of 0.2 in these PDIs after dispersion indicates that the hard PZT transducer leads to a more uniform particle size than the soft PZT.

3.4.2. Zeta Potential

To maintain the stability of the dispersed particles, they must be separated from electrostatic forces [35]. Thus, changes in colloidal stability were determined by measuring the zeta potential, which is a major indicator of colloidal dispersion stability [36,37]. It indicates the degree of electrostatic repulsion between adjacent similarly charged particles in a dispersed solution. A high zeta potential stabilizes small molecules and particles; therefore, a colloid with a high zeta potential, i.e., between ±40 and ±60 mV, can resist agglomeration, and the colloidal stability is considered to be excellent. If the zeta potential is low, i.e., less than ~35 mV [38], the attractive force exceeds the repulsive force, thereby breaking the suspension and leading to agglomeration. Figure 9 shows the zeta potential of the TiO2 colloid over time after dispersion using both PZT transducers.
The zeta potential in the case of ultrasonic dispersion using soft PZT transducer was approximately 43 mV, which was maintained for 30 days, before gradually decreasing to approximately 35 mV after 180 days. This implies that the repulsive force of the particles that prevents agglomeration was disturbed and that agglomeration could occur over time. However, when ultrasonic dispersion was performed using the hard PZT transducer, the zeta potential was approximately 48 mV, which slightly decreased over time and remained at 45 mV or more for 180 days. This was higher than the zeta potential of the sample dispersed using the soft PZT transducer. Based on these results, particle agglomeration in the sample dispersed using the hard PZT transducer can be concluded to have been less than that of the sample dispersed using soft PZT, and the dispersion stability of the hard PZT was superior.

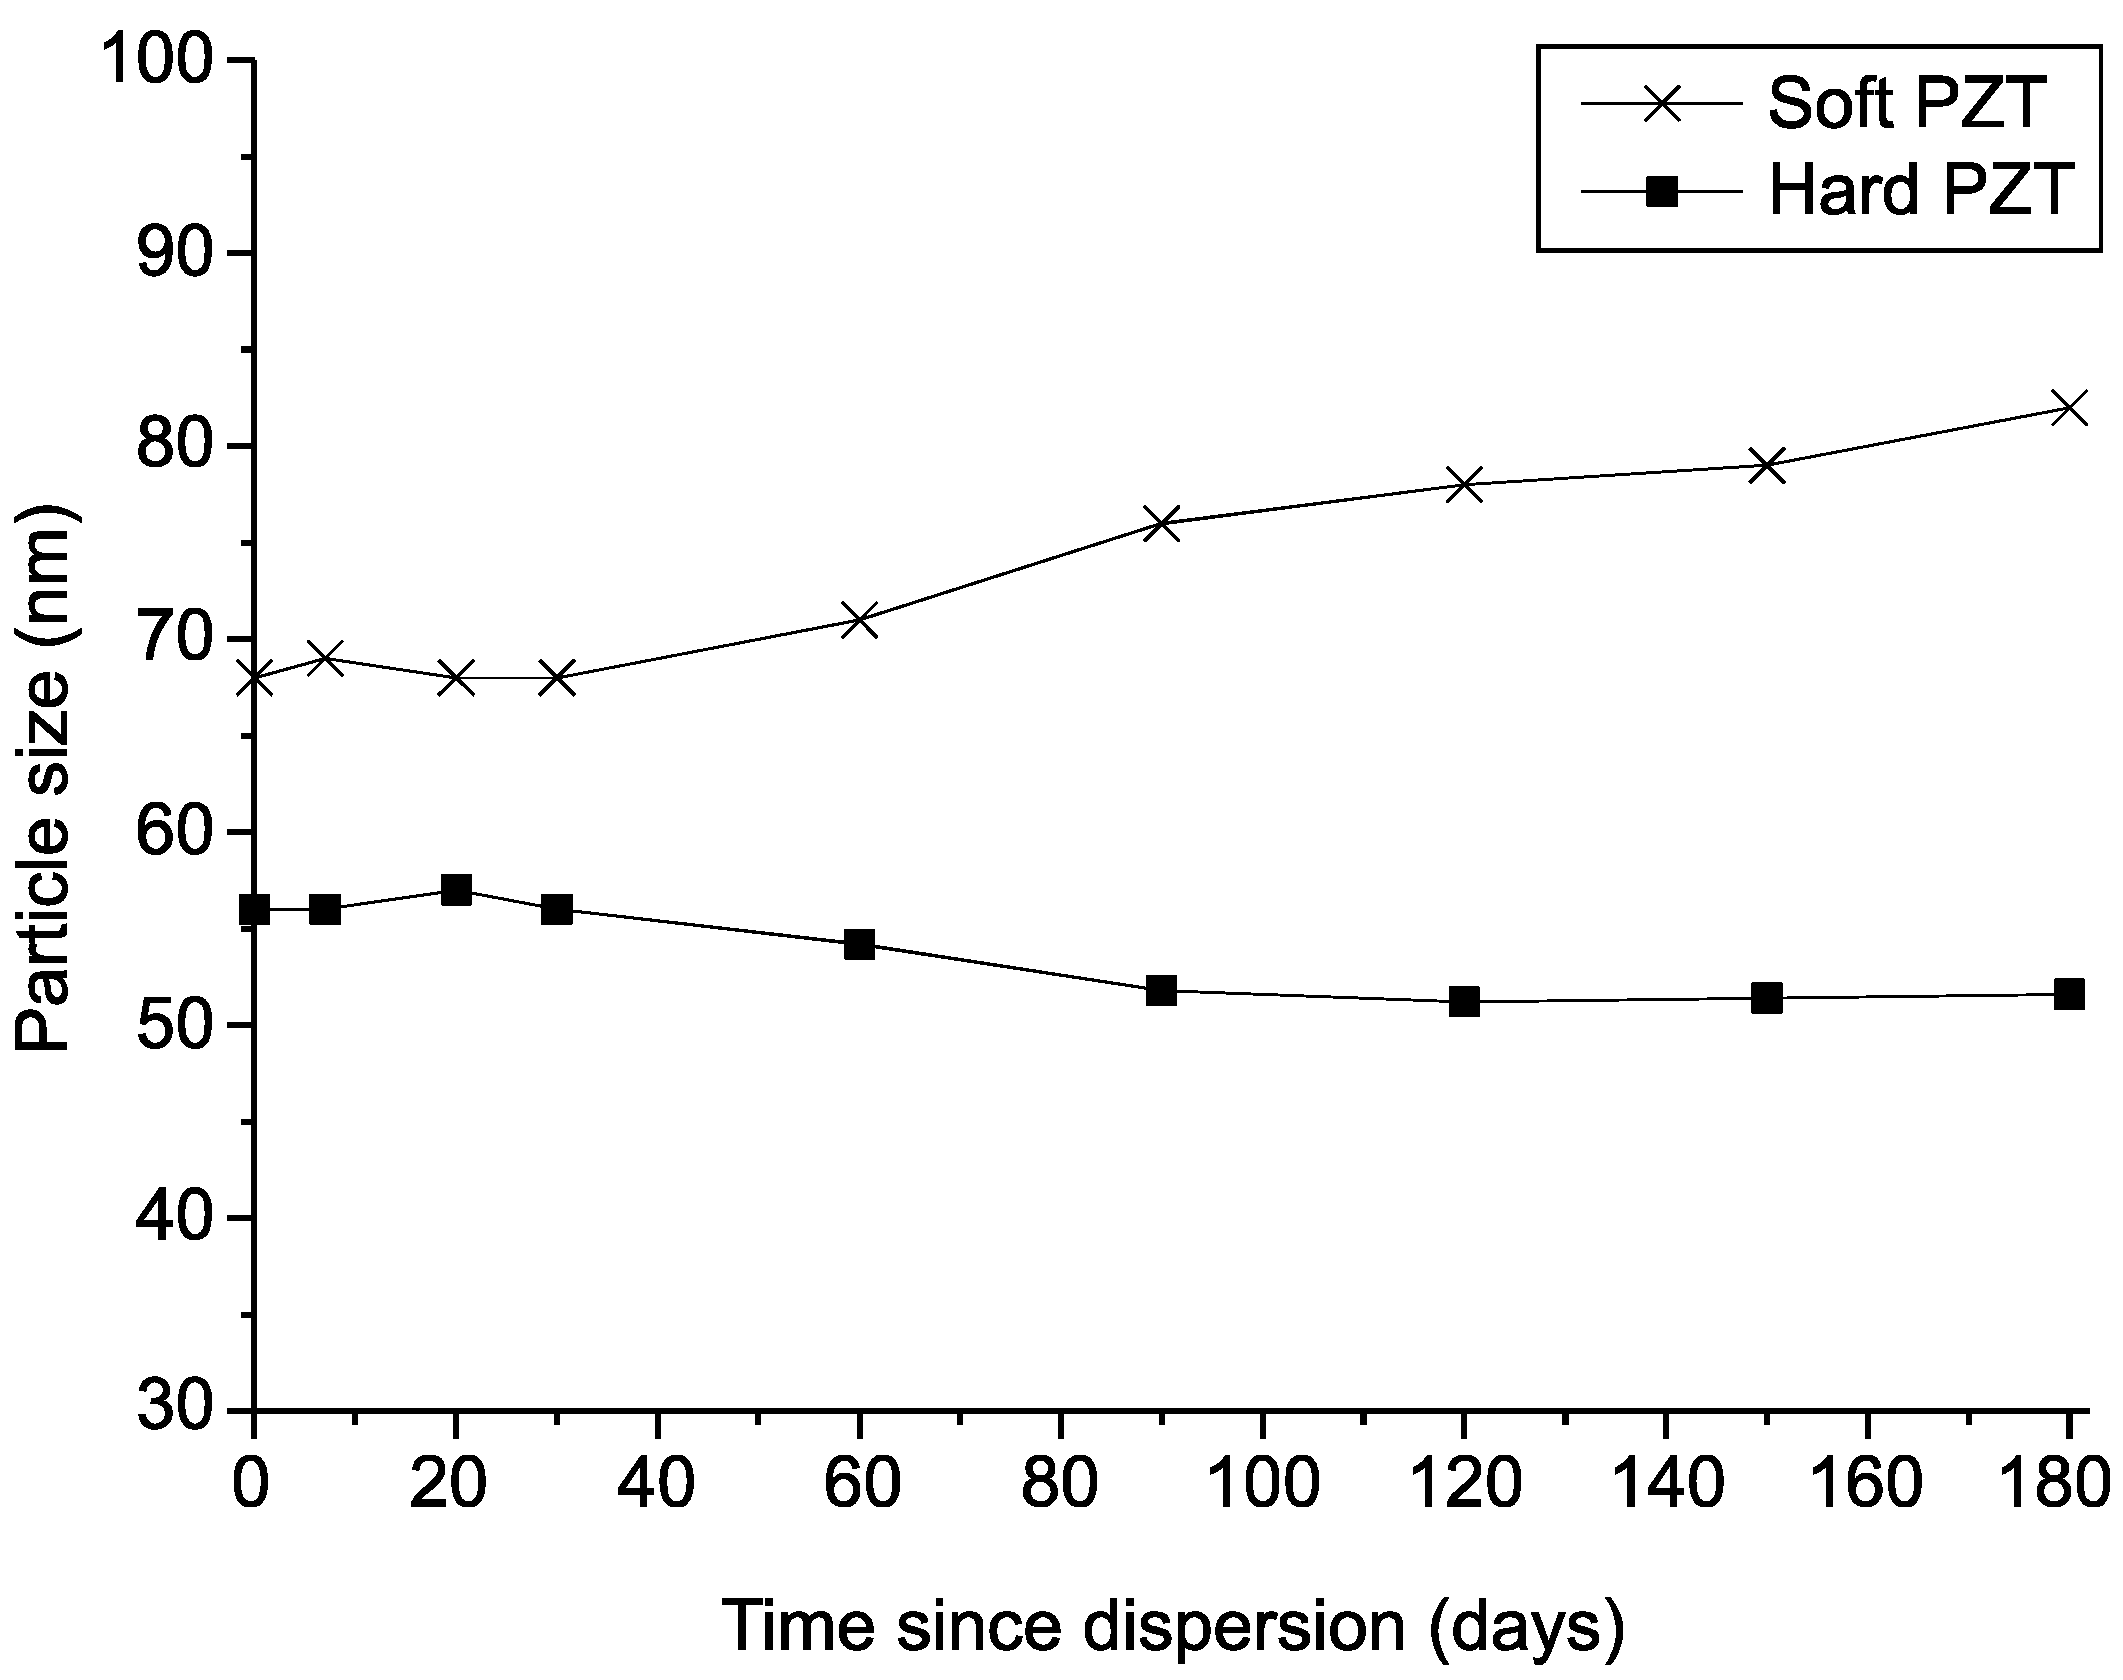
3.4.3. Stability of the TiO2 Colloids

The purpose of dispersion is to obtain a small, uniform hydrodynamic diameter of particles in a colloid [39], while increasing the duration of stability by preventing changes and re-agglomeration. Figure 10 tracks the changes in the particle size distribution over 180 days to evaluate the dispersion stability of the sample ultrasonically dispersed using both PZT transducers. Samples dispersed using the soft PZT transducer had a particle size distribution of approximately 65–68 nm immediately after dispersion, but some agglomeration was observed after 30 days, which coincided with the point when the value of the zeta potential became small. After 180 days, the average particle size was approximately 83–85 nm; this range is approximately 20 nm larger than the initial size, indicating that some particles agglomerated. Immediately after dispersion using the hard transducer, the average particle size was approximately 55 nm, and it remained at 50–55 nm for 180 days, indicating the particles did not agglomerate during this time. This result is similar to the zeta potential remaining at 45 mV or more for 180 days, in that, both sets of findings show the relatively high stability of samples dispersed using the hard PZT transducer.

4. Conclusions

In this study, the differences between the properties of two PZT transducers were evaluated, and each was used in an ultrasonic dispersion method to determine which is more suitable for particle dispersion in a nanoparticle suspension. Comparing their dispersion performance using a TiO2 nanoparticle suspension, the soft PZT transducer exhibited a mean particle size of approximately 60 nm after dispersion, whereas that of the hard PZT transducer was approximately 50 nm, which was approximately 10 nm smaller. In addition, the zeta potential was 10 mV higher for the hard PZT transducer than that of the soft PZT, indicating the former’s better dispersion stability. By observing the particle size change of TiO2 nanoparticle suspensions for 180 days, we confirmed that those dispersed by the hard PZT transducer did not agglomerate, indicating the excellent dispersion stability. Thus, the hard PZT transducer can be inferred to be more suitable for ultrasonic dispersion of nanoparticle suspensions than the soft PZT. The present study is expected to provide valuable insights into the development of efficient dispersion equipment and dispersion technologies.

Author Contributions

Conceptualization, S.A.H. and Y.M.C.; methodology, S.A.H.; software, Y.M.C.; validation, S.A.H. and Y.M.C. and T.G.L.; formal analysis, Y.M.C.; investigation, S.A.H. and Y.M.C.; resources, S.A.H. and Y.M.C.; data curation, S.A.H. and Y.M.C.; writing—original draft preparation, S.A.H. and Y.M.C.; writing—review and editing, T.G.L.; visualization, S.A.H. and Y.M.C. and T.G.L.; su-pervision, T.G.L.; project administration, T.G.L.; funding acquisition, S.A.H. and T.G.L. All authors have read and agreed to the published version of the manuscript.

Funding

This work was supported by the Nano-Material Technology Development Program of the National Research Foundation (NRF) funded by the Ministry of Science and ICT (grant number 2016M3A7B6908929); the Development of Measurement Standards and Technology for Biomaterials and Medical Convergence funded by the Korea Research Institute of Standards and Science (KRISS–2021–GP2021-0004); and the Technology Innovation Program (Development of reference standard for tubular piezoelectric ceramics for supply and diffusion of ultrasonic dispersion/emulsification technology (grant number 20011794)) funded by the Ministry of Trade, Industry, and Energy (MOTIE, Korea).

Conflicts of Interest

The authors declare no conflict of interest.

References

  1. Sumitomo, S.; Koizumi, H.; Azhar Uddin, M.; Kato, Y. Comparison of dispersion behavior of agglomerated particles in liquid between ultrasonic irradiation and mechanical stirring. Ultrason. Sonochem. 2018, 40, 822–831. [Google Scholar] [CrossRef] [PubMed]
  2. Inkyo, M.; Tahara, T.; Iwaki, T.; Iskandar, F.; Hogan, C.J., Jr.; Okuyama, K. Experimental investigation of nanoparticle dispersion by beads milling with centrifugal bead separation. J. Colloid Interface Sci. 2006, 304, 535–540. [Google Scholar] [CrossRef] [PubMed]
  3. Jing, L.; Weilin, X.; Jun, D.; Yanwei, Z.; Qi, Z. Experimental study on the impact characteristics of cavitation bubble collapse on awall. Water 2018, 10, 1262. [Google Scholar]
  4. Schlender, M.; Minke, K.; Schuchmann, P. Sono-chemiluminescence (SCL) in a high-pressure double stage homogenization processes. J. Chem. Eng. Sci. 2016, 142, 1–11. [Google Scholar] [CrossRef]
  5. Leighton, T.G. The Acoustic Bubble, 1st ed.; Academic Press: London, UK, 1994. [Google Scholar]
  6. Flannigan, D.J.; Suslick, K.S. Plasma formation and temperature measurement during single-bubble cavitation. Nat. Cell Biol. 2005, 434, 52–55. [Google Scholar] [CrossRef]
  7. Tzanakis, I.; Eskin, D.; Georgoulas, A.; Fytanidis, D. Incubation pit analysis and calculation of the hydrodynamic impact pressure from the implosion of an acoustic cavitation bubble. Ultrason. Sonochem. 2014, 21, 866–878. [Google Scholar] [CrossRef] [PubMed]
  8. Gedanken, A. Using sonochemistry for the fabrication of nanomaterials. Ultrason. Sonochem. 2004, 11, 47–55. [Google Scholar] [CrossRef] [PubMed]
  9. Manbachi, A.; Cobbold, R.S. Development and application of piezoelectric materials for ultrasound generation and detection. Ultrasound 2011, 19, 187–196. [Google Scholar] [CrossRef]
  10. Choi, Y.M.; Lee, Y.L.; Lim, E.S.; Trimzi, M.A.; Hwangbo, S.A.; Ham, Y.B. Performance improvement of ring-type PZT ceramics for ultrasonic dispersion system. Micromachines 2020, 11, 144. [Google Scholar] [CrossRef] [Green Version]
  11. Jaffe, B.; Cook, W.R.; Jaffe, H. Piezoelectric Ceramics, 1st ed.; Academic Press: London, UK, 1971. [Google Scholar]
  12. Heartling, G.H. Ferroelectric ceramics: History and technology. J. Am. Ceram. Soc. 1999, 82, 797–818. [Google Scholar] [CrossRef]
  13. Cross, L.E. Ferroelectric materials for electromechanical transducer applications. Mater. Chem. Phys. 1996, 43, 108–115. [Google Scholar] [CrossRef]
  14. Moulson, A.J.; Herbert, J.M. Electroceramics: Materials, Properties, Applications, 2nd ed.; Wiley–Interscience: New York, NY, USA, 2003. [Google Scholar]
  15. Uchino, K. Ferroelectric Devices; CRC Press: Boca Raton, FL, USA, 2000. [Google Scholar]
  16. Xu, Y.H. Ferroelectric Materials and Their Applications; North Holland Publishing Co.: Amsterdam, The Netherlands, 1991. [Google Scholar]
  17. Cross, L.E. Relaxor ferroelectrics. Ferroelectronics 1987, 76, 241–267. [Google Scholar] [CrossRef]
  18. Cao, W.; Cross, L.E. Theoretical model for the morphotropic phase boundary in lead zirconate–lead titanate solid solution. Phys. Rev. B 1993, 47, 4825–4830. [Google Scholar] [CrossRef]
  19. Takahashi, S. Effects of impurity doping in lead zirconate-titanate ceramics. Ferroelectronics 1982, 41, 143–156. [Google Scholar] [CrossRef]
  20. Kulcsar, F. Electromechanical properties of lead titanate zirconate ceramics modified with certain three-or five-valent additions. J. Am. Ceram. Soc. 1959, 42, 343–349. [Google Scholar] [CrossRef]
  21. Boris, S.; Aronov, E.; Aikins, K.; Brown, D.A. Increasing piezoelectric effect in radially polarized soft piezoelectric cylinders by pressure treating and its practical applications. J. Acoust. Soc. Am. 2020, 147, 4145. [Google Scholar]
  22. Kim, K.M.; Park, S.H.; Kim, S.W.; Son, W.G.; Shin, B.C. Fabrication and characteristic of metal inserted Teflon diaphragm piezoeletric device module using quartz crystal oscillator. J. Kor. Sens. Soc. 2010, 19, 149–154. [Google Scholar]
  23. North, P.F. Towards an absolute measurement of soil structural stability using ultrasound. Eur. J. Soil Sci. 1976, 27, 451–459. [Google Scholar] [CrossRef]
  24. DeLoid, G.M.; Cohen, J.M.; Pyrgiotakis, G.; Demokritou, P. Preparation, characterization, and in vitro dosimetry of dispersed, engineered nanomaterials. Nat. Protoc. 2017, 12, 355–371. [Google Scholar] [CrossRef]
  25. Sazgarnia, A.; Shanei, A.; Eshghi, H.; Hassanzadeh-Khayyat, M.; Esmaily, H.; Shanei, M.M. Detection of sonoluminescence signals in a gel phantom in the presence of Protoporphyrin IX conjugated to gold nanoparticles. Ultrasonics 2013, 53, 29–35. [Google Scholar] [CrossRef]
  26. Jun, B.-M.; Han, J.; Park, C.M.; Yoon, Y. Ultrasonic degradation of selected dyes using Ti3C2Tx MXene as a sonocatalyst. Ultrason. Sonochem. 2020, 64, 104993. [Google Scholar] [CrossRef] [PubMed]
  27. Vinatoru, M.; Mason, T.J. Can sonochemistry take place in the absence of cavitation?—A complementary view of how ultrasound can interact with materials. Ultrason. Sonochem. 2019, 52, 2–5. [Google Scholar] [CrossRef] [PubMed]
  28. Sokol, M.; Kalabukhov, S.; Shneck, R.Z.; Zaretsky, E.B.; Frage, N. Effect of grain size on the static and dynamic mechanical properties of magnesium aluminate spinel (MgAl 2 O 4 ). J. Eur. Ceram. Soc. 2017, 37, 3417–3424. [Google Scholar] [CrossRef]
  29. Puchmark, C.; Rujijanagul, G.; Jiansirisomboon, S.; Tunkasiri, T.; Vittayakorn, N.; Comyn, T.; Milne, S. Mechanical property evaluation of PZT/Al2O3 composites prepared by a simple solid-state mixed oxide method. Curr. Appl. Phys. 2006, 6, 323–326. [Google Scholar] [CrossRef]
  30. Mentler, A.; Schomakers, J.; Kloss, S.; Zechmeister-Boltenstern, S.; Schuller, R.; Mayer, H. Calibration of ultrasonic power output in water, ethanol and sodium polytungstate. Int. Agrophys. 2017, 31, 583–588. [Google Scholar] [CrossRef] [Green Version]
  31. Koda, S.; Kimur, T.; Kondo, T.; Mitome, H. A standard method to calibrate sonochemical efficiency of an individual reaction system. Ultrason. Sonochem. 2003, 10, 149–156. [Google Scholar] [CrossRef]
  32. Tiong, T.J.; Chandesa, T.; Yap, Y.H. Comparison of sonochemiluminescence images using image analysis techniques and identification of acoustic pressure fields via simulation. Ultrason. Sonochem. 2017, 36, 78–87. [Google Scholar] [CrossRef]
  33. Tzanakis, I.; Darut, G.; Eskin, D.G.; Pericleous, K. Effect of input power and temperature on the cavitation intensity during the ultrasonic treatment of molten aluminium. Trans. Indian Inst. Met. 2015, 68, 1023–1026. [Google Scholar] [CrossRef] [Green Version]
  34. Schuck, P. Size-distribution analysis of macromolecules by sedimentation velocity ultracentrifugation and lamm equation modeling. Biophys. J. 2000, 78, 1606–1619. [Google Scholar] [CrossRef] [Green Version]
  35. Greenwood, R.; Kendall, K. Electroacoustic studies of moderately concentrated colloidal suspensions. J. Eur. Ceram. Soc. 1999, 19, 478–488. [Google Scholar]
  36. Hanaor, D.A.H.; Michelazzi, M.; Leonelli, C.; Sorrell, C.C. The effects of carboxylic acids on the aqueous dispersion and electrophoretic deposition of ZrO2. J. Eur. Ceram. Soc. 2012, 32, 235–244. [Google Scholar] [CrossRef] [Green Version]
  37. O’Brien, R.W.; Midmore, B.R.; Lamb, A.; Hunter, R.J. Electroacoustic studies of moderately concentrated colloidal suspensions. Faraday Discuss. Chem. Soc. 1990, 90, 301–312. [Google Scholar] [CrossRef]
  38. Young, F.R. Sonoluminescence from water containing dissolved gases. J. Acoust. Soc. Am. 1976, 60, 100–104. [Google Scholar] [CrossRef]
  39. Bredberg, I.; Keeler, C.; Lysov, V.; Strominger, A. From navier-stokes to einstein. J. High Energy Phys. 2012, 146, 1–18. [Google Scholar] [CrossRef] [Green Version]
Figure 1. Poling process for ring-shaped PZT ceramic.
Micromachines 12 00052 g001
Figure 2. Photograph and schematic of the setup used to measure ultrasonic power by the calorimetry method.
Micromachines 12 00052 g002
Figure 3. Photograph and schematic of the setup used to measure the acoustic pressure.
Micromachines 12 00052 g003
Figure 4. Schematic of the ultrasonic dispersion equipment for TiO2 nanoparticle in deionized water.
Micromachines 12 00052 g004
Figure 5. SEM images of fractured surfaces of (a) soft PZT ceramics (3000×), (b) soft PZT ceramics (10,000×), (c) hard PZT ceramics (3000×) and (d) hard PZT ceramics (10,000×).
Micromachines 12 00052 g005
Figure 6. Variation in heat loss as a function of time for PZT transducer: (a) change in the total heat loss and (b) change in the heat loss per unit time.
Micromachines 12 00052 g006
Figure 7. Variation in acoustic pressure delivered by the PZT transducer with voltage.
Micromachines 12 00052 g007
Figure 8. Particle size distributions and polydispersity indexes (PDIs) before and after dispersion using two PZT transducers (black: before dispersion, blue: after dispersion with soft PZT transducer, red: after dispersion with hard PZT transducer).
Micromachines 12 00052 g008
Figure 9. Zeta potential values of TiO2 colloids over time after dispersion using both PZT transducers (1 wt.%).
Micromachines 12 00052 g009
Figure 10. Variations in the particle size distributions of TiO2 colloids (1 wt.%) with time.
Micromachines 12 00052 g010
Table 1. Specifications of ring-shaped lead zirconate titanate (PZT) transducers.
CharacteristicHard PZT Ceramic
(DONGIL TECH. Co., Ltd.)
Soft PZT Ceramic
(Piezo Technologies)
Outer Diameter (mm)49.9049.96
Inner Diameter (mm)39.9039.82
Length (mm)25.0025.00
Frequency Constant (m/s)2107.002035.61
Resonant Frequency (kHz)421.40401.50
Resonant Resistance (Ω)1.306.09
Electro-Mechanical Coupling Factor (Keff)0.3100.262
Capacitance (nF)8.9011.72
Impedance (Ω)1.8116.08
Dielectric Constant (ε33T0)14391877
*tan δ0.0030.017
*tan δ is the loss tangent. For piezoelectric actuators, the loss tangent depends on the voltage amplitude.
Table 2. Change of resonant frequency before and after housing connection.
TypeResonant Frequency (kHz)
without Housingwith Housing
Hard PZT ceramic421.40396.2
Soft PZT ceramic401.50396.6
Table 3. Experimental conditions used for ultrasonic dispersion.
TypeApplied Frequency (kHz)Applied Power
(W)
Exposure Time
(min)
Hard PZT transducer396.2100120
Soft PZT transducer396.6100120
Table 4. Physical properties of the nanoparticles, solvent, and suspension used in the experiment.
NanoparticleLiquidSuspension
TiO2 (Degussa (Evonik) P25)Deionized waterTiO2 colloid
Concentration: 1 wt.%
Volume: 100 mL
Pre-treatment: none
pH: 4.9–5.2
Mean diameter: 25 nmResistivity: 18.2 MΩ·cm
Density: 3.78 g/cm3pH: 7.2–7.6
Publisher’s Note: MDPI stays neutral with regard to jurisdictional claims in published maps and institutional affiliations.

