RhoA and Rac1 in Liver Cancer Cells: Induction of Overexpression Using Mechanical Stimulation


Abstract
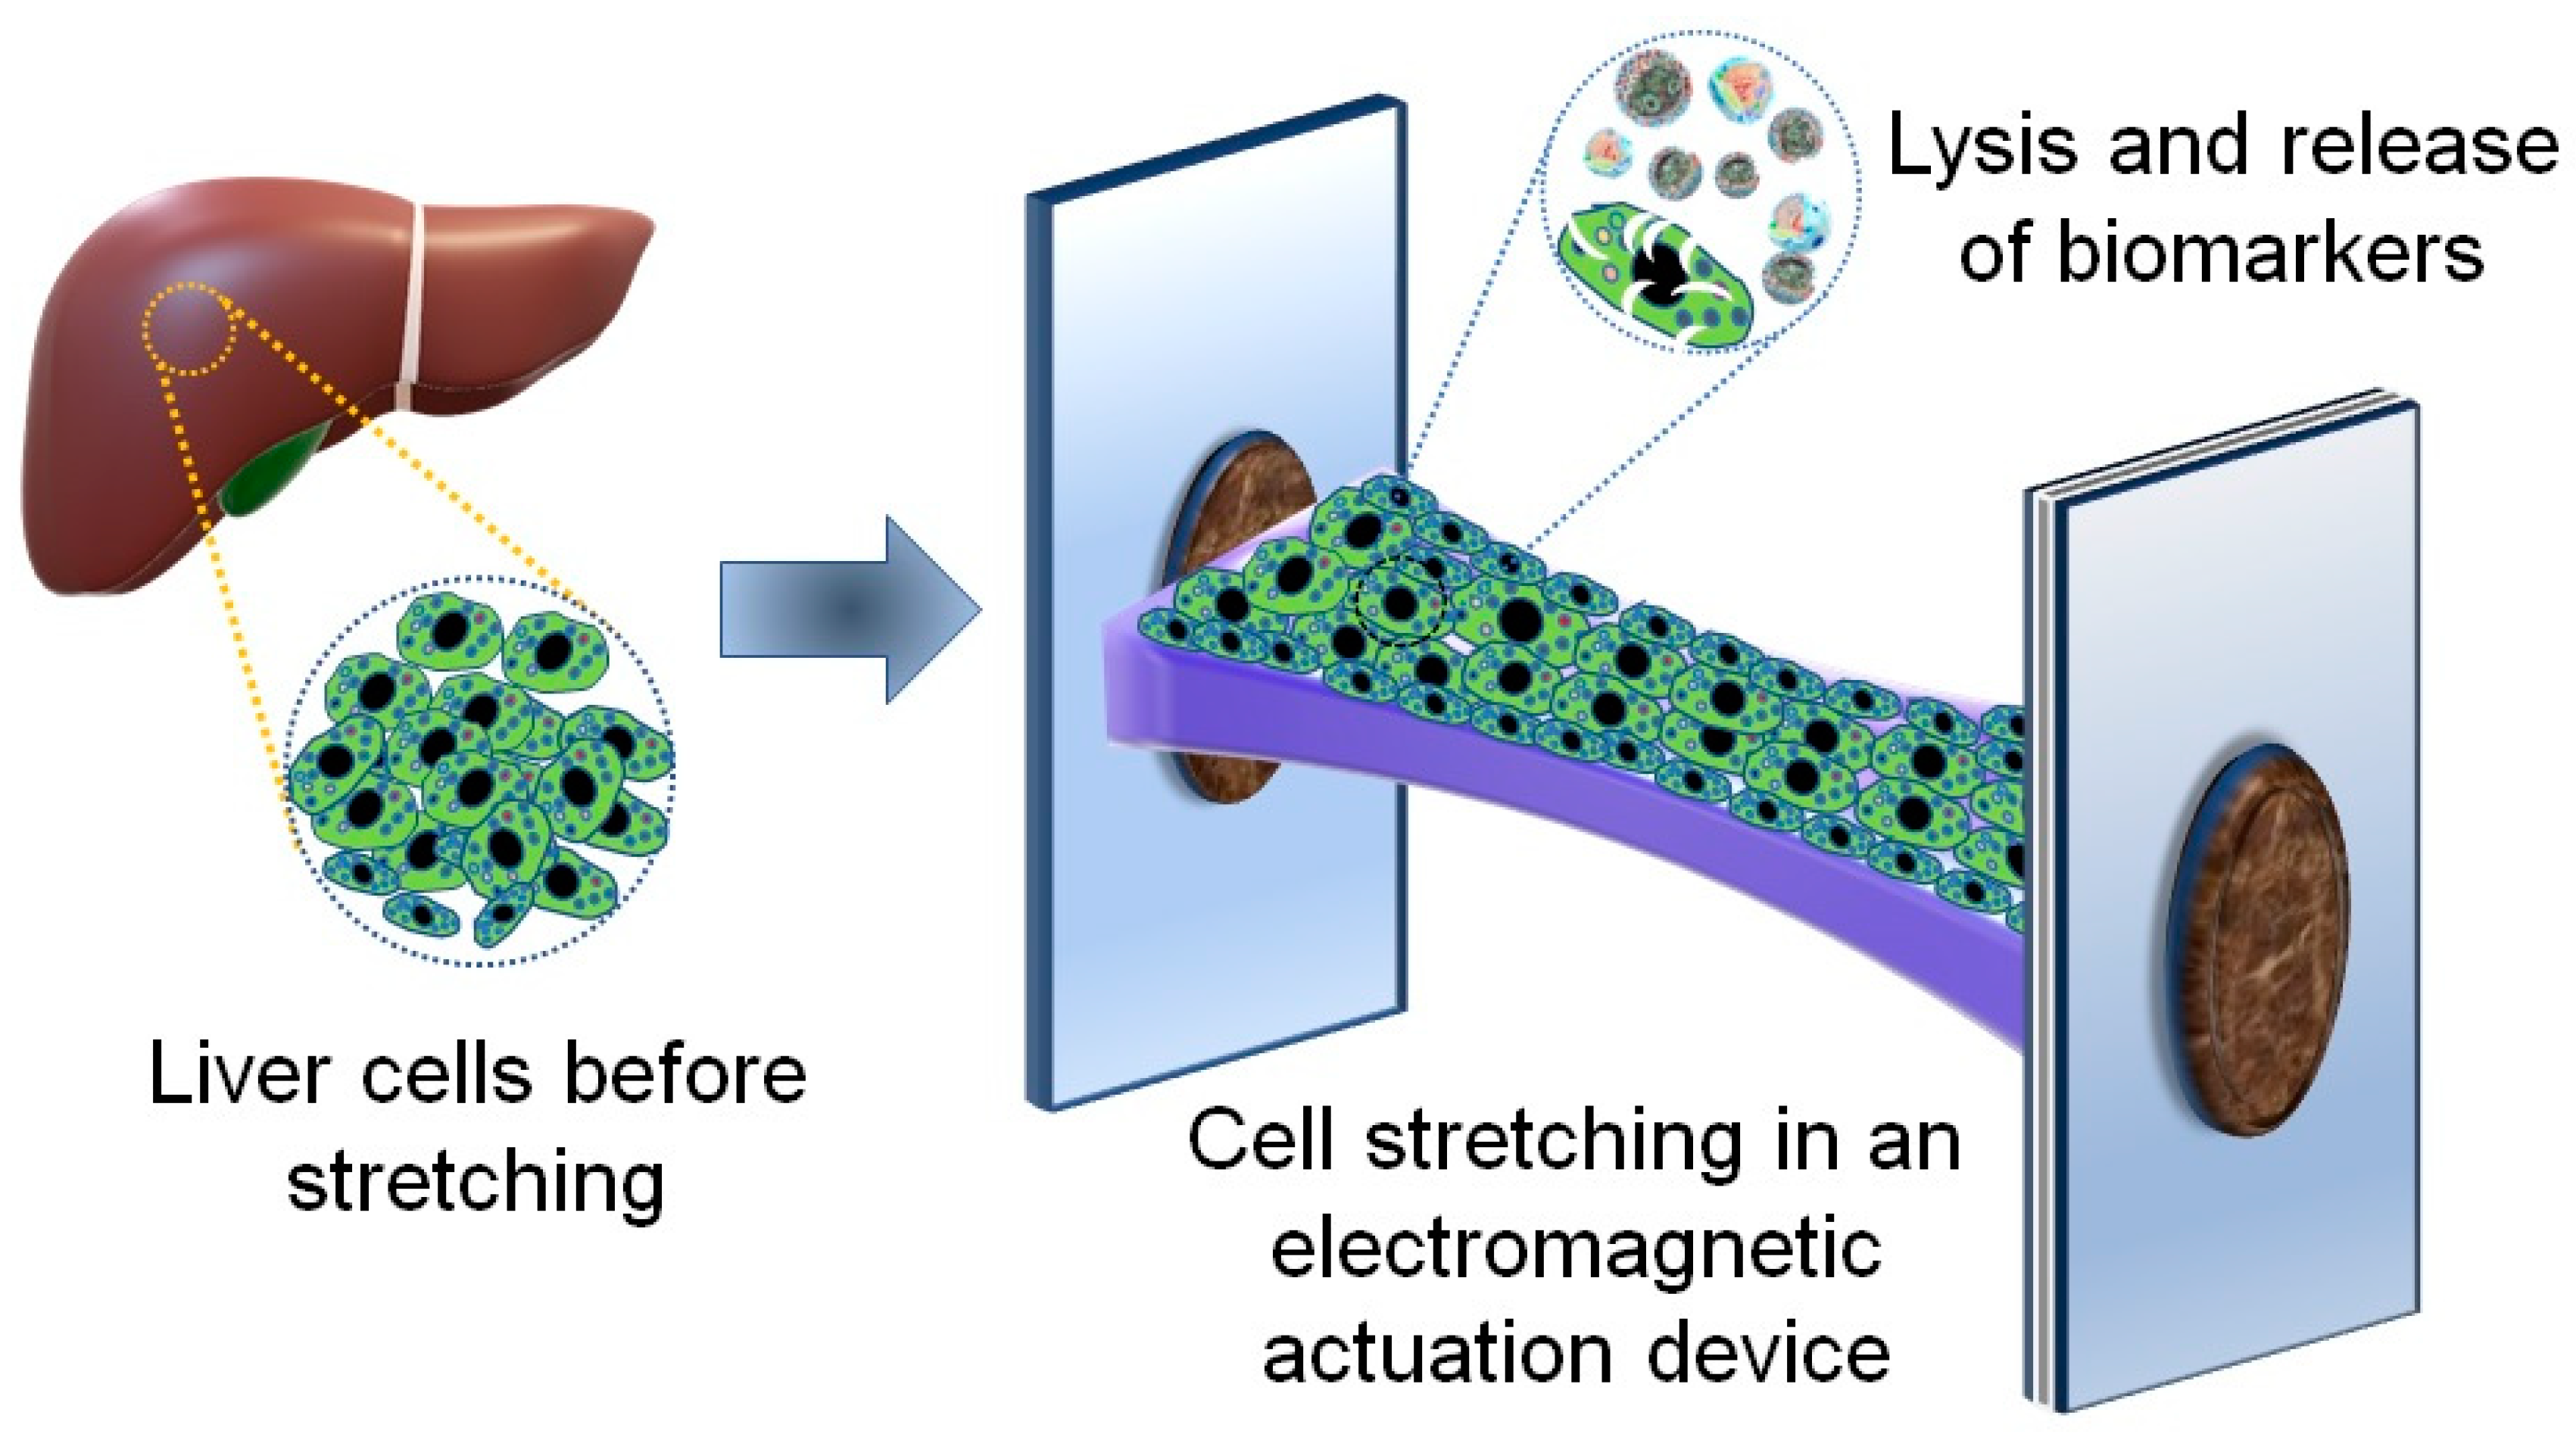
1. Introduction
2. Materials and Methods
2.1. An Electromagnetic Actuation Device for Cell Stretching
2.2. Seeding and Culturing Liver Cancer Cells on the Deformable Membrane of the Electromagnetic Device
2.3. Applying Cyclic Stretching on the Cultured Cells
2.4. Cell Lysis Procedure
2.5. Quantification and Detection of RhoA and Rac1 Biomarkers Using ELISA Technique
2.6. Statistical Analysis
2.7. Immunofluorosence Staining
2.8. Fluorescence Microscopy
3. Results and Discussion
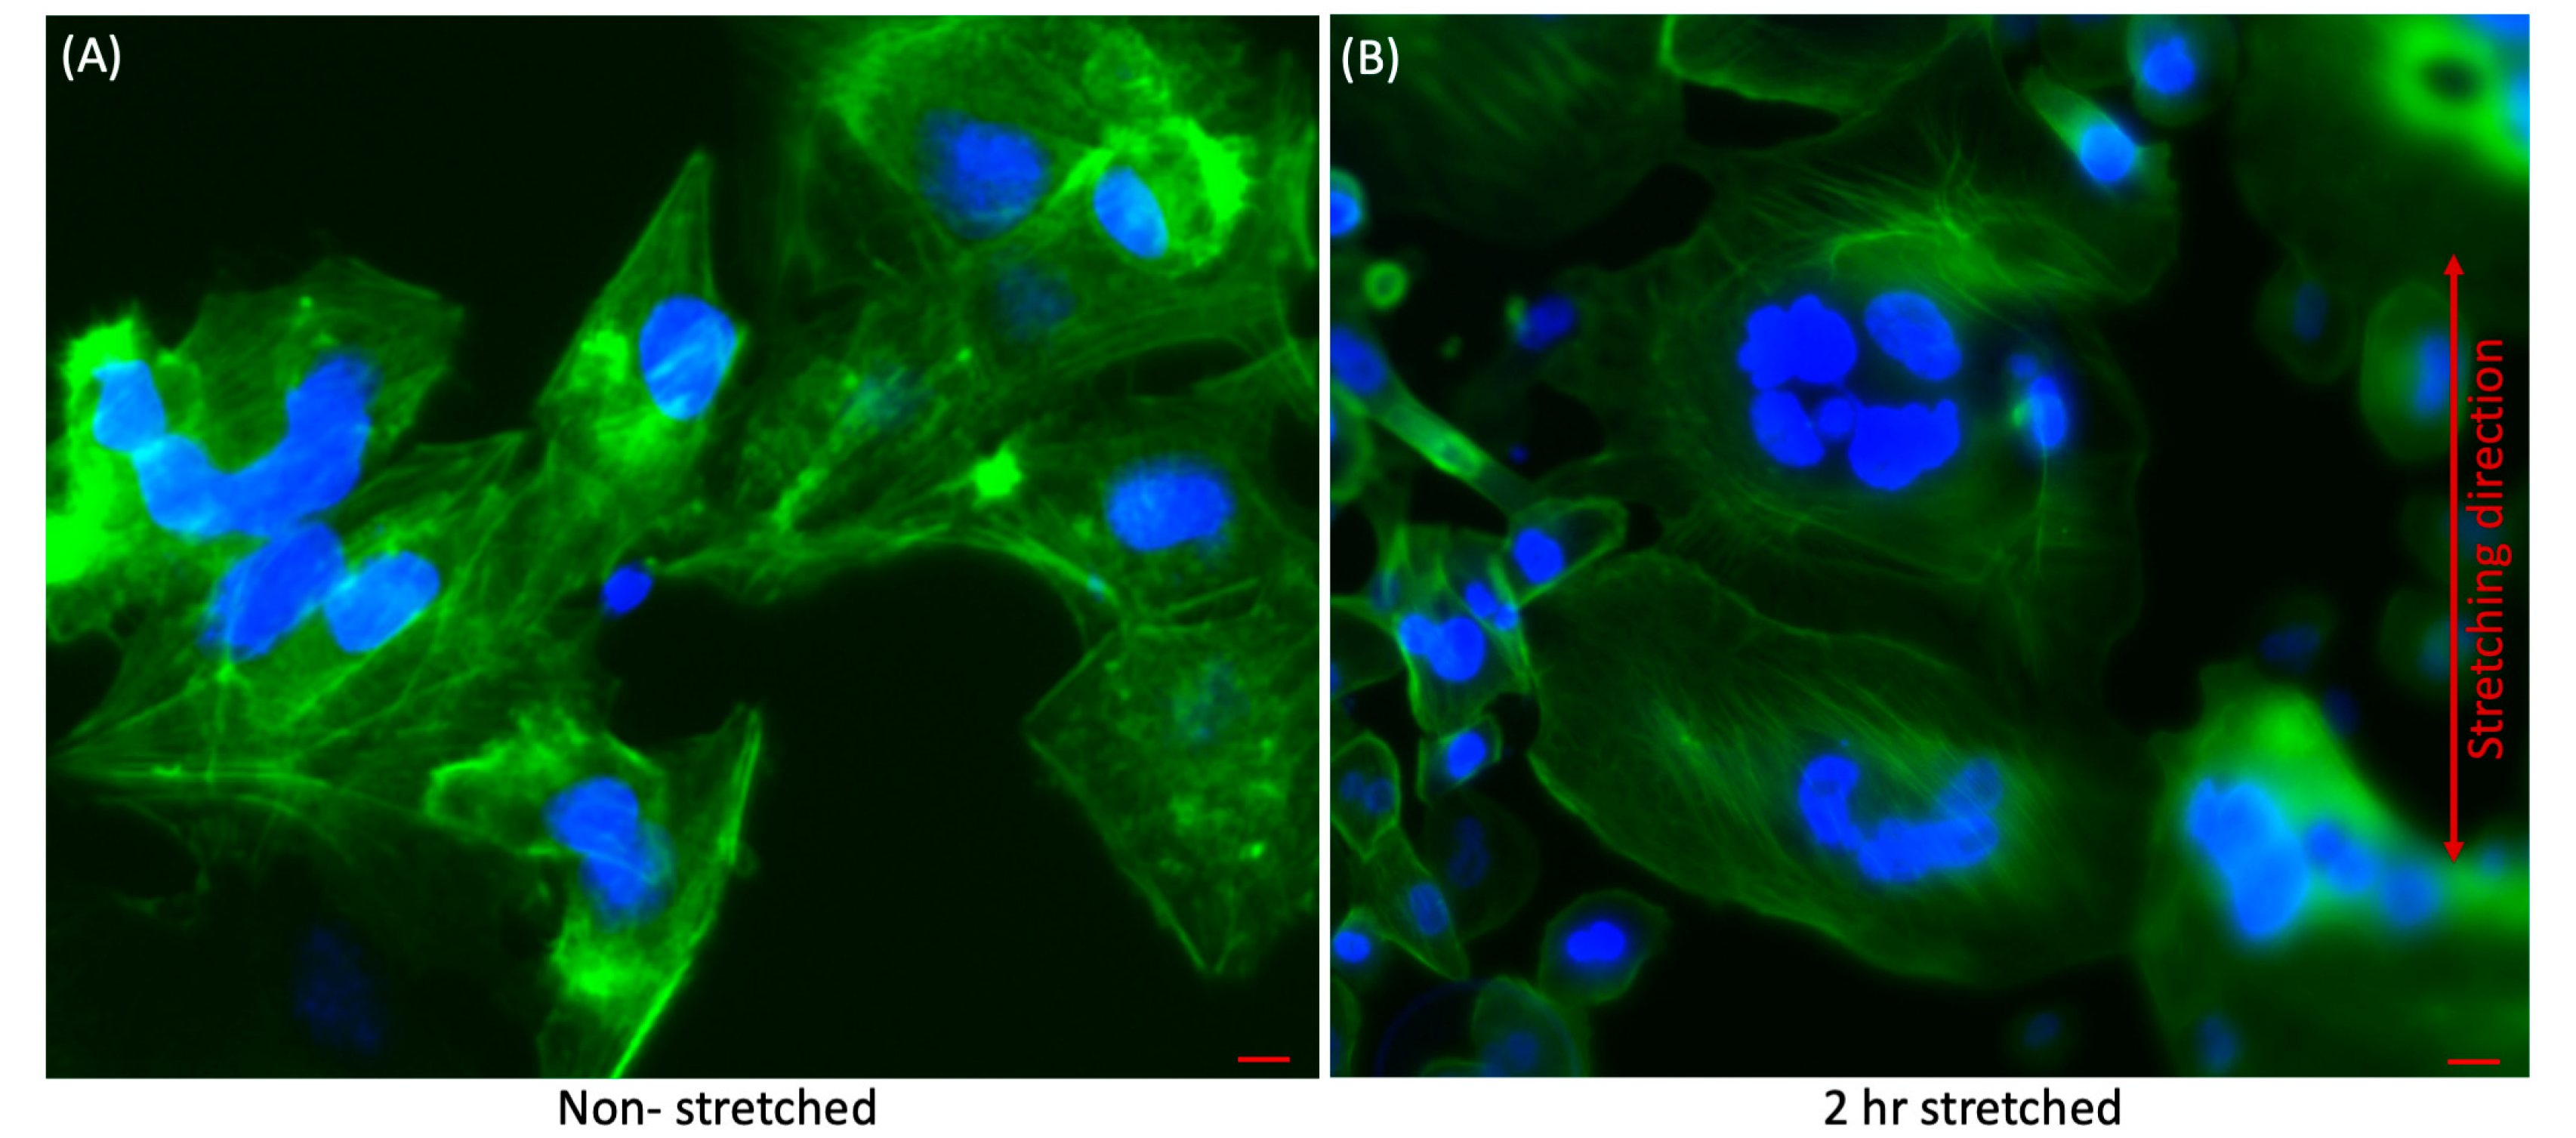
3.1. Qualitative Analysis of Effect of Stretching on Liver Cancer Cells
3.2. Quantitative Analysis of Effect of Stretching on Liver Cancer Cells
3.2.1. Difference between the Concentrations of RhoA and Rac1 before and after Applying Mechanical Strain
3.2.2. Time-Dependent Expression of RhoA
3.2.3. Detection of RhoA in Multiple Cell Lines
3.2.4. Time-Dependent Expression of Rac1
3.2.5. Detection of Rac1 in Multiple Cell Lines
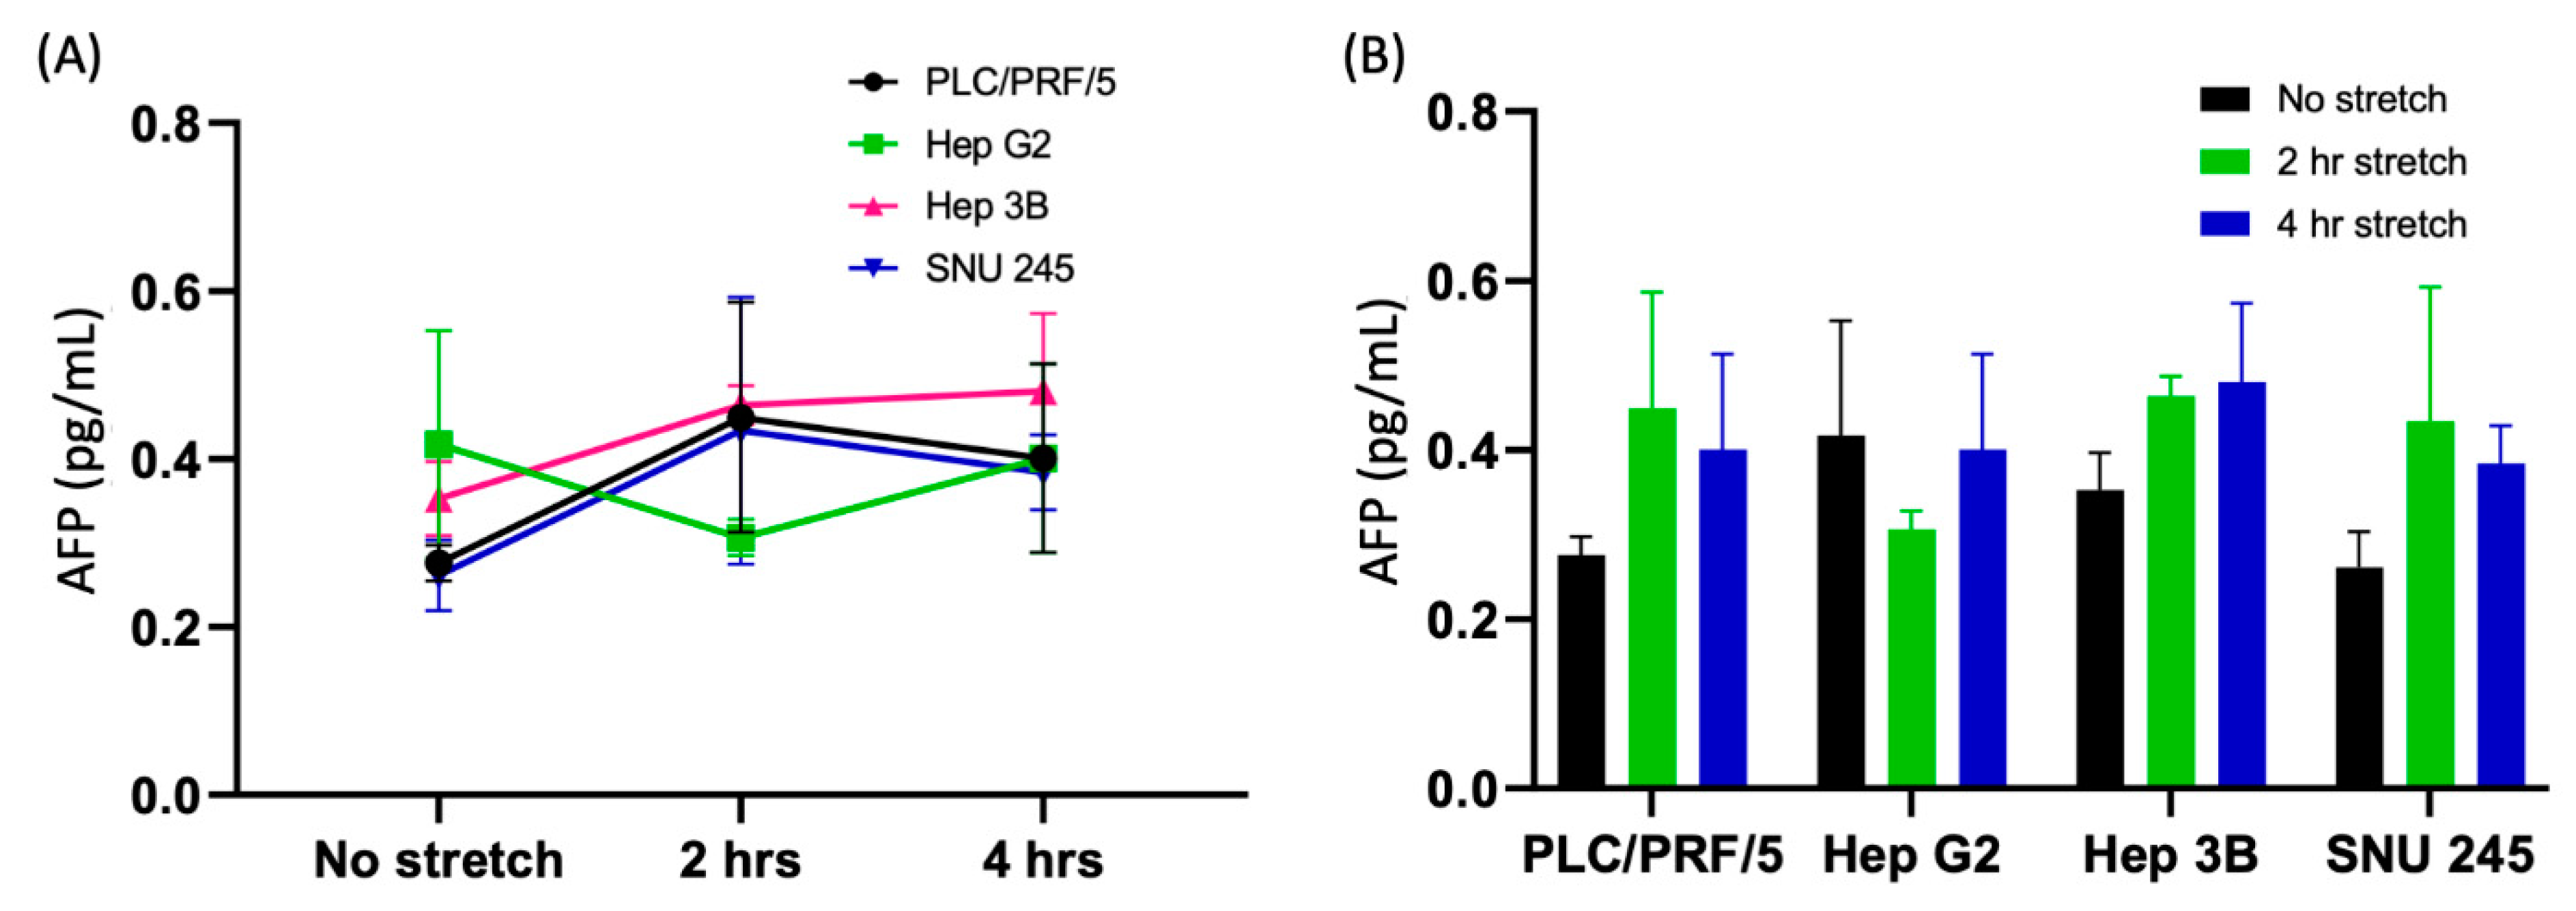
3.2.6. Time-Dependent Activation of AFP
4. Conclusions
Author Contributions
Funding
Acknowledgments
Conflicts of Interest
Appendix A
Appendix A.1. Different Cell Lysis Methods
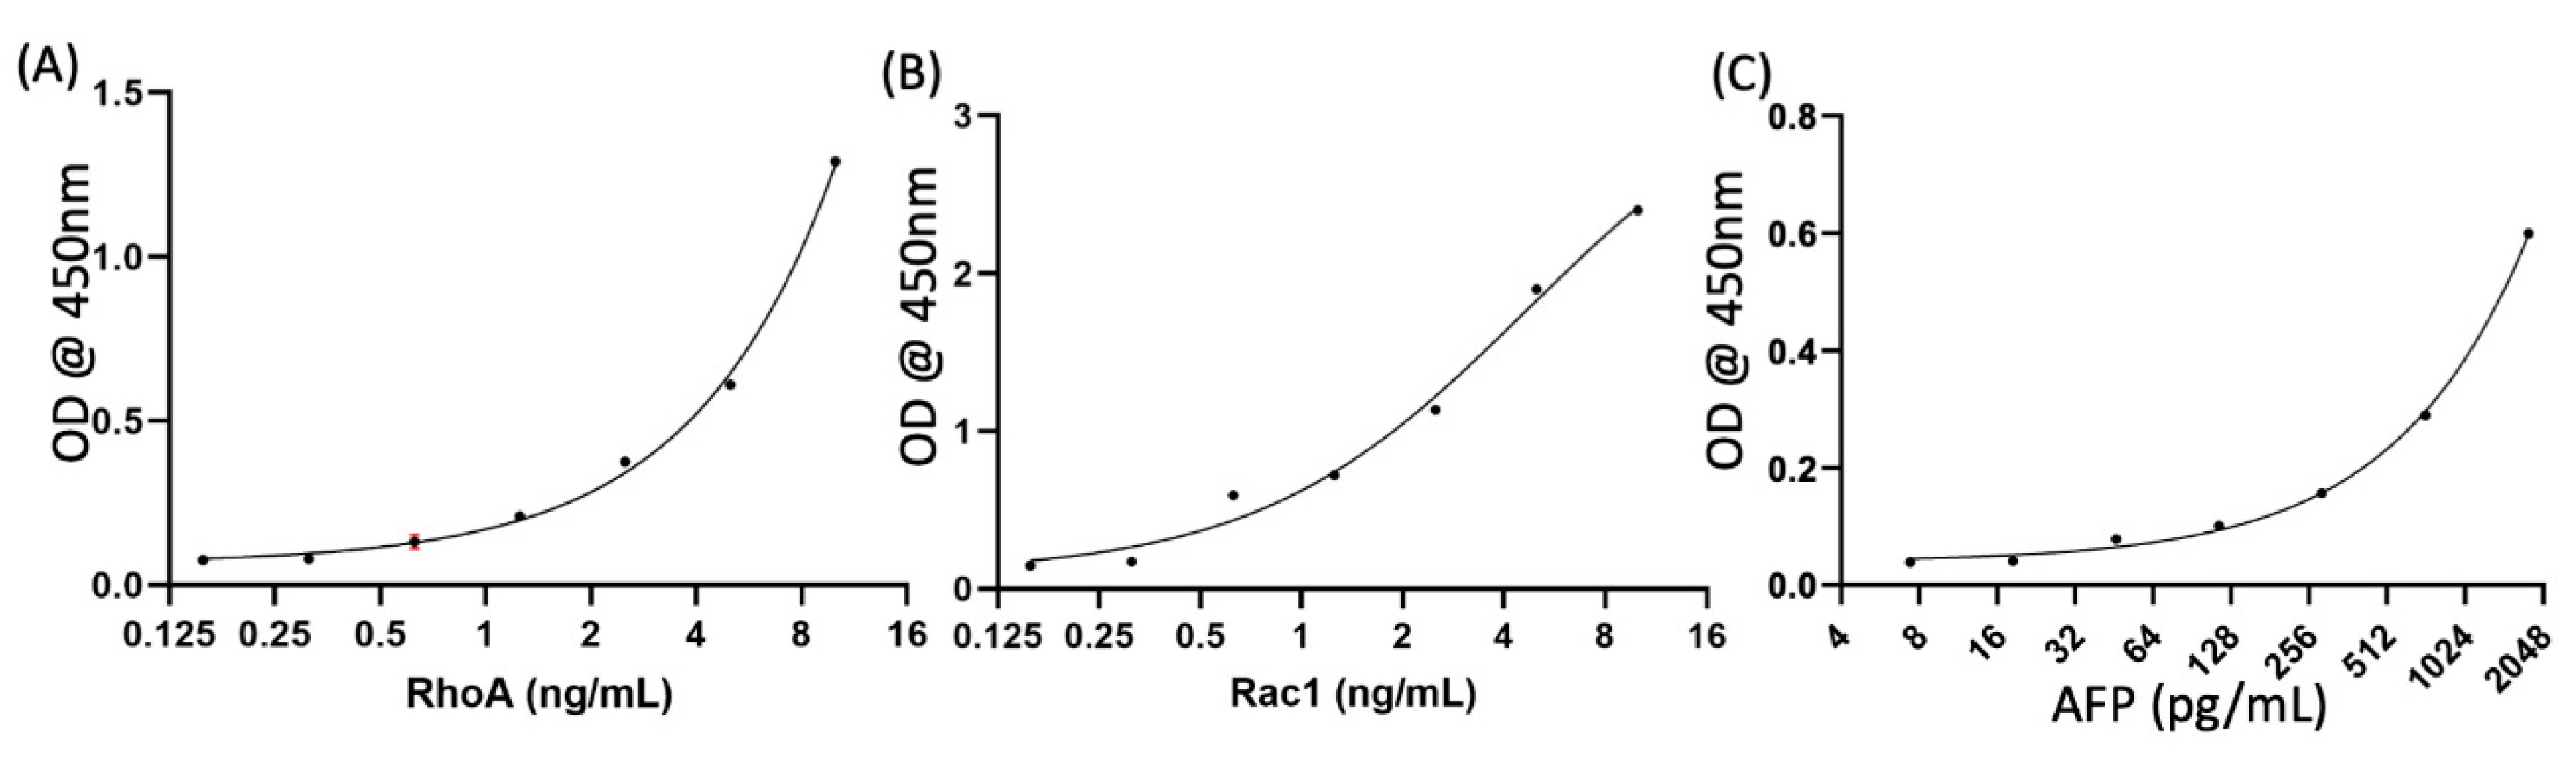
Appendix A.2. Standard Curve

Appendix A.3. Quantification of Control Marker AFP


| S.N. | Comparison | p Value | Summary |
|---|---|---|---|
| 1 | PLC/PRF/5 No stretch vs. 2 h stretch No stretch vs. 4 h stretch | 0.5139 0.8373 | ns ns |
| 2 | Hep G2 No stretch vs. 2 h stretch No stretch vs. 4 h stretch | 0.9045 >0.9999 | ns ns |
| 3 | Hep 3B No stretch vs. 2 h stretch No stretch vs. 4 h stretch | 0.9033 0.8183 | ns ns |
| 4 | SNU 245 No stretch vs. 2 h stretch No stretch vs. 4 h stretch | 0.5188 0.8486 | ns ns |
References
- Bray, F.; Ferlay, J.; Soerjomataram, I.; Siegel, R.L.; Torre, L.A.; Jemal, A. Global cancer statistics 2018: Globocan estimates of incidence and mortality worldwide for 36 cancers in 185 countries. CA Cancer J. Clin. 2018, 68, 394–424. [Google Scholar] [CrossRef]
- Ferlay, J.; Colombet, M.; Soerjomataram, I.; Mathers, C.; Parkin, D.M.; Pineros, M.; Znaor, A.; Bray, F. Estimating the global cancer incidence and mortality in 2018: Globocan sources and methods. Int. J. Cancer 2019, 144, 1941–1953. [Google Scholar] [CrossRef] [PubMed]
- Kew, M.C. Hepatocellular carcinoma: Epidemiology and risk factors. J. Hepatocell. Carcinoma 2014, 1, 115–125. [Google Scholar] [CrossRef] [PubMed]
- McGlynn, K.A.; London, W.T. The global epidemiology of hepatocellular carcinoma: Present and future. Clin. Liver Dis. 2011, 15, 223–243. [Google Scholar] [CrossRef]
- Sanyal, A.J.; Yoon, S.K.; Lencioni, R. The etiology of hepatocellular carcinoma and consequences for treatment. Oncologist 2010, 15 (Suppl. 4), 14–22. [Google Scholar] [CrossRef] [PubMed]
- Grise, F.; Bidaud, A.; Moreau, V. Rho gtpases in hepatocellular carcinoma. Biochim. Biophys. Acta 2009, 1795, 137–151. [Google Scholar] [CrossRef] [PubMed]
- Farazi, P.A.; DePinho, R.A. Hepatocellular carcinoma pathogenesis: From genes to environment. Nat. Rev. Cancer 2006, 6, 674–687. [Google Scholar] [CrossRef]
- El-Serag, H.B.; Rudolph, K.L. Hepatocellular carcinoma: Epidemiology and molecular carcinogenesis. Gastroenterology 2007, 132, 2557–2576. [Google Scholar] [CrossRef]
- Stecca, T.; Pauletti, B.; Bonariol, L.; Caratozzolo, E.; Massani, M. Bile Duct Cancer: Preoperative Evaluation and Management; IntechOpen: London, UK, 2019. [Google Scholar]
- Rostami, P.; Kashaninejad, N.; Moshksayan, K.; Saidi, M.S.; Firoozabadi, B.; Nguyen, N.-T. Novel approaches in cancer management with circulating tumor cell clusters. J. Sci. Adv. Mater. Devices 2019, 4, 1–18. [Google Scholar] [CrossRef]
- Yuen, M.F.; Lai, C.L. Serological markers of liver cancer. Best Pract. Res. Clin. Gastroenterol. 2005, 19, 91–99. [Google Scholar] [CrossRef] [PubMed]
- Gu, Y.; Jasti, A.C.; Jansen, M.; Siefring, J.E. Rhoh, a hematopoietic-specific rho gtpase, regulates proliferation, survival, migration, and engraftment of hematopoietic progenitor cells. Blood 2005, 105, 1467–1475. [Google Scholar] [CrossRef] [PubMed]
- Sahai, E.; Marshall, C.J. Rho-gtpases and cancer. Nat. Rev. Cancer 2002, 2, 133–142. [Google Scholar] [CrossRef] [PubMed]
- Lou, S.; Wang, P.; Yang, J.; Ma, J.; Liu, C.; Zhou, M. Prognostic and clinicopathological value of rac1 in cancer survival: Evidence from a meta-analysis. J. Cancer 2018, 9, 2571–2579. [Google Scholar] [CrossRef] [PubMed]
- Hall, A. Rho gtpases and the actin cytoskeleton. Science 1998, 279, 509–514. [Google Scholar] [CrossRef]
- Rathinam, R.; Berrier, A.; Alahari, S.K. Role of rho gtpases and their regulators in cancer progression. Front. Biosci. 2011, 16, 2561–2571. [Google Scholar] [CrossRef]
- Ridley, A.J. Rho gtpases and actin dynamics in membrane protrusions and vesicle trafficking. Trends Cell Biol. 2006, 16, 522–529. [Google Scholar] [CrossRef]
- Haga, R.B.; Ridley, A.J. Rho gtpases: Regulation and roles in cancer cell biology. Small GTPases 2016, 7, 207–221. [Google Scholar] [CrossRef]
- Bustelo, X.R. Rho gtpases in cancer: Known facts, open questions, and therapeutic challenges. Biochem. Soc. Trans. 2018, 46, 741–760. [Google Scholar] [CrossRef]
- Yadav, S.; Barton, M.J.; Nguyen, N.-T. Biophysical properties of cells for cancer diagnosis. J. Biomech. 2019, 86, 1–7. [Google Scholar] [CrossRef]
- Kazanietz, M.G.; Caloca, M.J. The rac gtpase in cancer: From old concepts to new paradigms. Cancer Res. 2017, 77, 5445–5451. [Google Scholar] [CrossRef]
- Fukui, K.; Tamura, S.; Wada, A.; Kamada, Y.; Sawai, Y.; Imanaka, K.; Kudara, T.; Shimomura, I.; Hayashi, N. Expression and prognostic role of rhoa gtpases in hepatocellular carcinoma. J. Cancer Res. Clin. Oncol. 2006, 132, 627–633. [Google Scholar] [CrossRef]
- Wong, C.C.; Wong, C.M.; Au, S.L.; Ng, I.O. Rhogtpases and rho-effectors in hepatocellular carcinoma metastasis: Rock n’rho move it. Liver Int. 2010, 30, 642–656. [Google Scholar] [CrossRef] [PubMed]
- Pattabiraman, P.P.; Rao, P.V. Mechanistic basis of rho gtpase-induced extracellular matrix synthesis in trabecular meshwork cells. Am. J. Physiol. Cell Physiol. 2010, 298, C749–C763. [Google Scholar] [CrossRef]
- Taghibakhshi, A.; Barisam, M.; Saidi, M.S.; Kashaninejad, N.; Nguyen, N.-T. Three-Dimensional Modeling of Avascular Tumor Growth in Both Static and Dynamic Culture Platforms. Micromachines 2019, 10, 580. [Google Scholar] [CrossRef]
- Barisam, M.; Saidi, M.S.; Kashaninejad, N.; Nguyen, N.-T. Prediction of Necrotic Core and Hypoxic Zone of Multicellular Spheroids in a Microbioreactor with a U-Shaped Barrier. Micromachines 2018, 9, 94. [Google Scholar] [CrossRef] [PubMed]
- Barisam, M.; Saidi, M.S.; Kashaninejad, N.; Vadivelu, R.; Nguyen, N.-T. Numerical Simulation of the Behavior of Toroidal and Spheroidal Multicellular Aggregates in Microfluidic Devices with Microwell and U-Shaped Barrier. Micromachines 2017, 8, 358. [Google Scholar] [CrossRef] [PubMed]
- Yadav, S.; Barton, M.; Nguyen, N.-T. Stretching induces overexpression of rhoa and rac1 gtpases in breast cancer cells. Adv. Biosyst. 2020, 4, 1900222. [Google Scholar] [CrossRef]
- Yadav, S.; Vadivelu, R.; Ahmed, M.; Barton, M.; Nguyen, N.-T. Stretching cells—An approach for early cancer diagnosis. Exp. Cell Res. 2019, 378, 191–197. [Google Scholar] [CrossRef]
- Kamble, H.; Vadivelu, R.; Barton, M.; Boriachek, K.; Ahmed, M.; Park, S.; Shiddiky, M.J.A.; Nguyen, N.-T. An electromagnetically actuated double-sided cell-stretching device for mechanobiology research. Micromachines 2017, 8, 256. [Google Scholar] [CrossRef]
- Ku, J.L.; Park, J.G. Biology of snu cell lines. Cancer Res. Treat. 2005, 37, 1–19. [Google Scholar] [CrossRef]
- Tse, J.M.; Cheng, G.; Tyrrell, J.A.; Wilcox-Adelmand, S.A.; Boucherb, Y.; Jainb, R.K.; Munn, L.L. Mechanical compression drives cancer cells toward invasive phenotype. Proc. Natl. Acad. Sci. USA 2012, 109, 911–916. [Google Scholar] [CrossRef] [PubMed]


© 2020 by the authors. Licensee MDPI, Basel, Switzerland. This article is an open access article distributed under the terms and conditions of the Creative Commons Attribution (CC BY) license (http://creativecommons.org/licenses/by/4.0/).
Share and Cite
Yadav, S.; Kashaninejad, N.; Nguyen, N.-T. RhoA and Rac1 in Liver Cancer Cells: Induction of Overexpression Using Mechanical Stimulation. Micromachines 2020, 11, 729. https://doi.org/10.3390/mi11080729
Yadav S, Kashaninejad N, Nguyen N-T. RhoA and Rac1 in Liver Cancer Cells: Induction of Overexpression Using Mechanical Stimulation. Micromachines. 2020; 11(8):729. https://doi.org/10.3390/mi11080729
Chicago/Turabian StyleYadav, Sharda, Navid Kashaninejad, and Nam-Trung Nguyen. 2020. "RhoA and Rac1 in Liver Cancer Cells: Induction of Overexpression Using Mechanical Stimulation" Micromachines 11, no. 8: 729. https://doi.org/10.3390/mi11080729
APA StyleYadav, S., Kashaninejad, N., & Nguyen, N.-T. (2020). RhoA and Rac1 in Liver Cancer Cells: Induction of Overexpression Using Mechanical Stimulation. Micromachines, 11(8), 729. https://doi.org/10.3390/mi11080729