Design, Fabrication, and Validation of a Petri Dish-Compatible PDMS Bioreactor for the Tensile Stimulation and Characterization of Microtissues


Abstract
1. Introduction
2. Methods
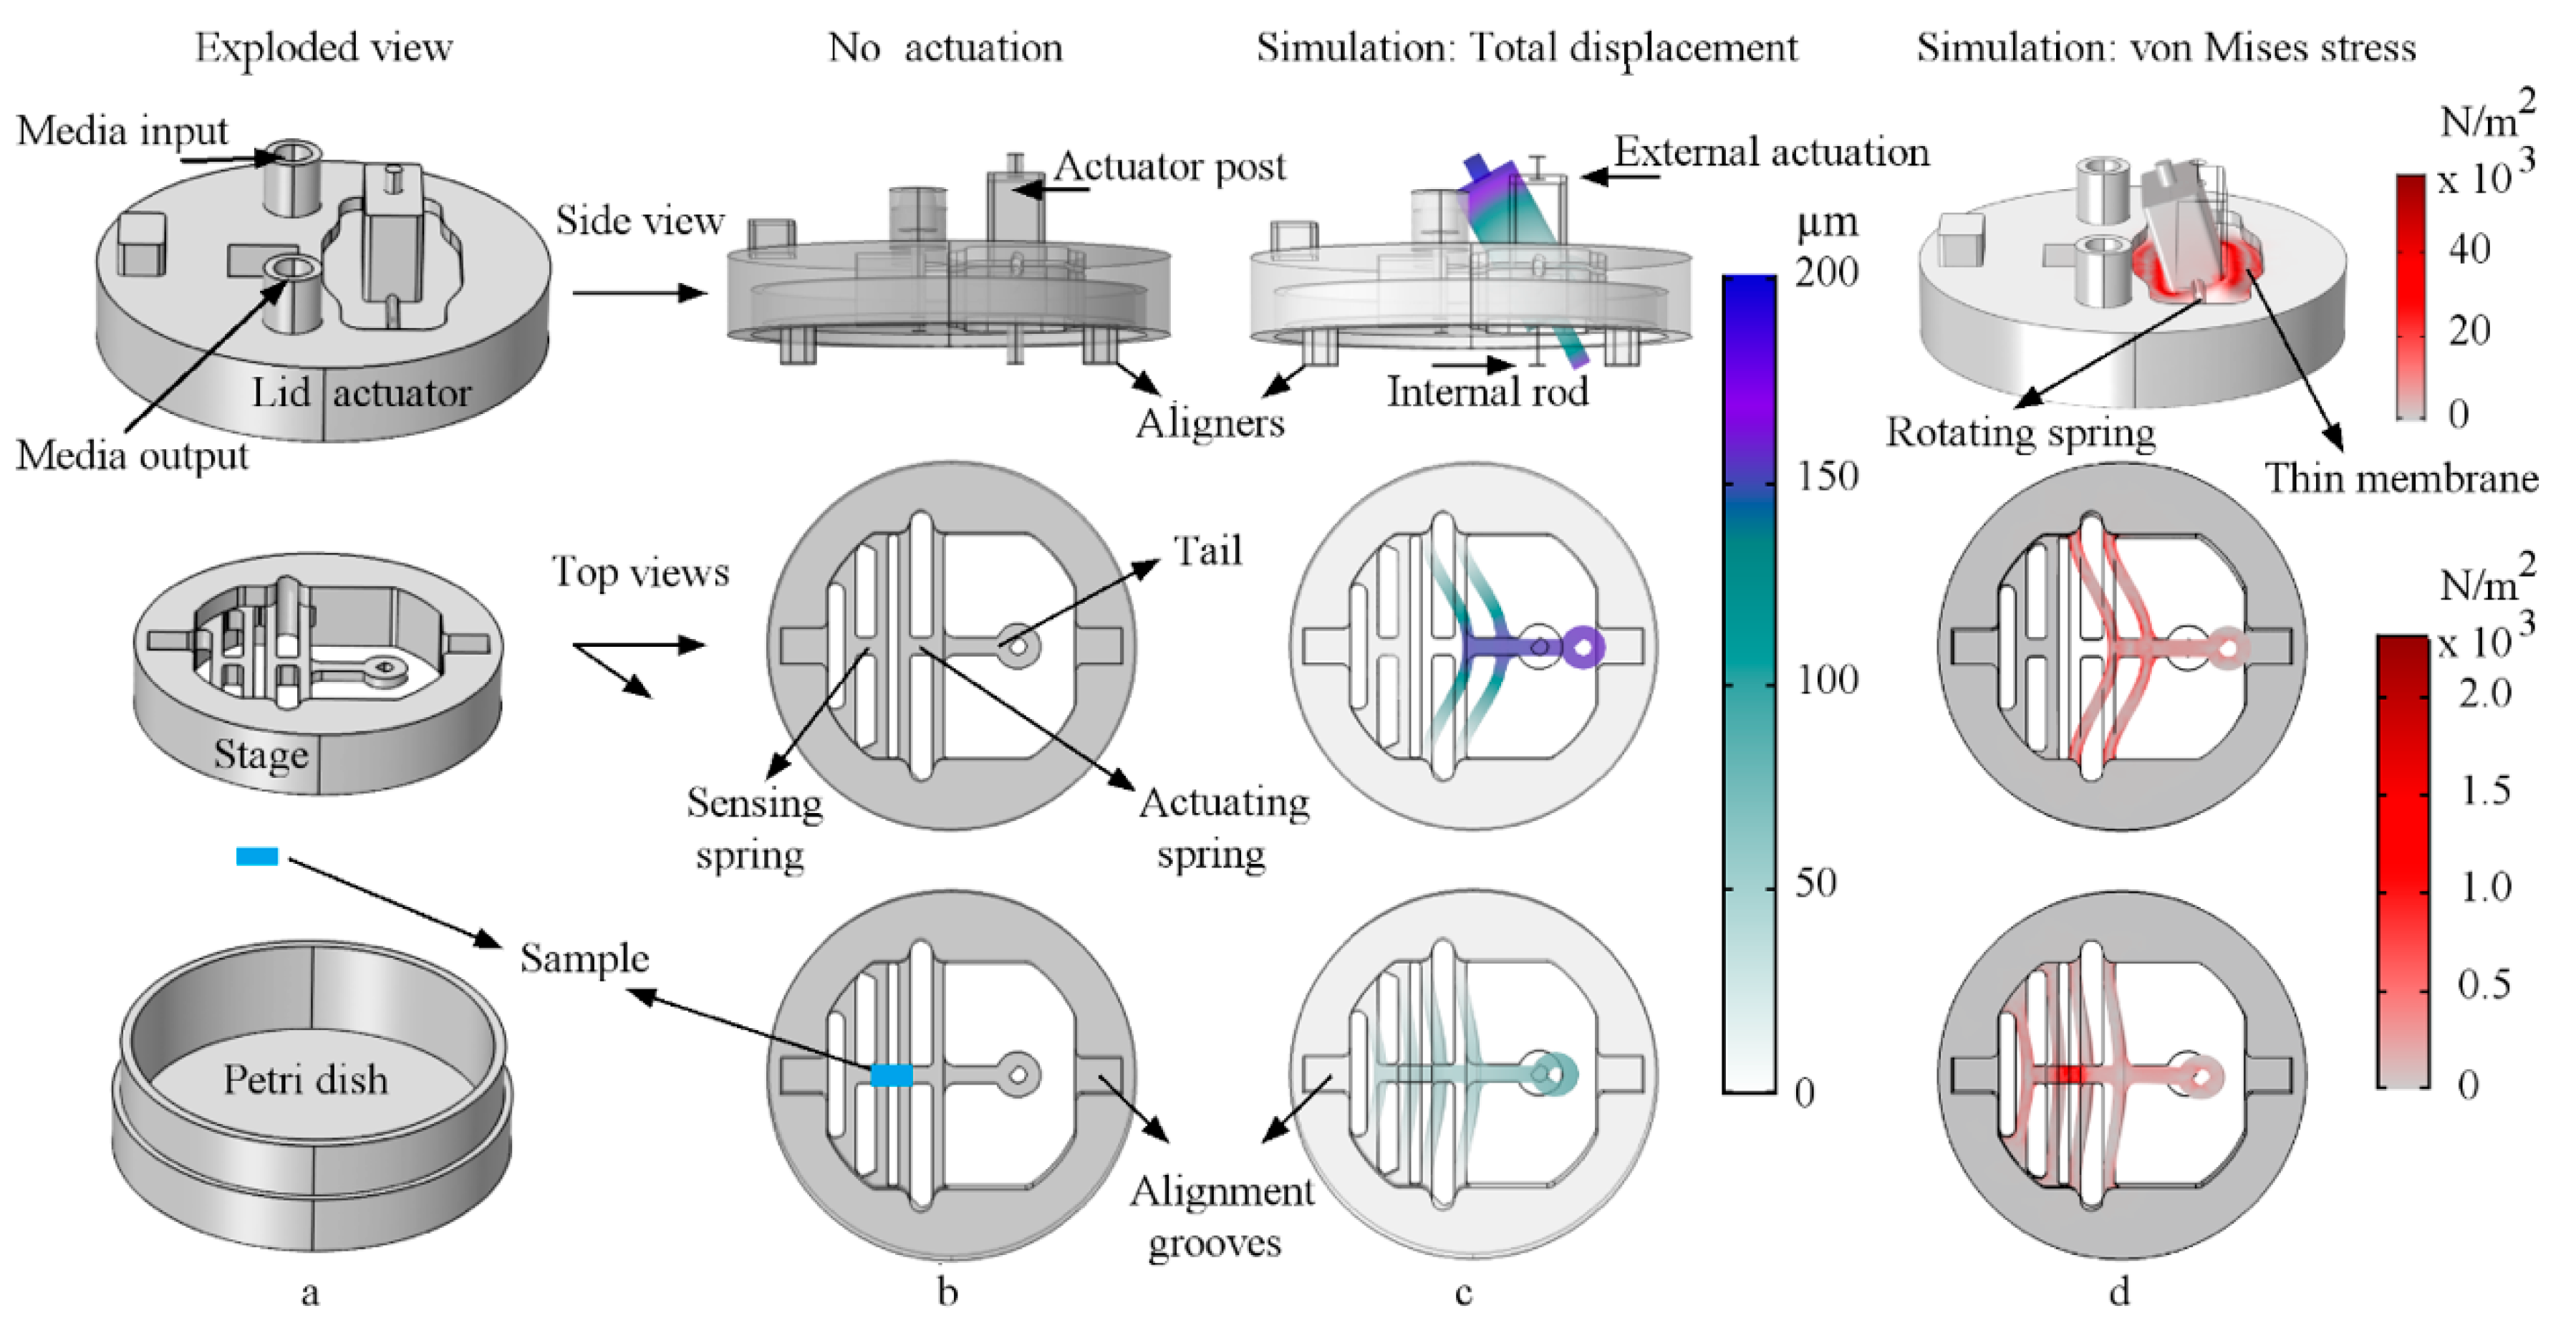
2.1. Design and Finite Element Method Analysis
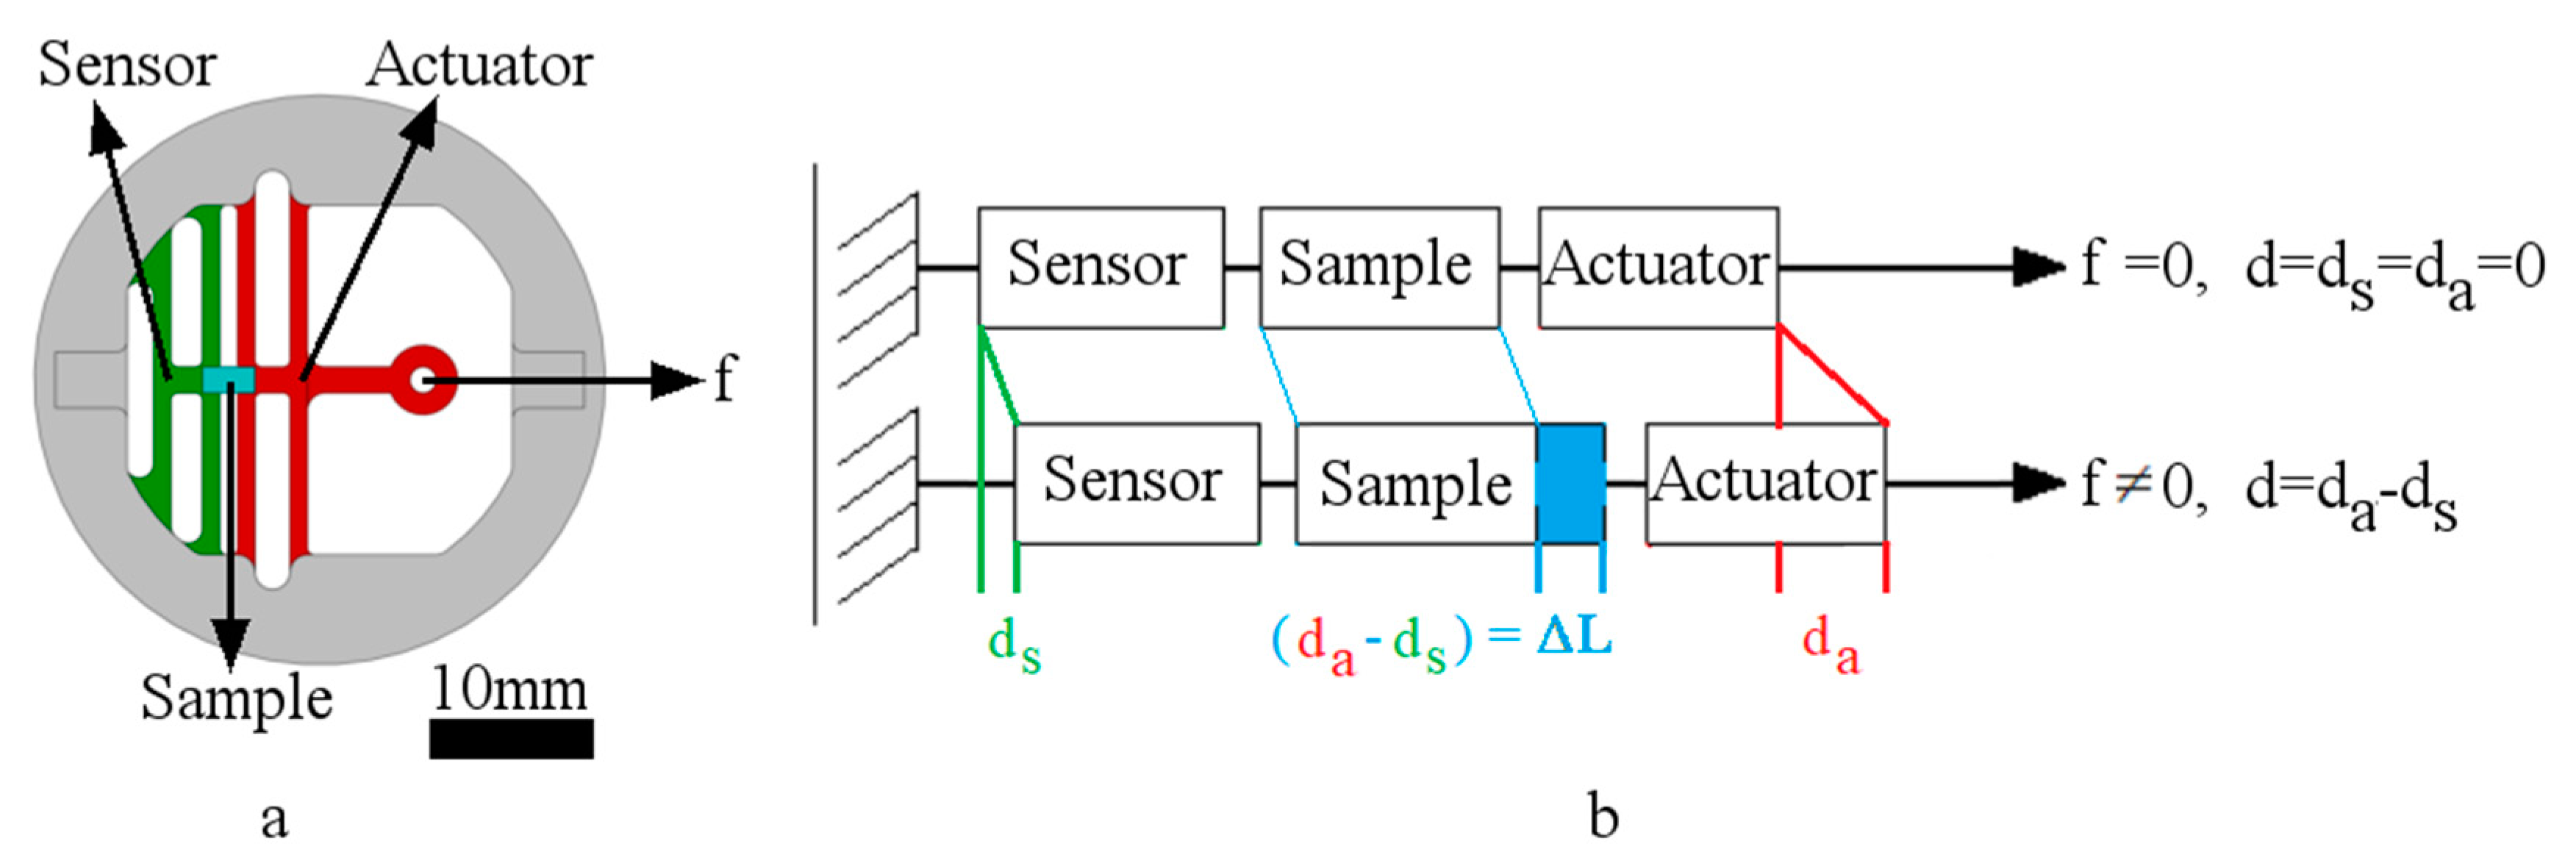
2.2. Theory of Operation
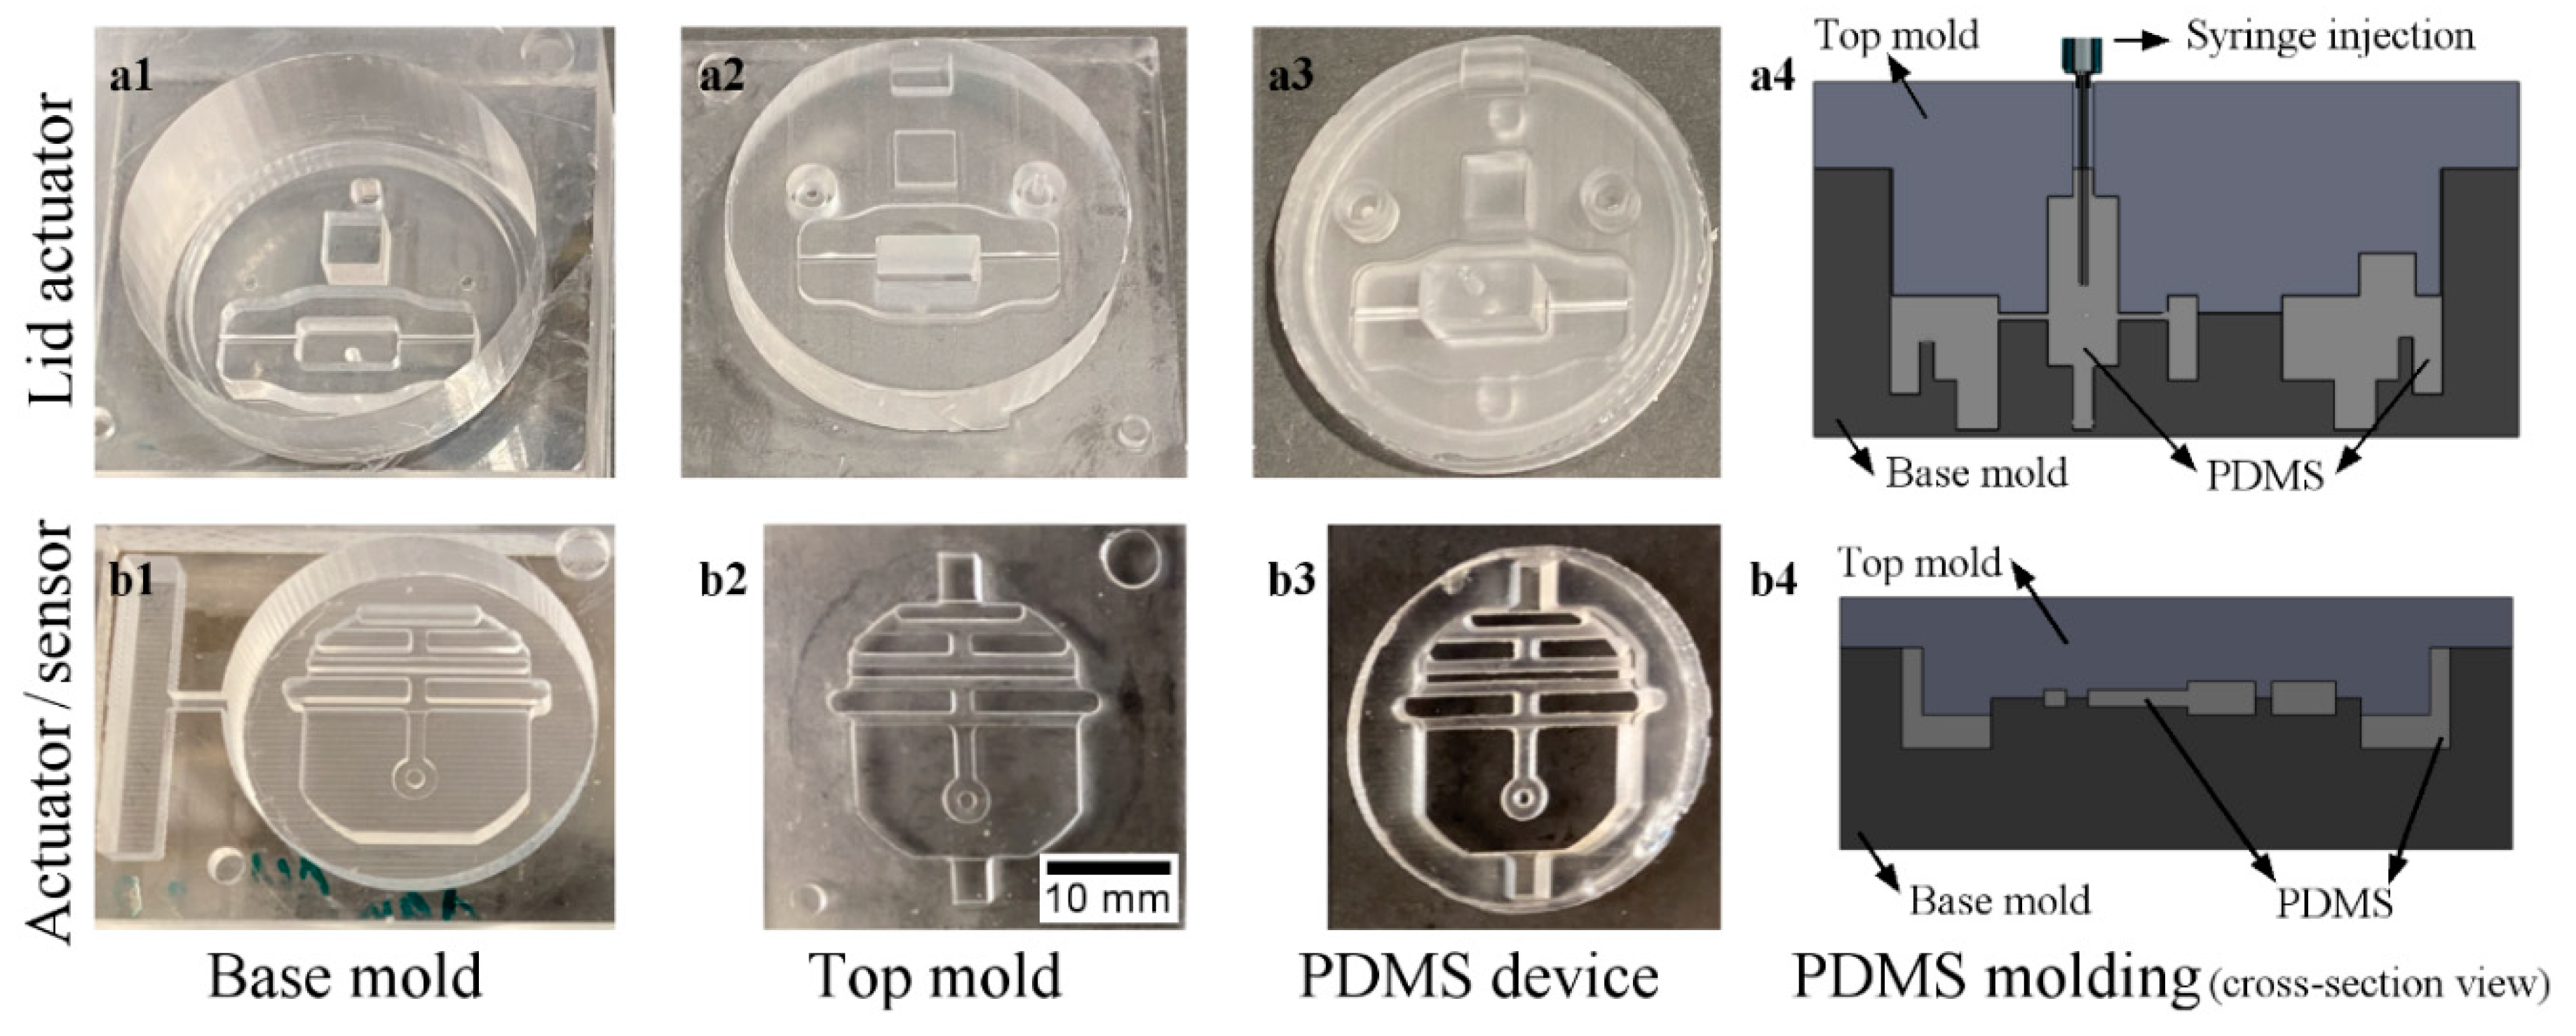
2.3. Fabrication and Materials
2.3.1. Fabrication of Devices
- Condition 1: Cured PDMS in an oven at 65 °C for 12 h, and then gently peeled it away from the mold and sterilized it using a dry autoclave cycle for 30 min at 121°C (Getinge, Wayne, NJ, USA).
- Condition 2: Cured PDMS in an oven at 65 °C for 2 h, and then gently peeled it away from the mold and disinfected it using isopropyl alcohol (IPA) 70% solution (CiDehol 70, Decon Laboratories, Inc., King of Prussia, PA, USA) for 20 min, followed by sterile distilled water rinses, and left it to dry inside a biosafety hood.
2.3.2. Fabrication of Samples
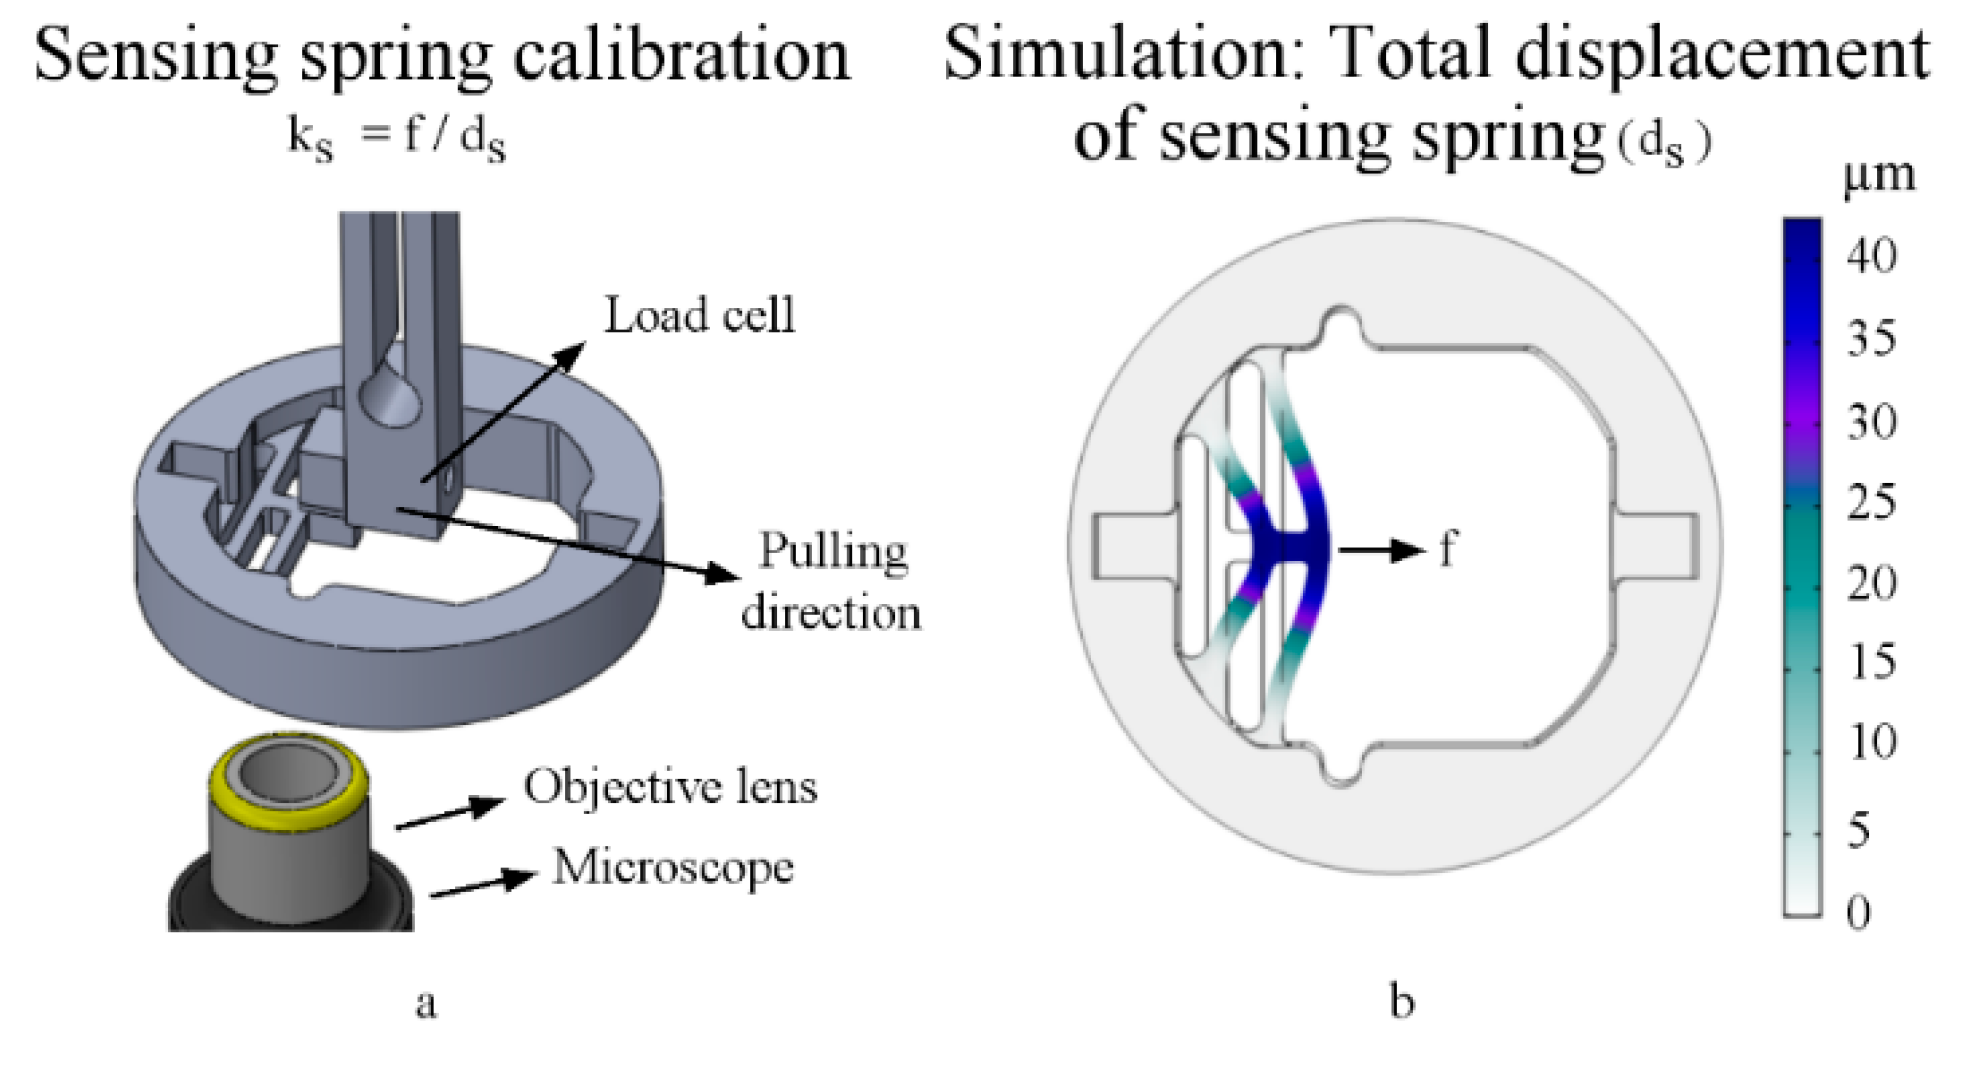
2.4. Sensor Spring Calibration
2.5. Operational Range (Computational Tuning Estimations)
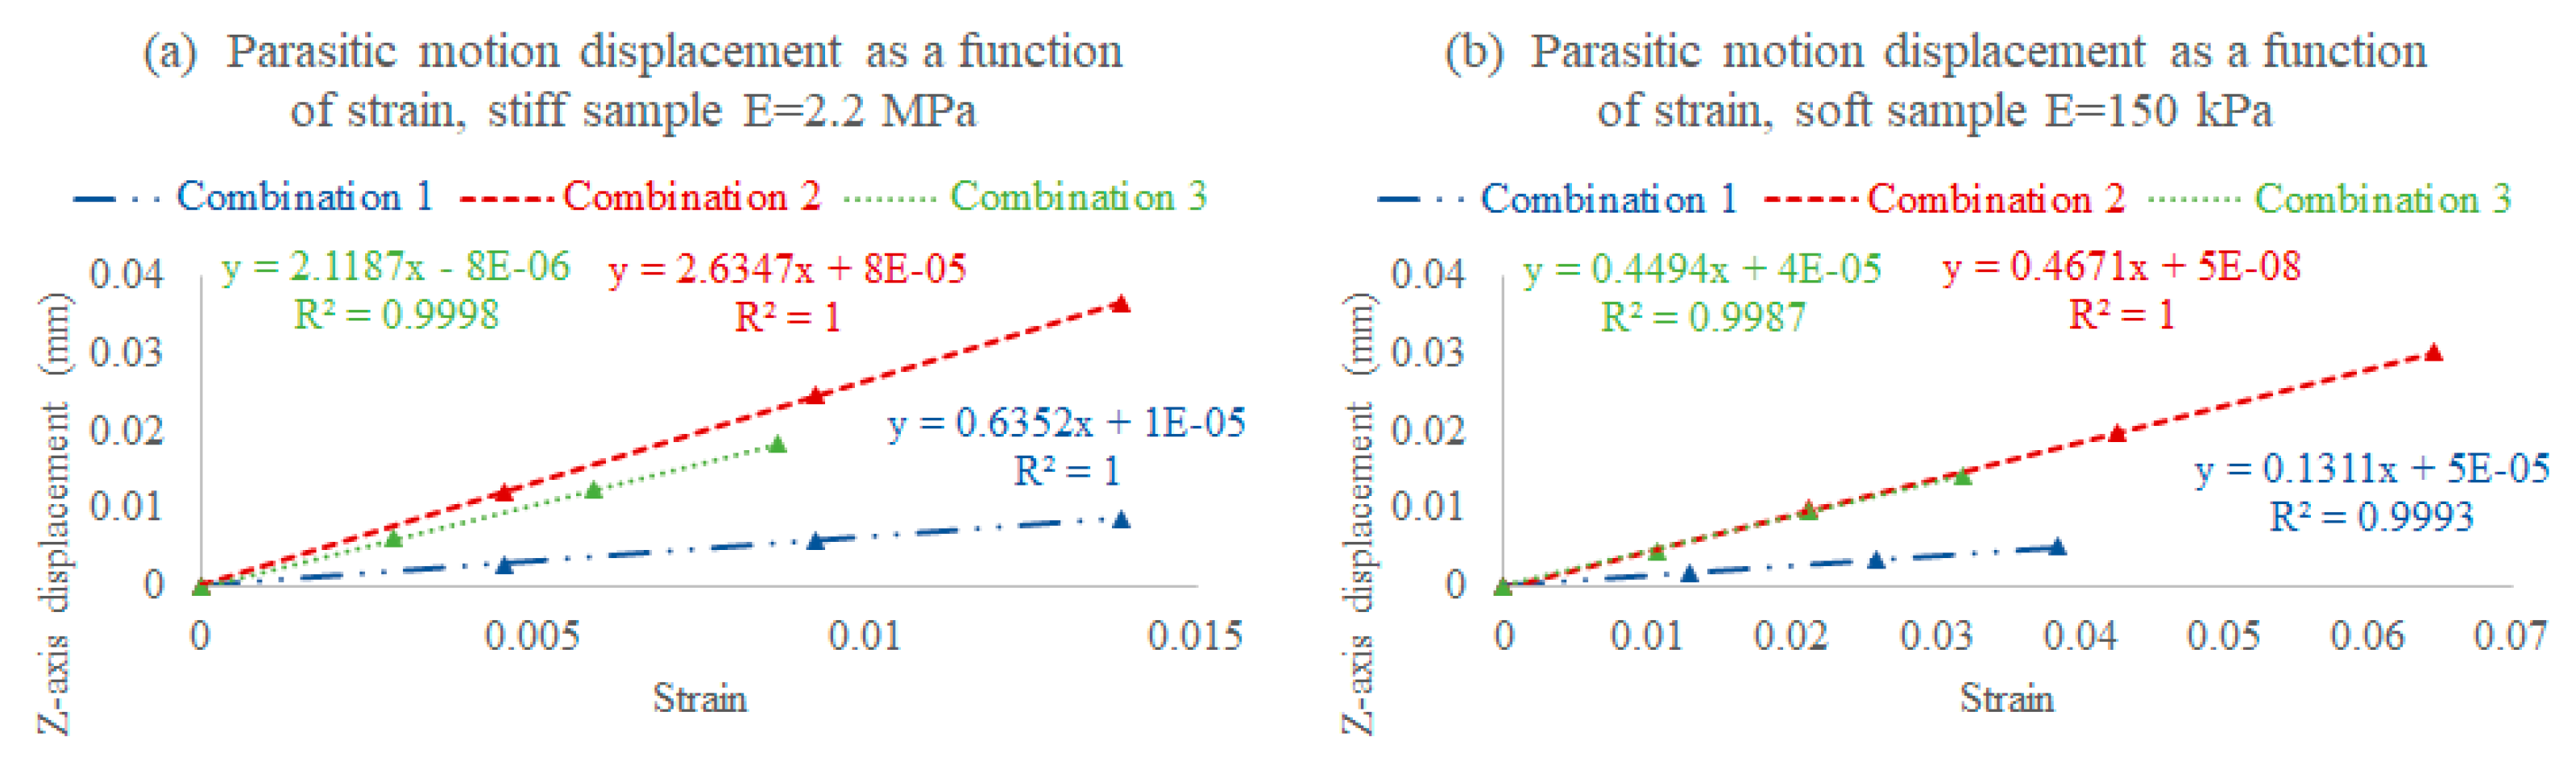
2.5.1. Assembly Combinations
- I.
- Combination 1: A stiff lid (3 MPa) and a stiff stage (3 MPa), where the rod is stiffer, and therefore bends within an acceptable range, increasing the deliverable strain with less parasitic motion, but consequently decreasing the sensor sensitivity (stiffer sensor);
- II.
- Combination 2: A soft lid (850 kPa) and a soft stage (850 kPa), where the lid rod bends too much, increasing the parasitic motion and limiting the deliverable strain while increasing the sensor sensitivity (softer sensor);
- III.
- Combination 3: A stiff lid (3 MPa) and a soft stage (850 kPa), where the rod bends within an acceptable range, slightly reducing the deliverable strain, but also lowering the parasitic motion while maintaining the targeted sensor sensitivity range.

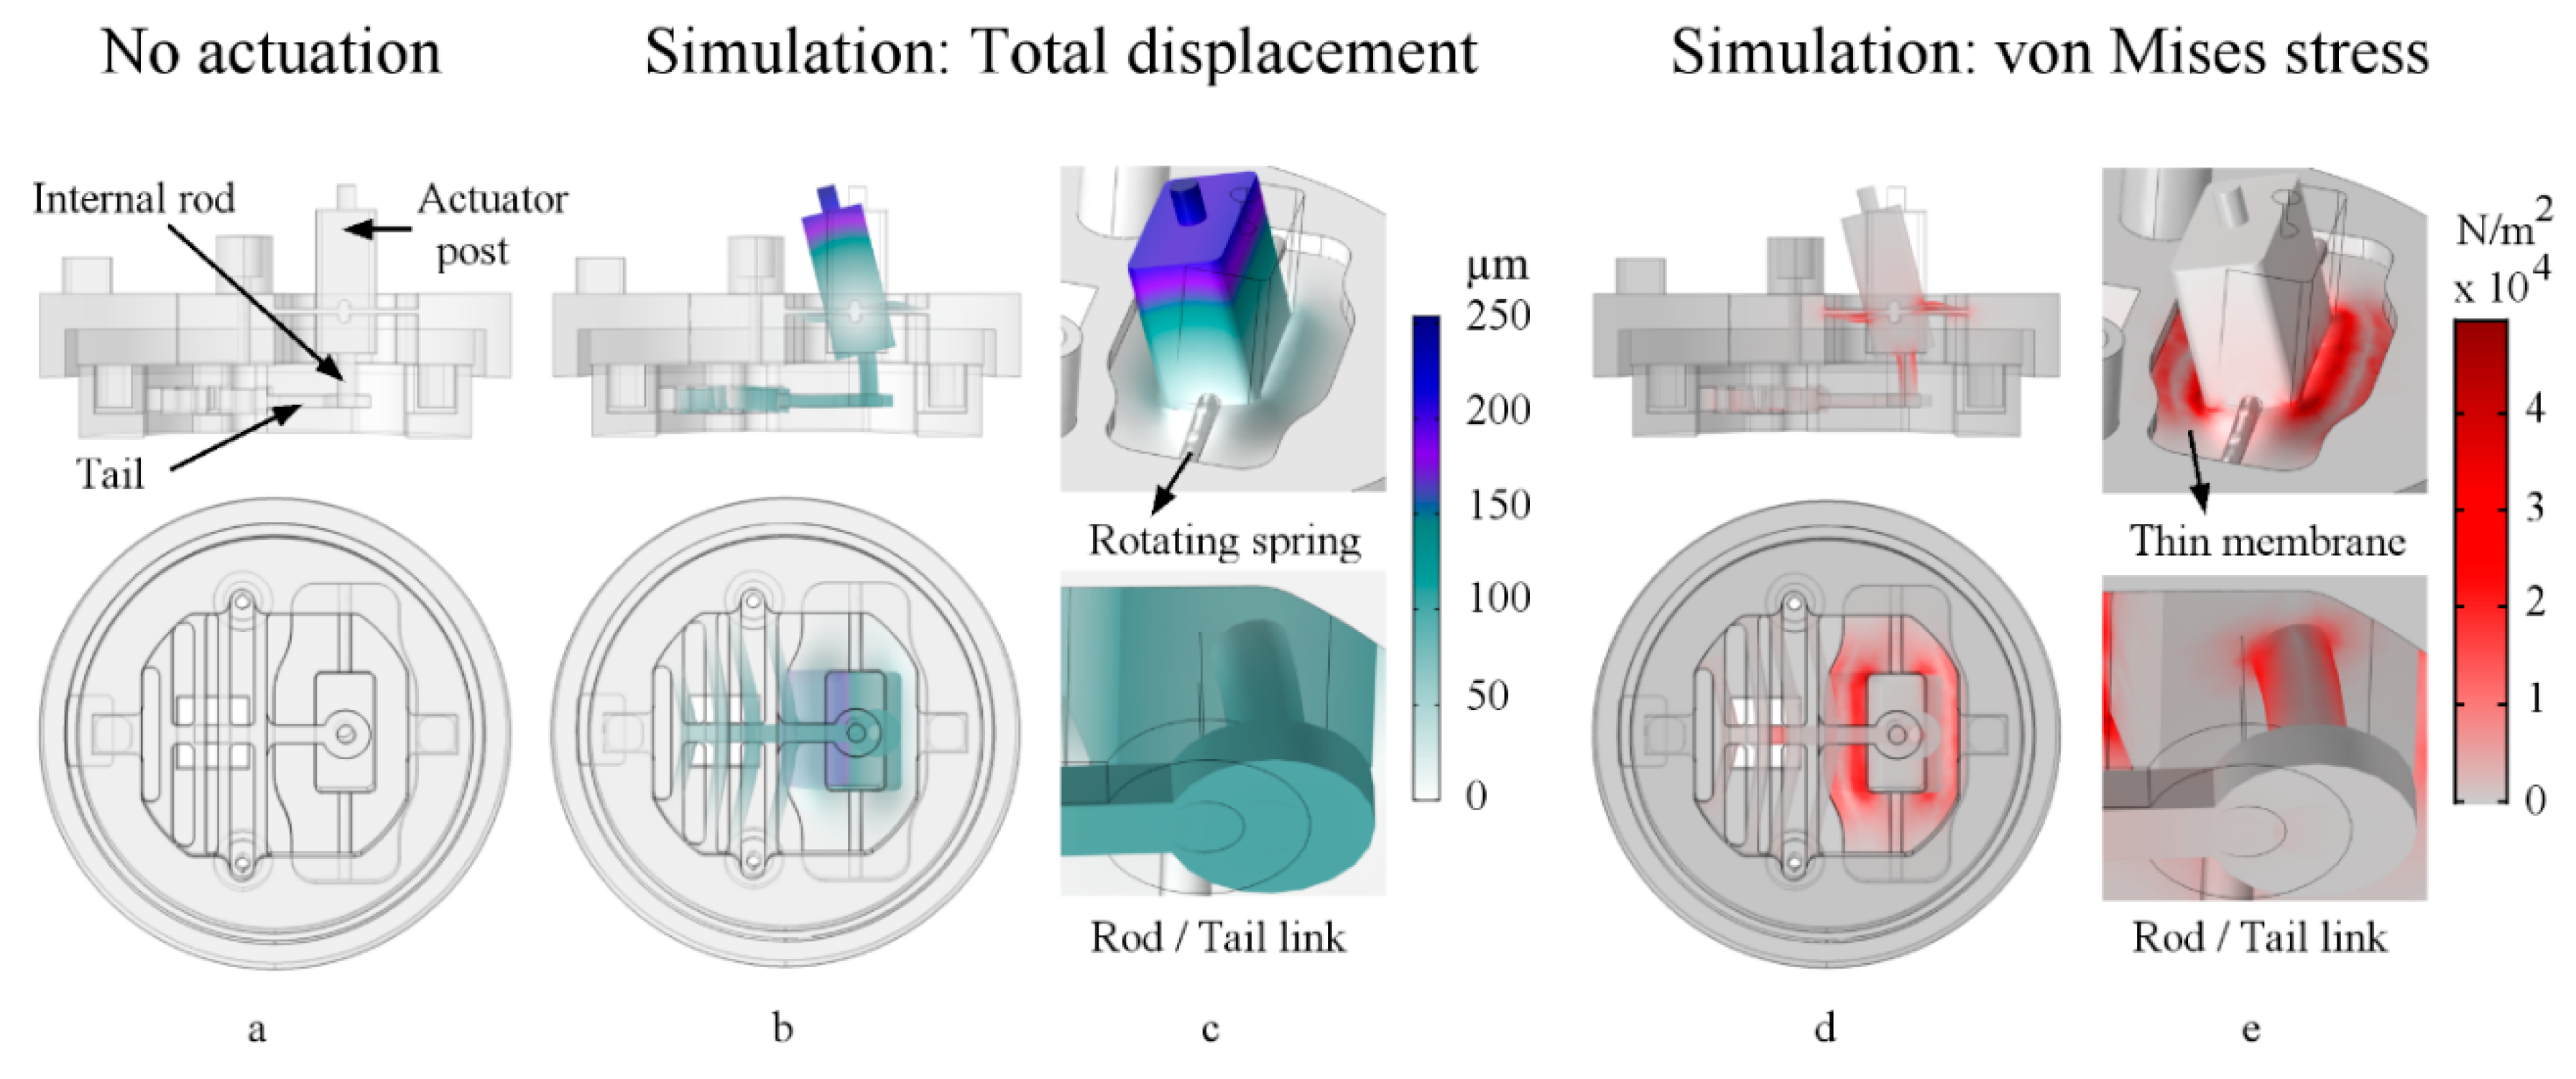
2.5.2. Rod/Tail Link Stiffness Optimization
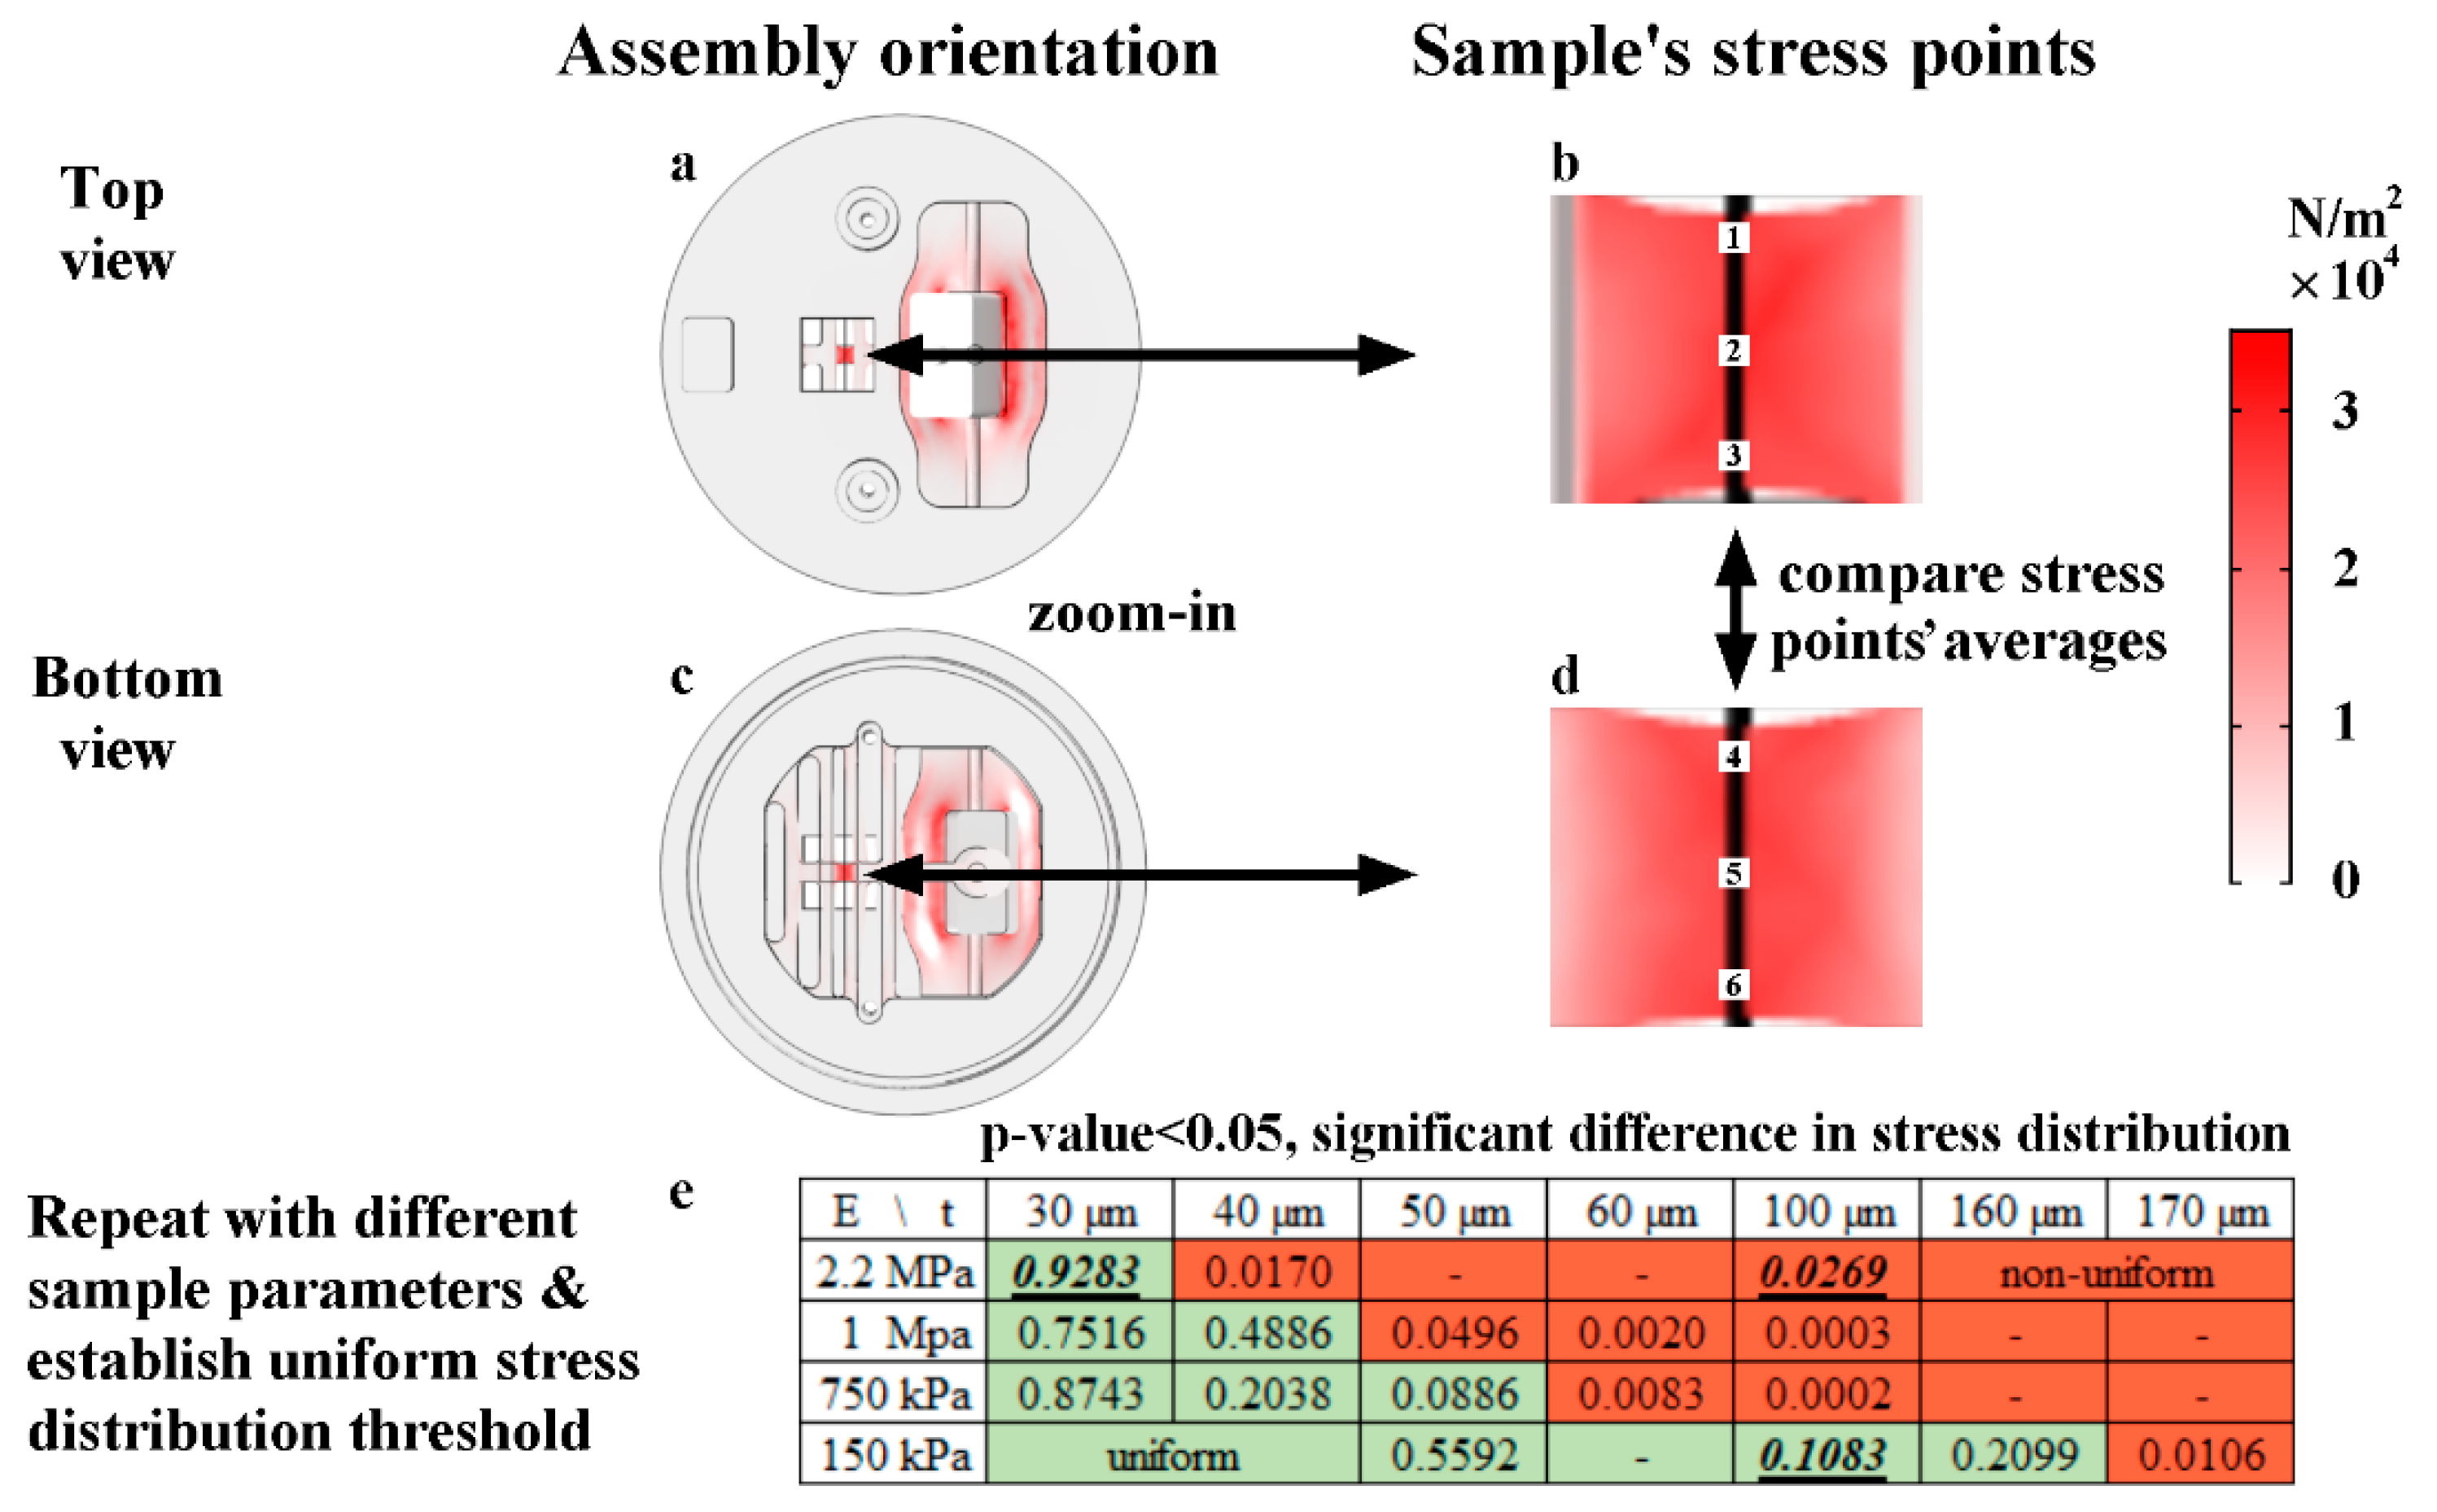
2.5.3. Sample Stress Distribution
2.6. Surface Treatment, Cleaning, and Sample Attachment Protocols
2.7. Cell Culture Protocol
2.8. Mechanical Characterization
2.9. Cell Stimulation and Viability Testing
2.9.1. Cell Stimulation and Orientation Evaluation
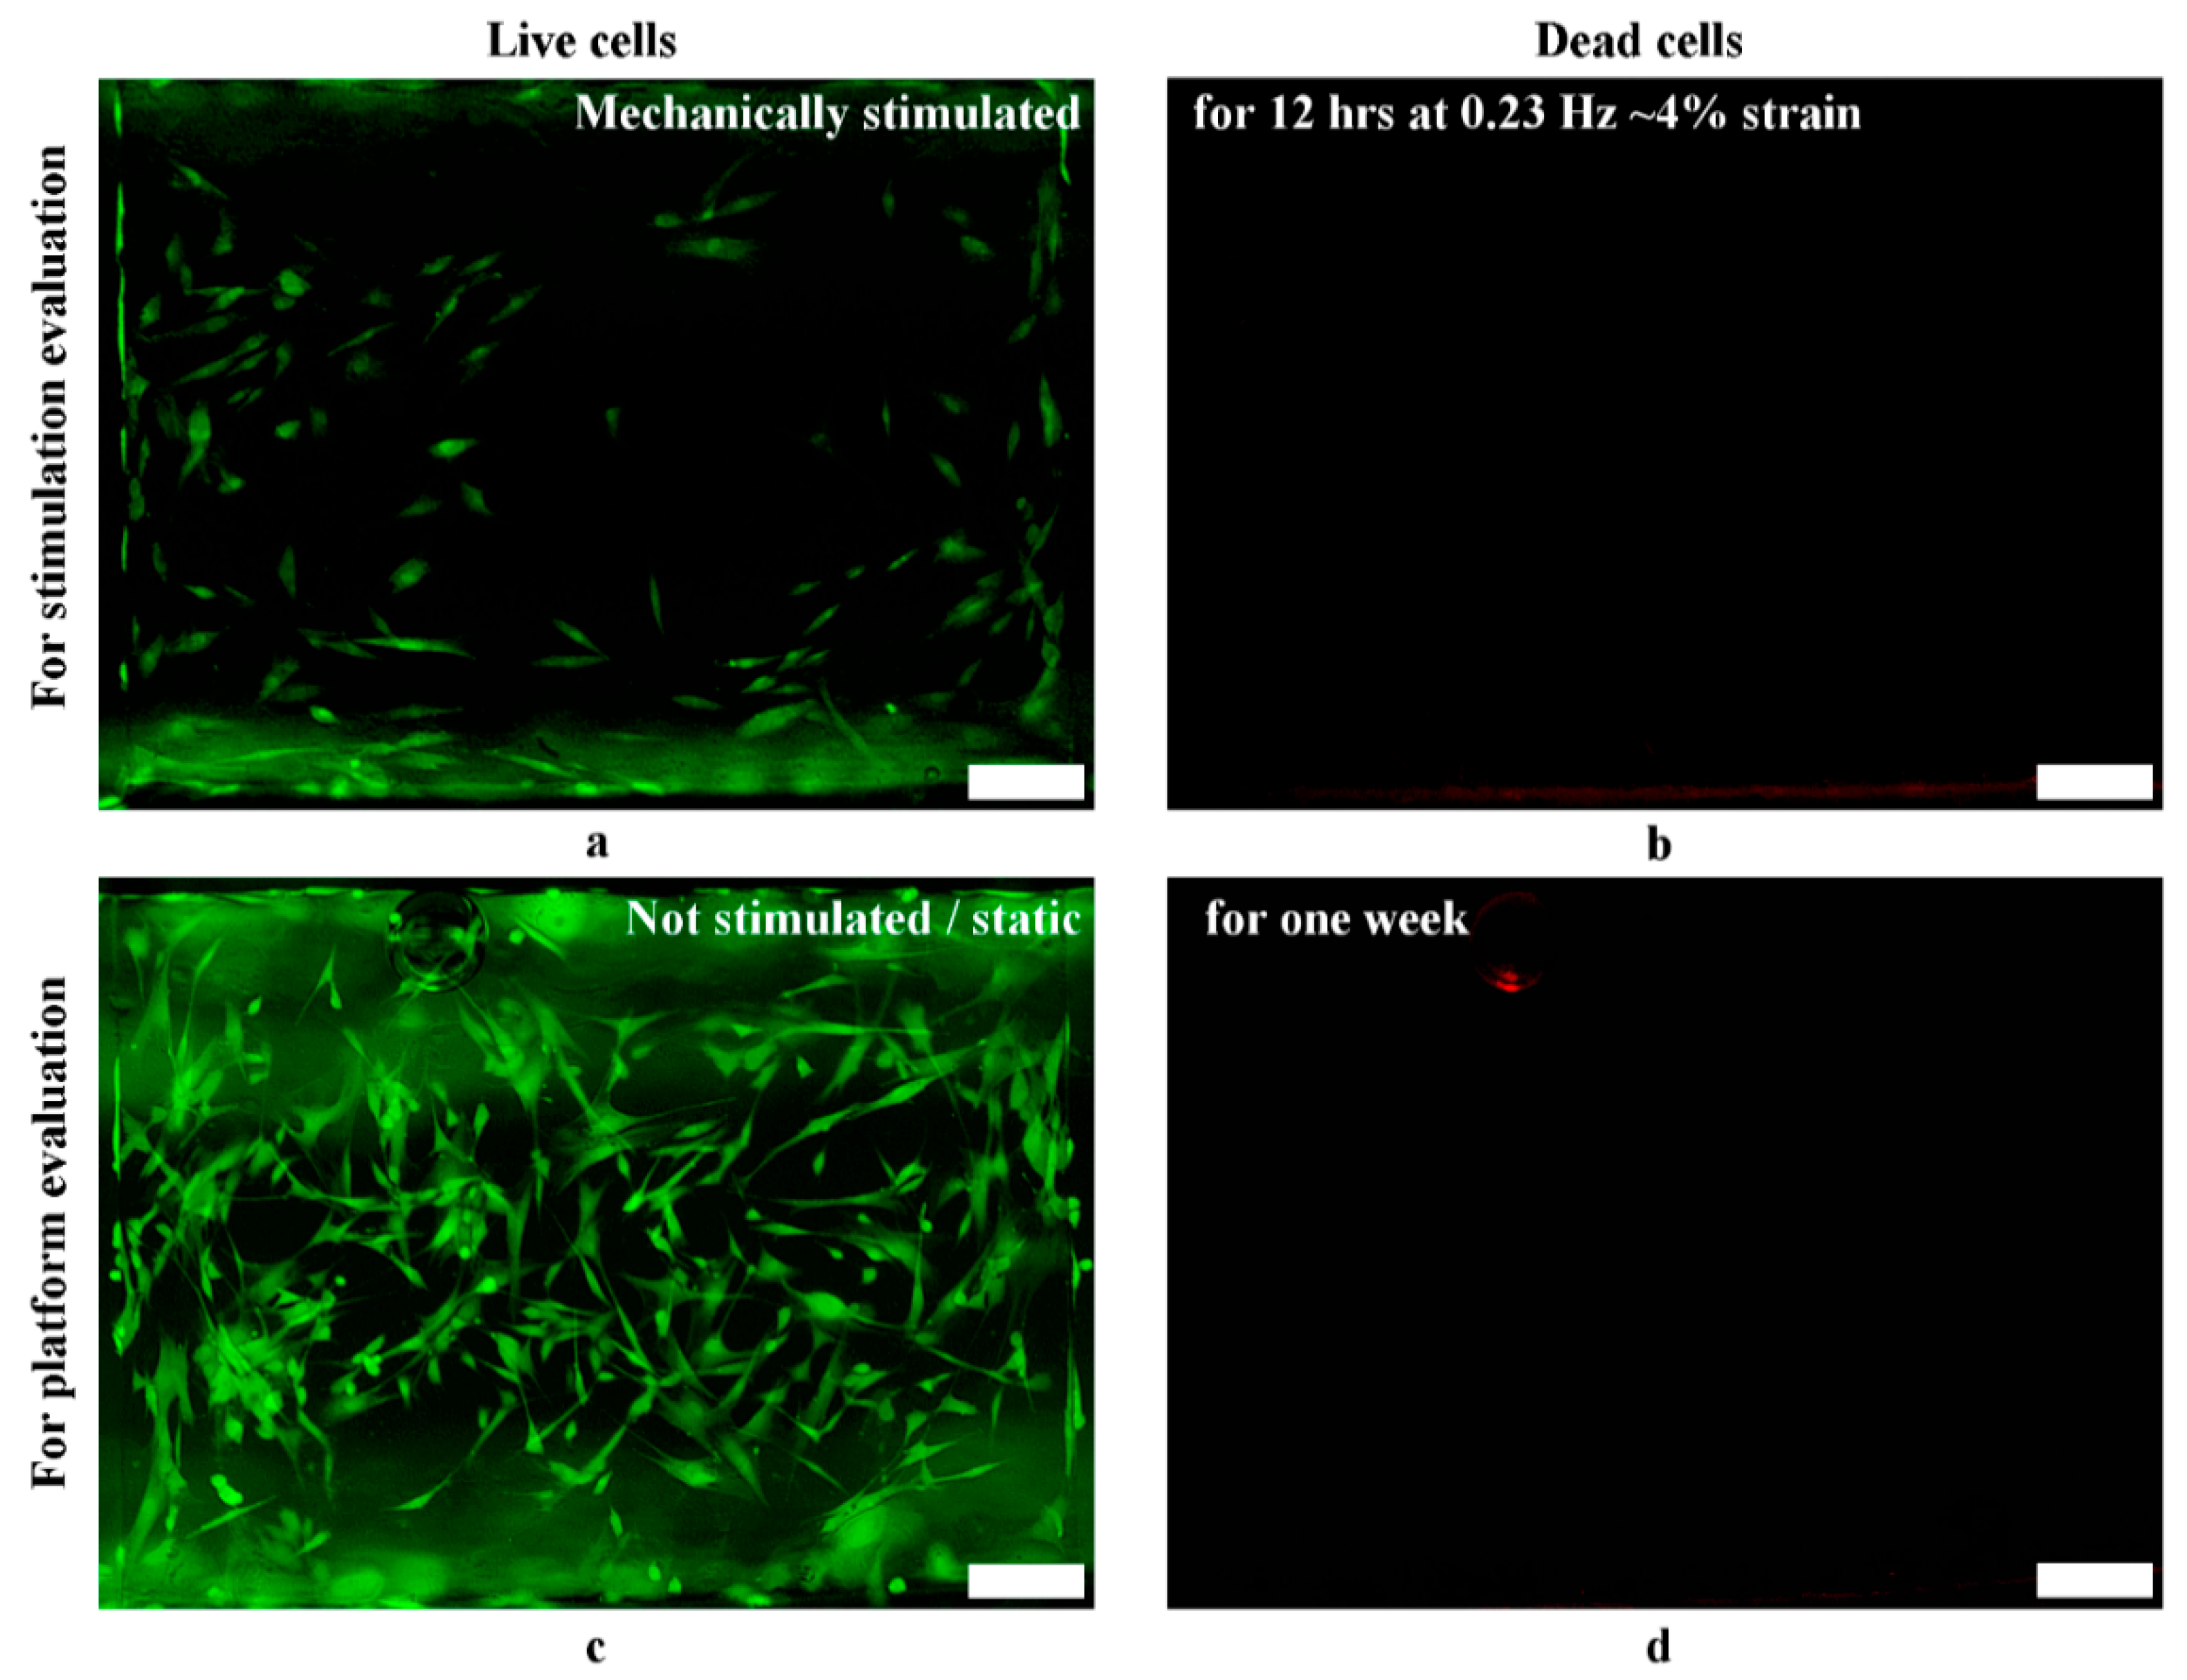
2.9.2. Cell Viability
2.10. Statistical Analysis
3. Results and Discussion
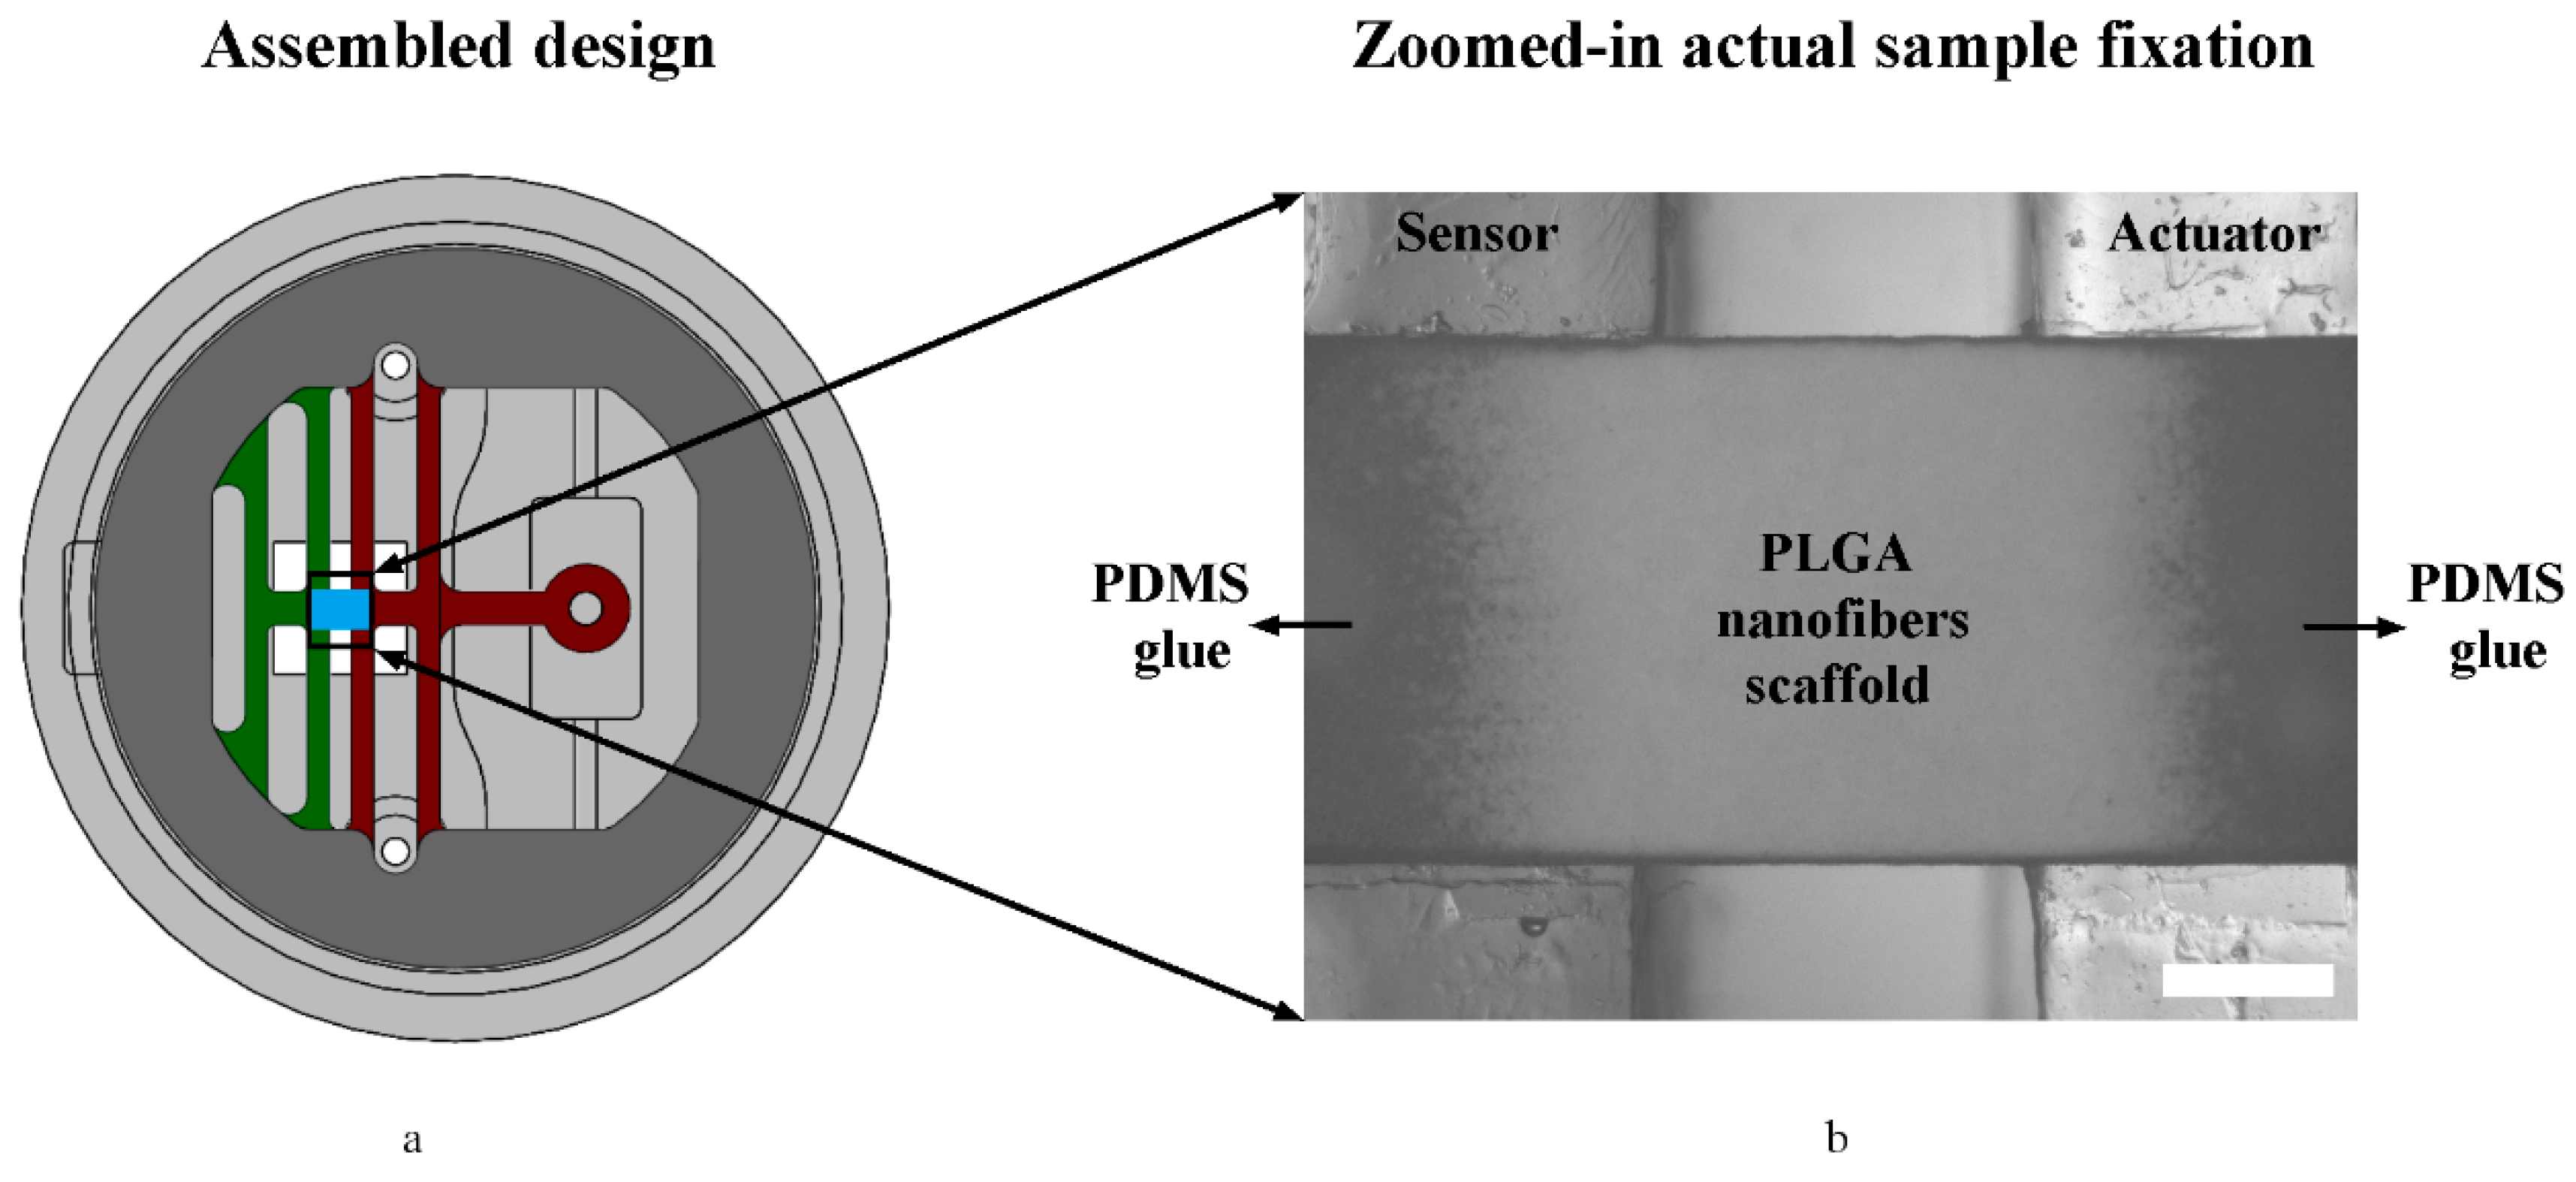
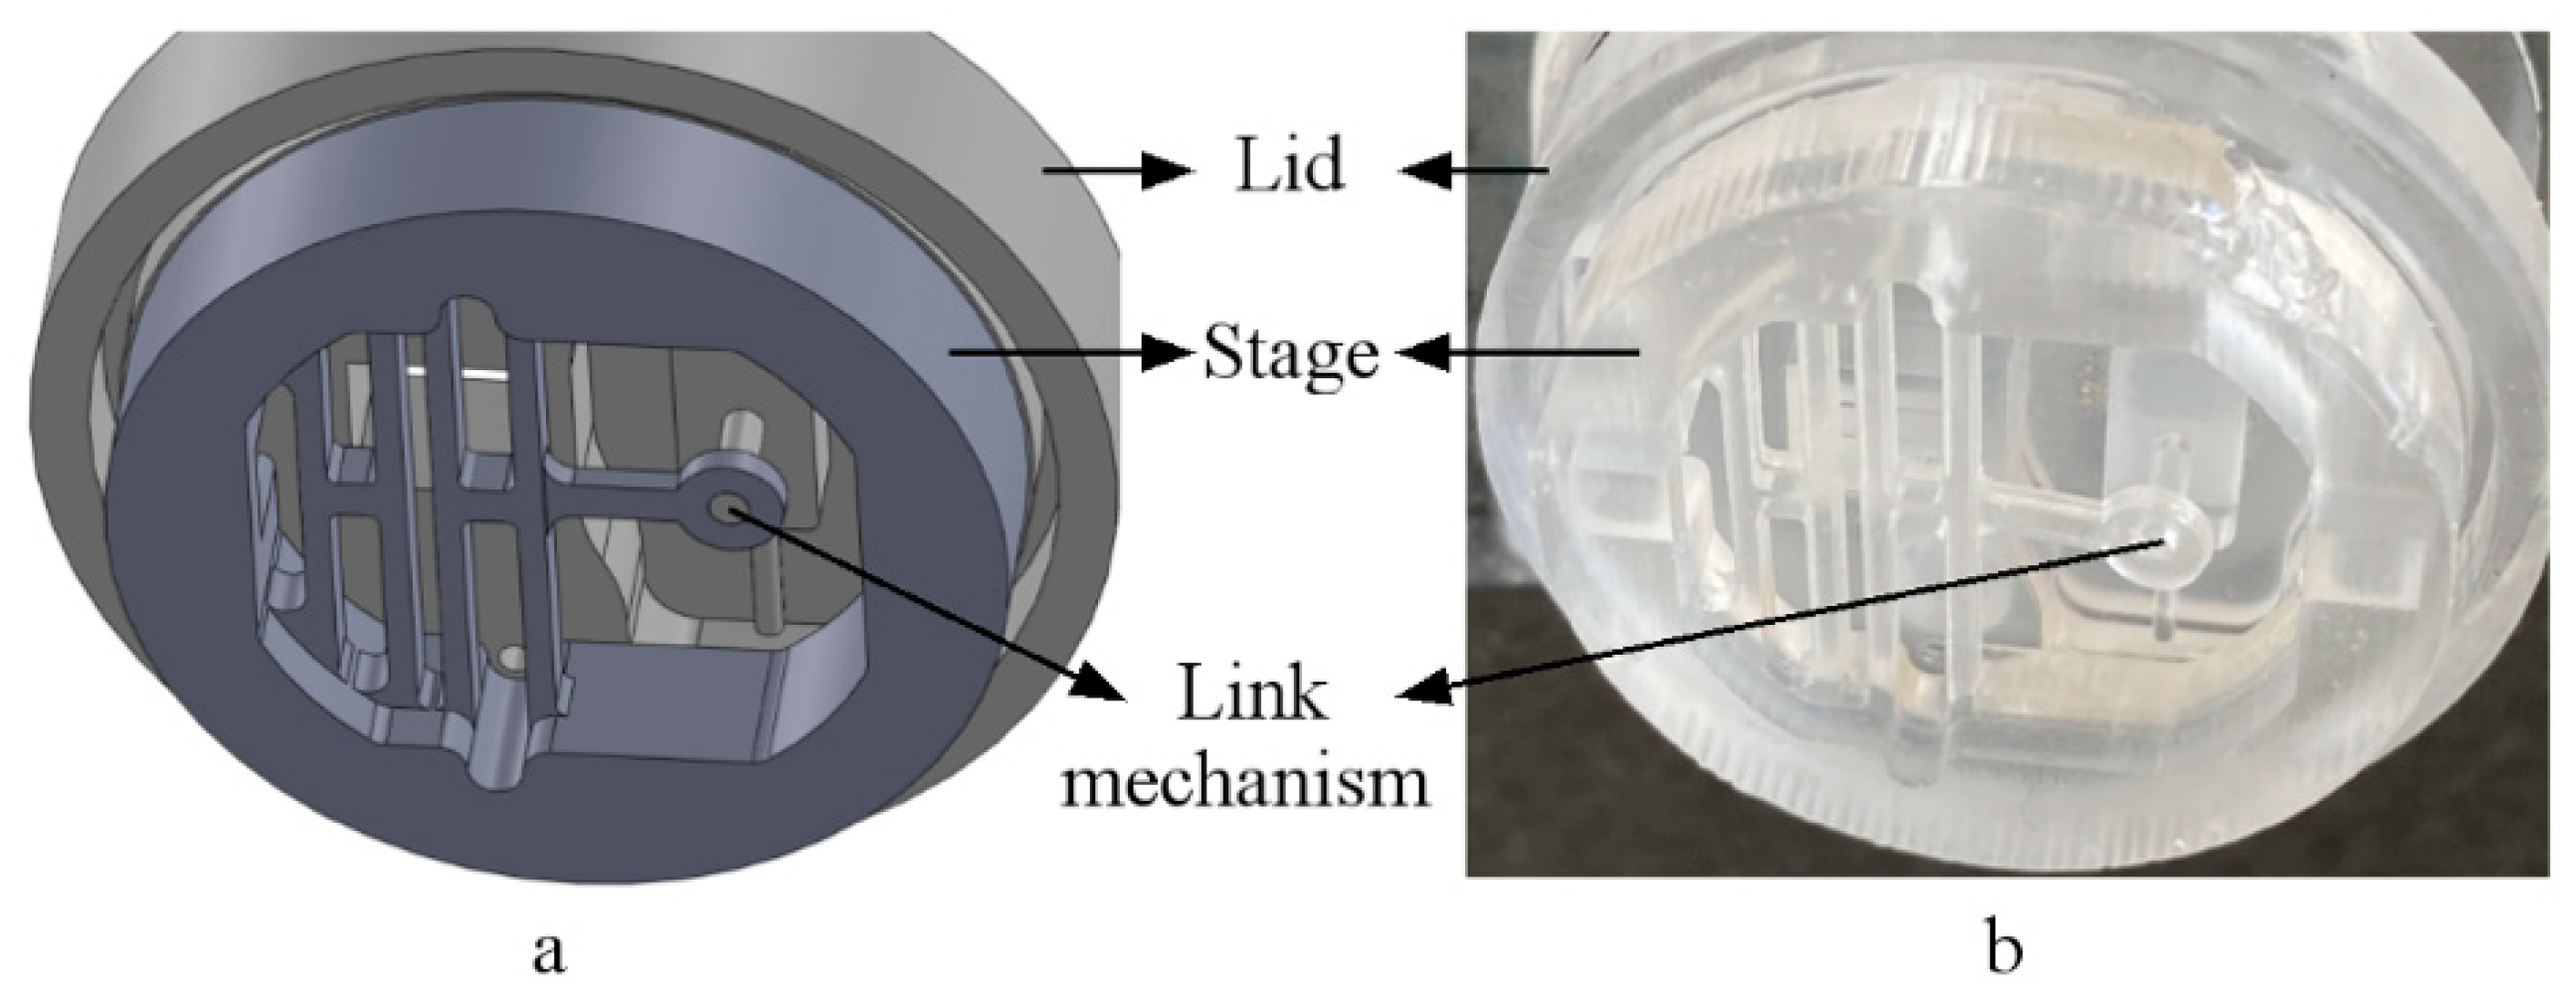
3.1. Assembled System (Design Vs. Actual)
3.2. Assembled System Performance
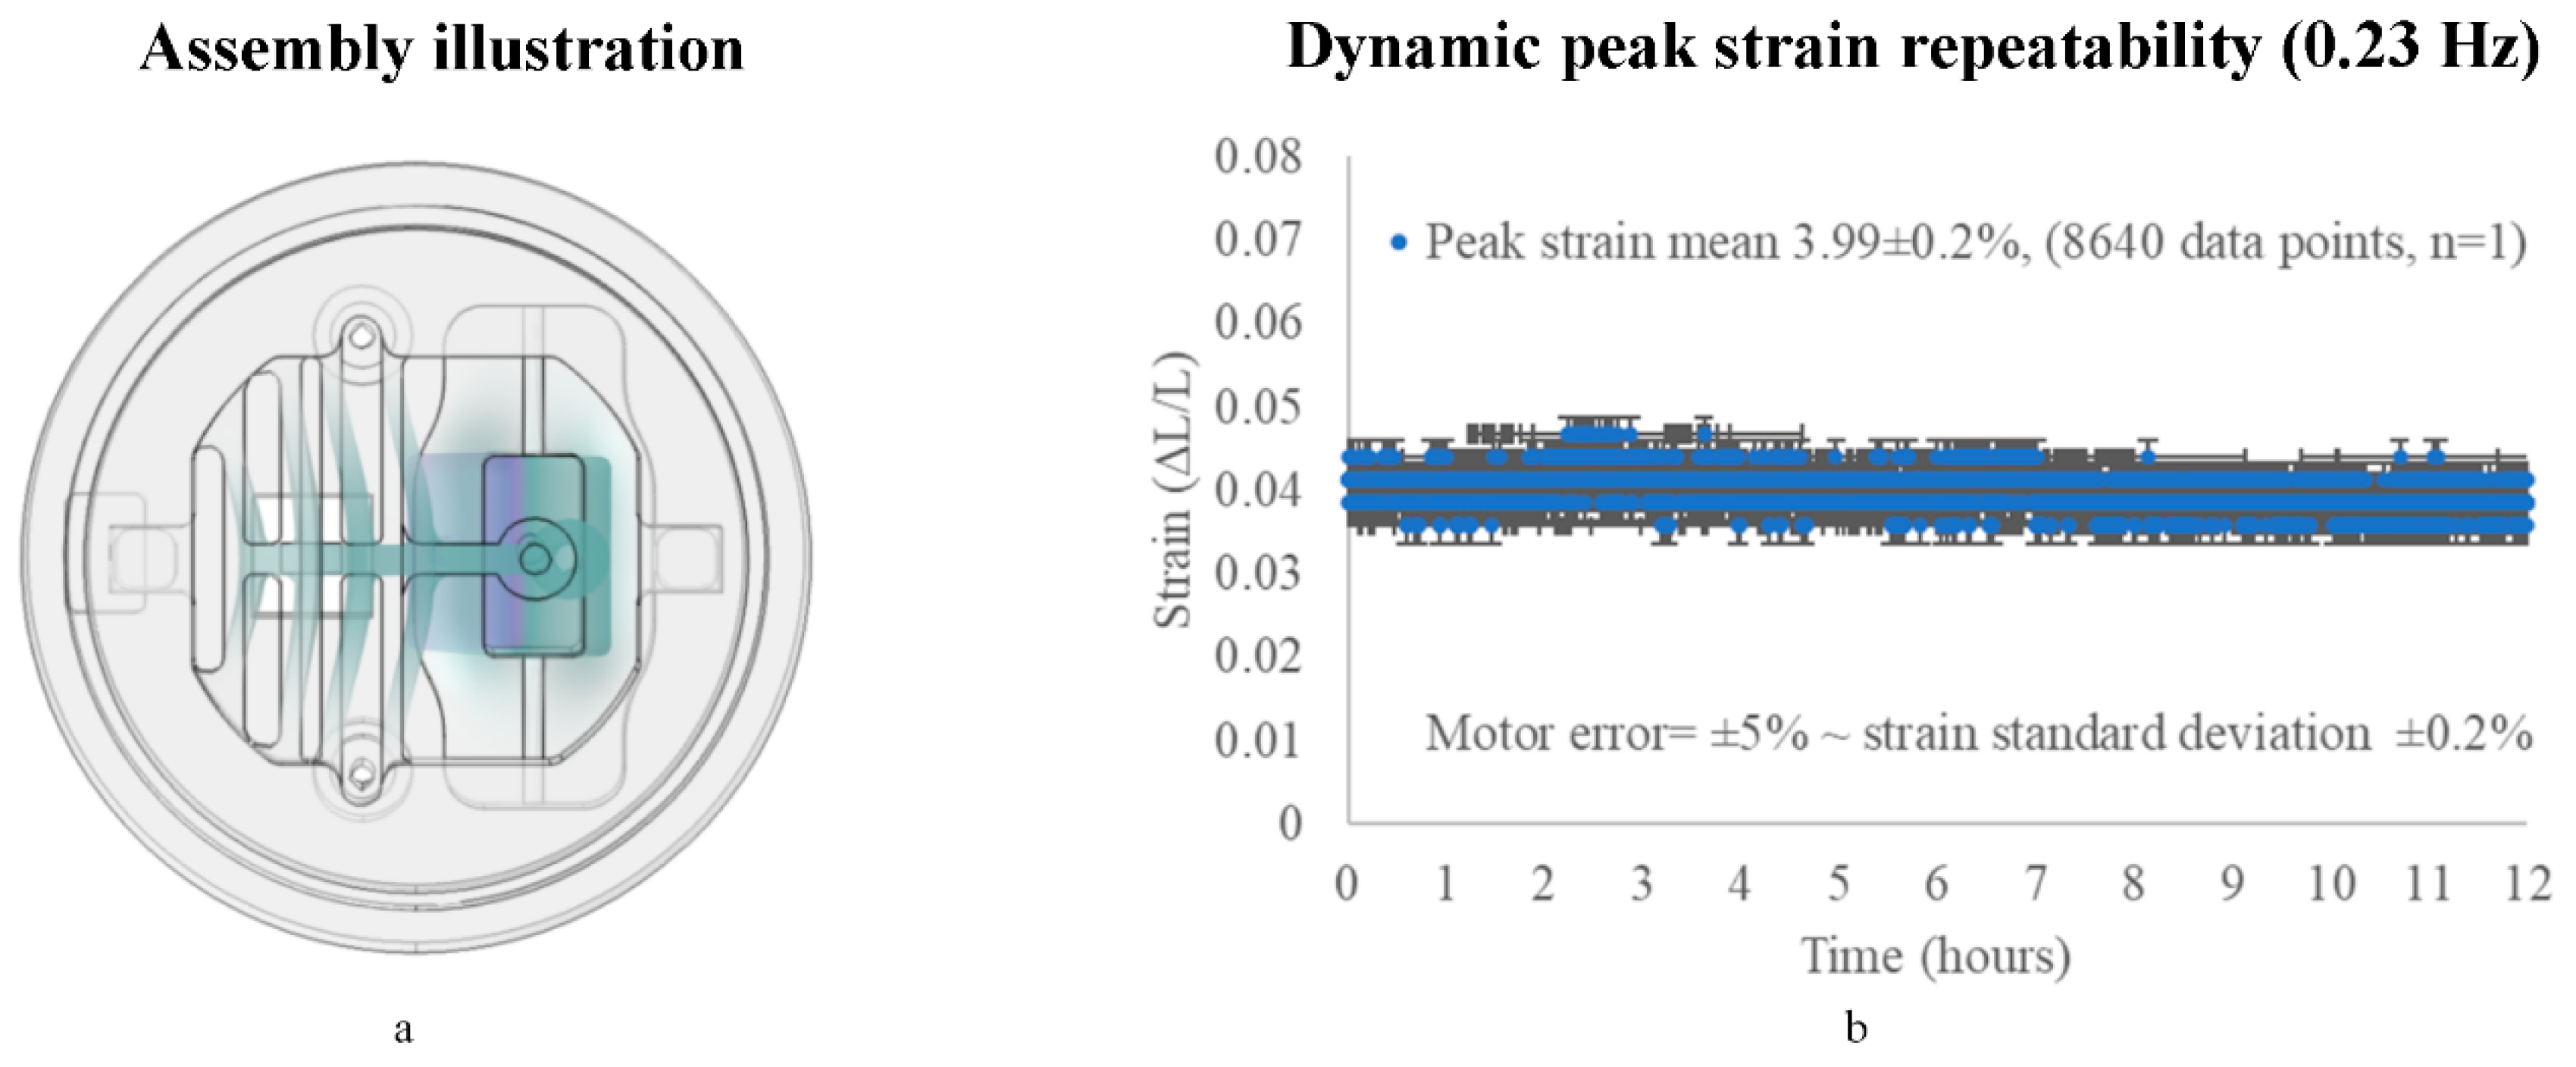
3.2.1. On the X-Axis (Repeatability)
3.2.2. On the Z-Axis (Parasitic Motion)
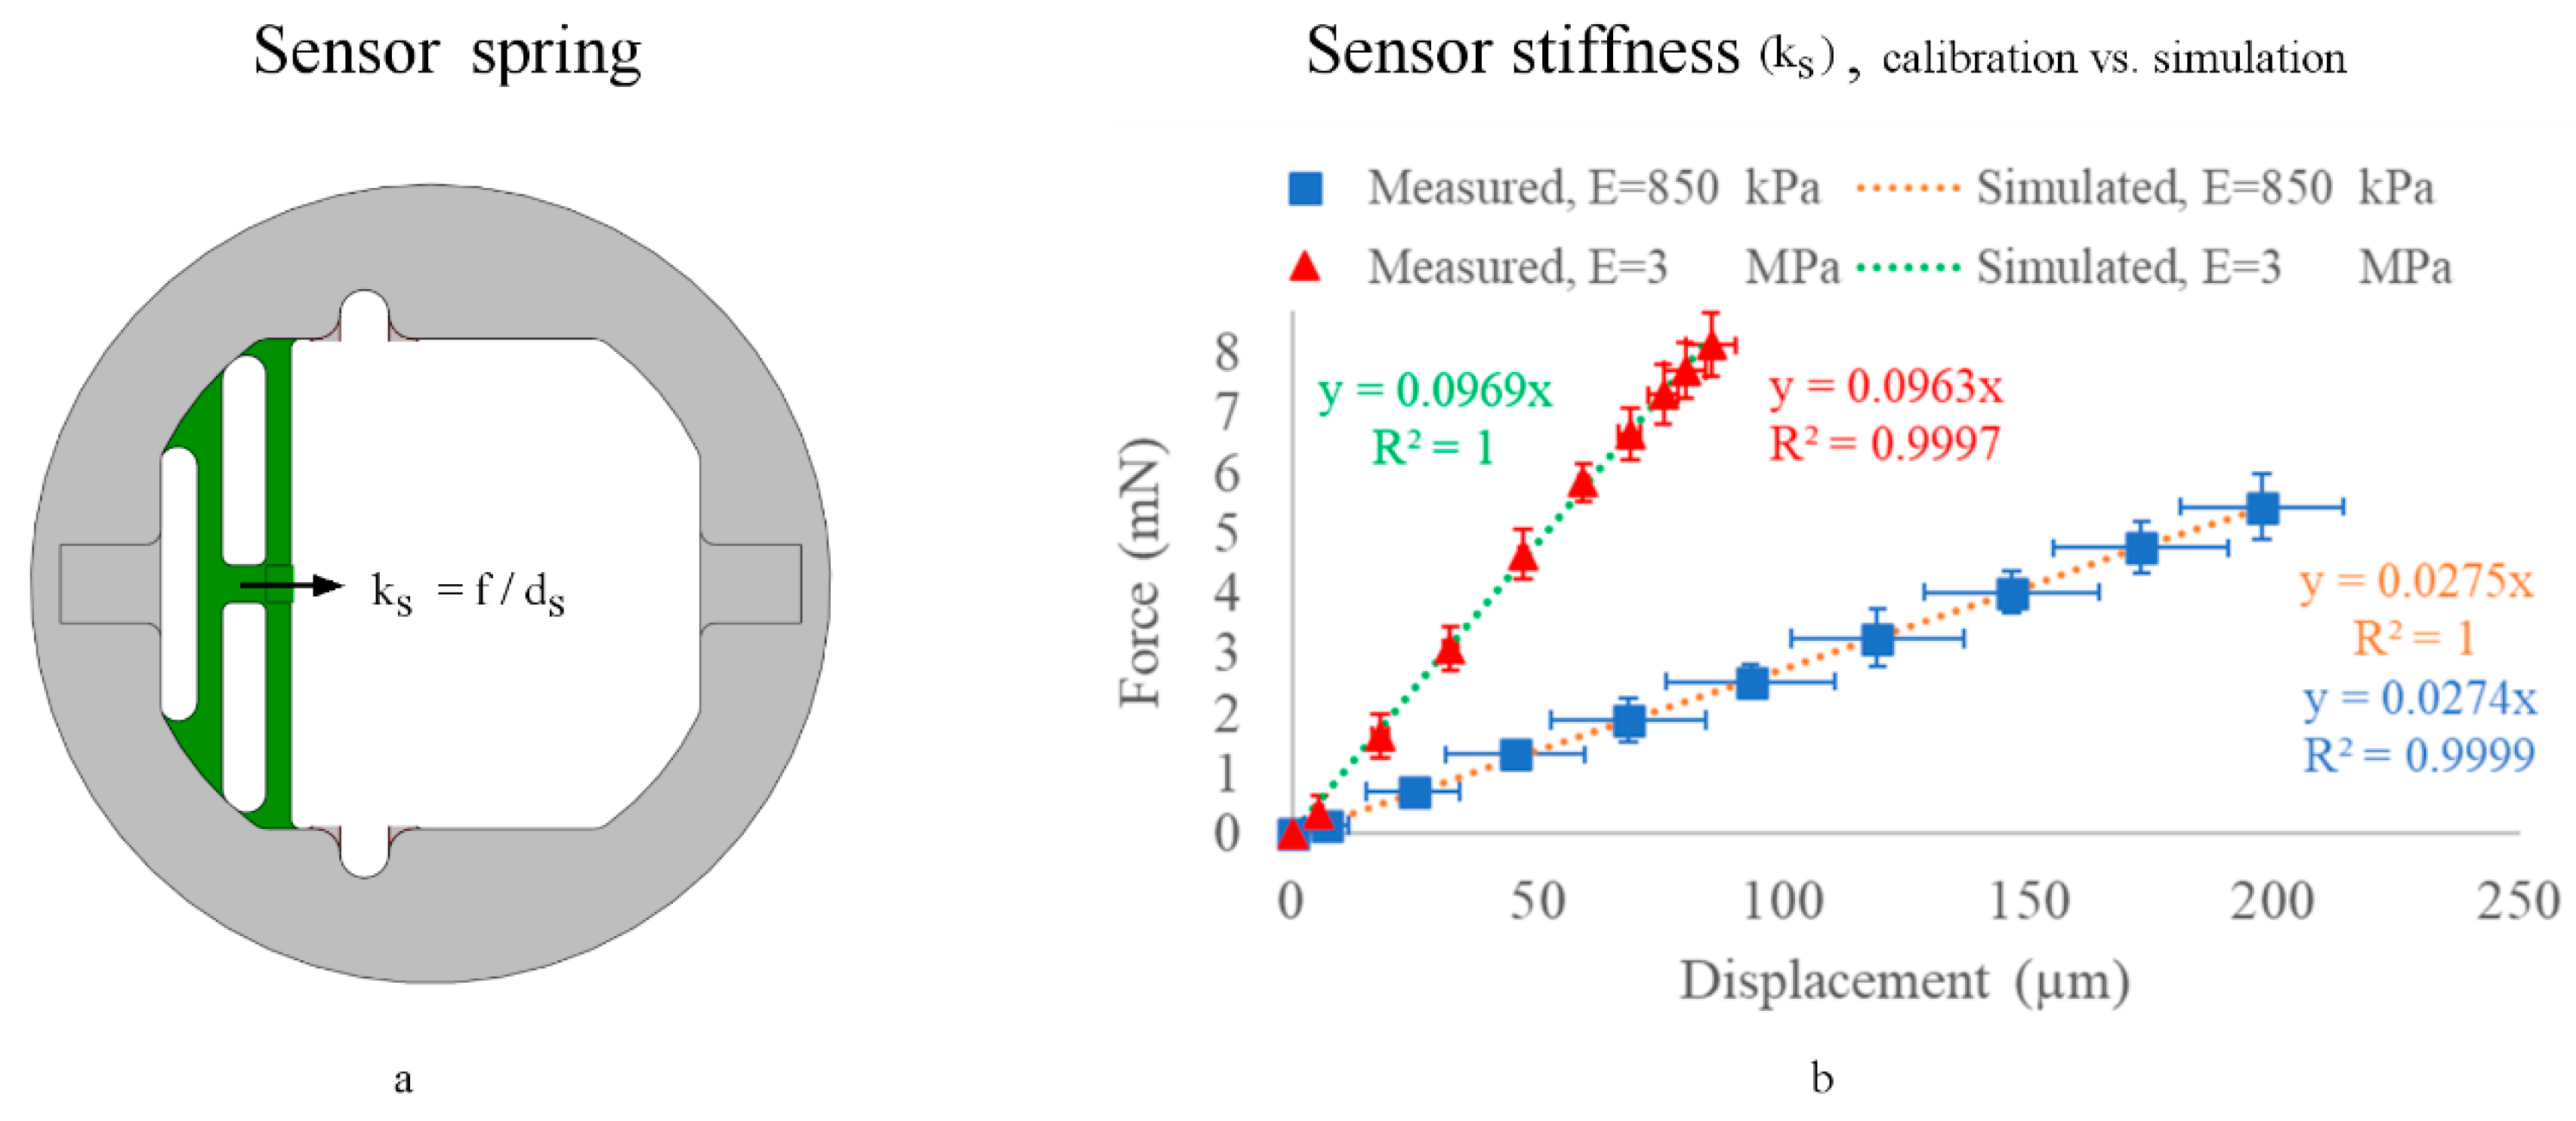
3.3. Sensor Stiffness (ks) Calibration (No Sample Attached)
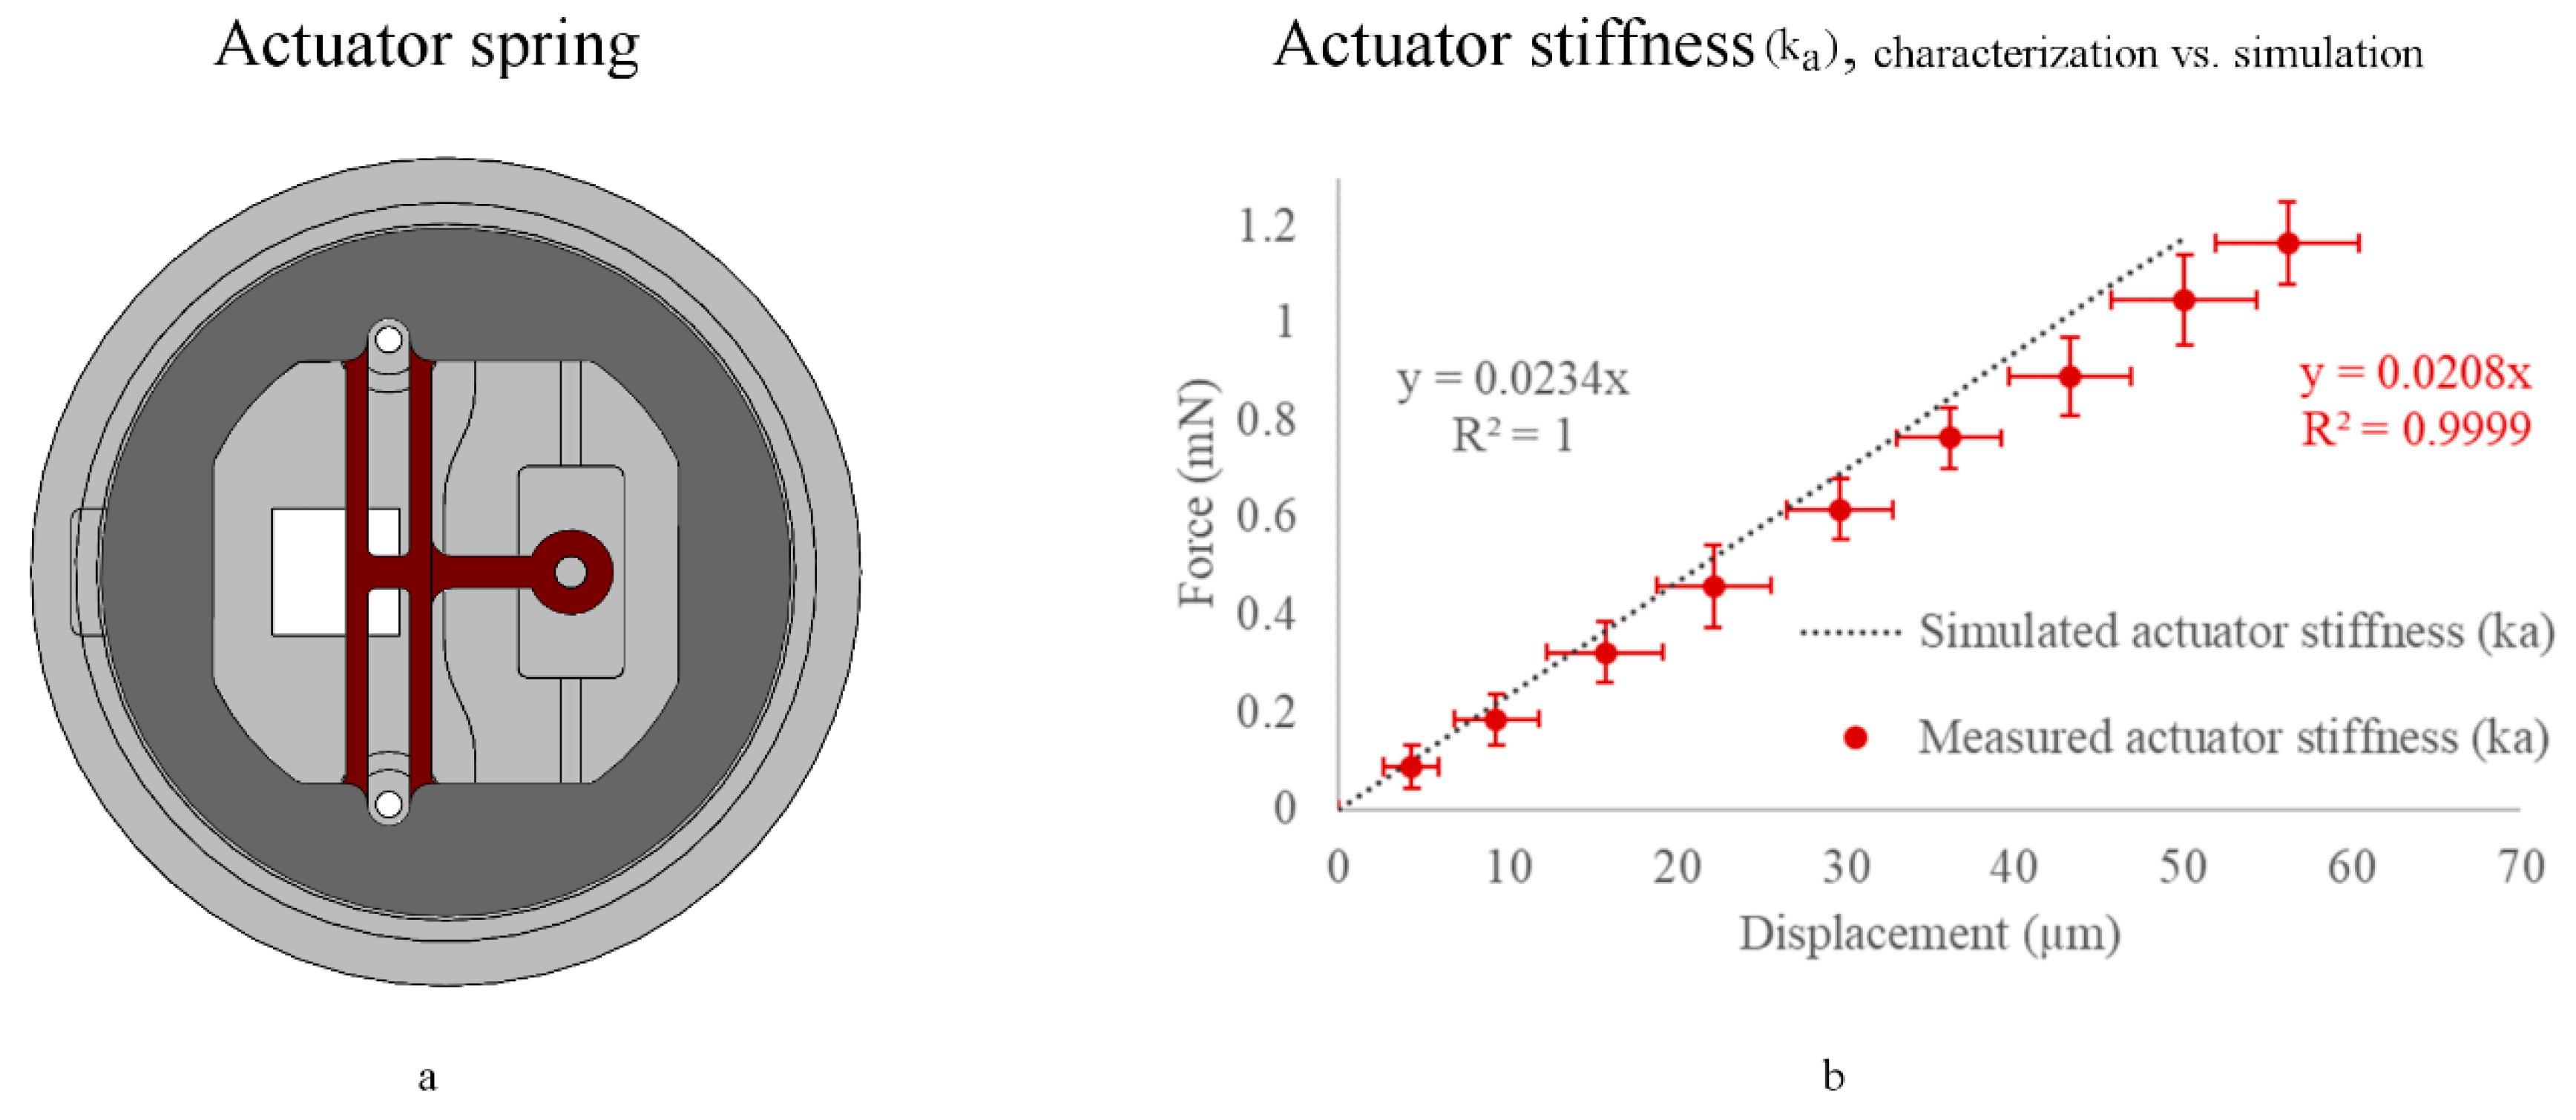
3.4. Actuator Stiffness (ka) Characterization (with a Sample Attached)
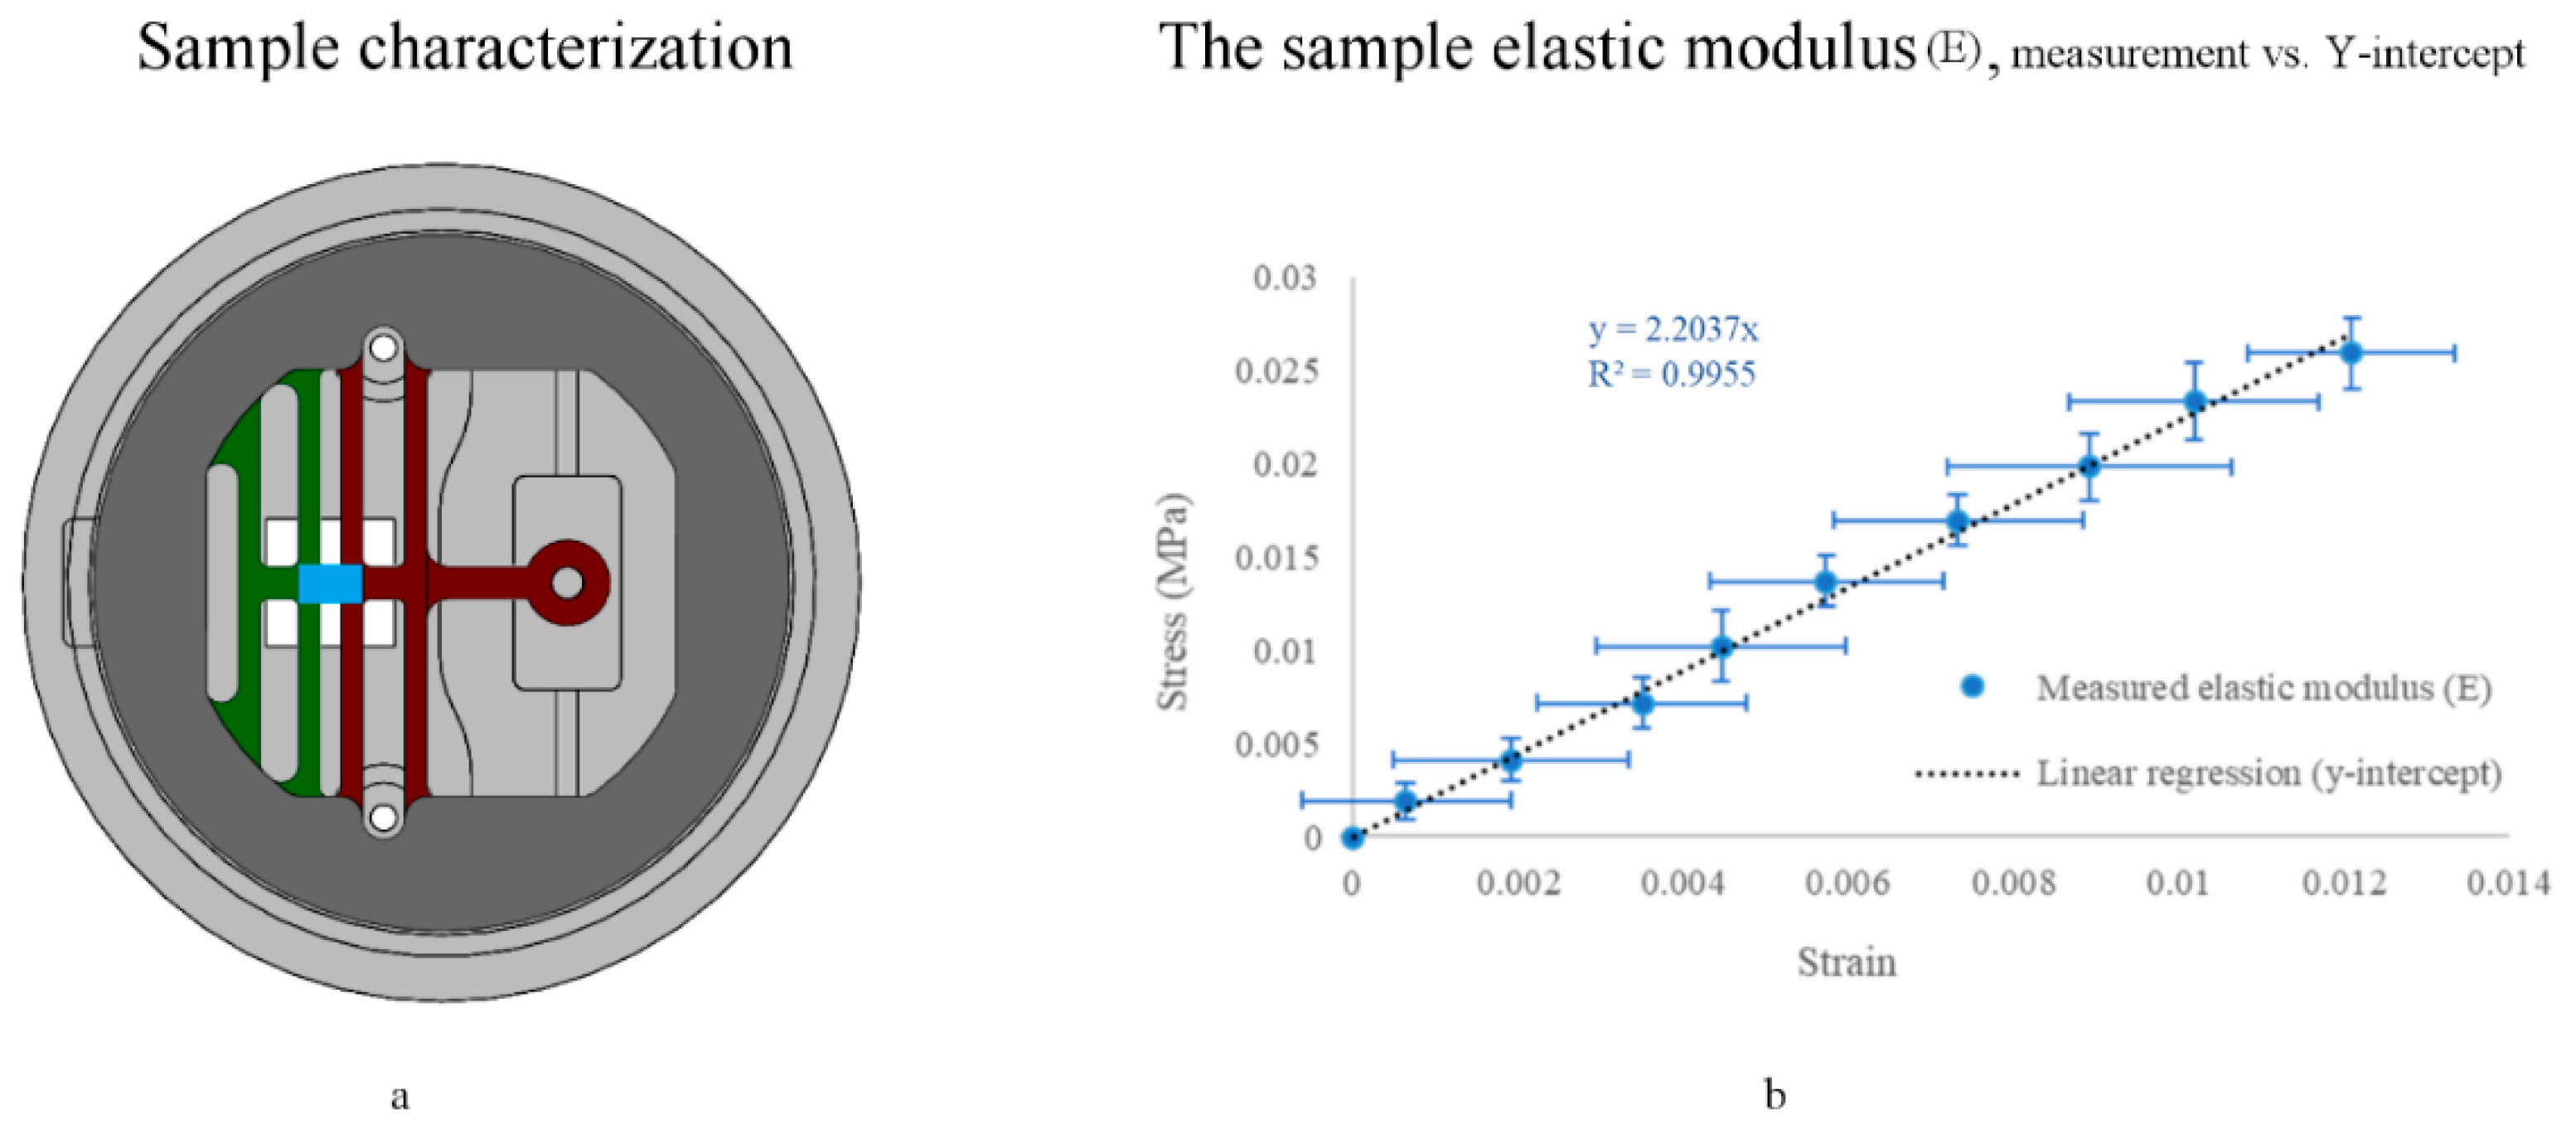
3.5. Sample Mechanical Characterization
3.5.1. End-Point
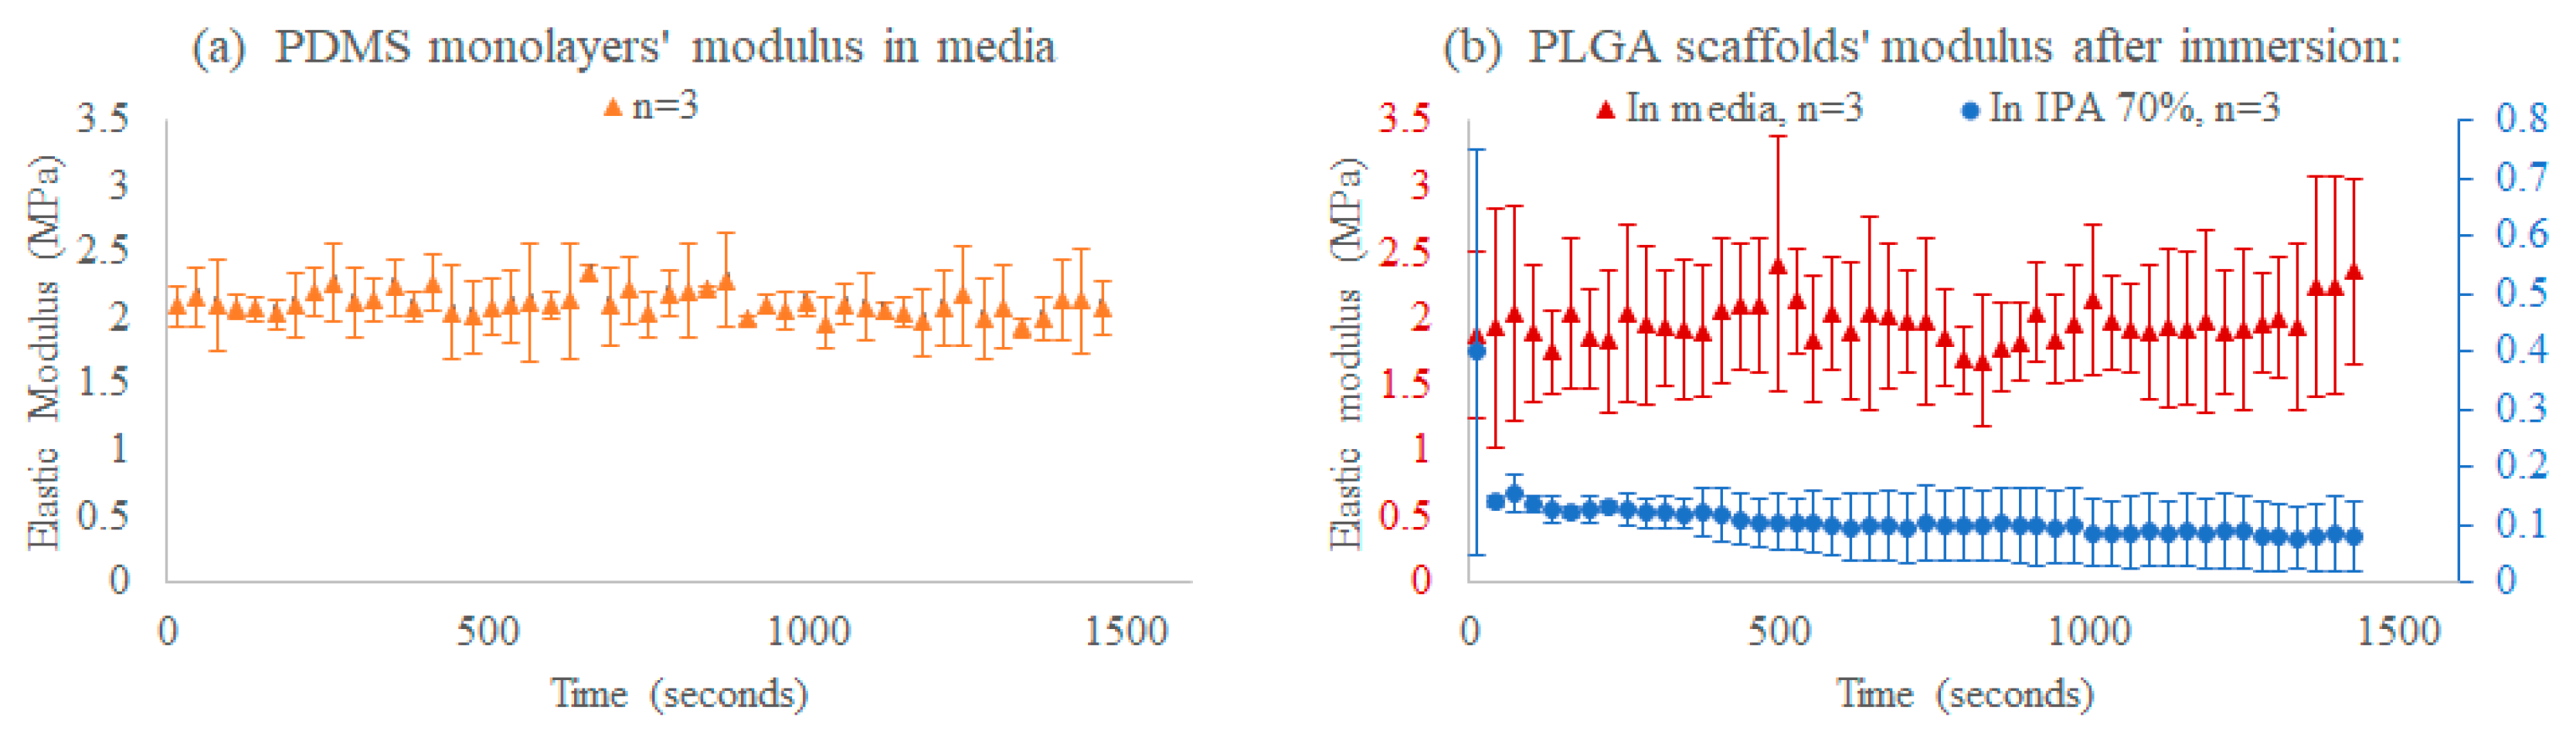
3.5.2. Time-Course
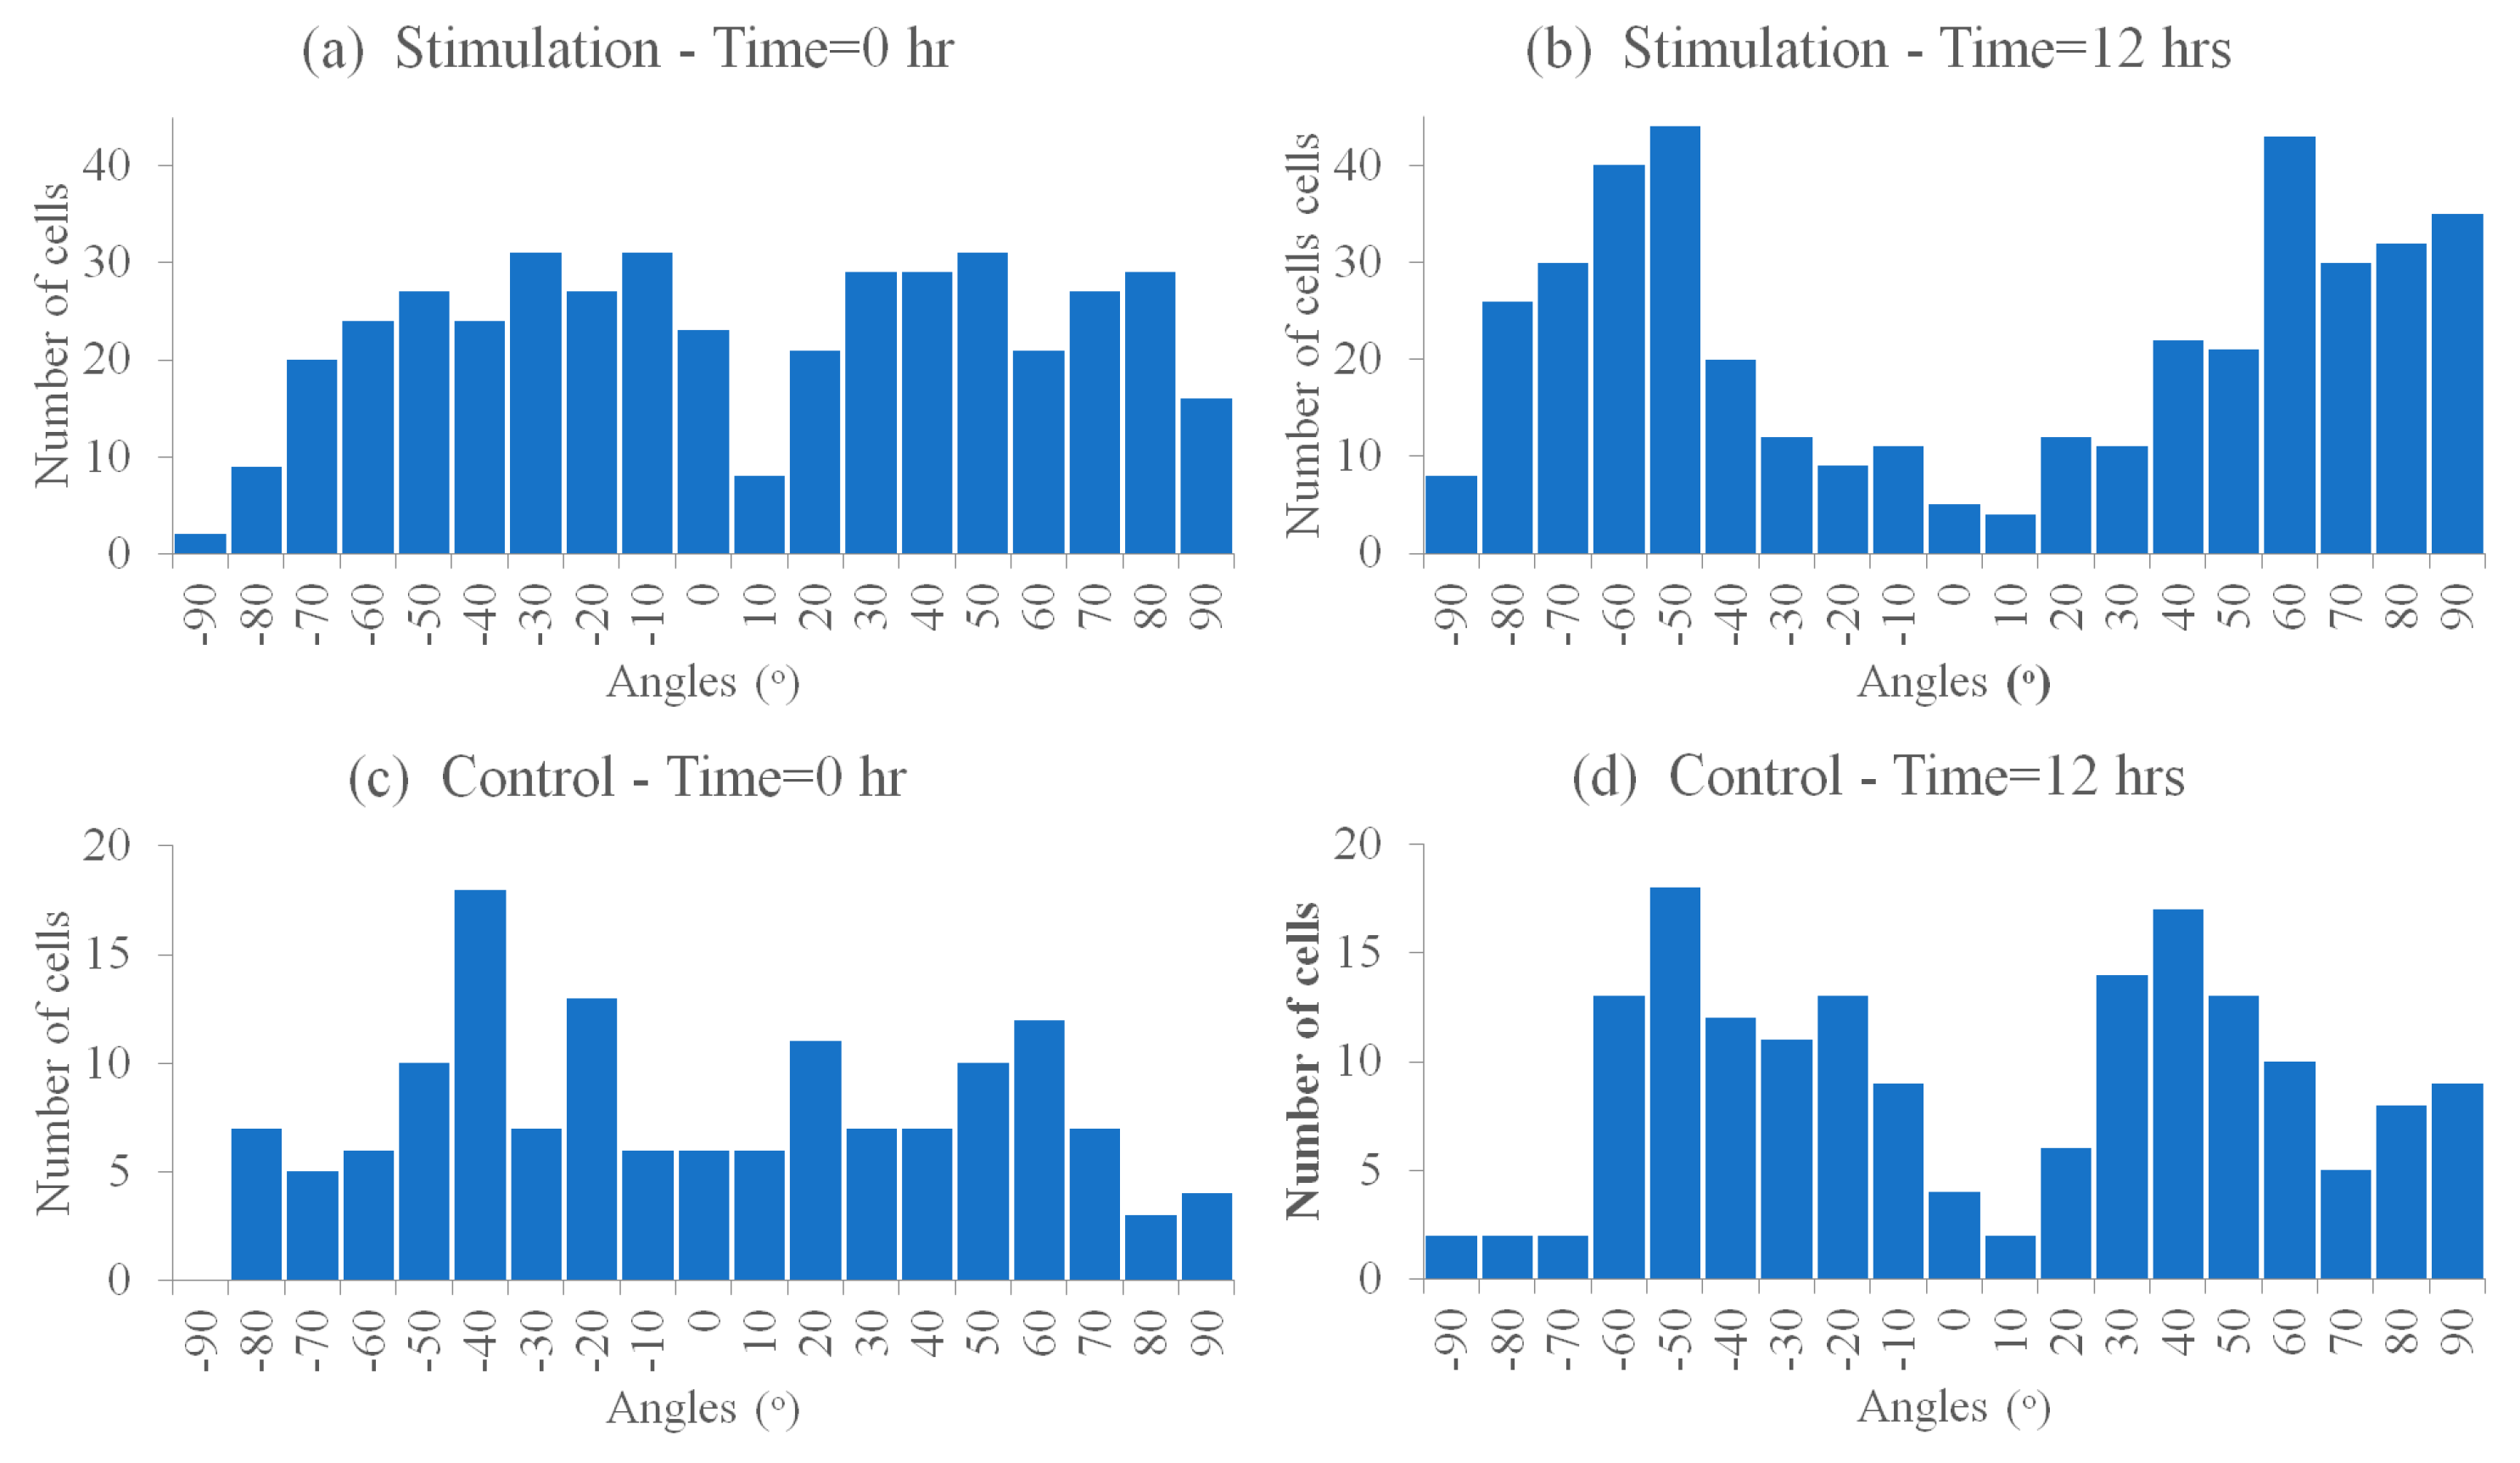
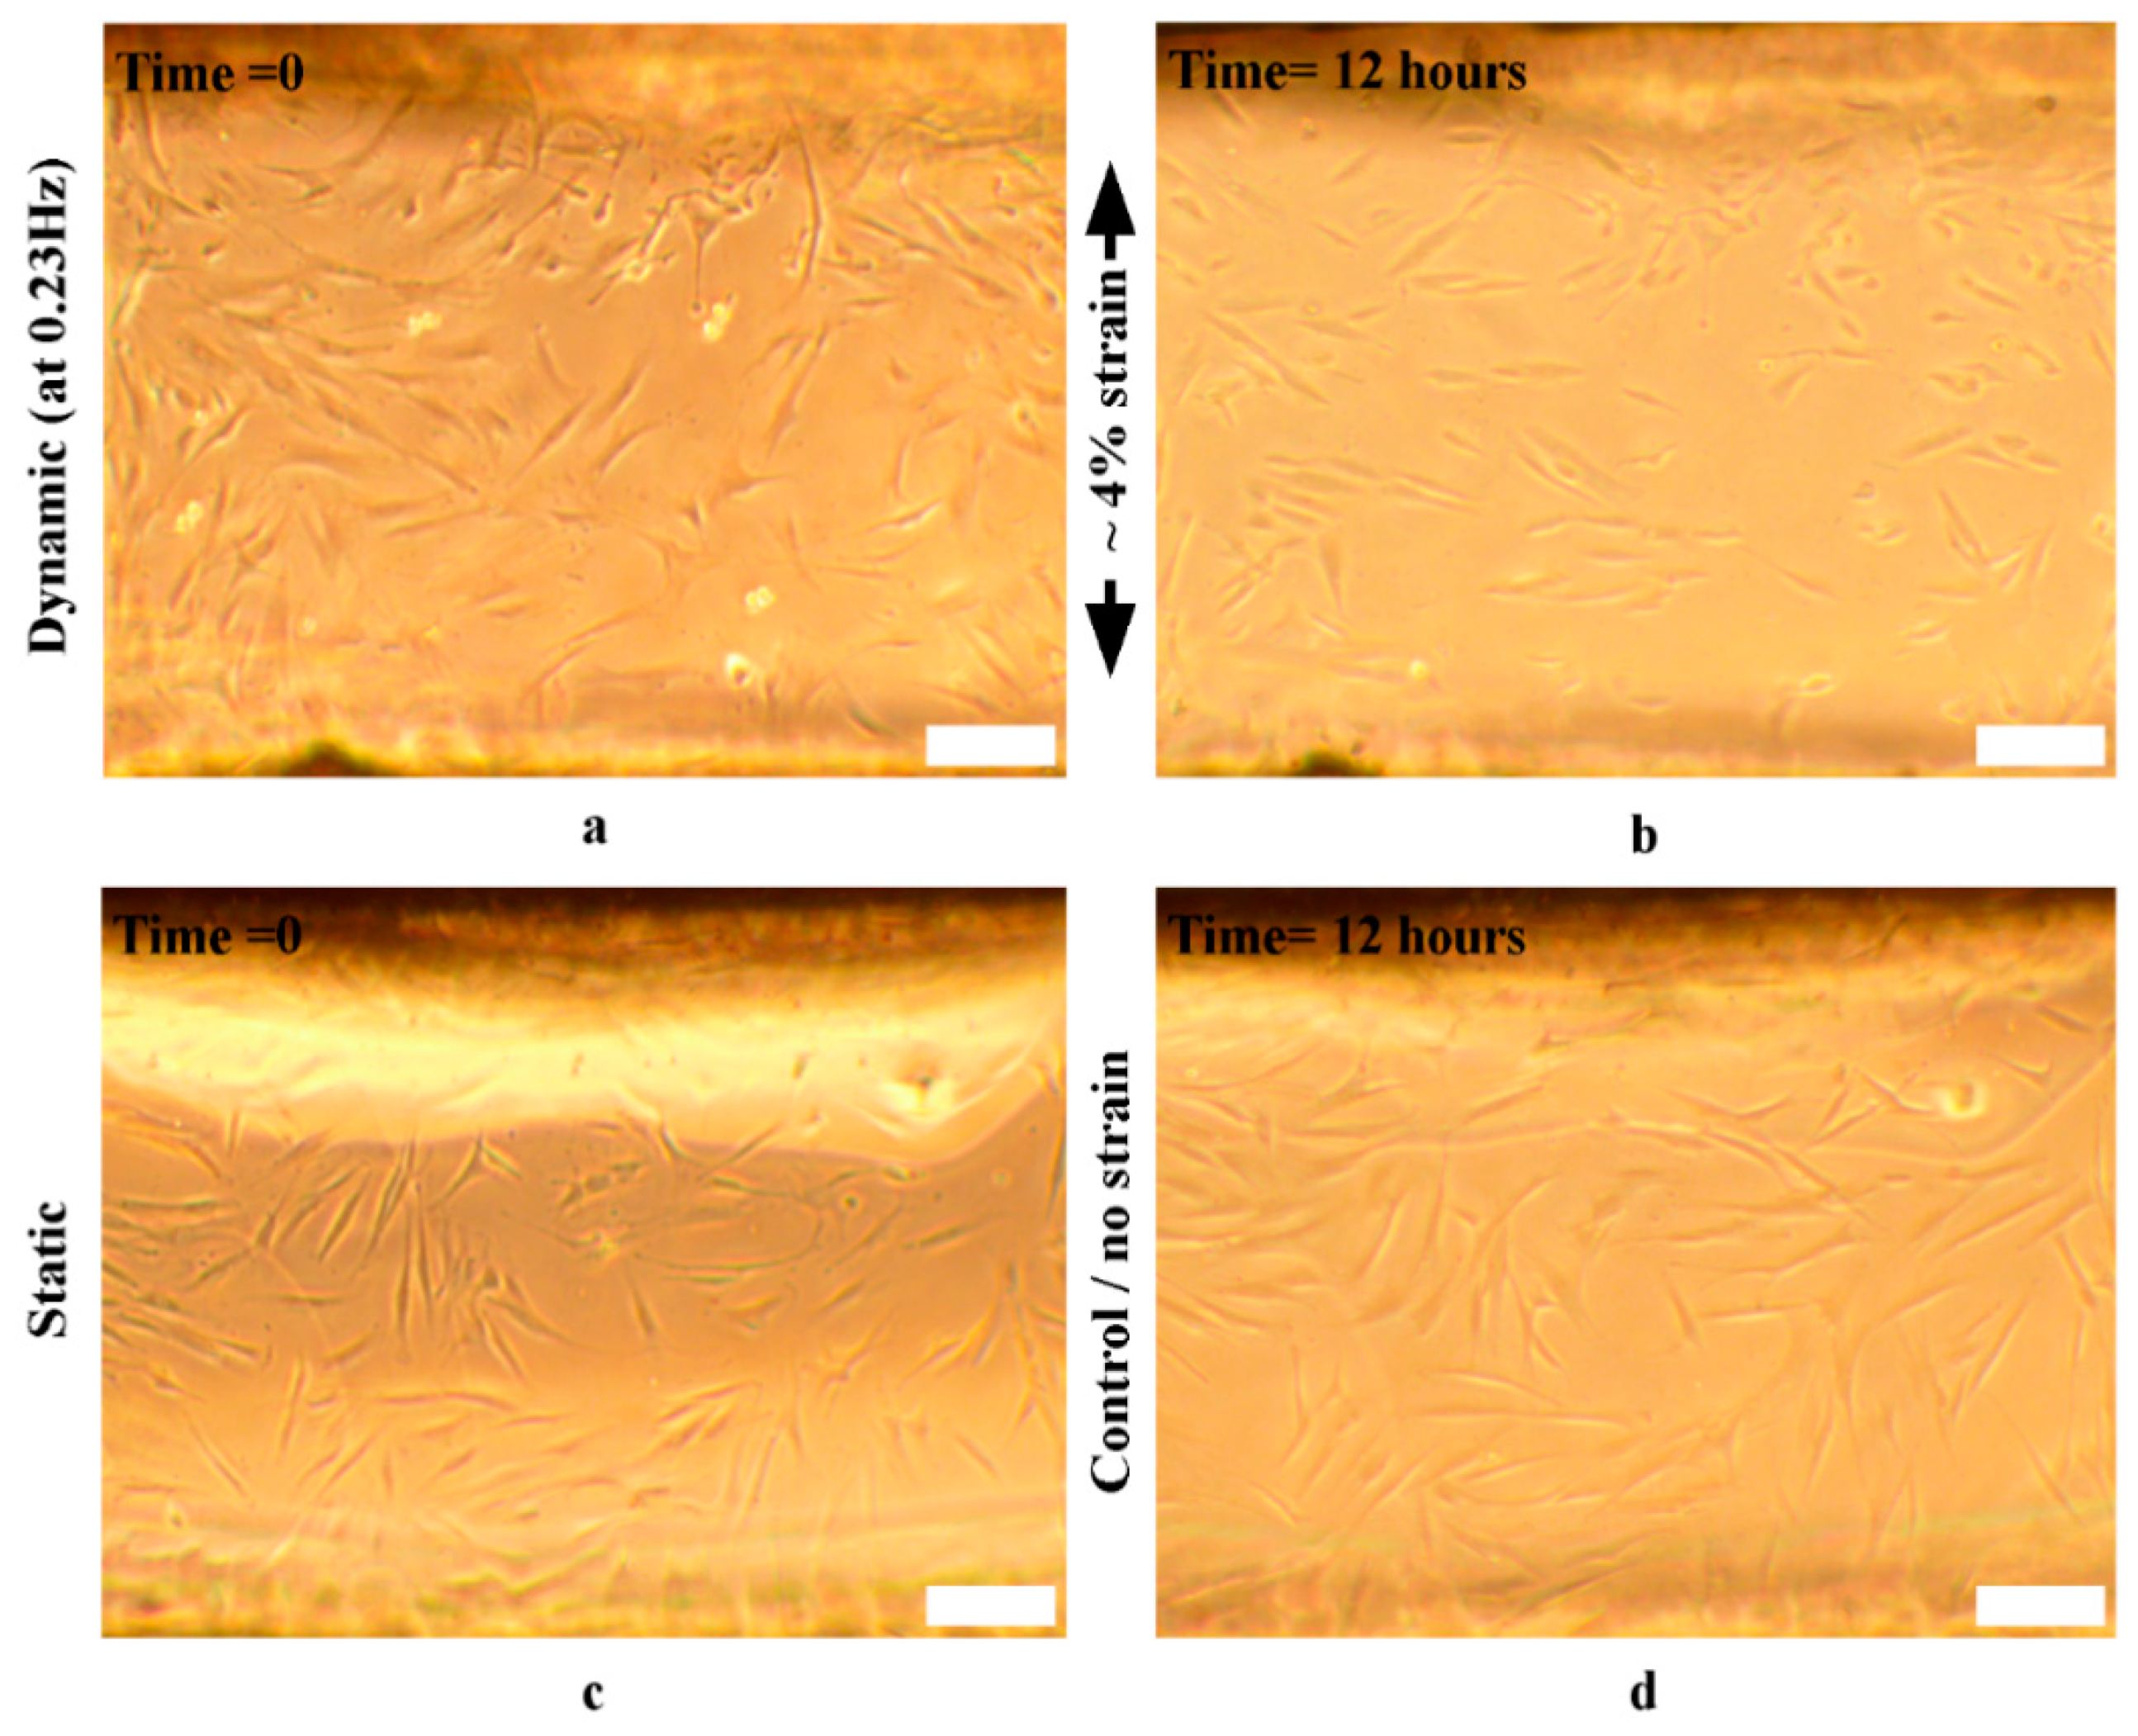
3.6. Cell Reorientation Validation Experiments
3.6.1. Cells’ Reorientation Trends
3.6.2. Viability
3.7. Future Direction
4. Conclusions
Supplementary Materials
Author Contributions
Funding
Acknowledgments
Conflicts of Interest
References
- Norman, J.J.; Mukundan, V.; Bernstein, D.; Pruitt, B.L. Microsystems for biomechanical measurements. Pediatr. Res. 2008, 63, 576–583. [Google Scholar] [CrossRef] [PubMed]
- Lee, G.Y.; Lim, C.T. Biomechanics approaches to studying human diseases. Trends Biotechnol. 2007, 25, 111–118. [Google Scholar] [CrossRef] [PubMed]
- Xu, W.; Mezencev, R.; Kim, B.; Wang, L.; McDonald, J.; Sulchek, T. Cell stiffness is a biomarker of the metastatic potential of ovarian cancer cells. PLoS ONE 2012, 7, e46609. [Google Scholar] [CrossRef] [PubMed]
- Lekka, M.; Pogoda, K.; Gostek, J.; Klymenko, O.; Prauzner-Bechcicki, S.; Wiltowska-Zuber, J.; Jaczewska, J.; Lekki, J.; Stachura, Z. Cancer cell recognition–mechanical phenotype. Micron 2012, 43, 1259–1266. [Google Scholar] [CrossRef]
- Weder, G.; Hendriks-Balk, M.C.; Smajda, R.; Rimoldi, D.; Liley, M.; Heinzelmann, H.; Meister, A.; Mariotti, A. Increased plasticity of the stiffness of melanoma cells correlates with their acquisition of metastatic properties. Nanomed. Nanotechnol. Biol. Med. 2014, 10, 141–148. [Google Scholar] [CrossRef]
- Butler, D.L.; Goldstein, S.A.; Guilak, F. Functional tissue engineering: The role of biomechanics. J. Biomech. Eng. 2000, 122, 570–575. [Google Scholar] [CrossRef]
- Rosso, F.; Giordano, A.; Barbarisi, M.; Barbarisi, A. From cell–ECM interactions to tissue engineering. J. Cell Physiol. 2004, 199, 174–180. [Google Scholar] [CrossRef]
- Wendt, D.; Timmins, N.; Malda, J.; Janssen, F.; Ratcliffe, A.; Vunjak-Novakovic, G.; Martin, I. Bioreactors for tissue engineering. In Tissue Engineering; Elsevier: Amsterdam, The Netherlands, 2008; pp. 483–506. [Google Scholar]
- Akhyari, P.; Fedak, P.W.; Weisel, R.D.; Lee, T.J.; Verma, S.; Mickle, D.A.; Li, R. Mechanical stretch regimen enhances the formation of bioengineered autologous cardiac muscle grafts. Circulation 2002, 106, 1–142. [Google Scholar]
- Powell, C.A.; Smiley, B.L.; Mills, J.; Vandenburgh, H.H. Mechanical stimulation improves tissue-engineered human skeletal muscle. Am. J. Physiol. Physiol. 2002, 283, C1557–C1565. [Google Scholar] [CrossRef]
- Kim, B.; Nikolovski, J.; Bonadio, J.; Mooney, D.J. Cyclic mechanical strain regulates the development of engineered smooth muscle tissue. Nat. Biotechnol. 1999, 17, 979–983. [Google Scholar] [CrossRef]
- Discher, D.E.; Janmey, P.; Wang, Y. Tissue cells feel and respond to the stiffness of their substrate. Science 2005, 310, 1139–1143. [Google Scholar] [CrossRef] [PubMed]
- De, R.; Zemel, A.; Safran, S.A. Dynamics of cell orientation. Nat. Phys. 2007, 3, 655–659. [Google Scholar] [CrossRef]
- Livne, A.; Bouchbinder, E.; Geiger, B. Cell reorientation under cyclic stretching. Nat. Commun. 2014, 5, 3938. [Google Scholar] [CrossRef] [PubMed]
- Neidlinger-Wilke, C.; Grood, E.S.; Wang, J.; Brand, R.A.; Claes, L. Cell alignment is induced by cyclic changes in cell length: Studies of cells grown in cyclically stretched substrates. J. Orthop. Res. 2001, 19, 286–293. [Google Scholar] [CrossRef]
- Jungbauer, S.; Gao, H.; Spatz, J.P.; Kemkemer, R. Two characteristic regimes in frequency-dependent dynamic reorientation of fibroblasts on cyclically stretched substrates. Biophys. J. 2008, 95, 3470–3478. [Google Scholar] [CrossRef]
- Kong, D.; Ji, B.; Dai, L. Stability of adhesion clusters and cell reorientation under lateral cyclic tension. Biophys. J. 2008, 95, 4034–4044. [Google Scholar] [CrossRef]
- Shin, H.J.; Lee, C.H.; Cho, I.H.; Kim, Y.; Lee, Y.; Kim, I.A.; Park, K.; Yui, N.; Shin, J. Electrospun PLGA nanofiber scaffolds for articular cartilage reconstruction: Mechanical stability, degradation and cellular responses under mechanical stimulation in vitro. J. Biomater. Sci. Polym. Ed. 2006, 17, 103–119. [Google Scholar] [CrossRef]
- Gentleman, E.; Lay, A.N.; Dickerson, D.A.; Nauman, E.A.; Livesay, G.A.; Dee, K.C. Mechanical characterization of collagen fibers and scaffolds for tissue engineering. Biomaterials 2003, 24, 3805–3813. [Google Scholar] [CrossRef]
- Demarteau, O.; Wendt, D.; Braccini, A.; Jakob, M.; Schäfer, D.; Heberer, M.; Martin, I. Dynamic compression of cartilage constructs engineered from expanded human articular chondrocytes. Biochem. Biophys. Res. Commun. 2003, 310, 580–588. [Google Scholar] [CrossRef]
- Korossis, S.A.; Bolland, F.; Kearney, J.N.; Fisher, J.; Ingham, E. Bioreactors in tissue engineering. Topics Tissue Eng. 2005, 2, 1–23. [Google Scholar]
- Plunkett, N.; O’Brien, F.J. Bioreactors in tissue engineering. Technol. Heal. Care 2011, 19, 55–69. [Google Scholar] [CrossRef] [PubMed]
- Lei, Y.; Ferdous, Z. Design considerations and challenges for mechanical stretch bioreactors in tissue engineering. Biotechnol. Prog. 2016, 32, 543–553. [Google Scholar] [CrossRef]
- Martin, I.; Smith, T.; Wendt, D. Bioreactor-based roadmap for the translation of tissue engineering strategies into clinical products. Trends Biotechnol. 2009, 27, 495–502. [Google Scholar] [CrossRef] [PubMed]
- Kluge, J.A.; Leisk, G.G.; Cardwell, R.D.; Fernandes, A.P.; House, M.; Ward, A.; Dorfmann, A.L.; Kaplan, D.L. Bioreactor system using noninvasive imaging and mechanical stretch for biomaterial screening. Ann. Biomed. Eng. 2011, 39, 1390–1402. [Google Scholar] [CrossRef] [PubMed]
- Cook, C.A.; Huri, P.Y.; Ginn, B.P.; Gilbert-Honick, J.; Somers, S.M.; Temple, J.P.; Mao, H.; Grayson, W.L. Characterization of a novel bioreactor system for 3D cellular mechanobiology studies. Biotechnol. Bioeng. 2016, 113, 1825–1837. [Google Scholar] [CrossRef]
- Lovecchio, J.; Gargiulo, P.; Luna, J.L.V.; Giordano, E.; Sigurjónsson, Ó.E. A standalone bioreactor system to deliver compressive load under perfusion flow to hBMSC-seeded 3D chitosan-graphene templates. Sci. Rep. 2019, 9, 1–11. [Google Scholar] [CrossRef] [PubMed]
- Kuncova-Kallio, J.; Kallio, P.J. PDMS and its suitability for analytical microfluidic devices. In Proceedings of the 2006 International Conference of the IEEE Engineering in Medicine and Biology Society, New York, NY, USA, 30 August–3 September 2006; pp. 2486–2489. [Google Scholar]
- Deguchi, S.; Hotta, J.; Yokoyama, S.; Matsui, T.S. Viscoelastic and optical properties of four different PDMS polymers. J. Micromech Microeng. 2015, 25, 097002. [Google Scholar] [CrossRef]
- Kim, T.K.; Kim, J.K.; Jeong, O.C. Measurement of nonlinear mechanical properties of PDMS elastomer. Microelectron. Eng. 2011, 88, 1982–1985. [Google Scholar] [CrossRef]
- Brown, X.Q.; Ookawa, K.; Wong, J.Y. Evaluation of polydimethylsiloxane scaffolds with physiologically-relevant elastic moduli: Interplay of substrate mechanics and surface chemistry effects on vascular smooth muscle cell response. Biomaterials 2005, 26, 3123–3129. [Google Scholar] [CrossRef]
- Shearer, H.; Ellis, M.J.; Perera, S.P.; Chaudhuri, J.B. Effects of common sterilization methods on the structure and properties of poly (D, L lactic-co-glycolic acid) scaffolds. Tissue Eng. 2006, 12, 2717–2727. [Google Scholar] [CrossRef]
- Fuard, D.; Tzvetkova-Chevolleau, T.; Decossas, S.; Tracqui, P.; Schiavone, P. Optimization of poly-di-methyl-siloxane (PDMS) substrates for studying cellular adhesion and motility. Microelectron. Eng. 2008, 85, 1289–1293. [Google Scholar] [CrossRef]
- Johnston, I.D.; McCluskey, D.K.; Tan, C.; Tracey, M.C. Mechanical characterization of bulk Sylgard 184 for microfluidics and microengineering. J. Micromech Microeng. 2014, 24, 035017. [Google Scholar] [CrossRef]
- Liu, M.; Sun, J.; Chen, Q. Influences of heating temperature on mechanical properties of polydimethylsiloxane. Sens. Actuators A Phys. 2009, 151, 42–45. [Google Scholar] [CrossRef]
- Campeau, M.; Lortie, A.; Tremblay, P.; Béliveau, M.; Dubé, D.; Langelier, È.; Rouleau, L. Effect of manufacturing and experimental conditions on the mechanical and surface properties of silicone elastomer scaffolds used in endothelial mechanobiological studies. Biomed. Eng. Online 2017, 16, 1–23. [Google Scholar] [CrossRef] [PubMed]
- Khanafer, K.; Duprey, A.; Schlicht, M.; Berguer, R. Effects of strain rate, mixing ratio, and stress–strain definition on the mechanical behavior of the polydimethylsiloxane (PDMS) material as related to its biological applications. Biomed. Microdevices 2009, 11, 503. [Google Scholar] [CrossRef]
- Singh, D.; Somani, V.K.; Aggarwal, S.; Bhatnagar, R. PLGA (85: 15) nanoparticle based delivery of rL7/L12 ribosomal protein in mice protects against Brucella abortus 544 infection: A promising alternate to traditional adjuvants. Mol. Immunol. 2015, 68, 272–279. [Google Scholar] [CrossRef]
- Selim, M.; Bullock, A.J.; Blackwood, K.A.; Chapple, C.R.; MacNeil, S. Developing biodegradable scaffolds for tissue engineering of the urethra. BJU Int. 2011, 107, 296–302. [Google Scholar] [CrossRef]
- Pan, Z.; Ding, J. Poly (lactide-co-glycolide) porous scaffolds for tissue engineering and regenerative medicine. Interface Focus 2012, 2, 366–377. [Google Scholar] [CrossRef]
- Wu, L.; Zhang, J.; Jing, D.; Ding, J. “Wet-state” mechanical properties of three-dimensional polyester porous scaffolds. J. Biomed. Mater. Res. Part A 2006, 76, 264–271. [Google Scholar] [CrossRef]
- Yang, Y.; Zhao, Y.; Tang, G.; Li, H.; Yuan, X.; Fan, Y. In vitro degradation of porous poly (l-lactide-co-glycolide)/β-tricalcium phosphate (PLGA/β-TCP) scaffolds under dynamic and static conditions. Polym. Degrad. Stab. 2008, 93, 1838–1845. [Google Scholar] [CrossRef]
- Pavlova, E.R.; Bagrov, D.V.; Monakhova, K.Z.; Piryazev, A.A.; Sokolova, A.I.; Ivanov, D.A.; Klinov, D.V. Tuning the properties of electrospun polylactide mats by ethanol treatment. Mater. Des. 2019, 181, 108061. [Google Scholar] [CrossRef]
- Yokoyama, S.; Matsui, T.S.; Deguchi, S. Microcontact peeling as a new method for cell micropatterning. PLoS ONE 2014, 9, e102735. [Google Scholar] [CrossRef] [PubMed]
- McDonald, J.C.; Duffy, D.C.; Anderson, J.R.; Chiu, D.T.; Wu, H.; Schueller, O.J.; Whitesides, G.M. Fabrication of microfluidic systems in poly (dimethylsiloxane). Electrophor. Int. J. 2000, 21, 27–40. [Google Scholar] [CrossRef]
- Juárez-Moreno, J.A.; Ávila-Ortega, A.; Oliva, A.I.; Avilés, F.; Cauich-Rodríguez, J.V. Effect of wettability and surface roughness on the adhesion properties of collagen on PDMS films treated by capacitively coupled oxygen plasma. Appl. Surf. Sci. 2015, 349, 763–773. [Google Scholar] [CrossRef]
- Kim, B.; Peterson, E.; Papautsky, I. Long-term stability of plasma oxidized PDMS surfaces. In Proceedings of the 26th Annual International Conference of the IEEE Engineering in Medicine and Biology Society, San Francisco, CA, USA, 1–5 September 2004; pp. 5013–5016. [Google Scholar]
- Nanotec Electronic U.S. Inc. Available online: https://us.nanotec.com/fileadmin/files/Datenblaetter/Schrittmotoren/ST2018/ST2018S0604-A.pdf (accessed on 29 August 2020).
- Applied Motion Products, Inc. Stepper Motor Error Description. Available online: https://www.applied-motion.com/products/stepper-motors (accessed on 27 August 2020).
- Motion Control Products Ltd. Stepper Motor Datasheet & Error ±5%. Available online: https://www.motioncontrolproducts.co.uk/motionnews/wp-content/uploads/2012/04/FL20STH-stepper-motors.pdf (accessed on 27 August 2020).
- Mata, A.; Fleischman, A.J.; Roy, S. Characterization of polydimethylsiloxane (PDMS) properties for biomedical micro/nanosystems. Biomed. Microdevices 2005, 7, 281–293. [Google Scholar] [CrossRef]
- Meinert, C.; Schrobback, K.; Hutmacher, D.W.; Klein, T.J. A novel bioreactor system for biaxial mechanical loading enhances the properties of tissue-engineered human cartilage. Sci. Rep. 2017, 7, 1–14. [Google Scholar] [CrossRef]
- Jeong, Y.; Kim, D.; Kim, J.Y.; Oyunbaatar, N.; Shanmugasundaram, A.; Kim, E.; Lee, D. On-stage bioreactor platform integrated with nano-patterned and gold-coated PDMS diaphragm for live cell stimulation and imaging. Mater. Sci. Eng. C 2020, 118, 111355. [Google Scholar] [CrossRef]


© 2020 by the authors. Licensee MDPI, Basel, Switzerland. This article is an open access article distributed under the terms and conditions of the Creative Commons Attribution (CC BY) license (http://creativecommons.org/licenses/by/4.0/).
Share and Cite
Alhudaithy, S.; Abdulmalik, S.; Kumbar, S.G.; Hoshino, K. Design, Fabrication, and Validation of a Petri Dish-Compatible PDMS Bioreactor for the Tensile Stimulation and Characterization of Microtissues. Micromachines 2020, 11, 892. https://doi.org/10.3390/mi11100892
Alhudaithy S, Abdulmalik S, Kumbar SG, Hoshino K. Design, Fabrication, and Validation of a Petri Dish-Compatible PDMS Bioreactor for the Tensile Stimulation and Characterization of Microtissues. Micromachines. 2020; 11(10):892. https://doi.org/10.3390/mi11100892
Chicago/Turabian StyleAlhudaithy, Soliman, Sama Abdulmalik, Sangamesh G. Kumbar, and Kazunori Hoshino. 2020. "Design, Fabrication, and Validation of a Petri Dish-Compatible PDMS Bioreactor for the Tensile Stimulation and Characterization of Microtissues" Micromachines 11, no. 10: 892. https://doi.org/10.3390/mi11100892
APA StyleAlhudaithy, S., Abdulmalik, S., Kumbar, S. G., & Hoshino, K. (2020). Design, Fabrication, and Validation of a Petri Dish-Compatible PDMS Bioreactor for the Tensile Stimulation and Characterization of Microtissues. Micromachines, 11(10), 892. https://doi.org/10.3390/mi11100892