Determination of Mercury(II) on A Centrifugal Microfluidic Device Using Ionic Liquid Dispersive Liquid−Liquid Microextraction

 ,
,  ,
,
Abstract

1. Introduction
2. Materials and Experimental
2.1. Reagents
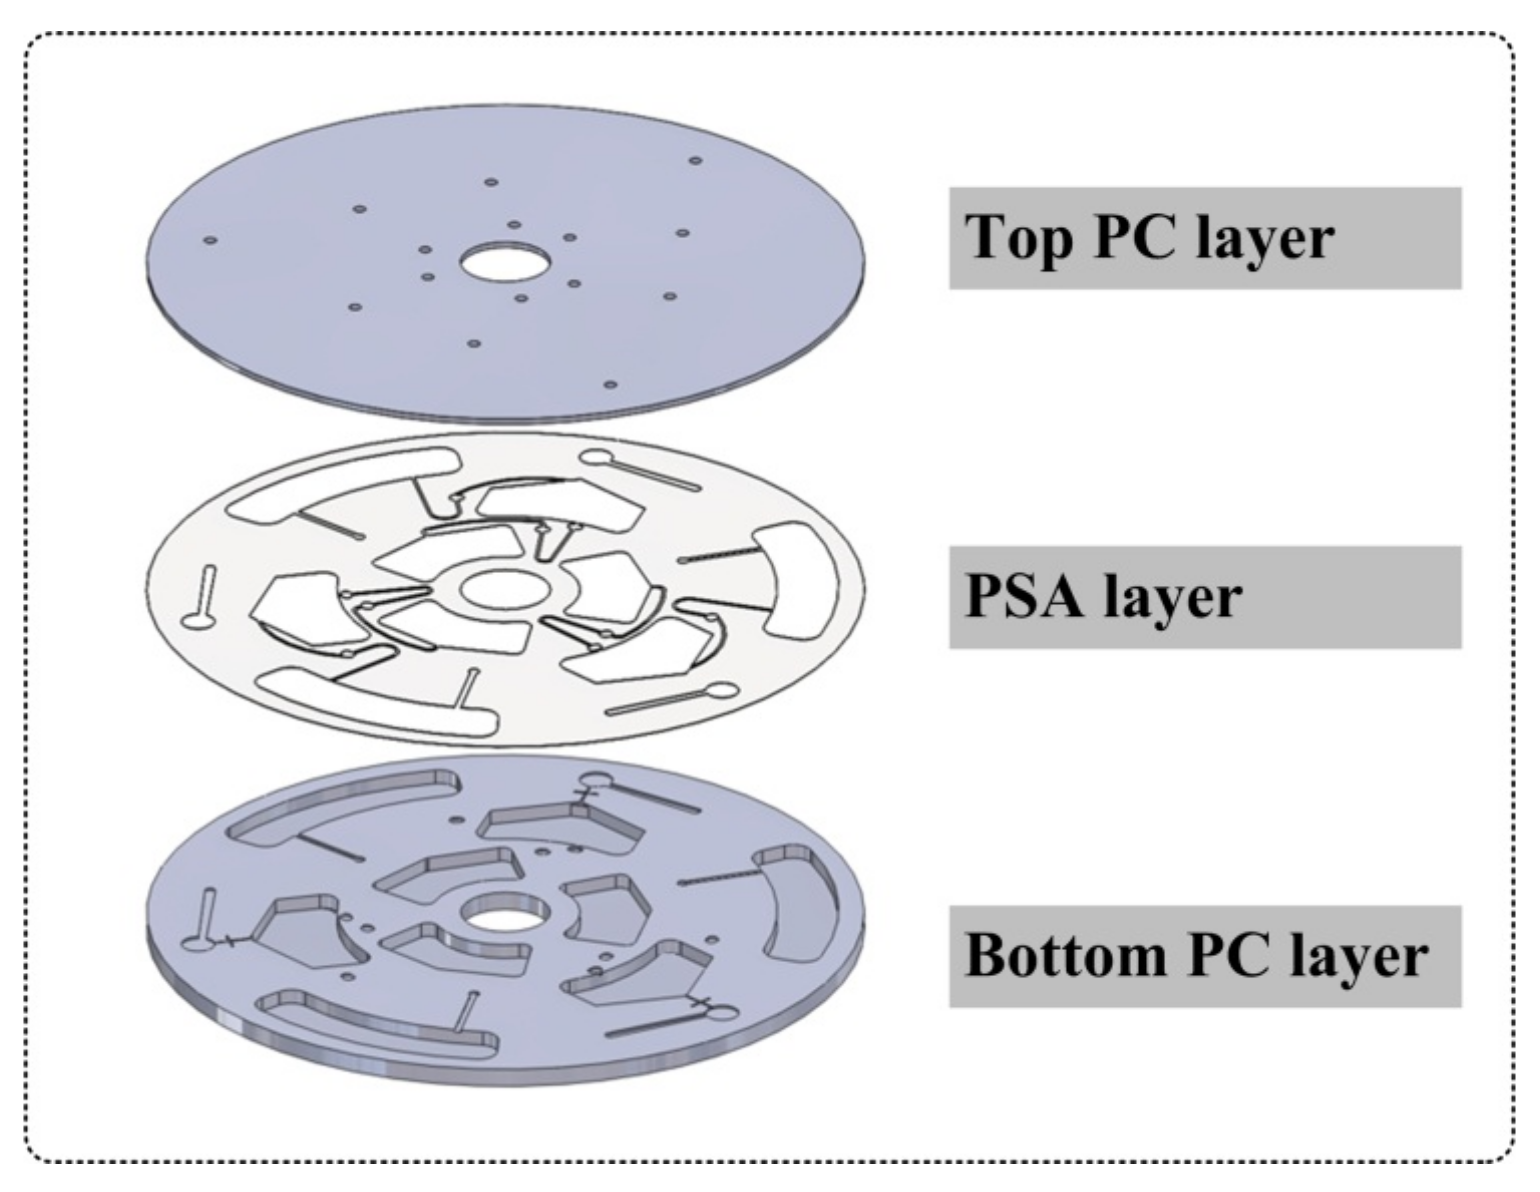
2.2. Disc Fabrication
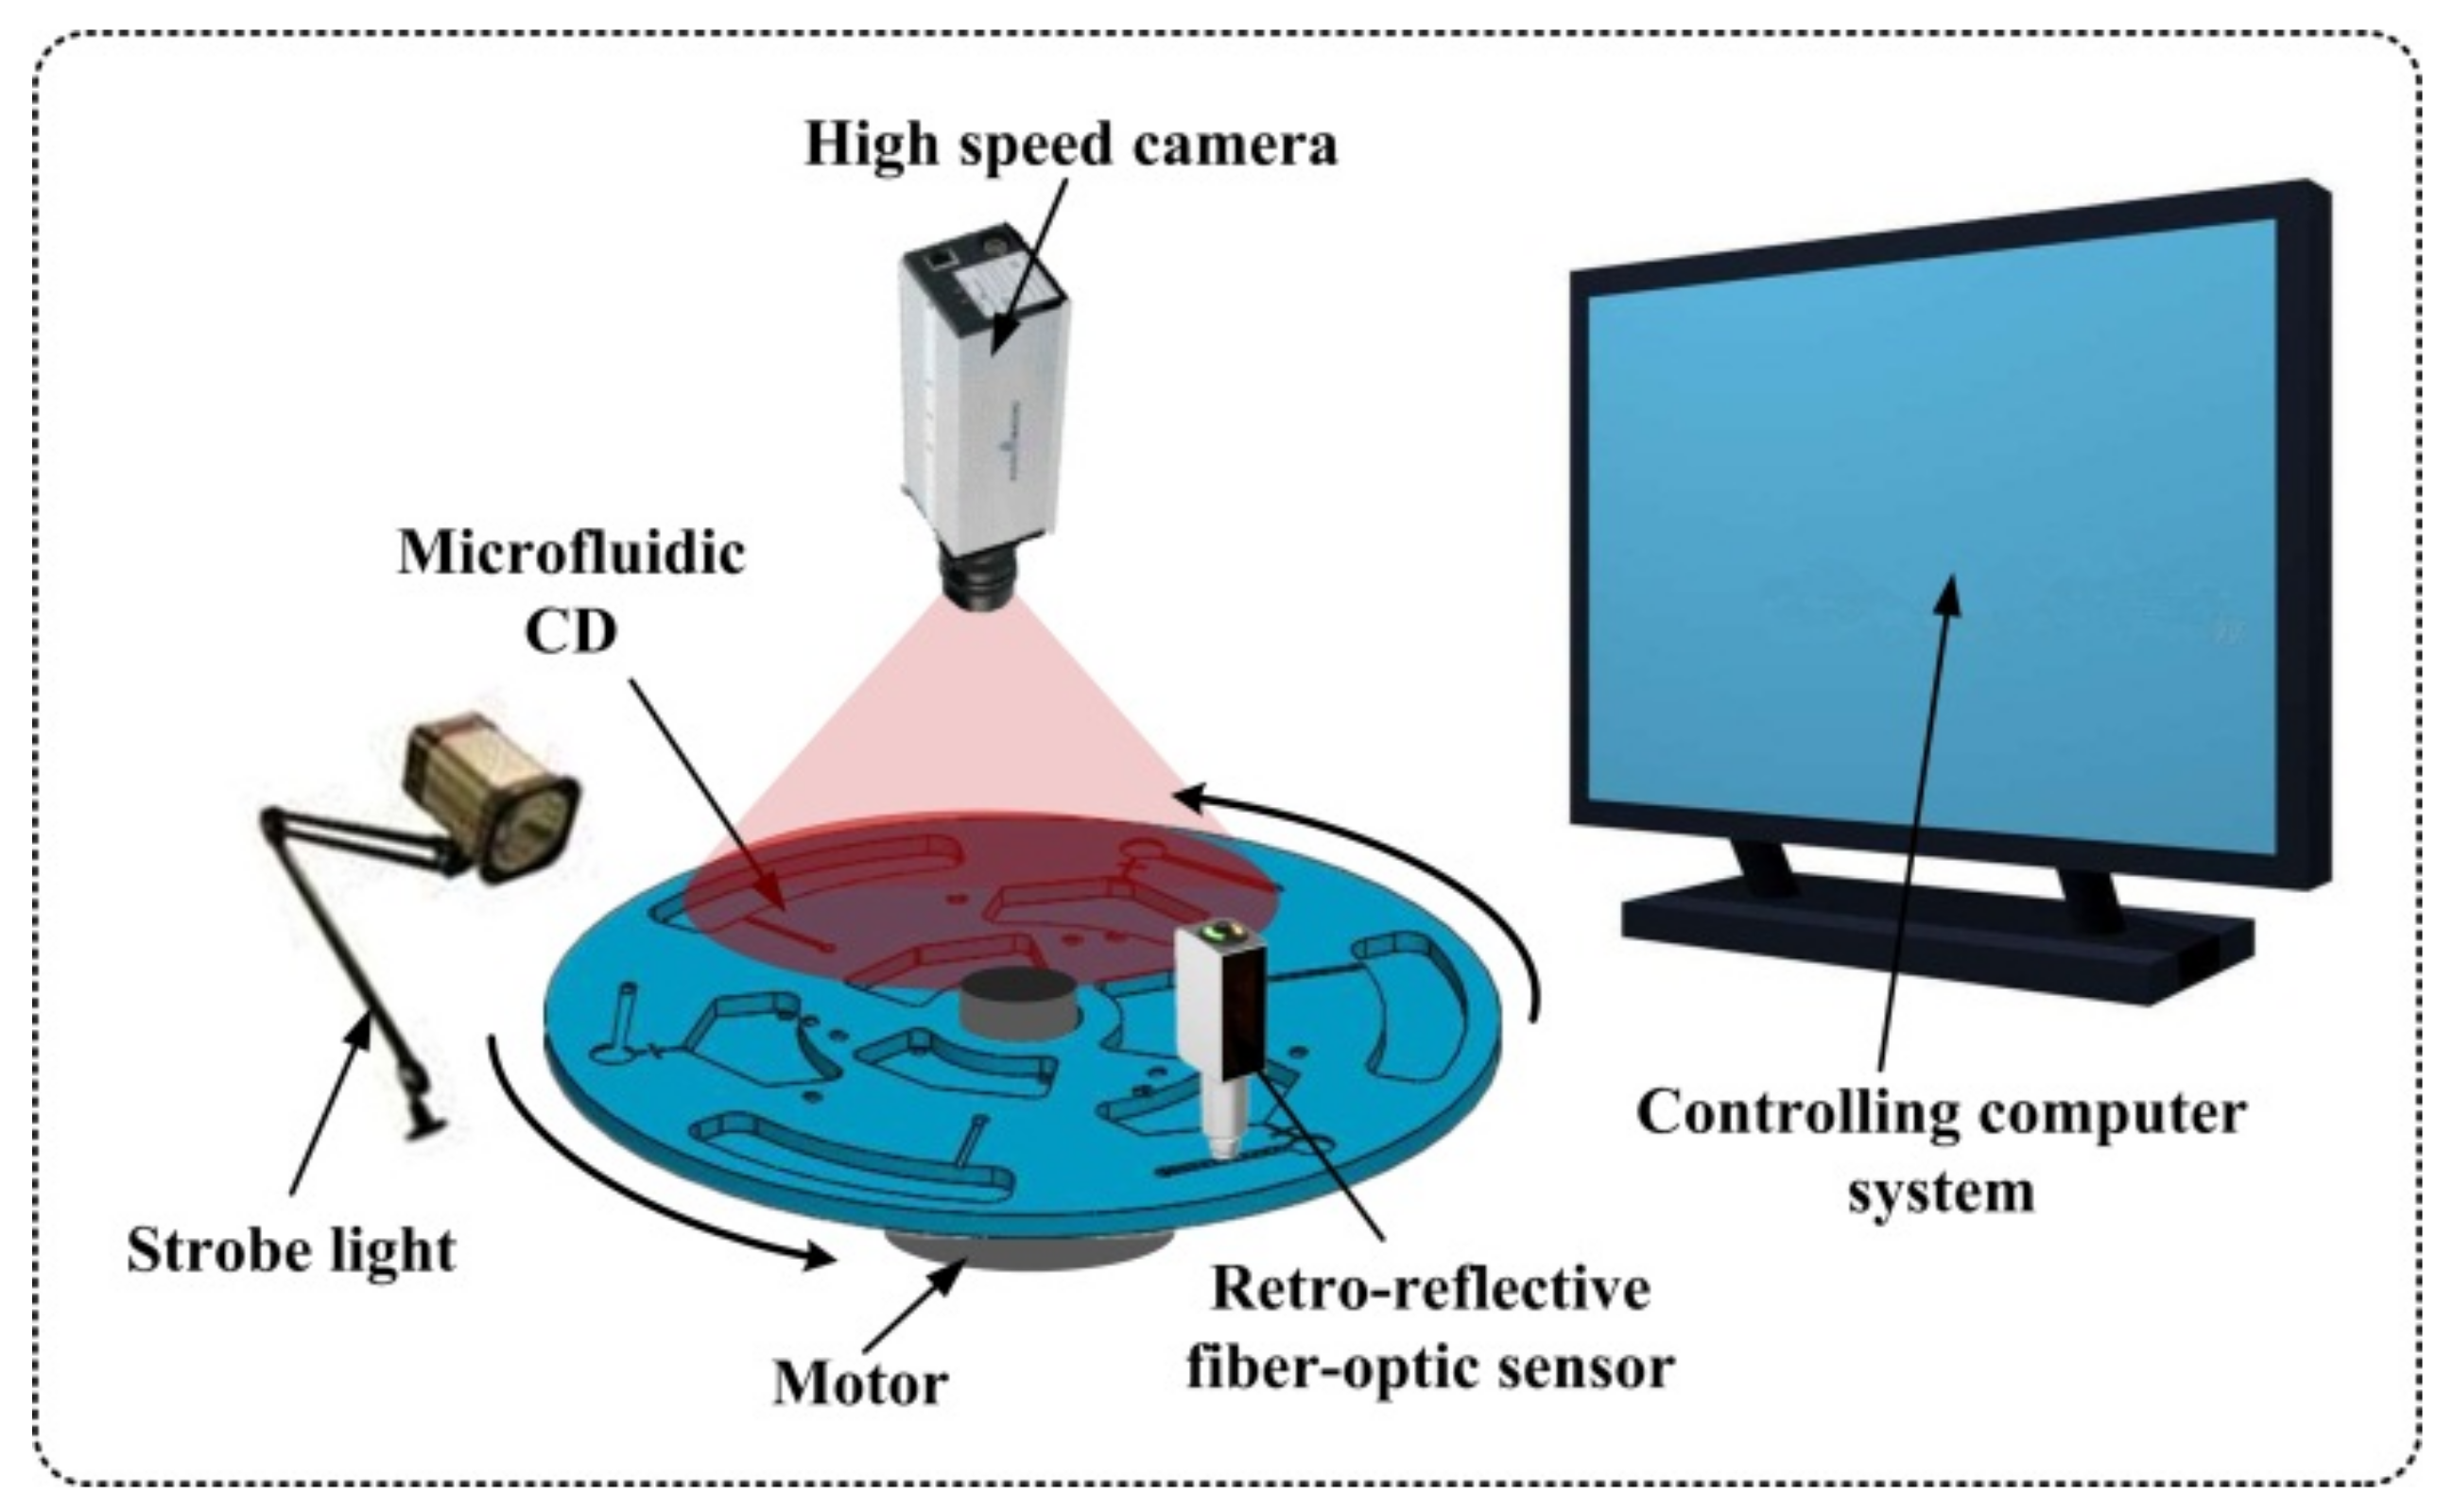
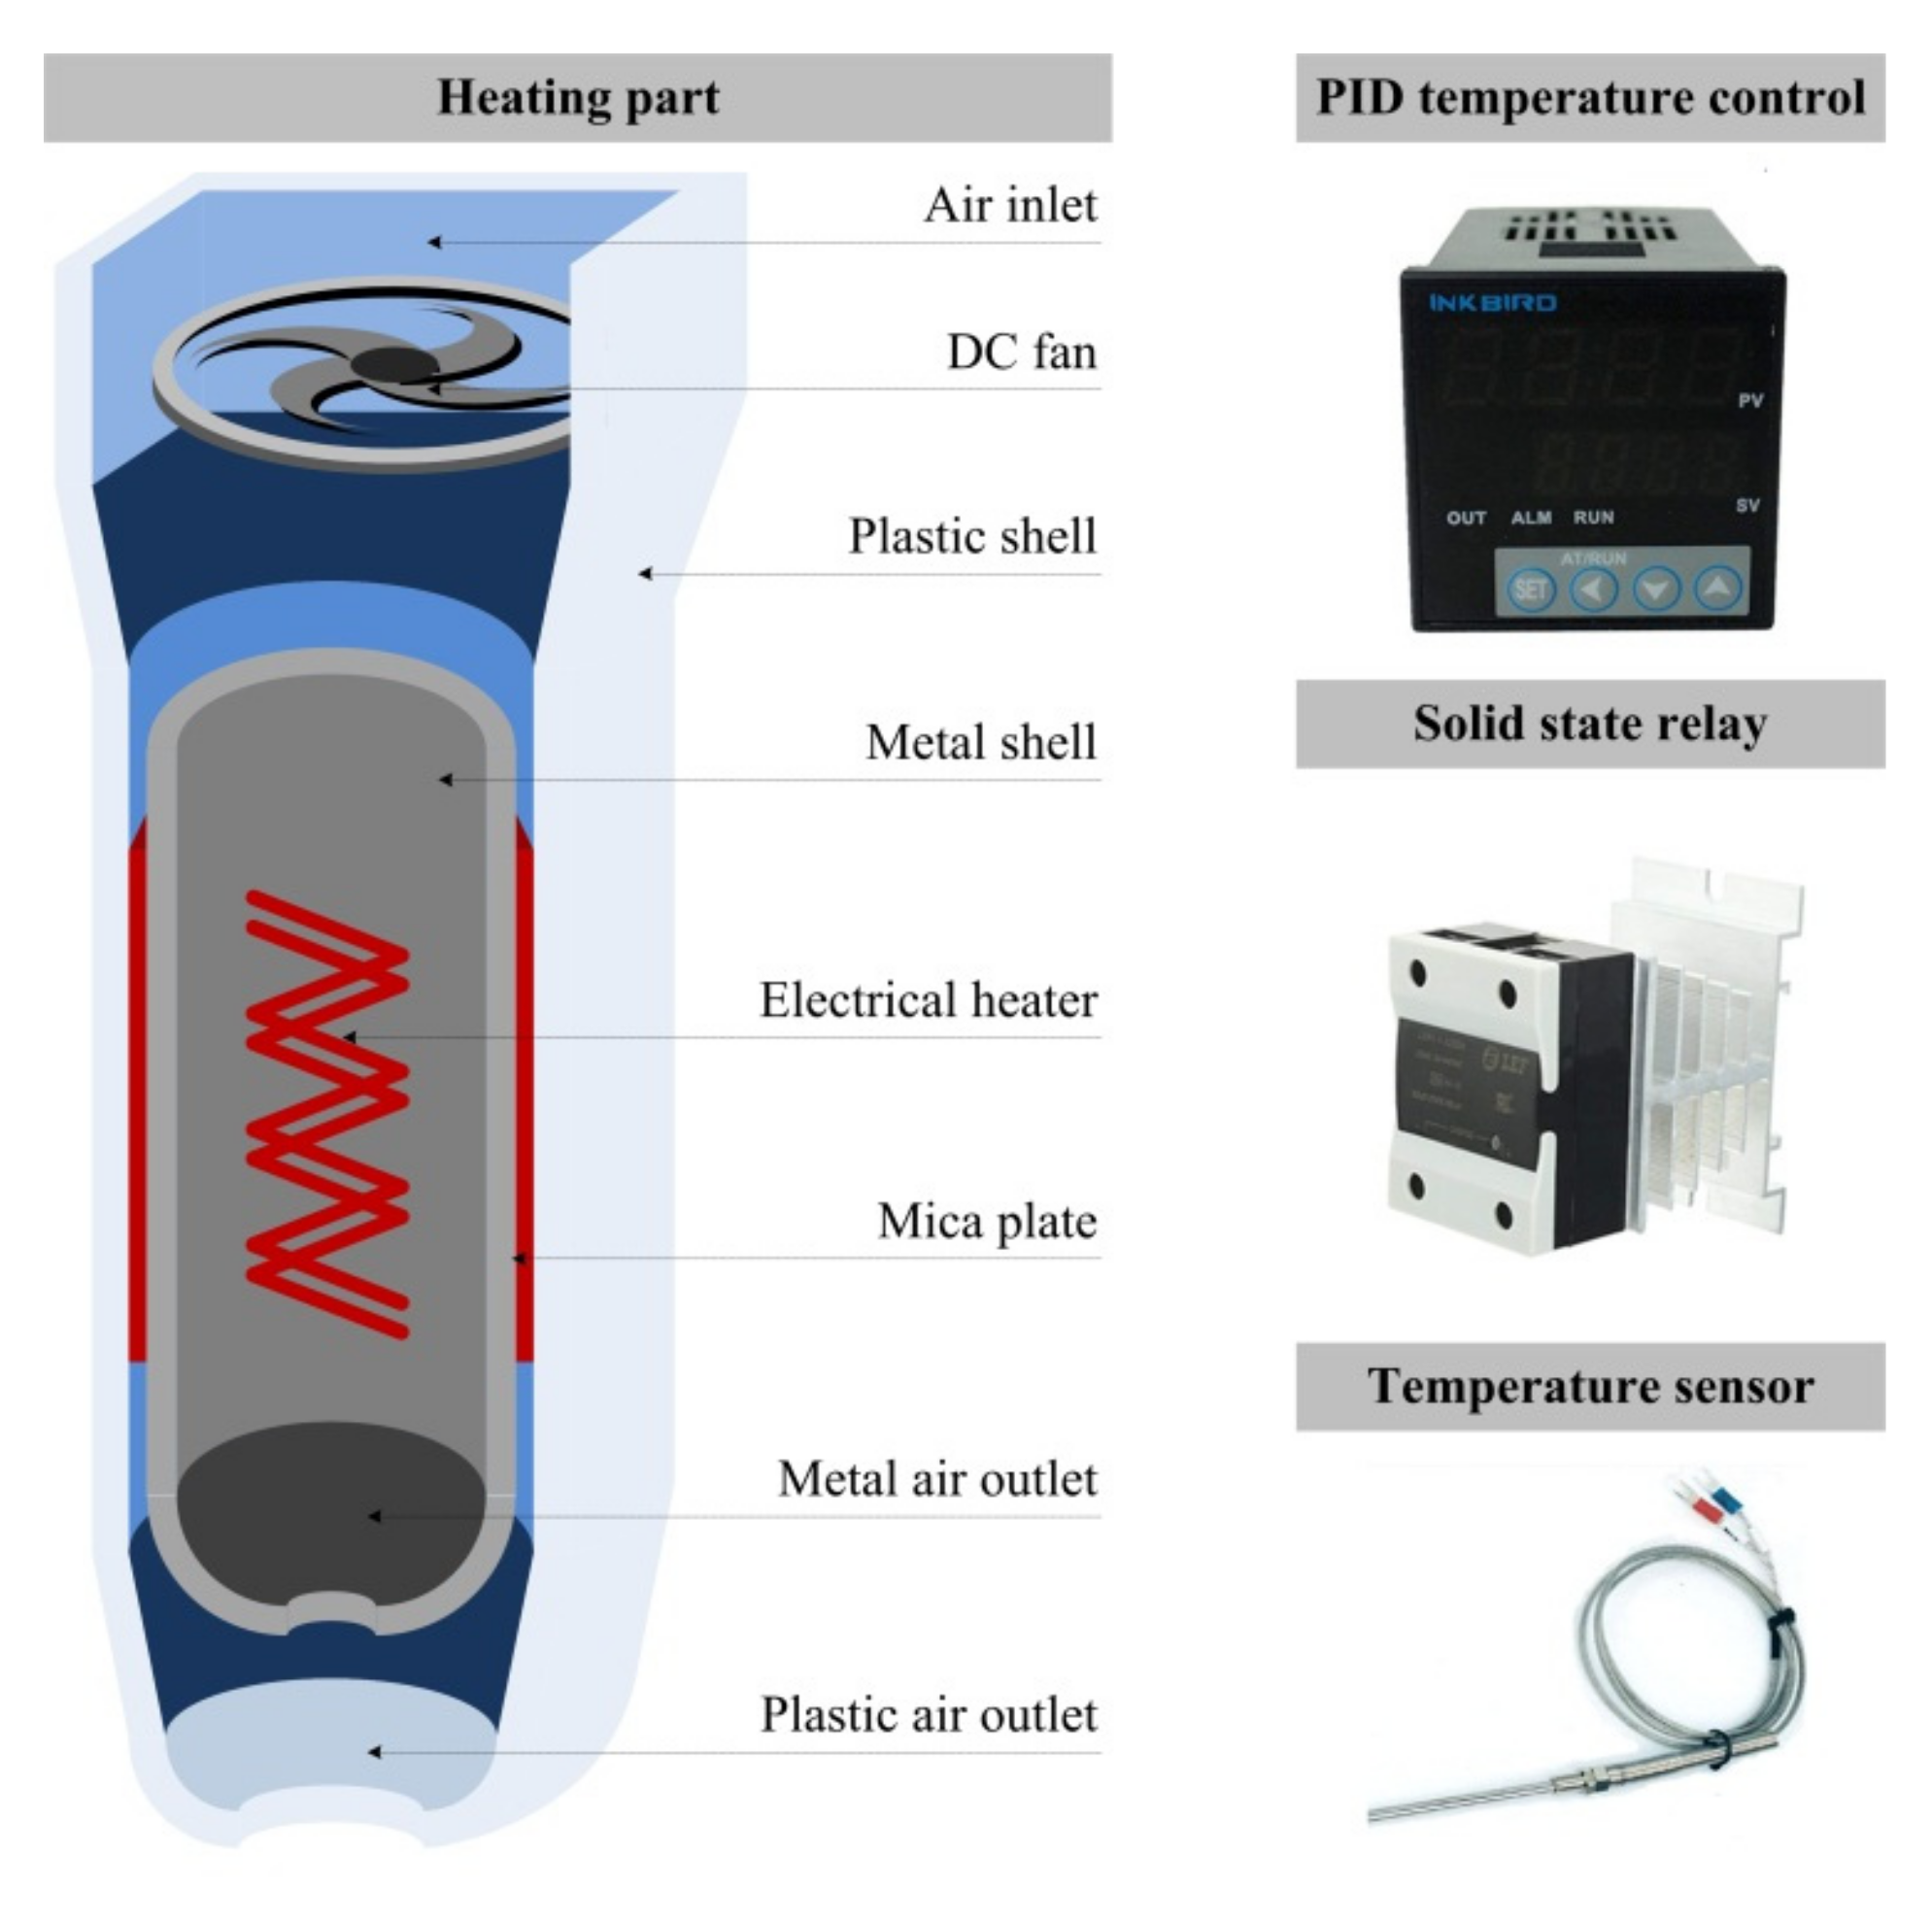
2.3. Experimental Setup
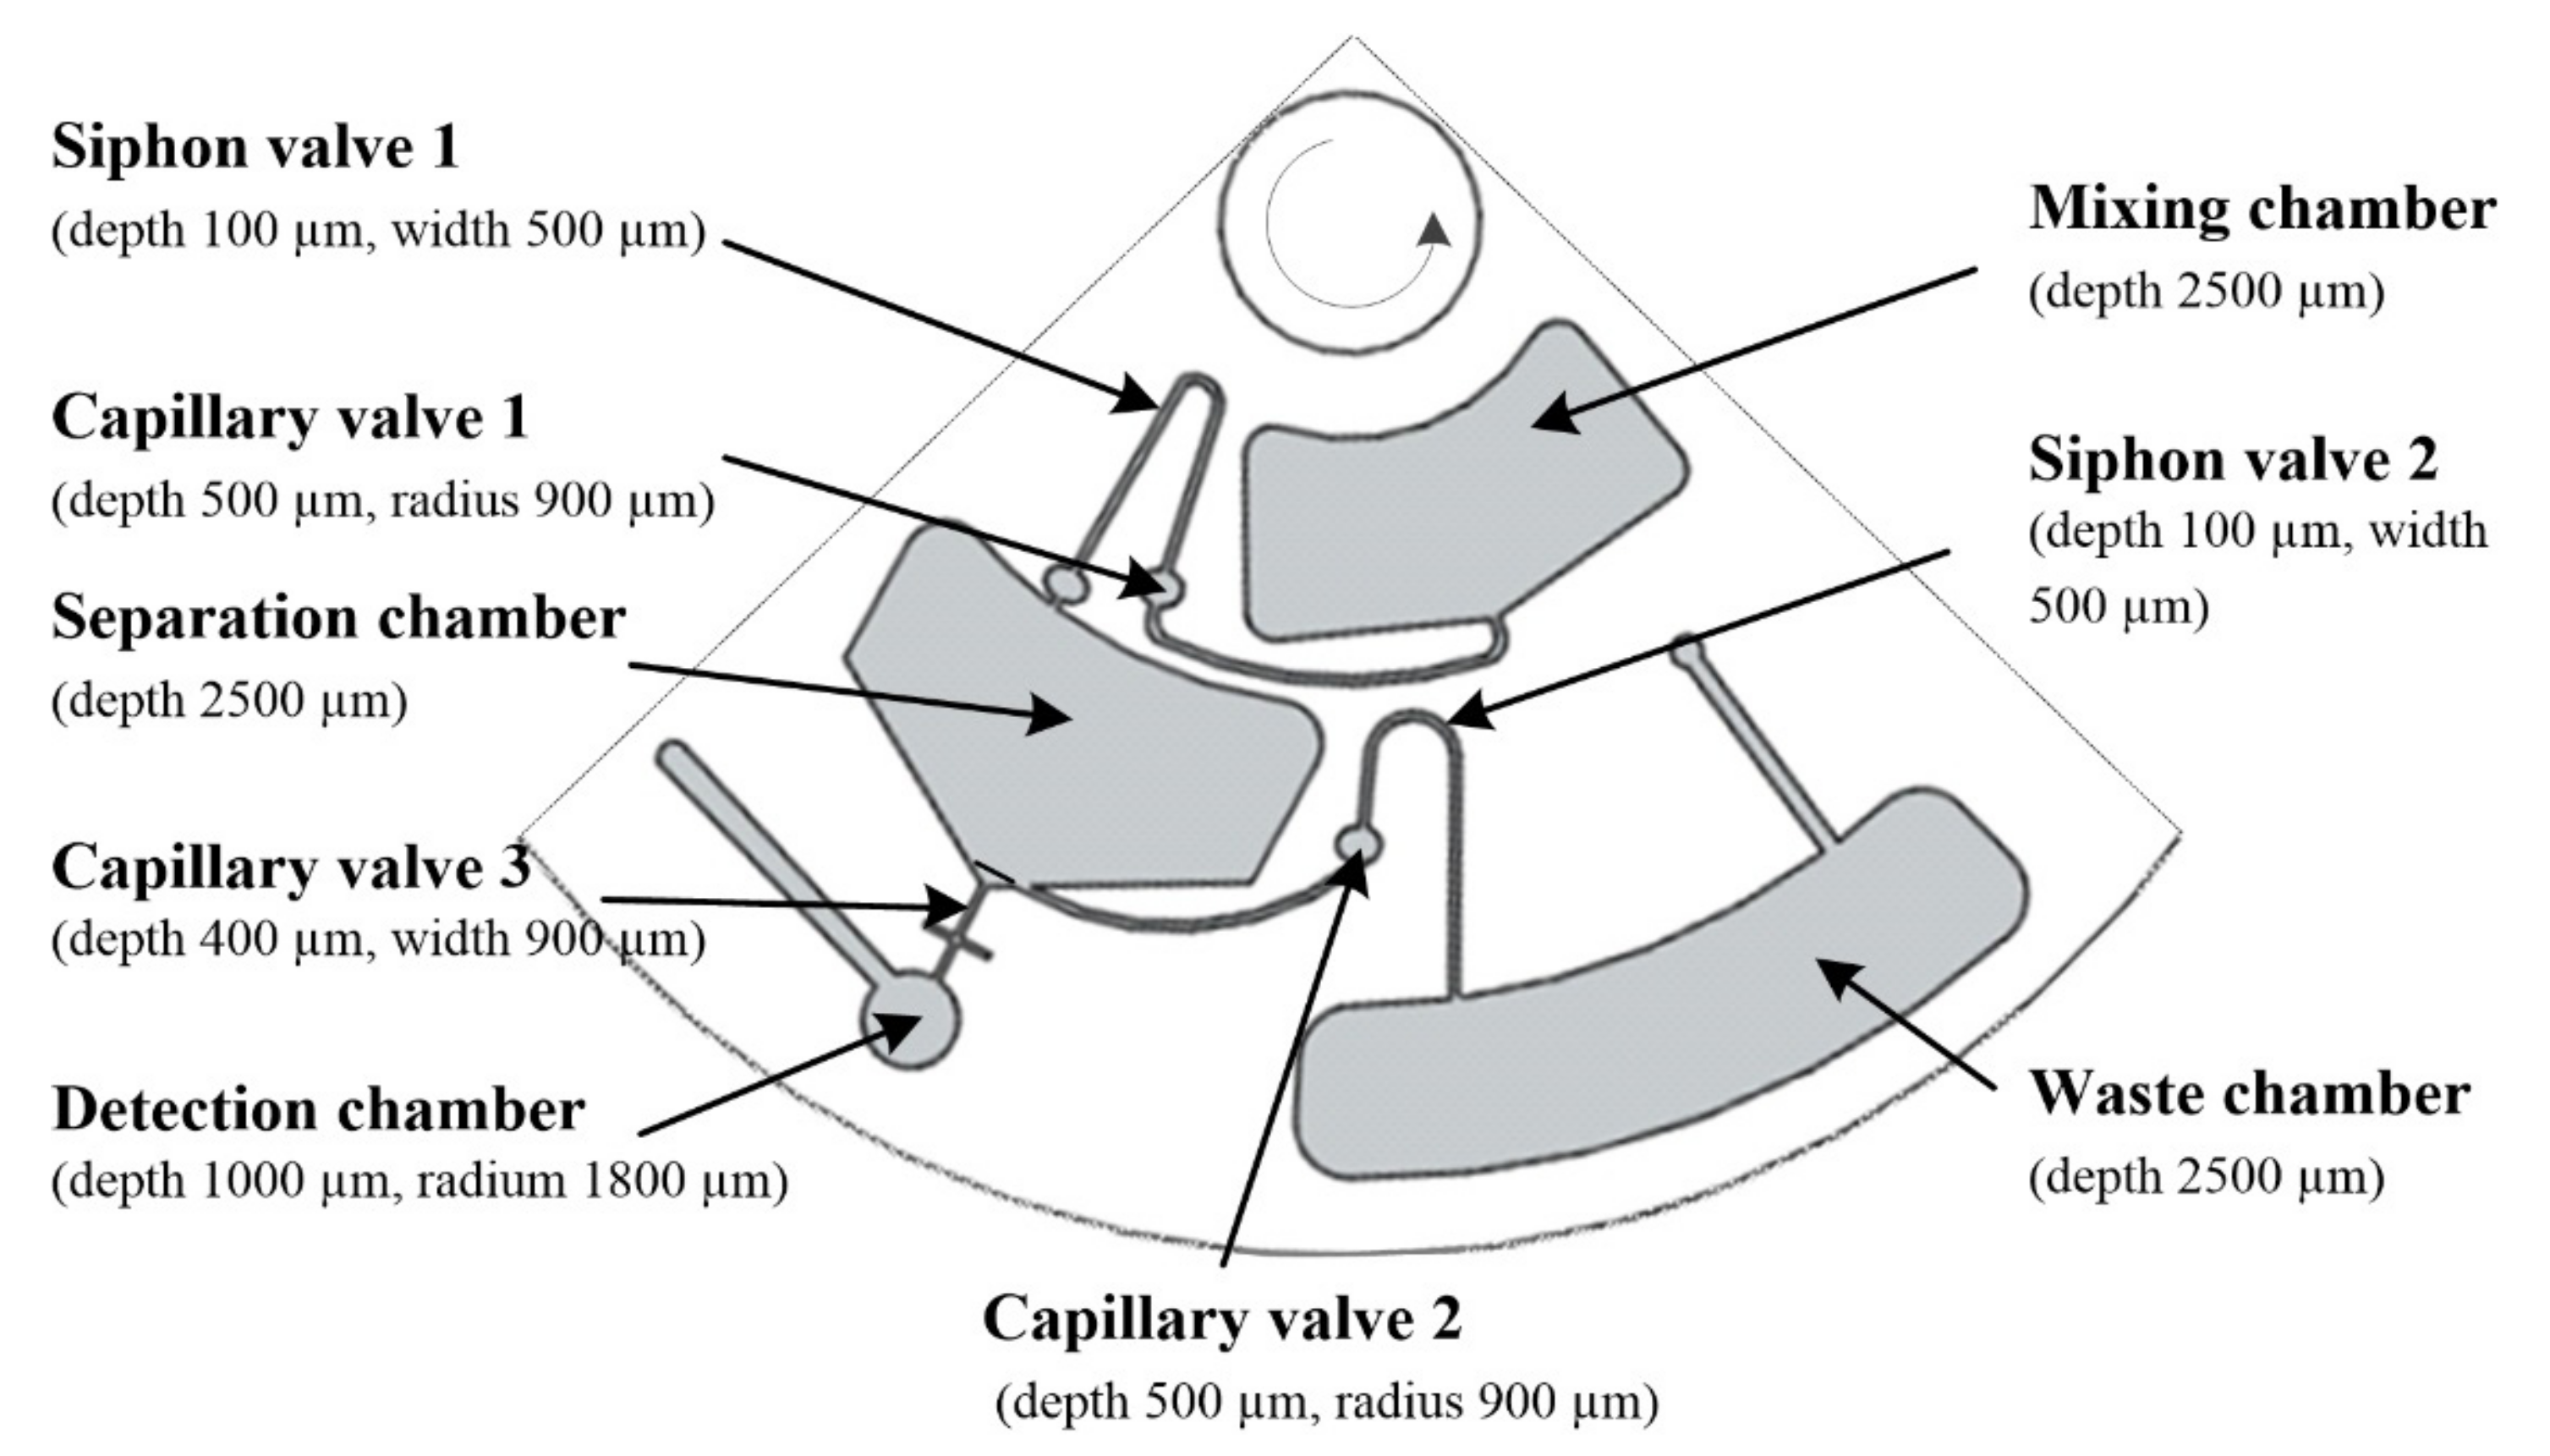
2.4. Disc Design
3. Results and Discussion
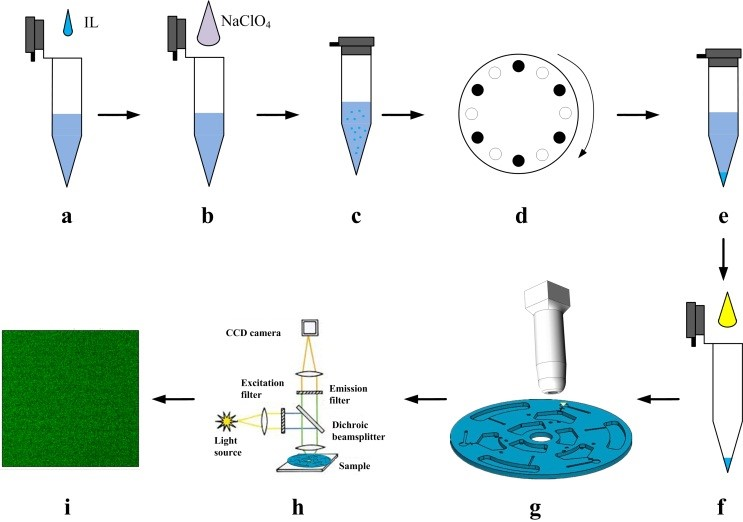
3.1. Salt-controlled Ionic Liquid Dispersive Liquid-liquid Microextraction (SC-IL-DLLME) Dye Solution
3.2. Salt-controlled Ionic Liquid Dispersive Liquid-liquid Microextraction Fluorescence Detection (SC-IL-DLLME-FD) Method for Mercury Analysis
4. Conclusions
Supplementary Materials
Author Contributions
Funding
Acknowledgments
Conflicts of Interest
References
- Leopold, K.; Foulkes, M.; Worsfold, P. Methods for the determination and speciation of mercury in natural waters-A review. Anal. Chim. Acta 2010, 663, 127–138. [Google Scholar] [CrossRef] [PubMed]
- U.S. Environmental Protection Agency, US EPA. Available online: http://www.epa.gov (accessed on 7 July 2019).
- Liu, Y.-M.; Zhang, F.-P.; Jiao, B.-Y.; Rao, J.-Y.; Leng, G. Automated dispersive liquid-liquid microextraction coupled to high performance liquid chromatography-cold vapor atomic fluorescence spectroscopy for the determination of mercury species in natural water samples. J. Chromatogr. A 2017, 1493, 1–9. [Google Scholar] [CrossRef] [PubMed]
- Zhang, R.; Peng, M.; Zheng, C.; Xu, K.; Hou, X. Application of flow injection-green chemical vapor generation-atomic fluorescence spectrometry to ultrasensitive mercury speciation analysis of water and biological samples. Microchem. J. 2016, 127, 62–67. [Google Scholar] [CrossRef]
- Zhu, S.; Chen, B.; He, M.; Huang, T.; Hu, B. Speciation of mercury in water and fish samples by HPLC-ICP-MS after magnetic solid phase extraction. Talanta 2017, 171, 213–219. [Google Scholar] [CrossRef] [PubMed]
- Stanisz, E.; Werner, J.; Zgoła-Grześkowiak, A. Liquid-phase microextraction techniques based on ionic liquids for preconcentration and determination of metals. TrAC Trends Anal. Chem. 2014, 61, 54–66. [Google Scholar] [CrossRef]
- Li, Z.; Xia, S.; Wang, J.; Bian, C.; Tong, J. Determination of trace mercury in water based on N-octylpyridinium ionic liquids preconcentration and stripping voltammetry. J. Hazard. Mater. 2016, 301, 206–213. [Google Scholar] [CrossRef] [PubMed]
- Ferreira, S.L.C.; Lemos, V.A.; Silva, L.O.B.; Queiroz, A.F.S.; Souza, A.S.; Da Silva, E.G.P.; Dos Santos, W.N.L.; Das Virgens, C.F. Analytical strategies of sample preparation for the determination of mercury in food matrices—A review. Microchem. J. 2015, 121, 227–236. [Google Scholar] [CrossRef]
- Sajid, M. Dispersive liquid-liquid microextraction coupled with derivatization: A review of different modes, applications, and green aspects. TrAC Trends Anal. Chem. 2018, 106, 169–182. [Google Scholar] [CrossRef]
- El-Shahawi, M.S.; Al-Saidi, H.M. Dispersive liquid-liquid microextraction for chemical speciation and determination of ultra-trace concentrations of metal ions. TrAC Trends Anal. Chem. 2013, 44, 12–24. [Google Scholar] [CrossRef]
- Ventura, S.P.M.; E Silva, F.A.; Quental, M.V.; Mondal, D.; Freire, M.G.; Coutinho, J.A.P. Ionic-liquid-mediated extraction and separation processes for bioactive compounds: past, present, and future trends. Chem. Rev. 2017, 117, 6984–7052. [Google Scholar] [CrossRef]
- Hui, Y.; Xiong, C.; Bian, C.; Gui, S.; Tong, J.; Li, Y.; Gao, C.; Huang, Y.; Tang, W.C.; Xia, S. Temperature-controlled ionic liquid dispersive liquid-liquid microextraction combined with fluorescence detection of ultra-trace Hg2+ in water. Anal. Methods 2019, 11, 2669–2676. [Google Scholar] [CrossRef]
- Gorkin, R.; Park, J.; Siegrist, J.; Amasia, M.; Lee, B.S.; Park, J.M.; Kim, J.; Kim, H.; Madou, M.; Cho, Y.K. Centrifugal microfluidics for biomedical applications. Lab Chip 2010, 10, 1758–1773. [Google Scholar] [CrossRef] [PubMed]
- Pi, H.; Tong, J.; Bian, C.; Xia, S. 3D printed micro/nanofluidic preconcentrator for charged sample based on ion concentration polarization. J. Micromech. Microeng. 2017, 27, 055008. [Google Scholar] [CrossRef]
- Strohmeier, O.; Keller, M.; Schwemmer, F.; Zehnle, S.; Mark, D.; Von Stetten, F.; Zengerle, R.; Paust, N. Centrifugal microfluidic platforms: advanced unit operations and applications. Chem. Soc. Rev. 2015, 44, 6187–6229. [Google Scholar] [CrossRef] [PubMed]
- Burger, R.; Amato, L.; Boisen, A. Detection methods for centrifugal microfluidic platforms. Biosens. Bioelectron. 2016, 76, 54–67. [Google Scholar] [CrossRef] [PubMed]
- Kong, L.X.; Perebikovsky, A.; Moebius, J.; Kulinsky, L.; Madou, M. Lab-on-a-CD: A fully integrated molecular diagnostic system. J. Lab Autom. 2016, 21, 323–355. [Google Scholar] [CrossRef] [PubMed]
- Vázquez, M.; Brabazon, D.; Shang, F.; Omamogho, J.O.; Glennon, J.D.; Paull, B. Centrifugally-driven sample extraction, preconcentration and purification in microfluidic compact discs. TrAC Trends Anal. Chem. 2011, 30, 1575–1586. [Google Scholar] [CrossRef]
- Kazarine, A.; Kong, M.C.R.; Templeton, E.J.; Salin, E.D. Automated liquid-liquid extraction by pneumatic recirculation on a centrifugal microfluidic platform. Anal. Chem. 2012, 84, 6939–6943. [Google Scholar] [CrossRef]
- Morelli, L.; Serioli, L.; Centorbi, F.A.; Jendresen, C.B.; Matteucci, M.; Ilchenko, O.; Demarchi, D.; Nielsen, A.T.; Zór, K.; Boisen, A. Injection molded lab-on-a-disc platform for screening of genetically modified: E. coli using liquid-liquid extraction and surface enhanced Raman scattering. Lab Chip 2018, 18, 869–877. [Google Scholar] [CrossRef]
- Li, Z.; Xia, S.; Bian, C.; Tong, J. Salt induced ionic liquid dispersive liquid-liquid microextraction and filter separation. Anal. Methods 2016, 8, 1096–1102. [Google Scholar] [CrossRef]
- LaCroix-Fralish, A.; Templeton, E.J.; Salin, E.D.; Skinner, C.D. A rapid prototyping technique for valves and filters in centrifugal microfluidic devices. Lab Chip 2009, 9, 3151–3154. [Google Scholar] [CrossRef] [PubMed]
- Lingxuan, K. Fully Integrated Molecular Diagnostic CD Platform Based on Thermal Control. Ph.D. Thesis, University of California, Irvine, CA, USA, 2015. [Google Scholar]
- Amasia, M.; Madou, M. Large-volume centrifugal microfluidic device for blood plasma separation. Bioanalysis 2010, 2, 1701–1710. [Google Scholar] [CrossRef] [PubMed]
- Currie, L.A. Nomenclature in evaluation of analytical methods including detection and quantification capabilities (IUPAC Recommendations 1995). Pure Appl. Chem. 1995, 67, 1699–1723. [Google Scholar] [CrossRef]


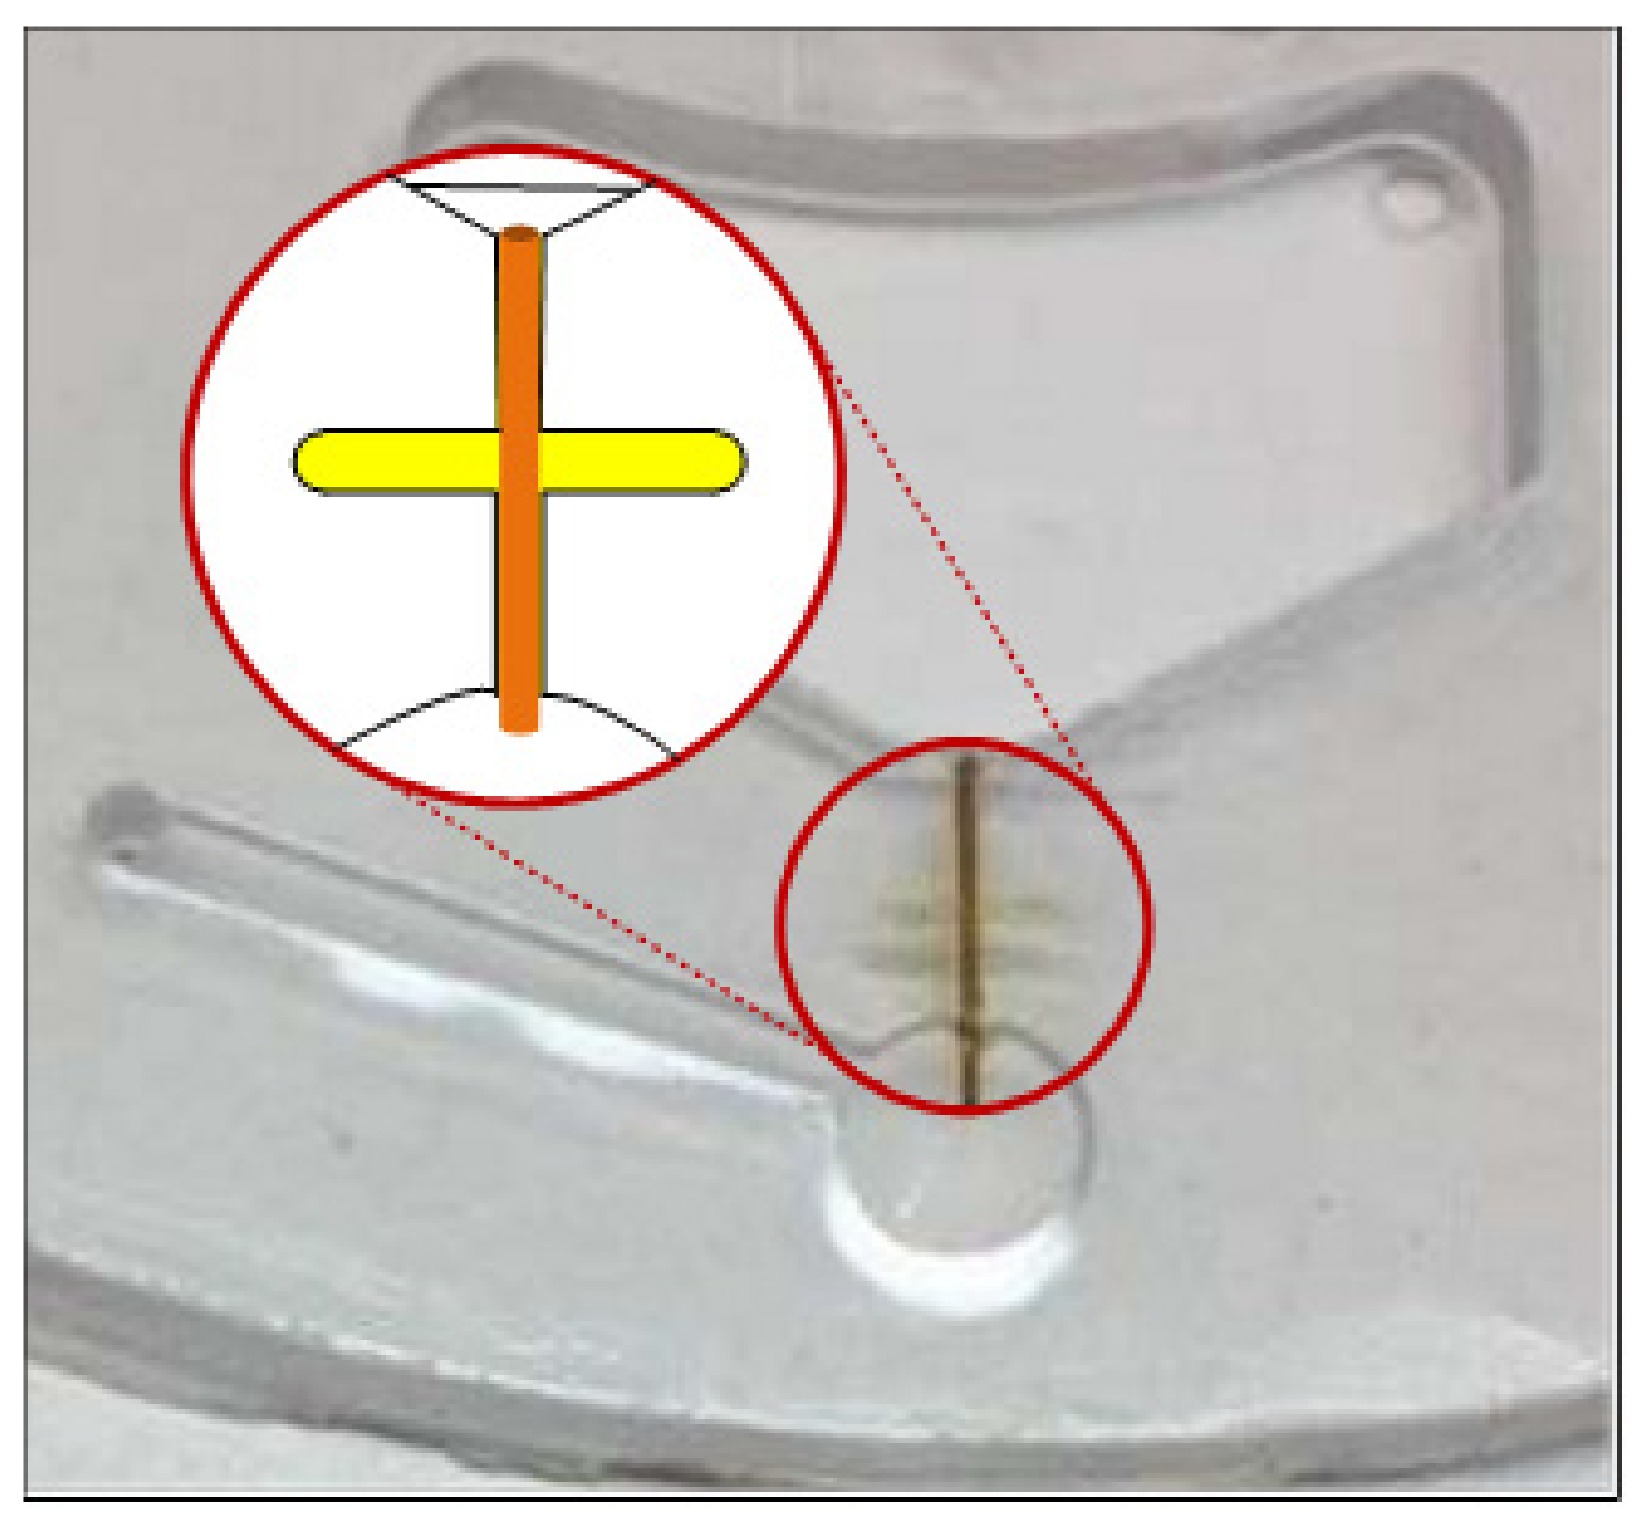
| Inner Diameter | 24 μm | 51 μm | 74 μm |
|---|---|---|---|
| Burst Frequency | 2800~3500 RPM | 1400~1800 RPM | 800~1000 RPM |
| Analytical Performance | Lab on the Disc 1 |
|---|---|
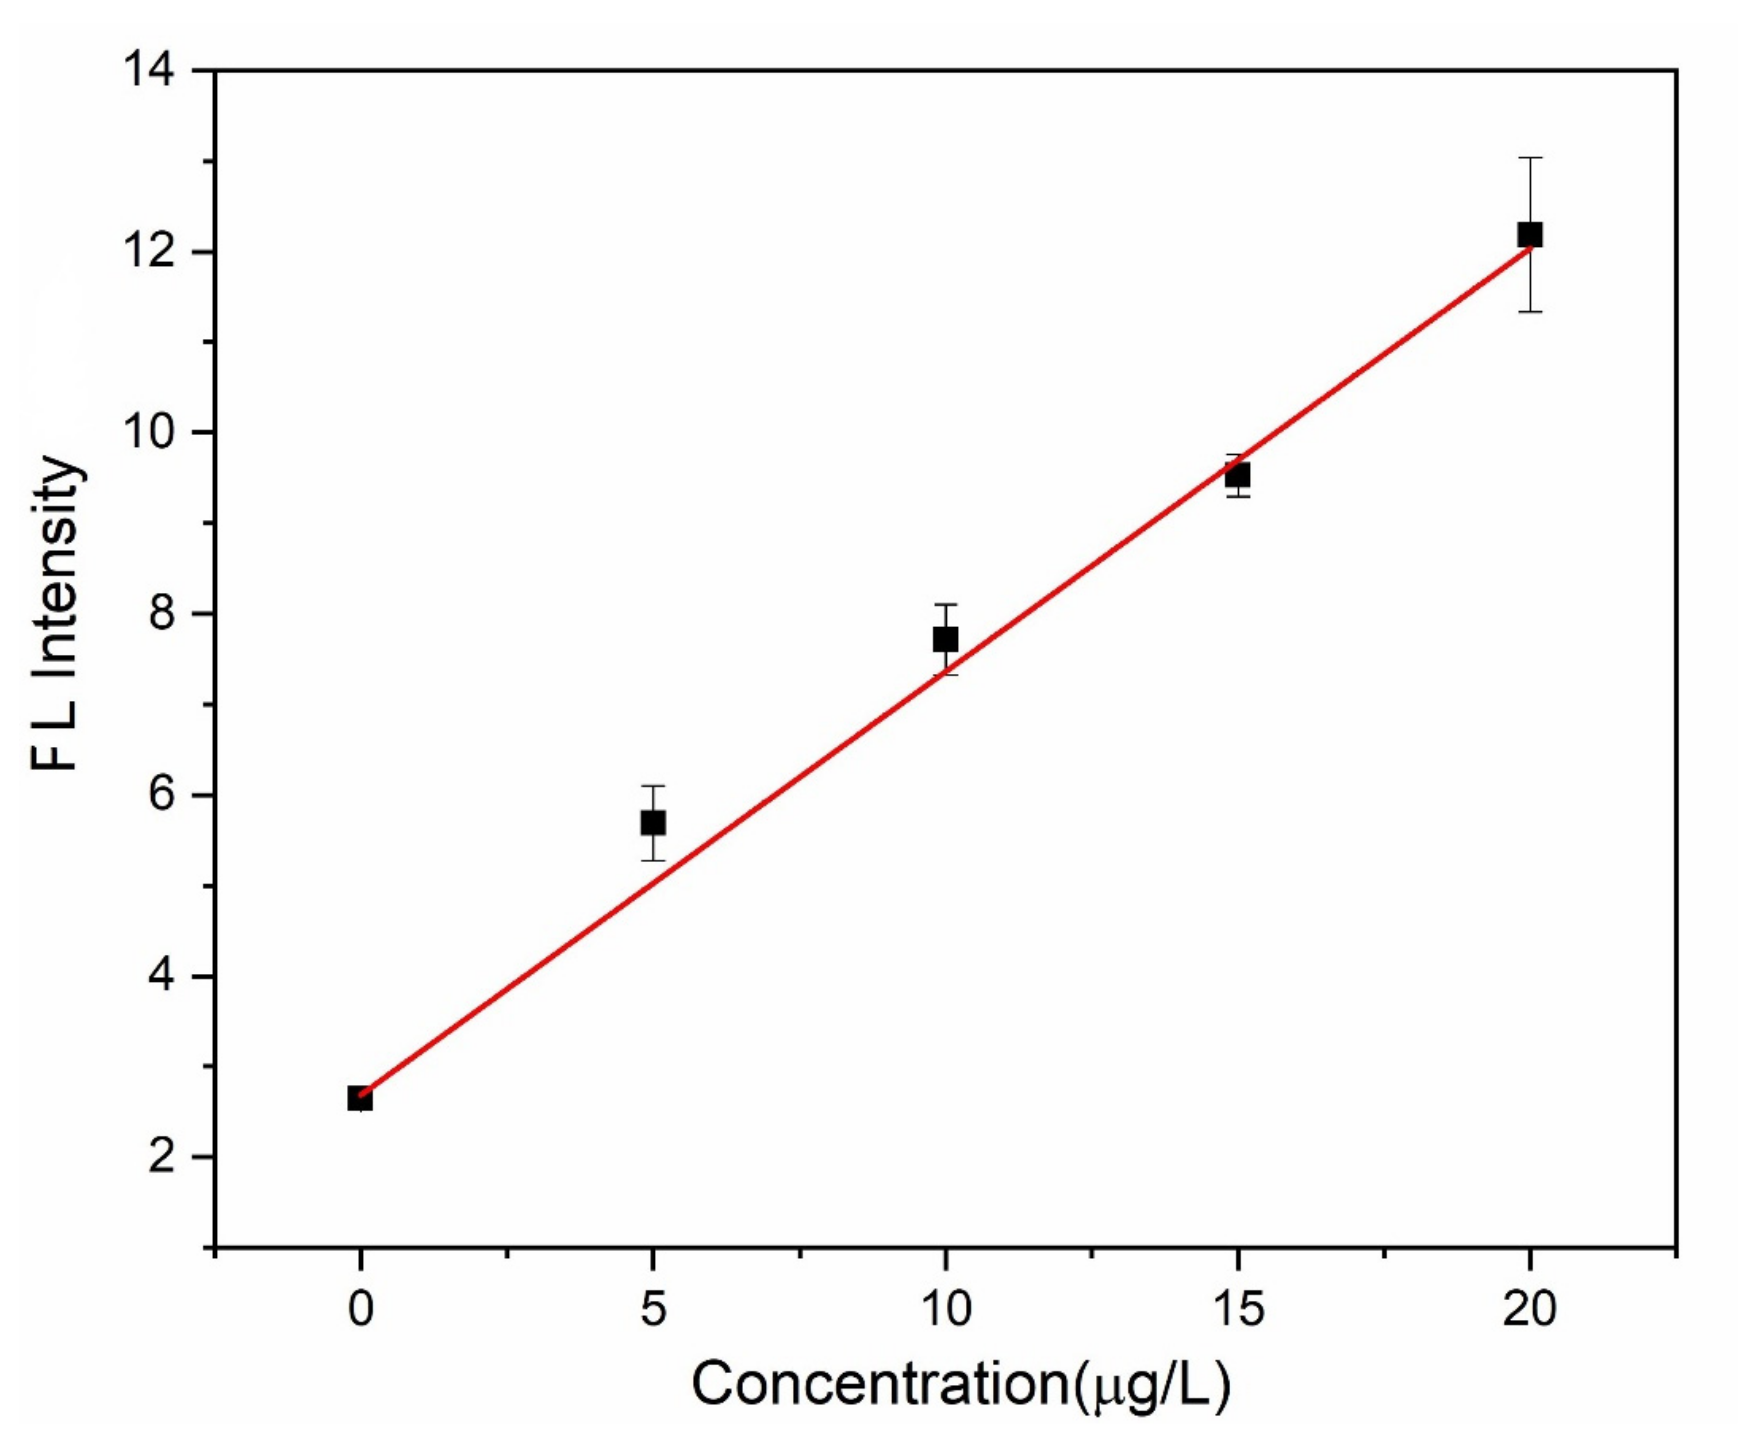
| Slope | 0.46751 ± 0.018 |
| Intercept | 2.68511 ± 0.133 |
| Linear range | 0~20 μg∙L–1 |
| R2 | 0.9953 |
| LOD (S/N = 3) | 0.753 μg∙L–1 |
© 2019 by the authors. Licensee MDPI, Basel, Switzerland. This article is an open access article distributed under the terms and conditions of the Creative Commons Attribution (CC BY) license (http://creativecommons.org/licenses/by/4.0/).
Share and Cite
Hui, Y.; Liu, Y.; Tang, W.C.; Song, D.; Madou, M.; Xia, S.; Wu, T. Determination of Mercury(II) on A Centrifugal Microfluidic Device Using Ionic Liquid Dispersive Liquid−Liquid Microextraction. Micromachines 2019, 10, 523. https://doi.org/10.3390/mi10080523
Hui Y, Liu Y, Tang WC, Song D, Madou M, Xia S, Wu T. Determination of Mercury(II) on A Centrifugal Microfluidic Device Using Ionic Liquid Dispersive Liquid−Liquid Microextraction. Micromachines. 2019; 10(8):523. https://doi.org/10.3390/mi10080523
Chicago/Turabian StyleHui, Yun, Yujia Liu, William C. Tang, Dian Song, Marc Madou, Shanhong Xia, and Tianzhun Wu. 2019. "Determination of Mercury(II) on A Centrifugal Microfluidic Device Using Ionic Liquid Dispersive Liquid−Liquid Microextraction" Micromachines 10, no. 8: 523. https://doi.org/10.3390/mi10080523
APA StyleHui, Y., Liu, Y., Tang, W. C., Song, D., Madou, M., Xia, S., & Wu, T. (2019). Determination of Mercury(II) on A Centrifugal Microfluidic Device Using Ionic Liquid Dispersive Liquid−Liquid Microextraction. Micromachines, 10(8), 523. https://doi.org/10.3390/mi10080523