1. Introduction
The device that can convert the applied force into related electrical signals is called a force sensor. It usually works by measuring the displacement or strain of the force sensing element, which is called a flexure [
1]. Force sensors are widely used in a large range of devices and systems, such as transportation, robotics, manufacturing industry, and healthcare technologies. Typical force sensors are usually fabricated with micro-electromechanical systems (MEMS) technology, which has the disadvantages of limited range of functional materials, in addition to being fragile and expensive. There is a growing need for inexpensive and easily customized force sensors where the force information is very important but high-precision measurements are not required [
1].
3D printing, also known as additive manufacturing, is an emerging technology for sensor fabrication with economical, timesaving, geometrically complex and functionally complex advantages. It works by printing multiple layers of material under computer control to create three-dimensional physical objects. In recent years, a considerable amount of research has appeared in the fields of mechanics, electronics, kinematics, optics, acoustics, etc. 3D printing is particularly suitable for the fabrication of force sensing modules and electronic modules of the sensors [
2,
3]. However, in view of this research on 3D printed force sensors, most of it only uses 3D printing technology to fabricate force sensing elements and packages of the sensors, and it is often necessary to use commercial strain gauges [
4,
5,
6] and optical fibers [
1,
7,
8] to realize signal conversion and measurement. The bonding of the strain gauge and the installation of the optical fiber also brings alignment errors and restricted sensors performance [
1,
9]. Moreover, most of this research only uses one kind of 3D printing technology and a single raw material [
10,
11,
12], and these methods are difficult to use to form a composite structure. Although Eijking and Schouten et al. [
13,
14] have used fused deposition manufacturing (FDM) technology to fabricate a series of force sensors with different materials to form a composite structure, the precision of FDM technology is low [
2] and the fabricated sensor structure is rough, making it difficult to fabricate high-precision micro-nano sensors. The use of a single 3D printing technology also limits the application of 3D printed materials.
In view of the above points, a completely 3D printed force sensor with a composite structure based on the combination of digital light processing (DLP) based printing and inkjet printing technologies is proposed in this paper. The DLP based printing can produce complex structures with high precision, and the inkjet printing has advantages featuring maskless, non-contact, and simple process steps compared with screen printing and spin coating [
15,
16,
17]. Theoretical and finite element method (FEM) models were established to analyze the sensor structure. The substrate of the force sensor was made from a transparent high-temperature resin, and the strain gauge was directly inkjet printed on the sensor substrate using poly(3,4-ethylenedioxythiophene) polystyrene sulfonate (PEDOT/PSS) conductive ink. It only took a few hours to fabricate the force sensor with the use of 3D printing technologies. The method mentioned in this paper avoids the bonding of the strain gauge and has timesaving and economical advantages. Finally, experiments were done to characterize the strain gauge and the force sensor.
3. Fabrication of the Force Sensor
The processing of the force sensor mainly consists of two major steps, the fabrication of the sensor substrate and the fabrication of the strain gauge. A PEDOT/PSS conductive ink was used to fabricate the strain gauge. This is because PEDOT/PSS conductive ink has advantages such as high conductivity, good stability [
20], and easy to clean and hard to clog nozzles, and it has piezoresistive properties [
16,
17]. The PEDOT/PSS conductive ink needs to be dried in an air convection oven at 80 °C–130 °C for 15 min to make the PEDOT/PSS functional. However, the ordinary photosensitive resin cannot meet the needs of this process due to the low heat deflection temperature. Therefore, a transparent high-temperature resin with a 289 °C heat deflection temperature from Formlabs (Somerville, MA, USA) was used to fabricate the sensor substrate.
3.1. Fabrication and Characterization of the Sensor Substrate
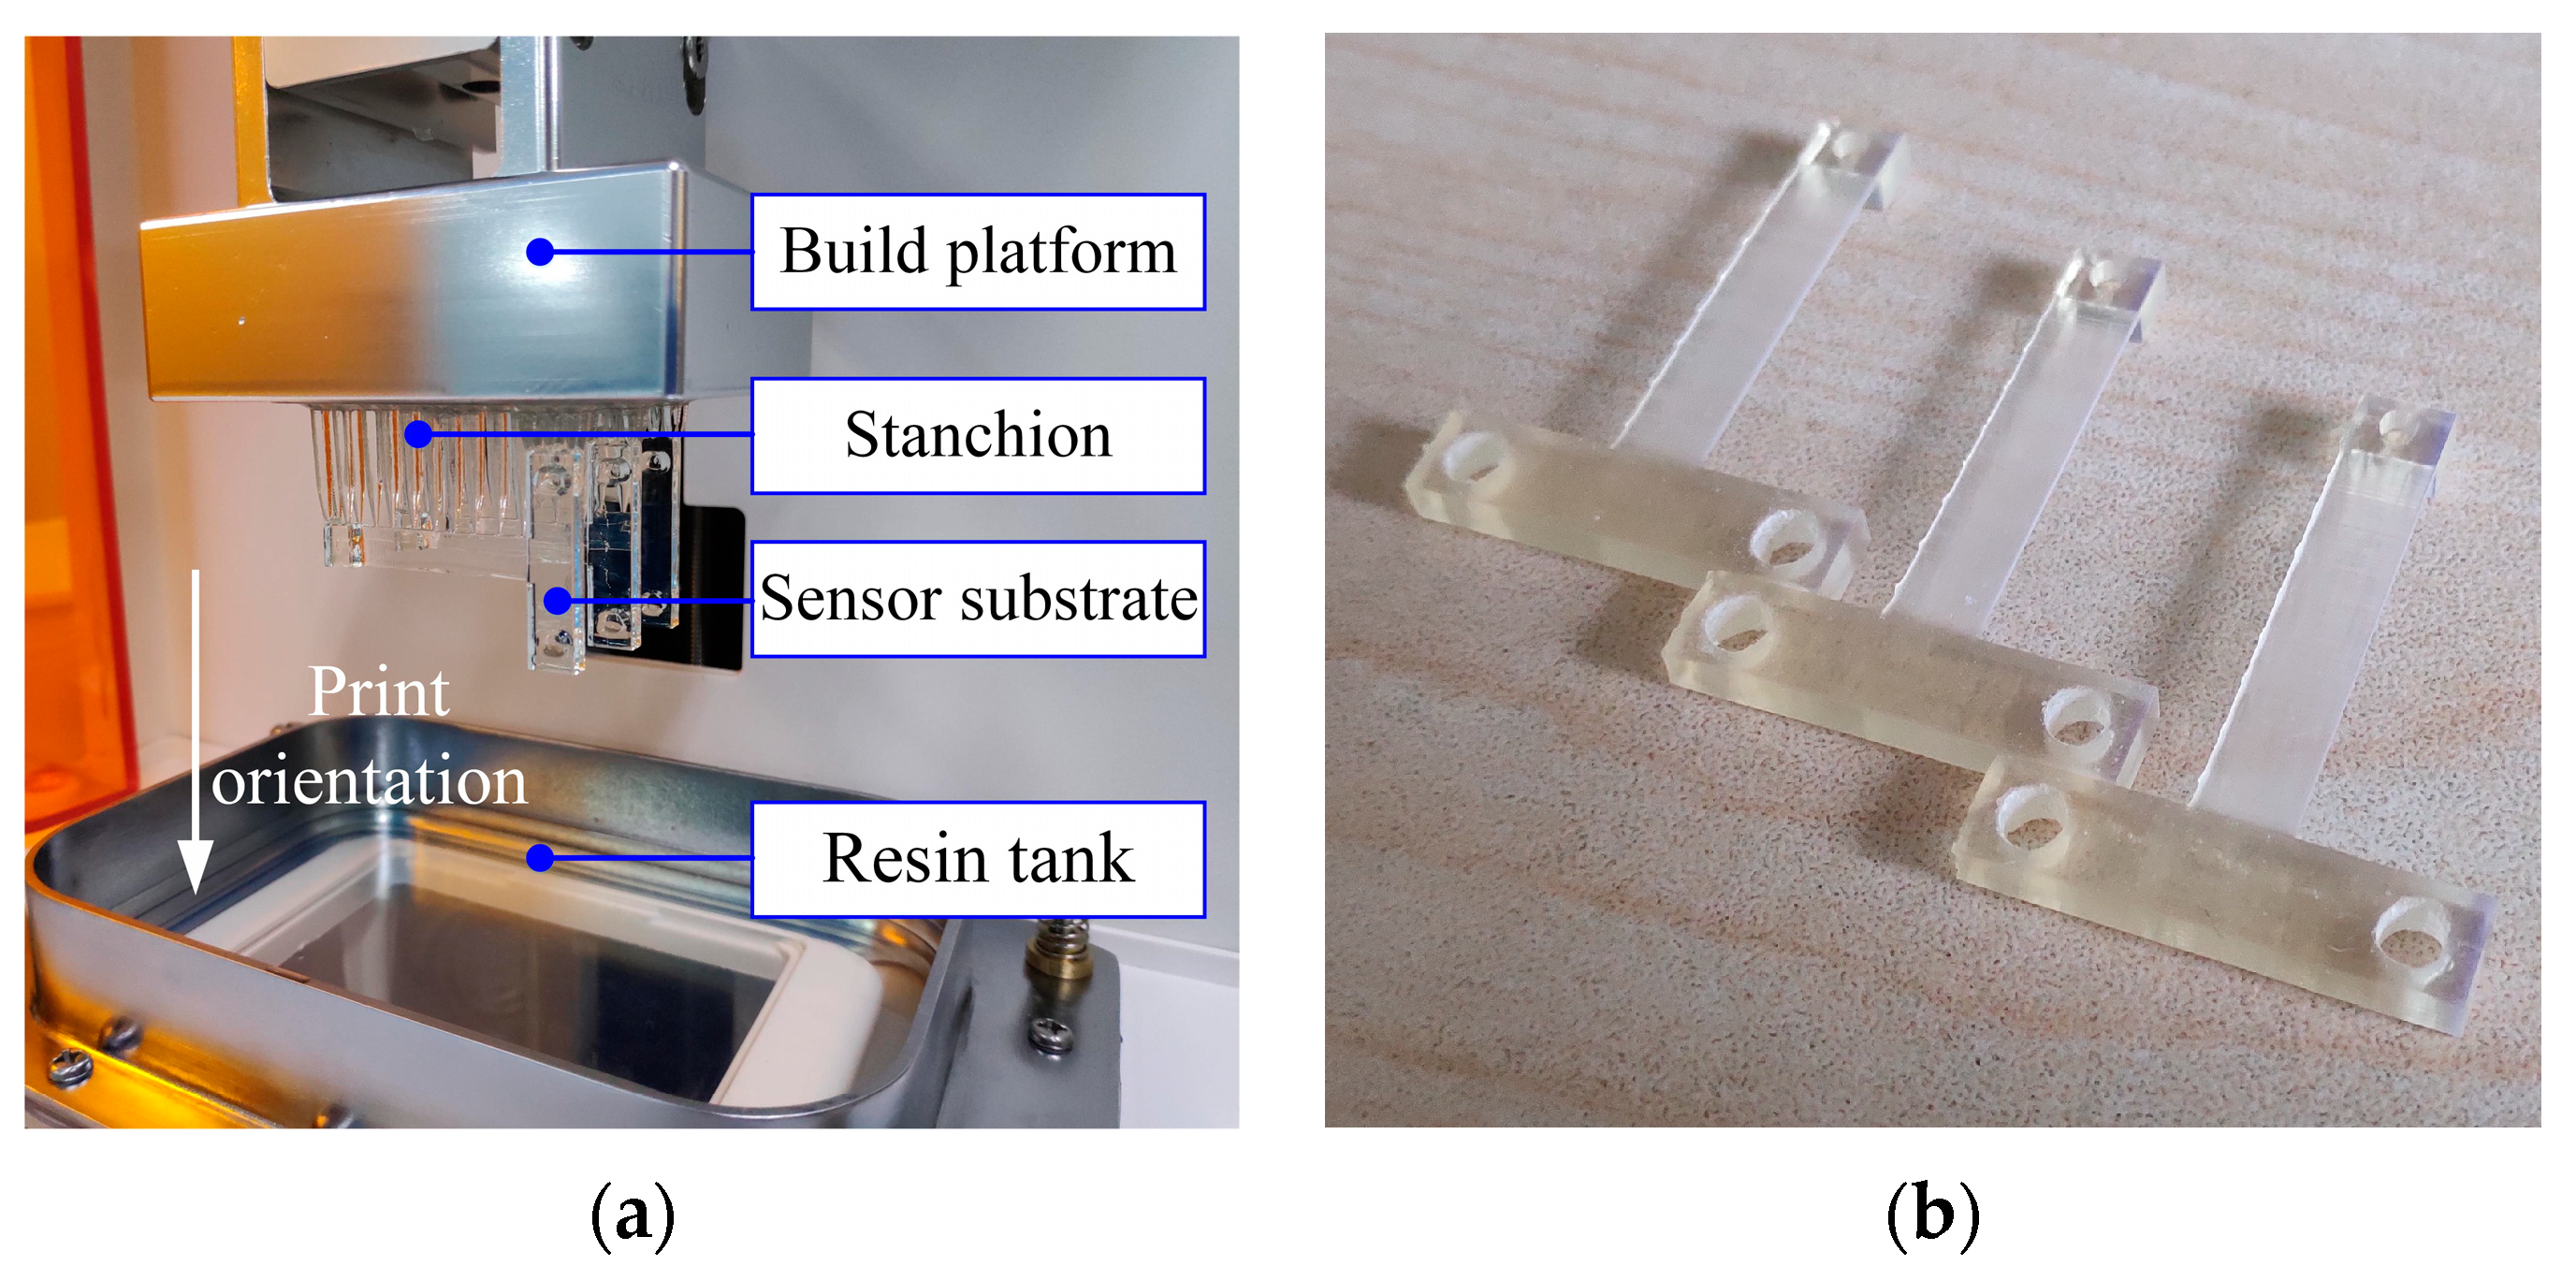
The substrate of the force sensor was printed by M-Jewelry U50 printer from MAKEX (Makex CO., LTD., Ningbo, China) [
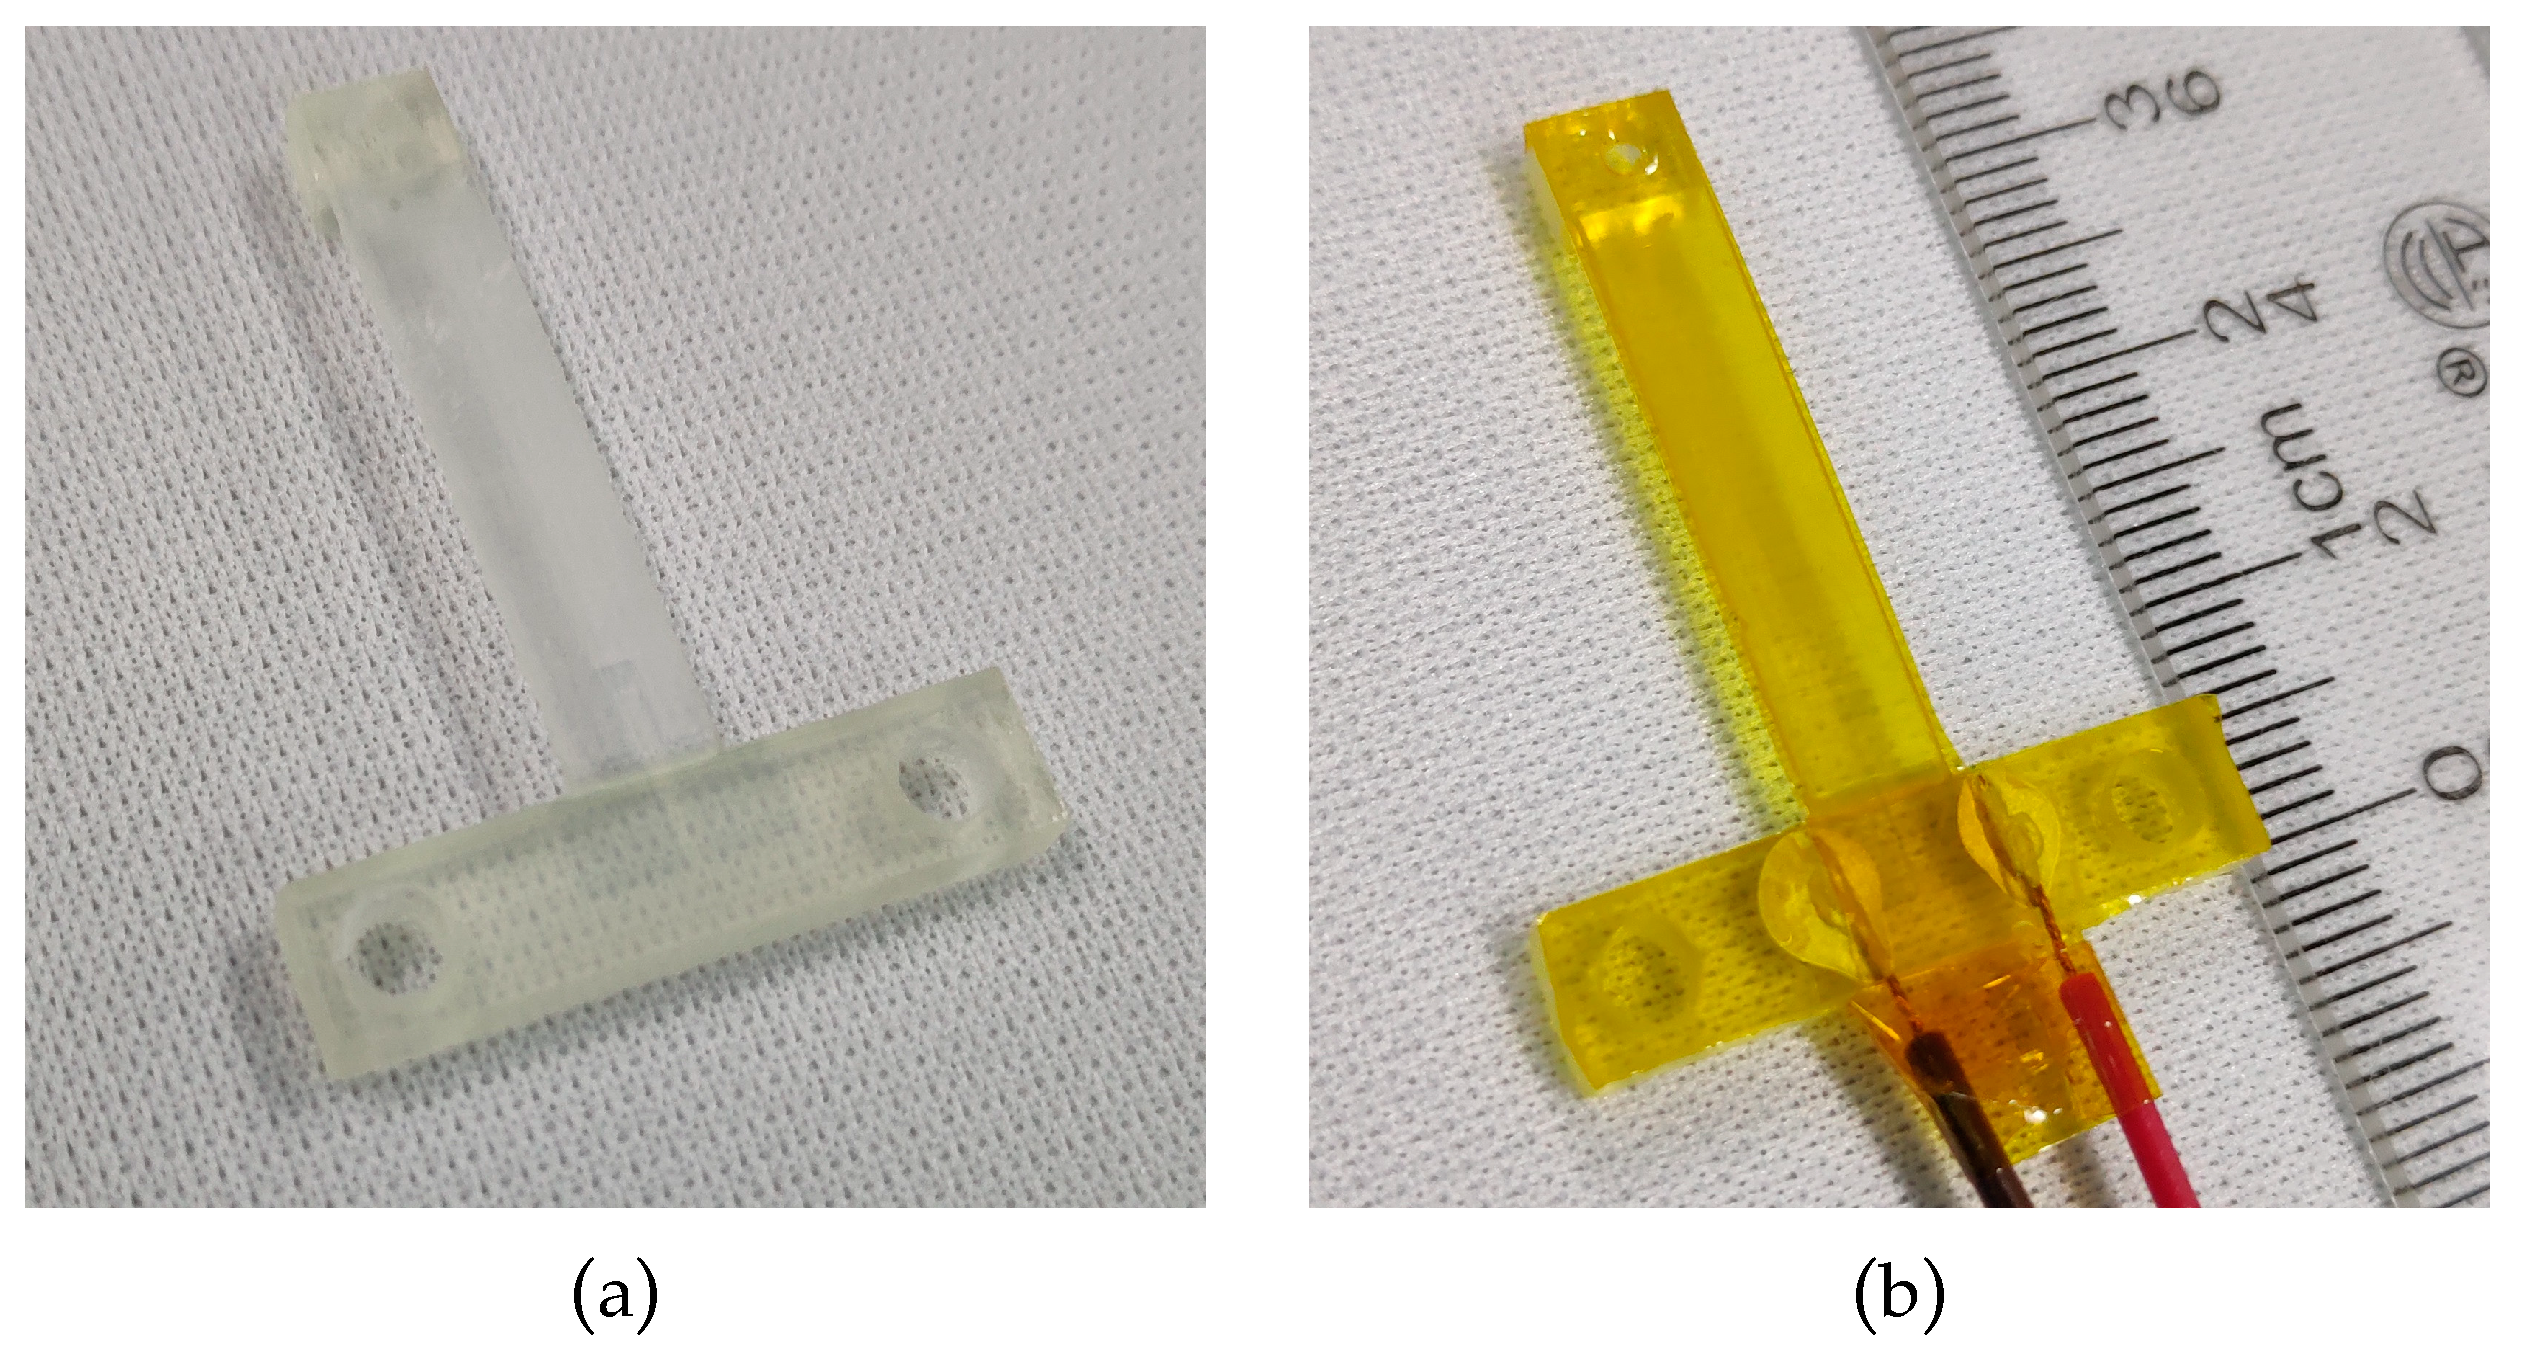
21]. It is a DLP based desktop 3D printer with a lateral resolution of 50 µm and a thickness resolution of 5 µm. During printing, the layer thickness to form the structure was set to 30 µm. The sensor substrates after printing are shown in
Figure 6a.
After that, the printed sensor substrate was ultraviolet (UV) cured in a UV curing machine from MAKEX [
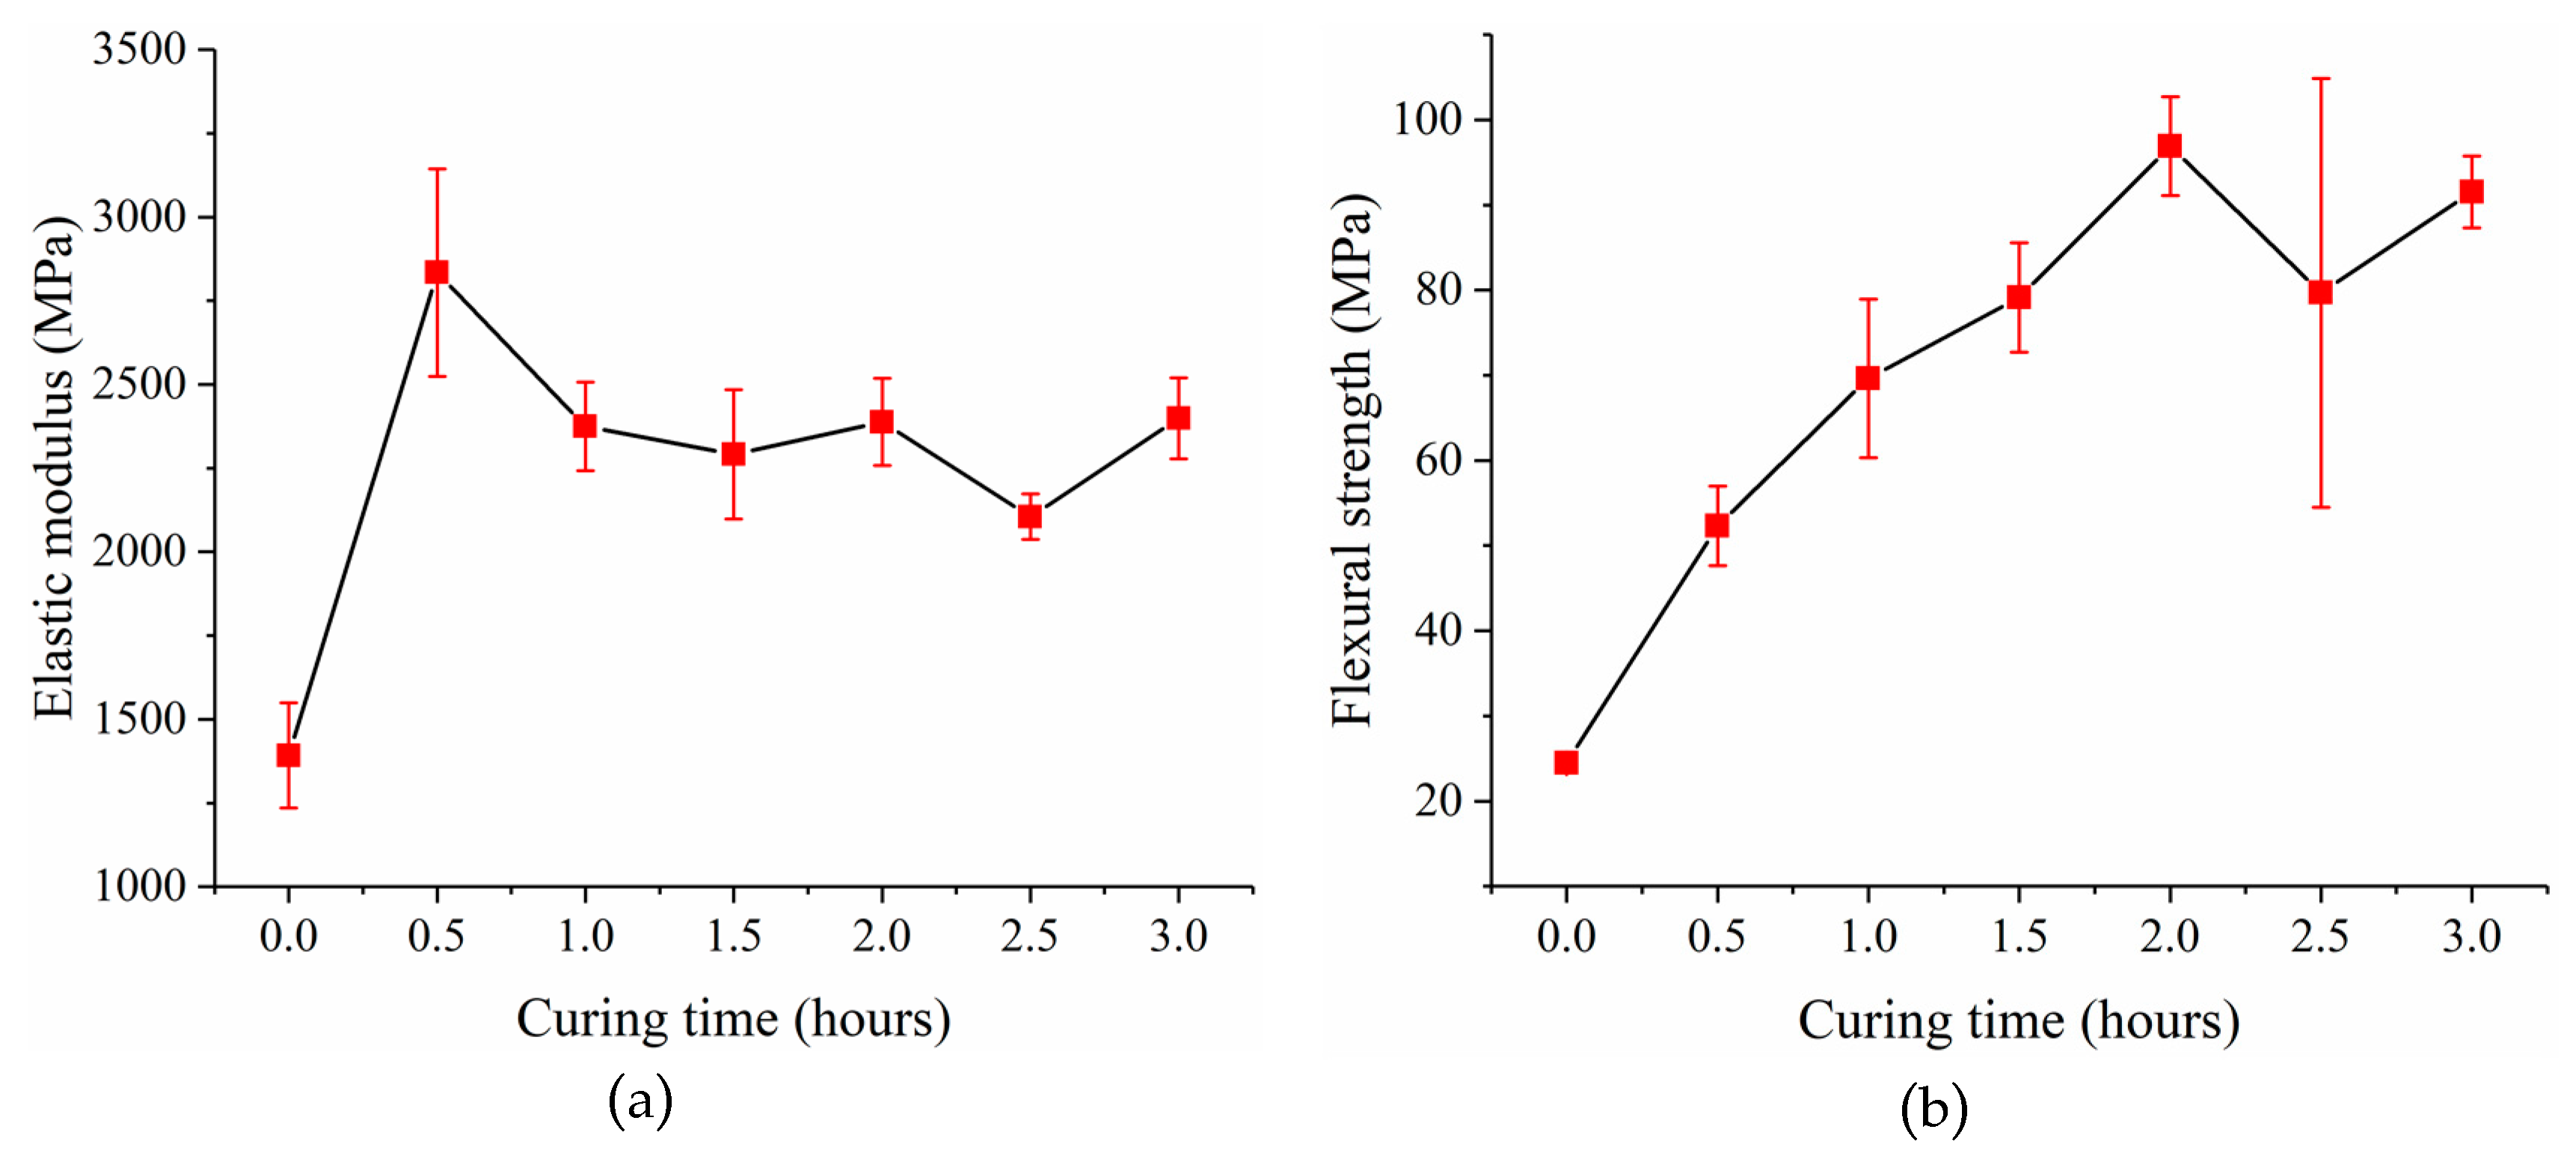
22] to improve the mechanical properties of the post-cured resin. Experiments were done to investigate the relationship between the mechanical properties of the post-cured resin and the curing time. First, thirty-five resin samples that were 60 mm long, 15mm wide and 3 mm thick were prepared and divided into 7 groups. Each group was UV cured with different curing times ranging from 0 h to 3 h. The light intensity in the UV curing machine is (25.34 ± 1.39) × 103 Lux, which was measured by an illuminometer GM1040 from BENETECH (Shenzhen, China). Finally, a three-point bending test was carried out with these samples using a multifunctional static test machine CMT4304 from MTS (Eden Prairie, MN, USA). The elastic moduli and flexural strengths of these samples were obtained. The average value and standard deviation of the experimental data are listed in
Table 1. The relationships between the elastic modulus of the post-cured resin and the curing time, and the flexural strength of the post-cured resin and the curing time are shown in
Figure 7a,b, respectively. The results show that the post-cured resin with 2 h curing time has relatively better mechanical properties with an elastic modulus of 2388.12 ± 225.76 MPa and flexural strength of 96.91 ± 10.05 MPa. The flexural strength of the samples experienced a large standard deviation for curing time at 2.5 h. This is because of the resin aging due to the long curing time, which makes its performance unstable [
23]. So, the sensor substrate was cured for 2 h to get better mechanical properties. The sensor substrates after ultraviolet curing are shown in
Figure 6b.
Due to the large surface roughness of the sensor substrate, a polishing step was needed to make the substrate meet the requirements of the follow-up process. The sensor substrate was polished with 2000 mesh, 3000 mesh, 5000 mesh and 7000 mesh sandpapers in sequence. Finally, the roughness of the substrate was reduced from 0.4541 ± 0.1640 µm to 0.0516 ± 0.0072 µm and it was smooth enough to meet the needs of the inkjet printing process. The sensor substrate was then treated with the oxygen plasma in a plasma cleaner for 1 min to make it clean and hydrophilic.
3.2. Fabrication and Characterization of the Strain Gauge
The strain gauge was printed by a commercialized drop-on-demand (DOD) Dimatix DMP-3000 material inkjet printing system from Fujifilm (Tokyo, Japan) with a DMC-11610 cartridge consisting of 16 nozzles and a drop volume of 10 pL. A commercialized PEDOT/PSS ink CLEVIOS P Jet 700 N from Heraeus (Hanau, Germany) [
24] with 0.6–1.2 wt% of solids content and 659 S/cm conductivity was used to make the strain gauge. The PEDOT/PSS ink was printed with a 45 µm drop space using a frequency of 5 kHz at a voltage of 38 V and a meniscus vacuum set to 4 inches of H
2O. During printing, the droplets were ejected out of the nozzle by applying a voltage that changed the volume of the channel connecting to the nozzle. The voltage waveforms used during printing are listed in
Table 2. In addition, other printing details followed the inkjet guide,
Inkjet printing with Clevios P Jet formulations, provided by Heraeus. Next, the samples were dried in an air convection oven at 120 °C for 15 min to make the strain gauge functional.
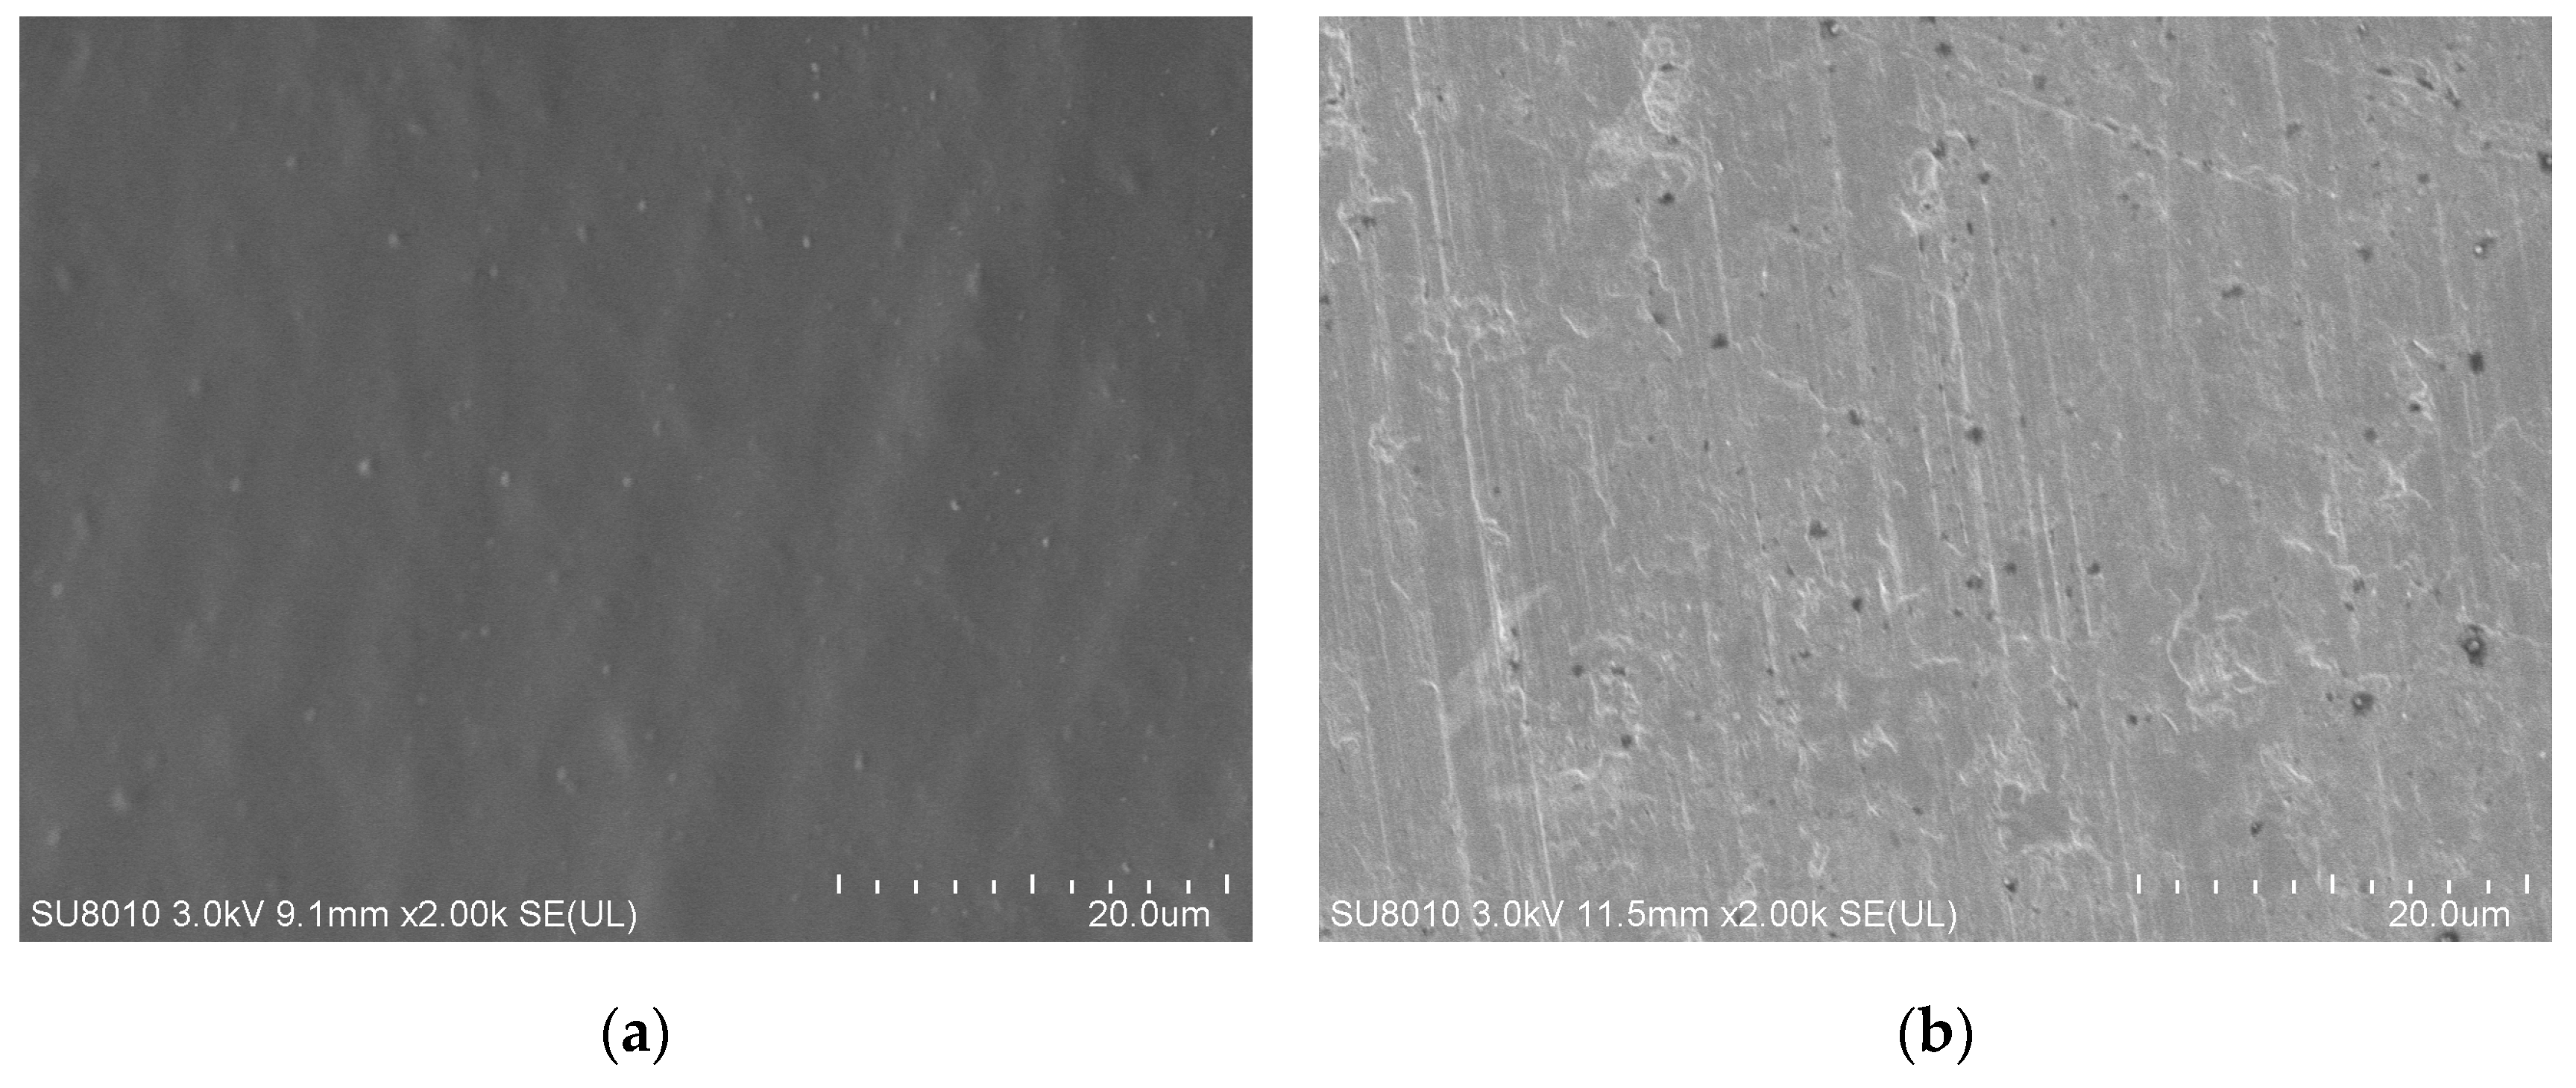
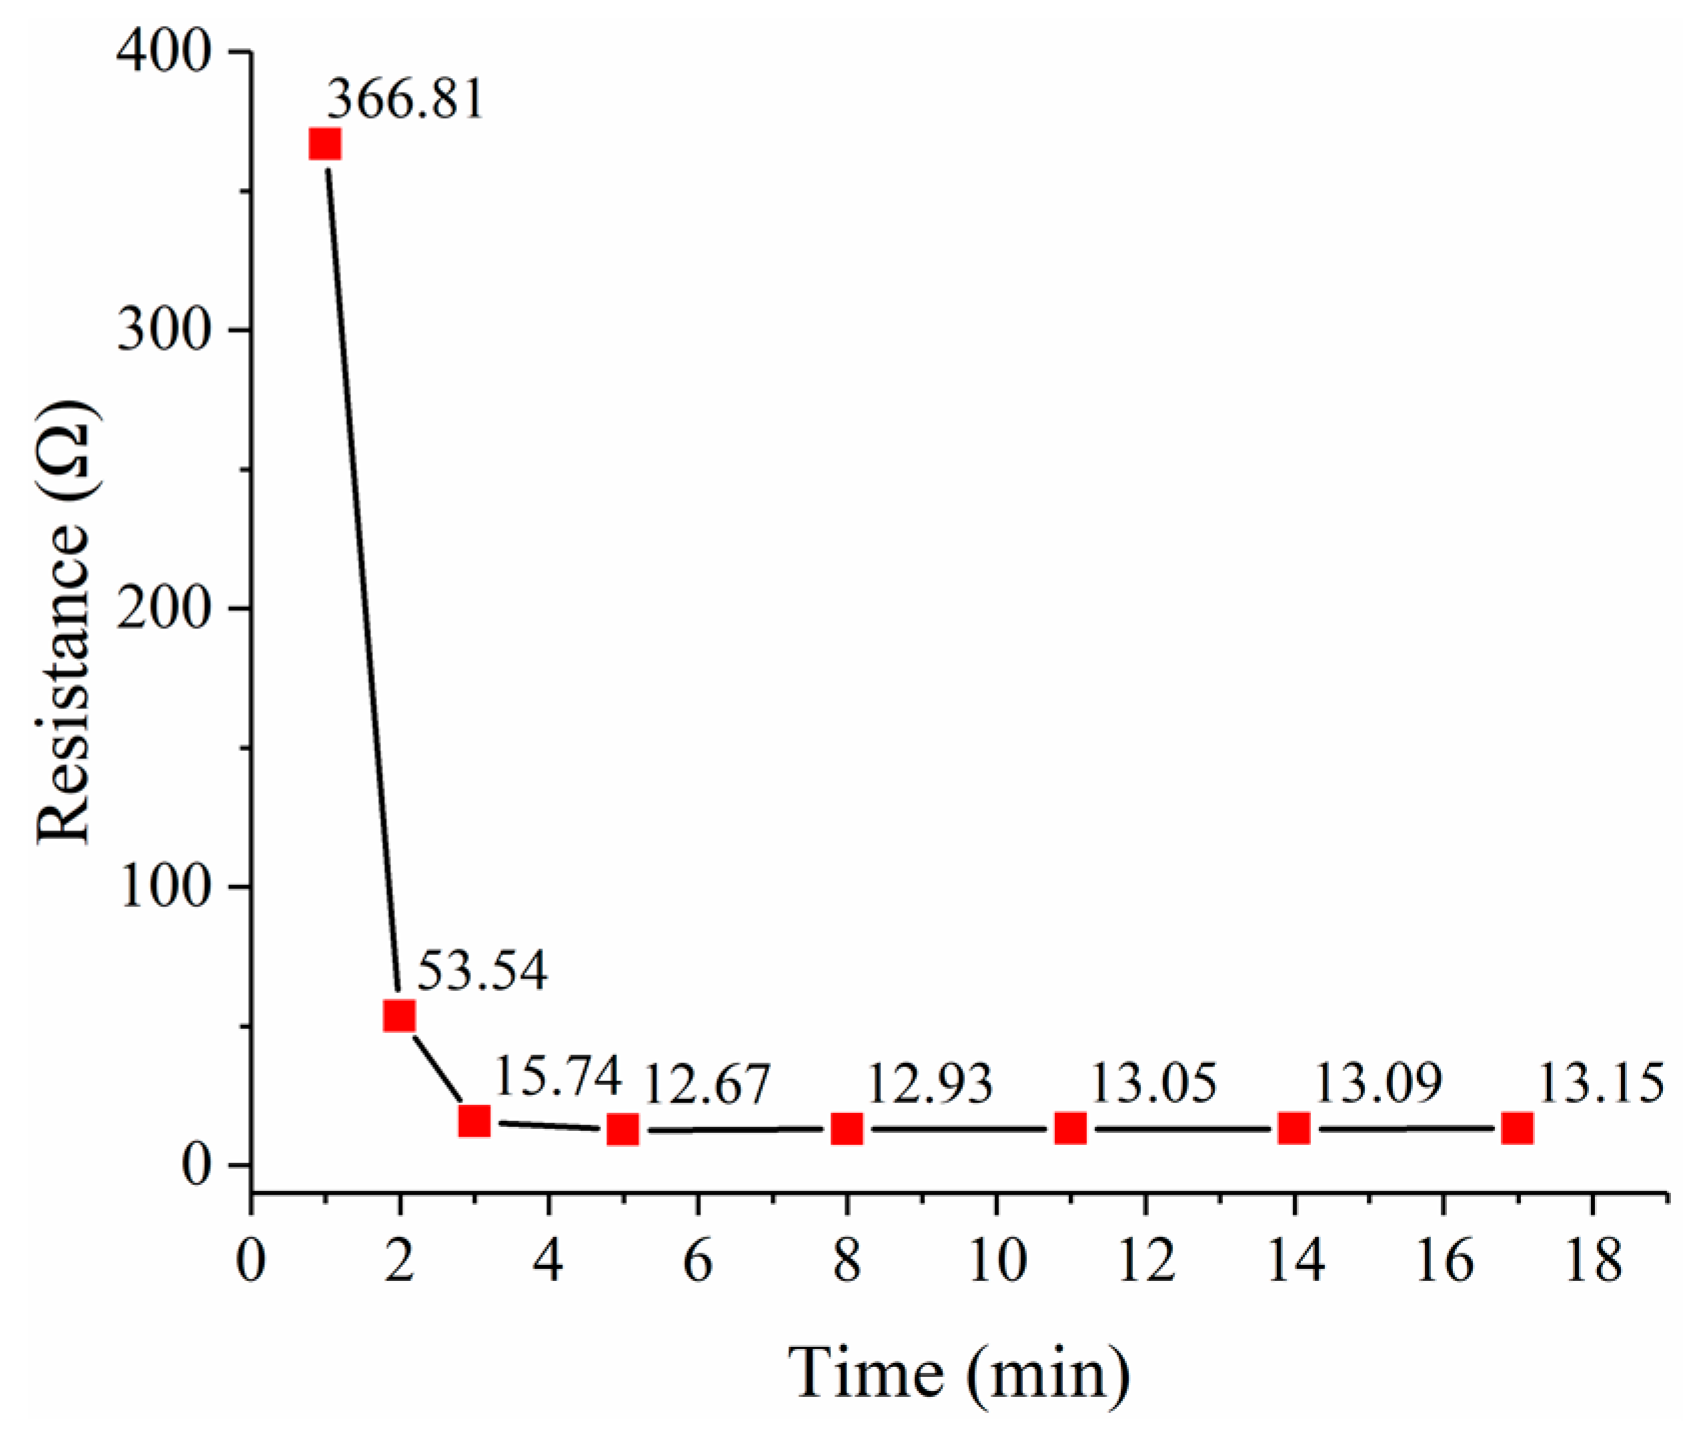
The PEDOT/PSS films dried at the room temperature for 24 h and dried in an air convection oven at 120 °C for 15 min were observed using a scanning electron microscope SU-8010 from HITACHI (Tokyo, Japan). It can be seen that the heat drying process can make the PEDOT/PSS film flatter and denser, as shown in
Figure 8. The effect of the heat drying process on the PEDOT/PSS film resistance was also investigated, as shown in
Figure 9. The resistance of the PEDOT/PSS film decreased rapidly when heat drying begins and tended to be stable after 8 min.
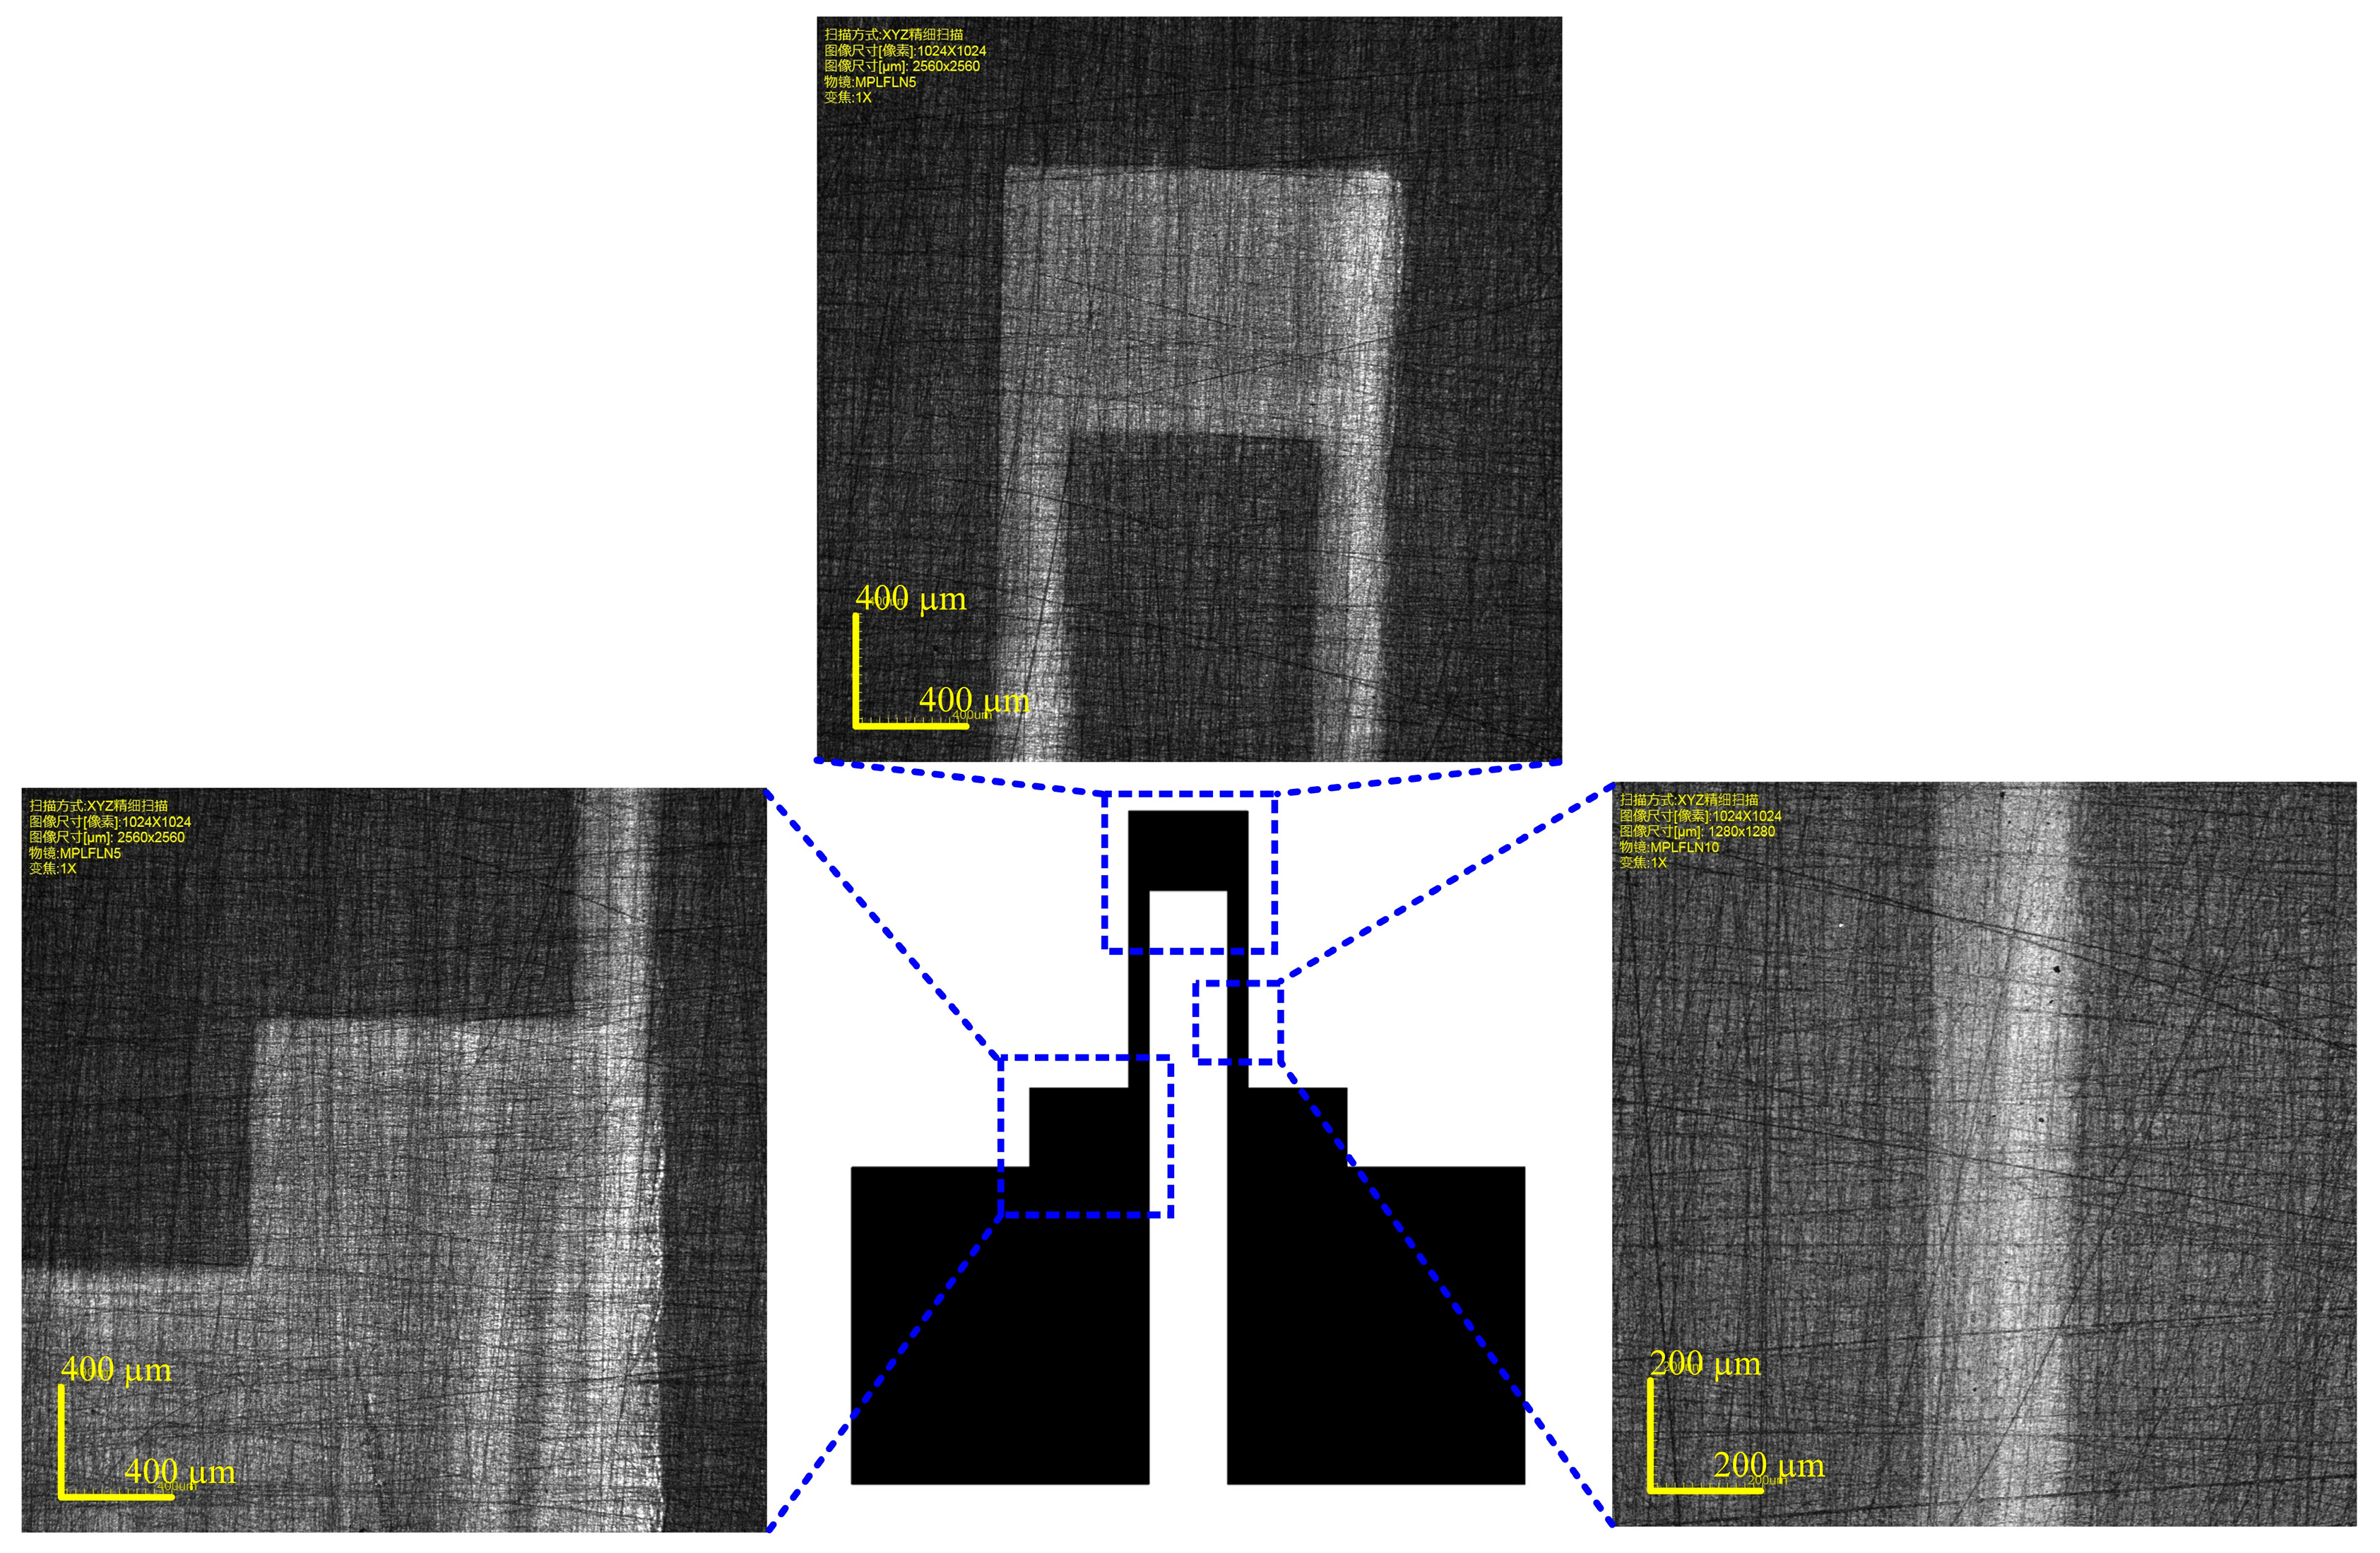
In order to study the morphology of the printed strain gauge, the printed strain gauge with three layers of PEDOT/PSS on the sensor substrate was observed using a confocal laser scanning microscope LEXT OLS4000 from Olympus (Tokyo, Japan), as shown in
Figure 10. The strain gauge has a good appearance and a clear edge. The width of the strain gauge’s longitudinal branches was also measured, which was 248.106 ± 3.437 µm. The measured width is larger than the width in the design diagram. This was caused by the expansion of the PEDOT/PSS ink marks on the sensor substrate, which will deteriorate the dimensional accuracy.
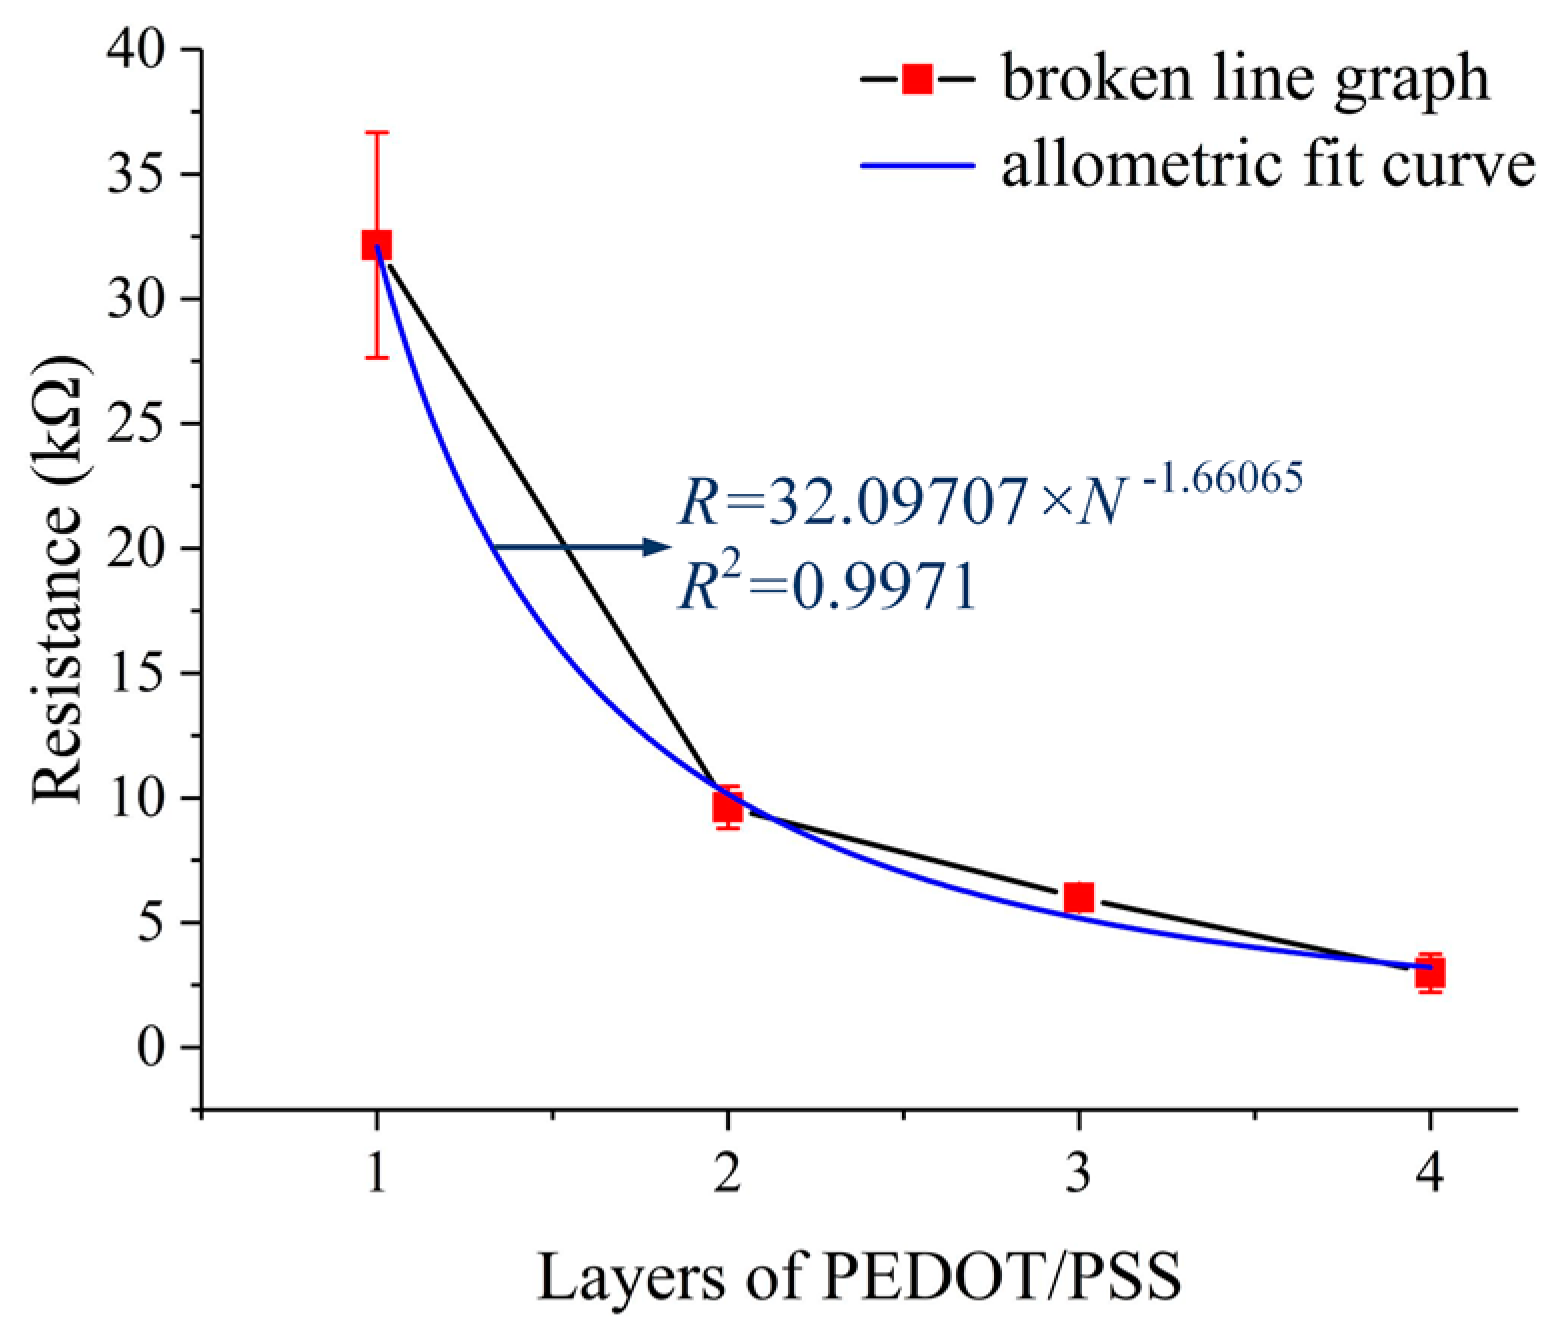
The resistance of the strain gauge is an essential parameter of the strain gauge type sensor, so the strain gauge printed on the sensor substrate was also characterized. The relationship between the resistance of the strain gauge and the count of layers of PEDOT/PSS was investigated. Measurements were done using samples with 1, 2, 3, and 4 layers of PEDOT/PSS, respectively. The resistance values were measured using a FLUKE 8846A 6-1/2 digital precision multimeter (Fluke Corporation, Everett, WA, USA) at 21.7 °C, 56.0% RH. There were 20 samples (5 samples for each group) and each sample was measured three times. The experiment results are listed in
Table 3. As shown in
Figure 11, the resistance of the strain gauges is decreased from 32.15253 ± 3.49692 kΩ to 2.98283 ± 0.59104 kΩ as the count of layers of PEDOT/PSS was increased from 1 to 4. There is an allometric relationship between the resistance and the count of the printed layers, which is not a strict inverse relationship. Also, with the increase of the layers, the standard deviation of the resistance decreased. Therefore, the count of layers should be large enough to achieve a strain gauge with small, stable resistance. However, there was a short circuit phenomenon occurring on the strain gauge with 4 layers of PEDOT/PSS because of the expansion of the PEDOT/PSS ink marks on the sensor substrate, which deteriorates the resistance consistency. Taking all these things into consideration, the strain gauge was printed with 3 layers of PEDOT/PSS to achieve a small, stable resistance.
After that, wires were connected with electrodes using a conductive silver epoxy paste from Ausbond (Shenzhen, Chian) and dried for 20 min at 120 °C. The force sensor was sealed under a layer of Kapton tape with 60 µm thickness and 5 mm width to mechanically protect the printed strain gauge and the electrical contacts. This process was done manually. The sensor substrate with the printed strain gauge is shown in
Figure 12a, and the fabricated force sensor with wires and Kapton tape is shown in
Figure 12b.
4. Test of the Force Sensor
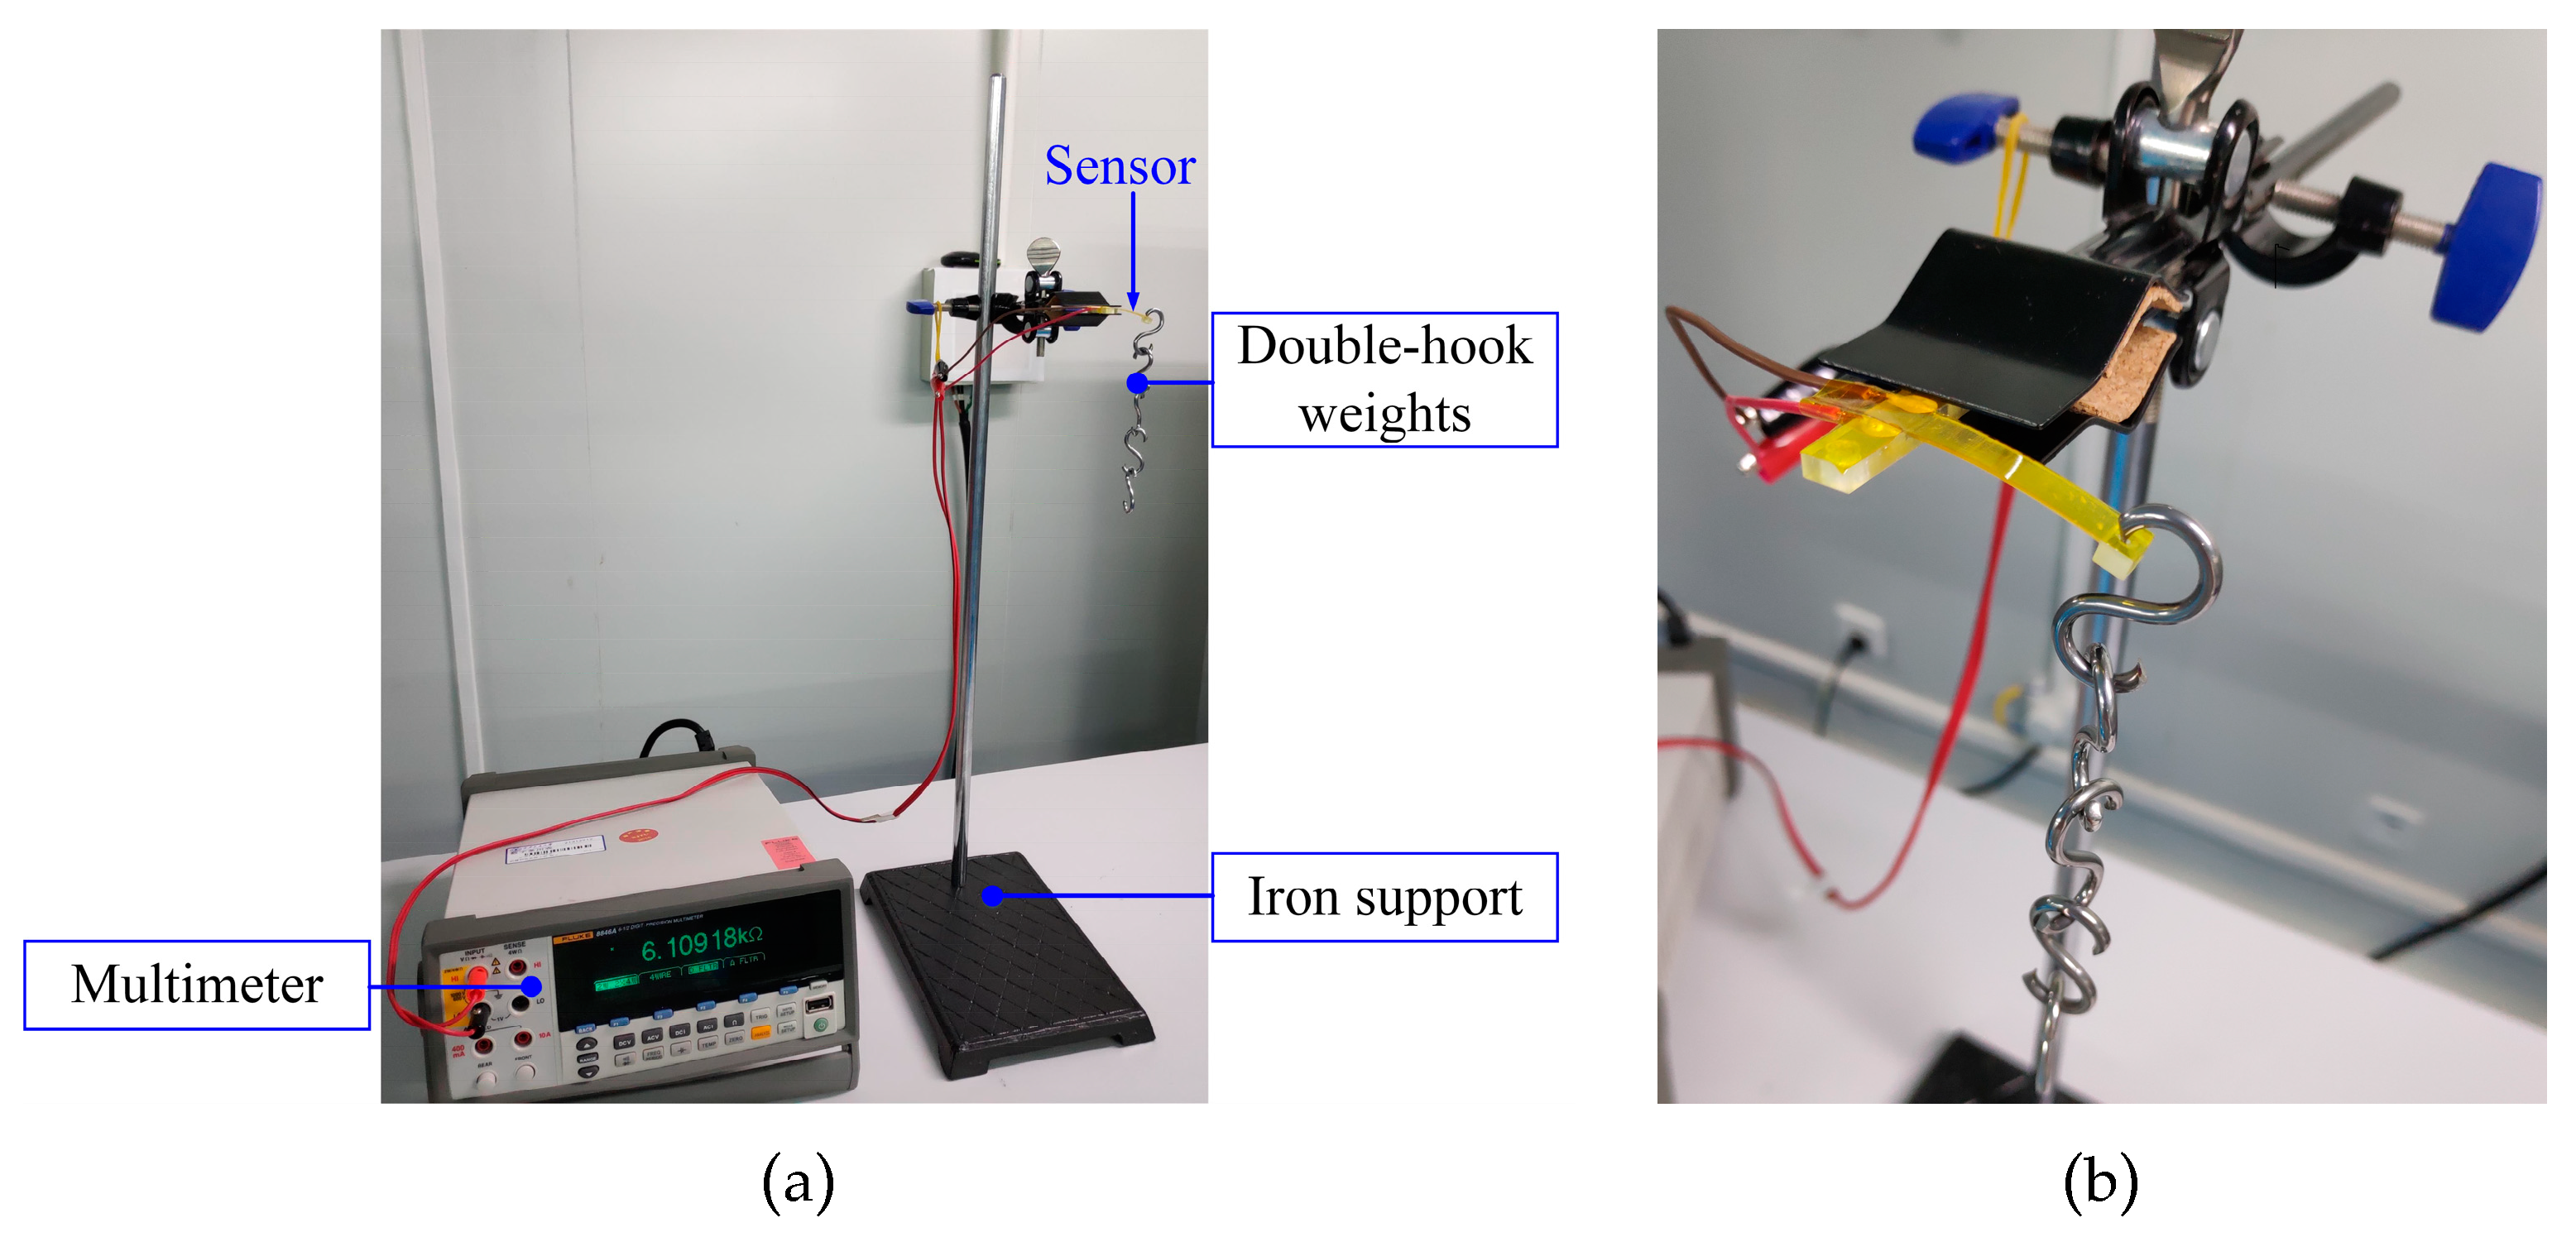
At first, an experimental setup was established to characterize the force sensor. As shown in
Figure 13, the experimental setup can be divided into three parts. The iron support stand was used to clamp and hold up the force sensor. The double-hook weights were utilized to apply well-defined force on the loading hole of the force sensor, and every double-hook weight is 2 g in weight with a manufactured precision of ±1.2 mg. The multimeter (FLUKE 8846A 6-1/2, Fluke Corporation, Everett, WA, USA) was used to read out the resistance of the force sensor. The experimental setup was put on the anti-vibration platform and the force sensor was clamped horizontally in an iron clip. In the static test, the loading force was applied from 0 mN increasing to 160 mN then decreasing to 0 mN with the use of eight 2 g double-hook weights. The loading and unloading process was repeated three times and mean values of the experimental data were obtained.
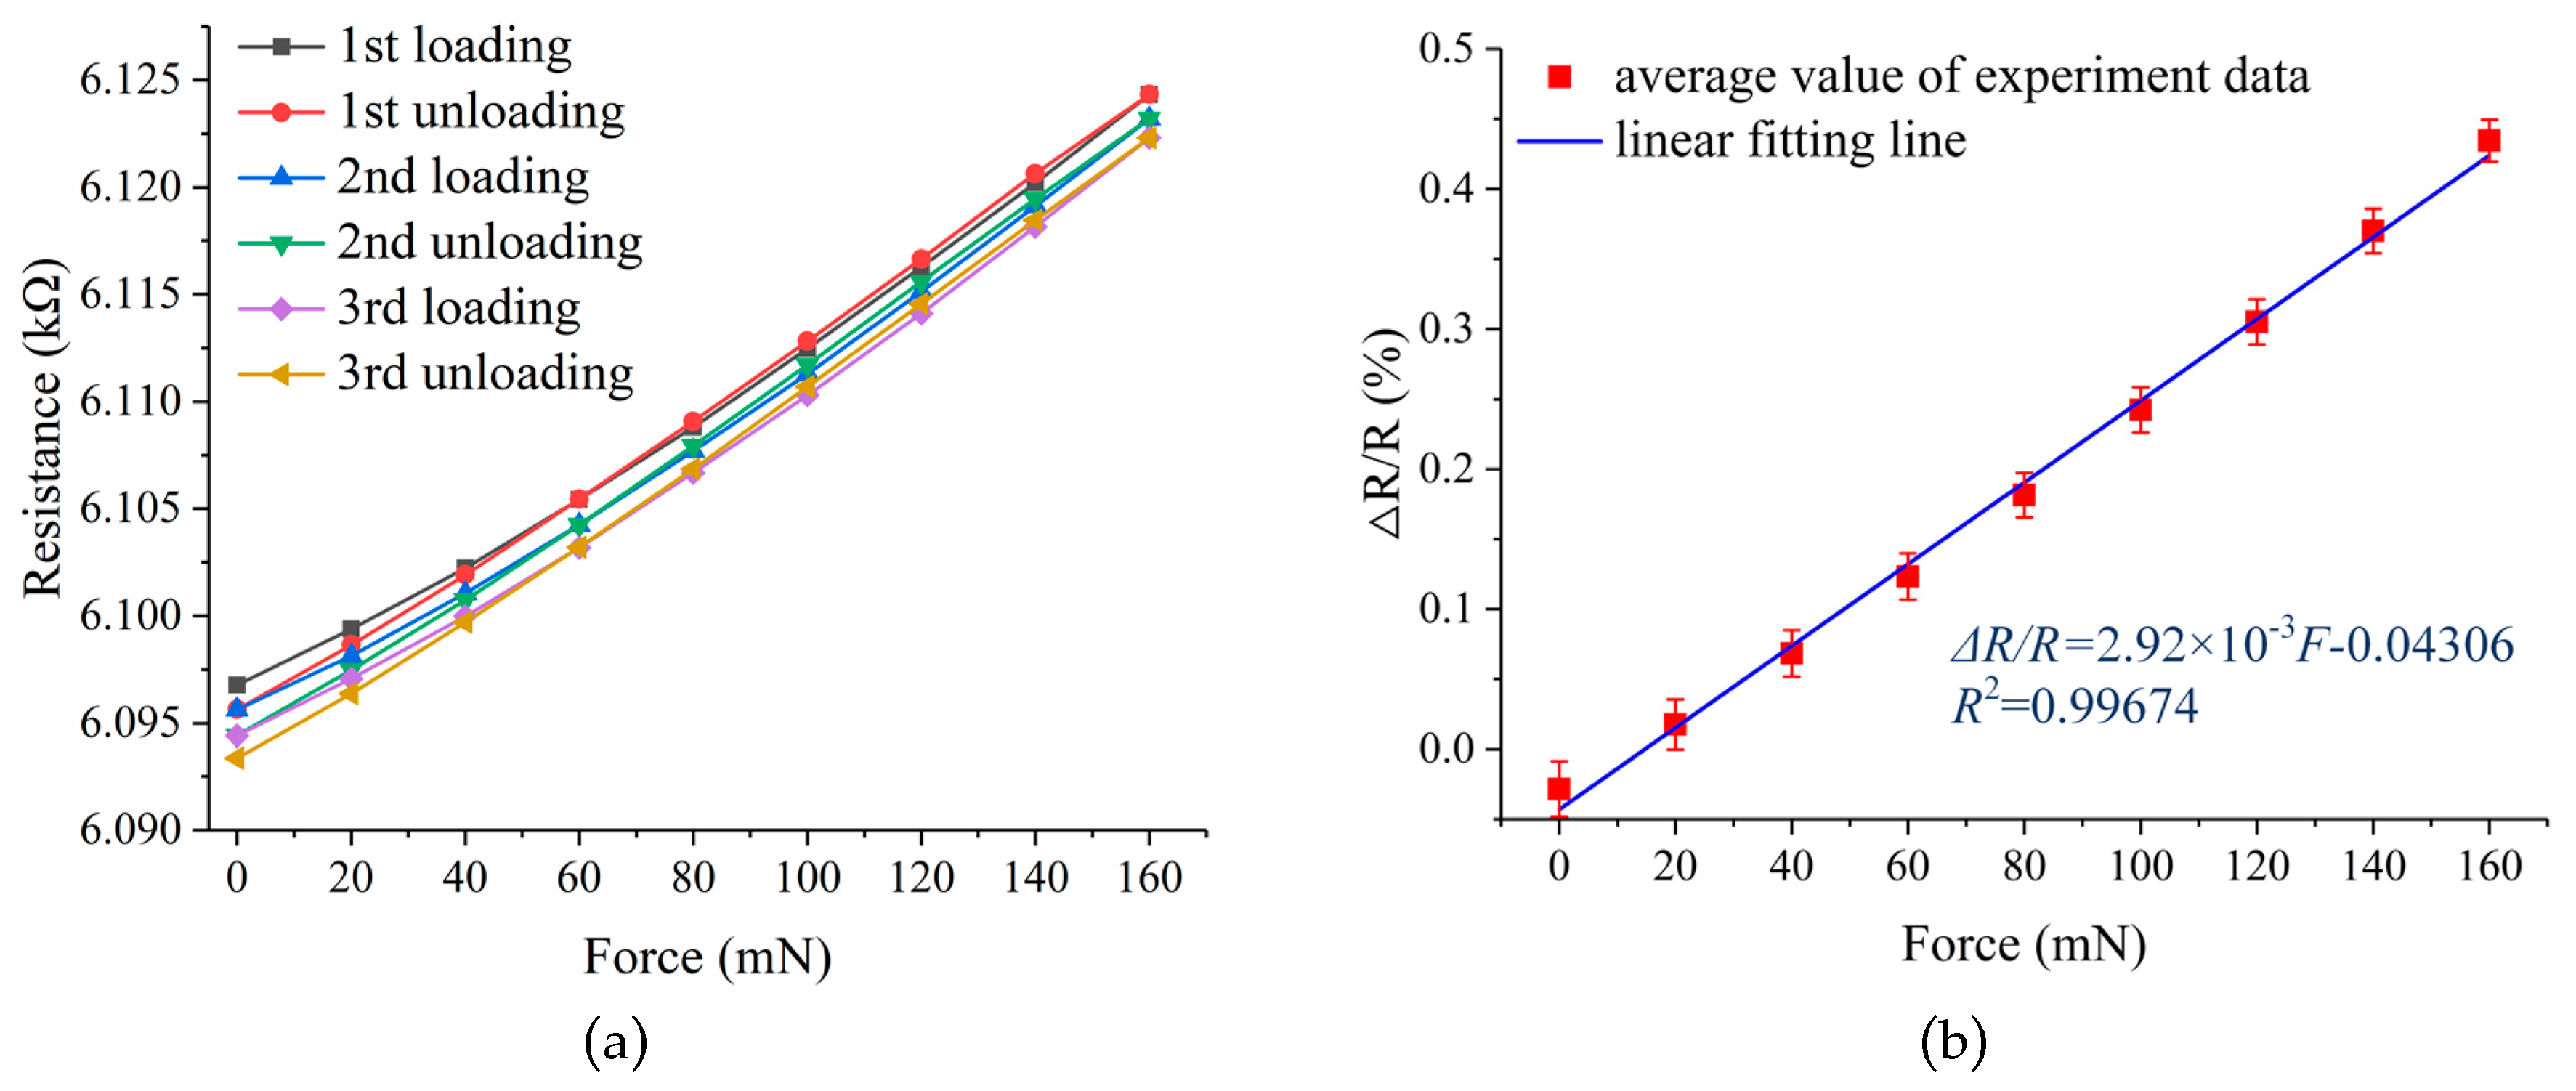
The data of the static test are recorded in
Table 4, and the results of the static test are shown in
Figure 14. To better understand of the force sensor performance, the performance parameters such as sensitivity, linearity, hysteresis, repeatability, and overall accuracy were calculated. Within the range 0–160 mN, a sensitivity of 2.92% N
−1, a linearity error of 3.1485% FS, a hysteresis of 2.0191% FS, repeatability of 6.7243% FS, and an overall accuracy of 7.6945% FS were obtained. The linearity error and repeatability error of the force sensor is relatively large, and these were mainly induced by the intrinsic properties of the high-temperature resin, such as the creep property. Combined with the simulation analysis with theoretical calculation, the effective gauge factor of the strain gauge was obtained, which was about 0.98.
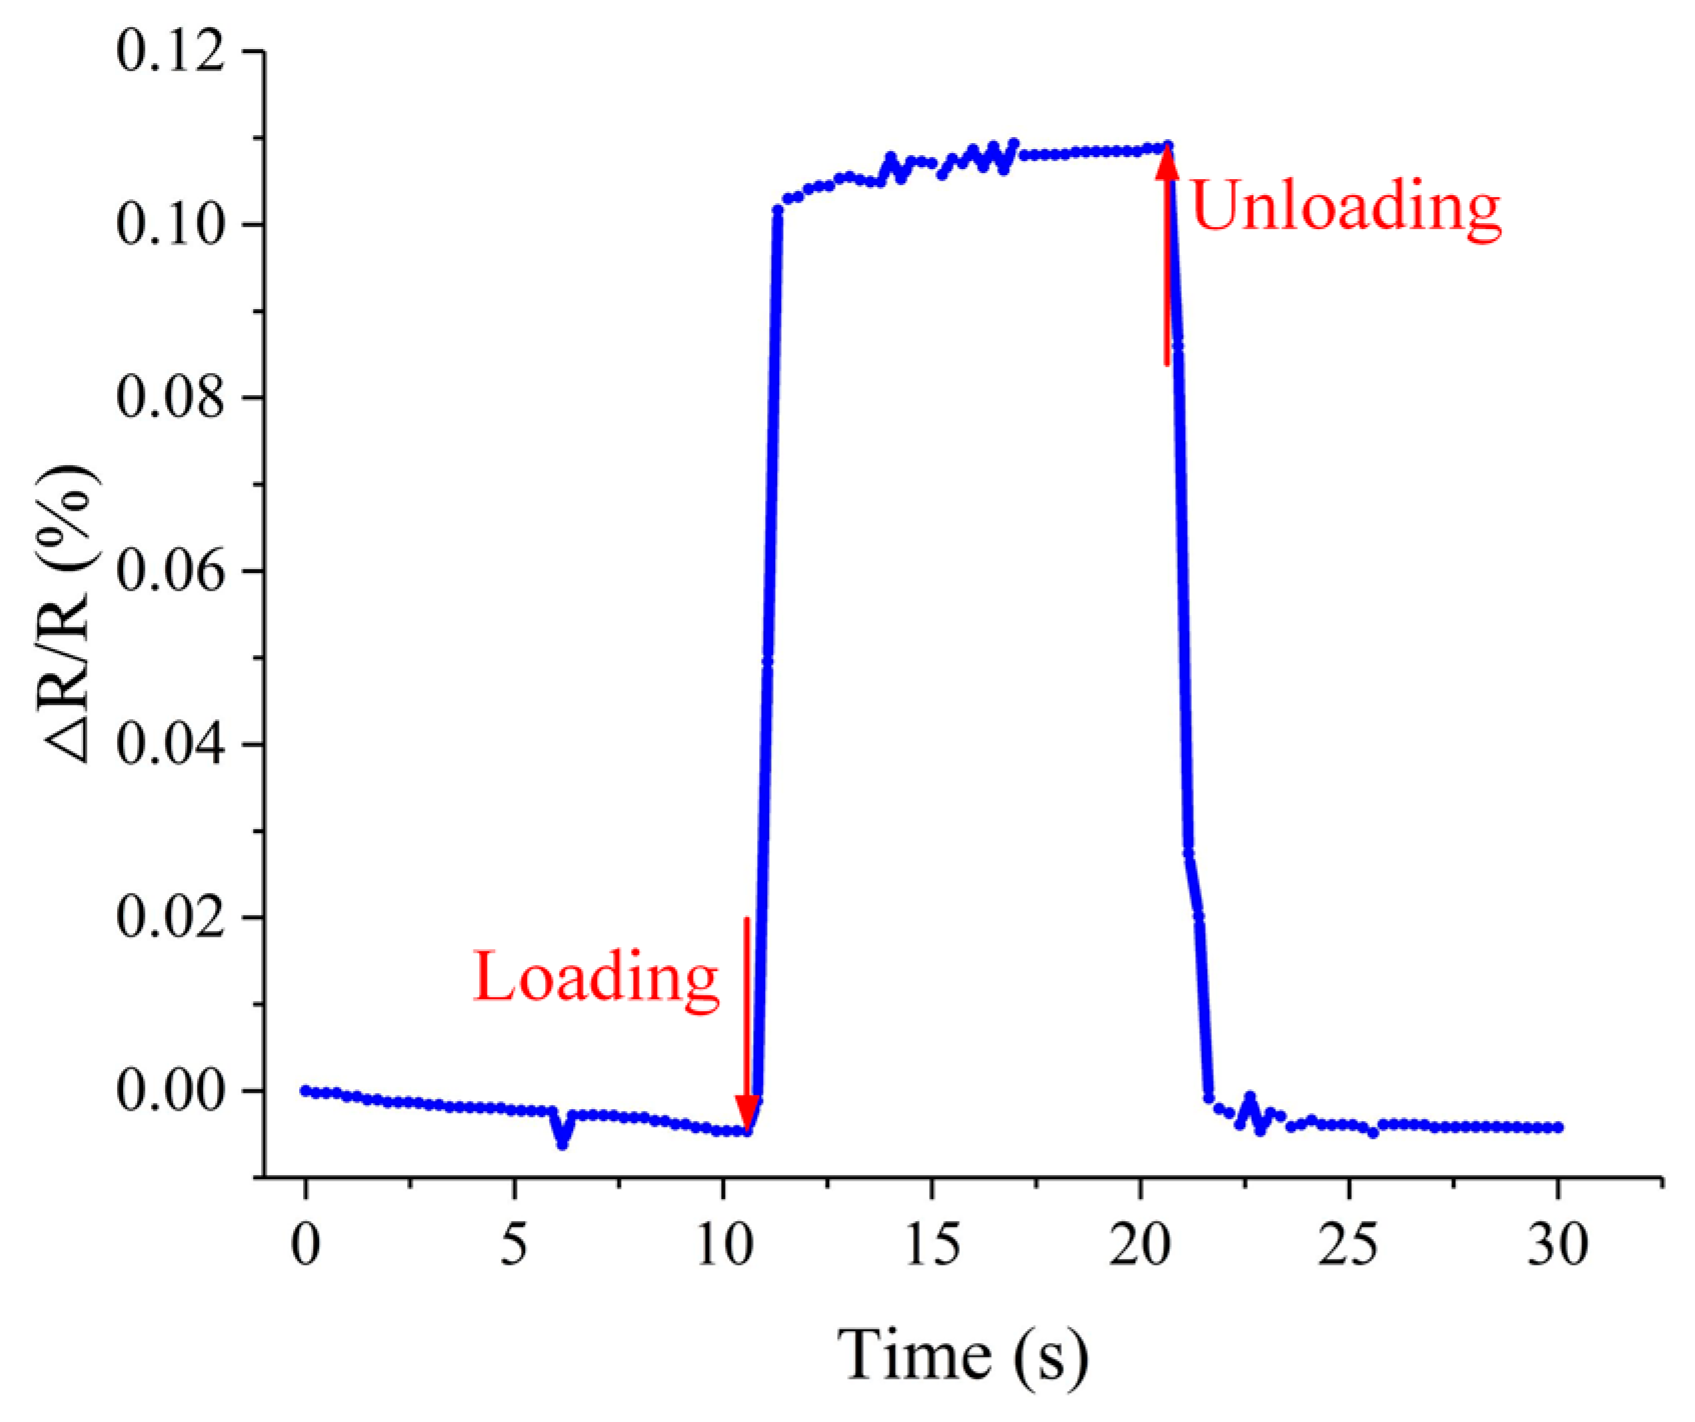
Besides the static test, the dynamic characteristics of the force sensor were also tested with the same experimental setup. The response time to a sudden increase and decrease of a force on the force sensor and the ability of the force sensor to keep a stable output under a constant force were investigated. To achieve these measurements, a 5 g double-hook weight was applied to the force sensor for a while. The whole test time was 30 s, and the loading time was about 10 s. The relative resistance variation of the force sensor under the force pulse is shown in
Figure 15. The rise time was 756.1 ms the fall time was 1031.1 ms. The fall time was relatively long due to the creep property of the high-temperature resin. The fluctuation during the loading time was mainly caused by the waggle of the double-hook weight. Also, there is zero drift occurring in this test.
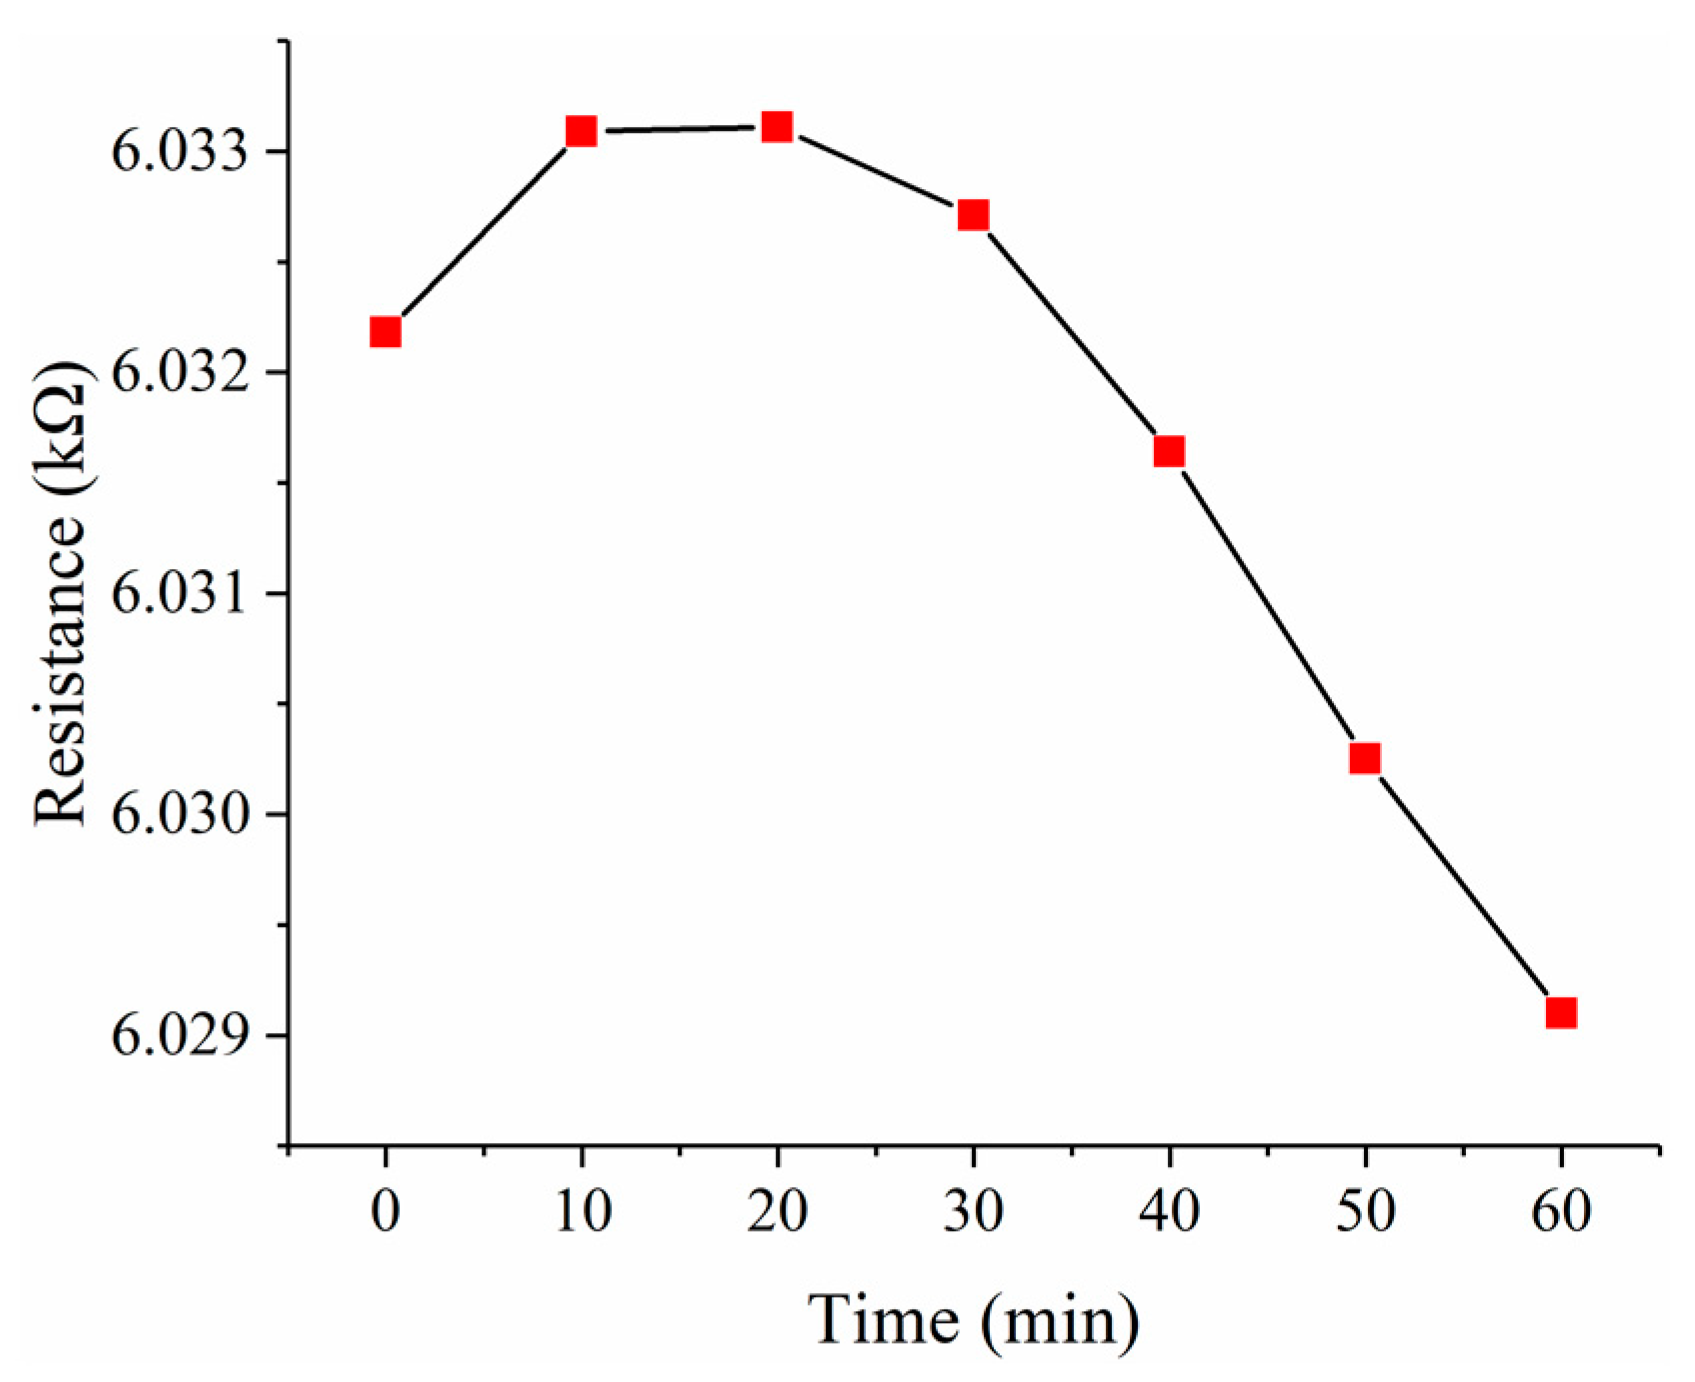
To investigate the zero drift of the force sensor, a short-term stability test was performed for one hour. The data of the short-term stability test are recorded in
Table 5. As shown in
Figure 16, the resistance was read every 10 min, and the resistance changes are no more than 0.004 kΩ in one hour, which is 0.0665% of the initial resistance. The minor changes of the temperature and humidity in the laboratory may contribute to the 0.004 kΩ fluctuation.
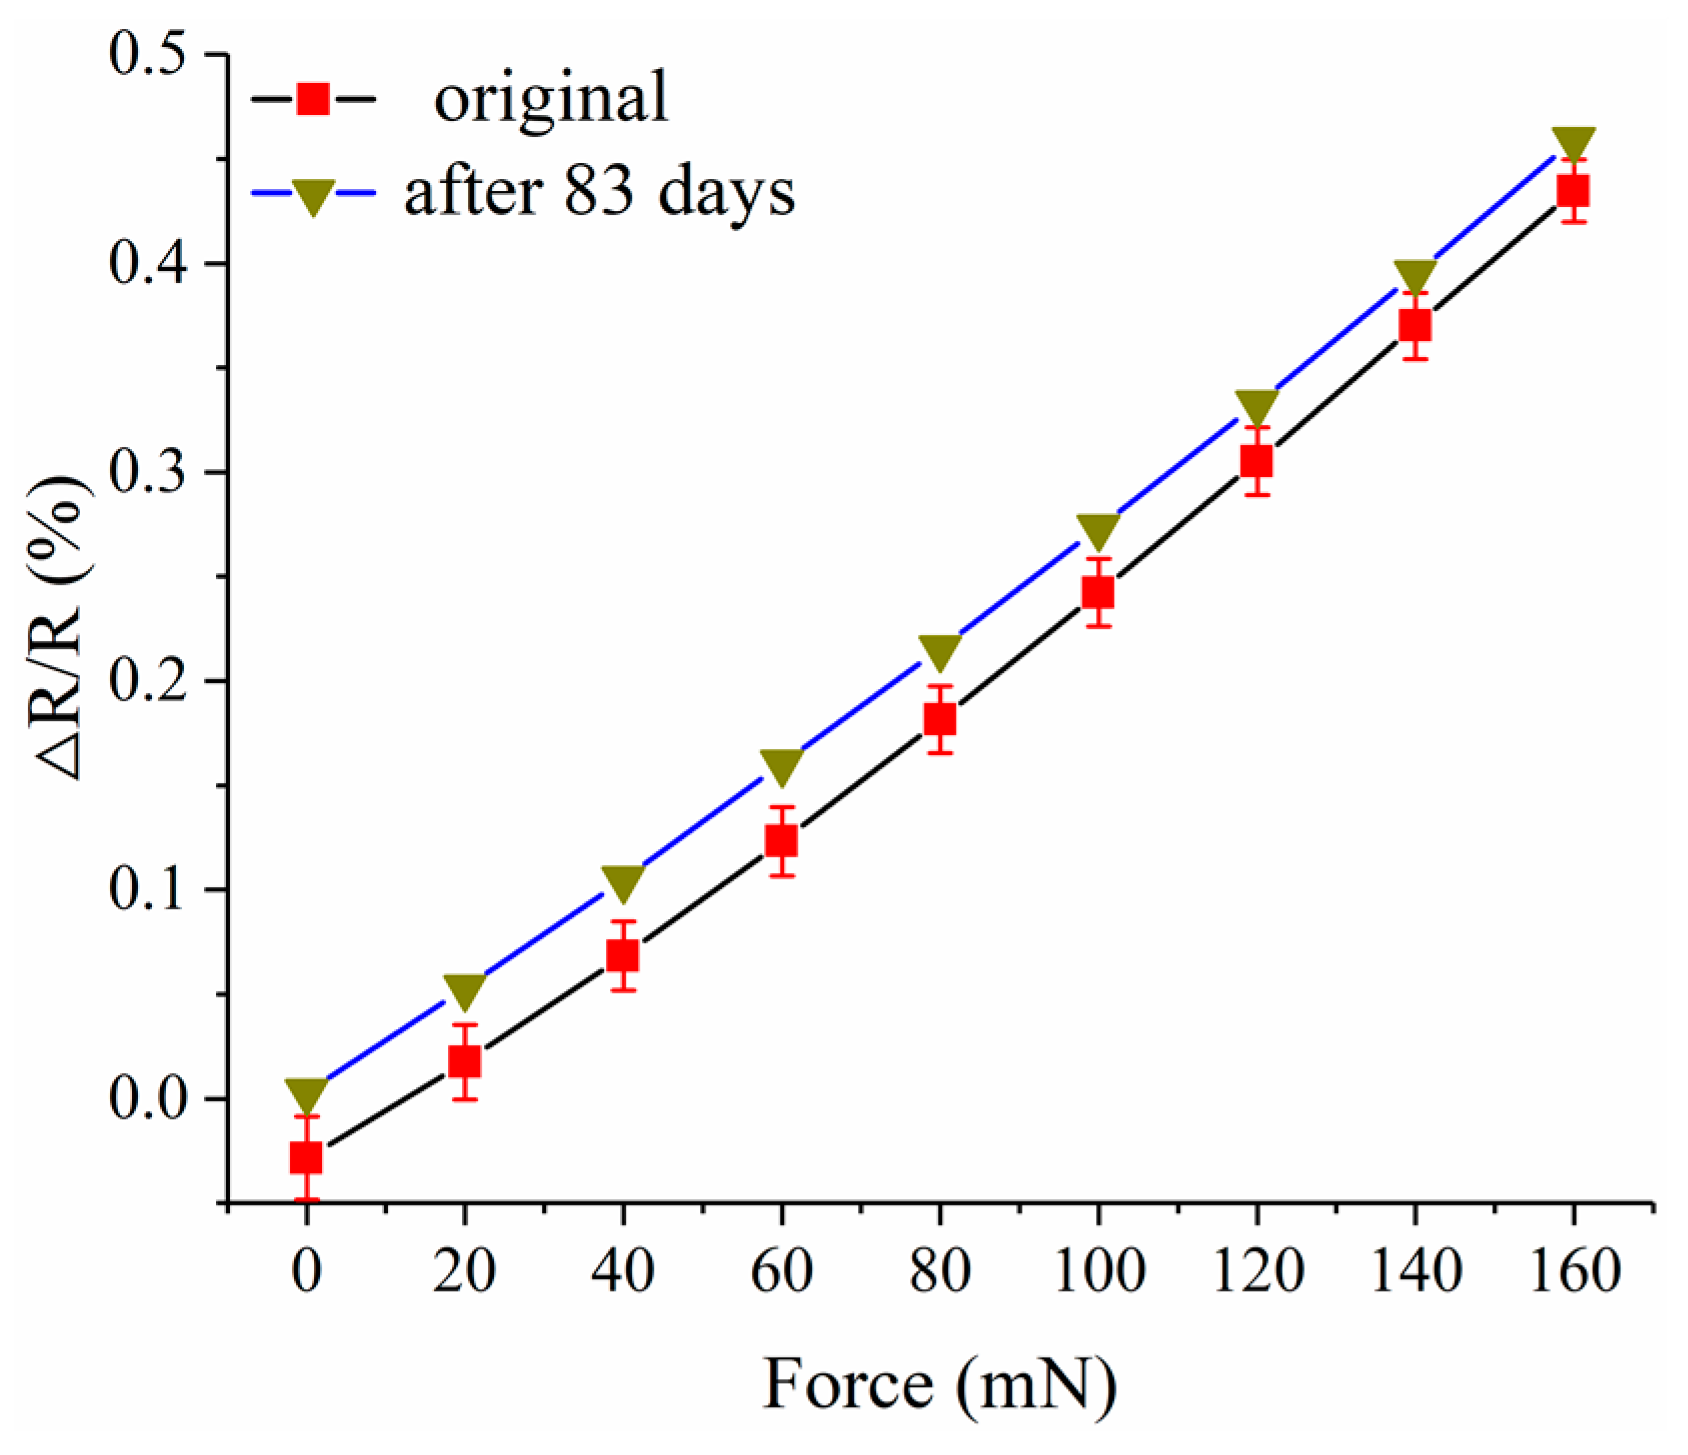
The resistance of the force sensor was measured again 80 days after the short-term stability test, and the result is 6.04316 kΩ. This may be caused by the humidity change in the laboratory, which is 48.1% RH before and 15.6% RH after. Also, the static test was conducted again after 83 days. As shown in
Figure 17, the result is close to the result of the static test before, and this indicates that the long-term stability of the force sensor is good.
A cost effective and time-saving way to fabricate a force sensor with the composite structure is achieved in this research, and the force sensor has potential applications for use in robot whisker and flow velocity measurement technologies. However, the performance of the force sensor is still not good enough. The repeatability error is relatively large and the response time is long. This is because the sensor performance is somewhat restricted by the creep property of the high-temperature resin, and the resistance of the strain gauge is susceptible to temperature and humidity. Once these problems are solved, the performance can be further improved. It is this necessary to investigate new 3D printing materials and new sensor packaging methods in future studies.
5. Conclusions
In this paper, a novel 3D printed force sensor with an inkjet-printed strain gauge is investigated. With the combination of DLP-based printing and inkjet printing technologies, a totally 3D printed force sensor with a composite structure was proposed which has cost effective and time-saving advantages compared to traditional sensor manufacturing processes. Theoretical and simulation analyses were conducted for sensor design. To optimize process parameters, the relationship between the mechanical properties of the post-cured resin and the curing time was investigated, and the resistance of the printed strain gauges was characterized. Finally, the fabricated force sensor was tested. Experimental results indicate that the sensitivity is 2.92% N−1, the linearity error is 3.1485% FS, the hysteresis is 2.0191% FS, the repeatability is 6.7243% FS, and overall accuracy is 7.6945% FS in the range of 0–160 mN. The effective gauge factor of the strain gauge is about 0.98. The resistance drifting is less than 0.004 kΩ (0.0665% of the initial resistance) within an hour. These results proved that 3D printing technology may have great application potential for sensor design and fabrication. Future work will be mainly devoted to investigating new 3D printing materials and new sensor packaging methods to improve the performance of the 3D printed force sensor.


