Comparison of Clean-Up Methods for Ochratoxin A on Wine, Beer, Roasted Coffee and Chili Commercialized in Italy


 ,
,
Abstract
:1. Introduction
2. Results and Discussion
2.1. Evaluation of Clean-Up on Wine
2.2. Evaluation of Clean-Up on Beer

| Clean-up method | Validation levels (µg/L) | Recovery (%) (n =6 ) | RSD (%) (n = 6) | LOD (µg/L) (n = 6) | LOQ (µg/L) (n = 6) | RSDs (%) (n = 9) |
|---|---|---|---|---|---|---|
| IAC | 2 | 84.03 | 19.22 | 0.14 | 0.48 | 20.15 |
| 10 | 102.24 | 15.51 | 17.33 | |||
| 20 | 93.07 | 10.53 | 11.96 | |||
| MIP | 2 | 80.46 | 27.01 | 0.14 | 0.48 | 36.15 |
| 10 | 54.15 | 6.13 | 12.42 | |||
| 20 | 70.31 | 9.67 | 10.41 | |||
| Mycospin™ | 2 | 73.54 | 13.68 | 0.88 | 2.95 | 16.55 |
| 10 | 77.76 | 21.65 | 15.11 | |||
| 20 | 80.34 | 12.81 | 16.01 | |||
| Mycosep™ | 2 | 96.75 | 24.48 | 0.12 | 0.40 | 20.63 |
| 10 | 81.58 | 2.46 | 6.82 | |||
| 20 | 102.68 | 3.69 | 6.55 | |||
| HLB SPE | 2 | 59.34 | 13.89 | 2.02 | 6.73 | 19.66 |
| 10 | 83.49 | 18.56 | 19.38 | |||
| 20 | 56.29 | 1.11 | 15.66 |
| Clean-up method | Validation levels (µg/L) | Recovery (%) (n = 6) | RSD (%) (n = 6) | LOD (µg/L) (n = 6) | LOQ (µg/L) (n = 6) | RSDs (%) (n = 9) |
|---|---|---|---|---|---|---|
| IAC | 2 | 84.84 | 25.41 | 0.08 | 0.26 | 21.44 |
| 10 | 105.89 | 15.29 | 19.15 | |||
| 20 | 99.2 | 9.09 | 14.33 | |||
| MIP | 2 | 62.99 | 30.25 | 0.29 | 0.97 | 33.14 |
| 10 | 78.5 | 53.62 | 44.22 | |||
| 20 | 75.98 | 16.64 | 23.10 | |||
| Mycospin™ | 2 | 15.63 | 12.87 | 0.14 | 0.9 | 9.22 |
| 10 | 53.15 | 9.22 | 10.03 | |||
| 20 | 68.1 | 8.61 | 9.98 | |||
| Mycosep™ | 2 | 67.65 | 27.58 | 0.27 | 0.48 | 31.69 |
| 10 | 61.86 | 3.71 | 7.59 | |||
| 20 | 66.35 | 14.1 | 13.97 | |||
| HLB SPE | 2 | 7.16 | 4.52 | 0.26 | 0.87 | 5.42 |
| 10 | 27.15 | 8.53 | 15.96 | |||
| 20 | 36.34 | 23.89 | 27.10 |
2.3. Evaluation of Clean-Up on Coffee
| Clean-up method | Validation levels (µg/kg) | Recovery (%) (n = 6) | RSD (%) (n = 6) | LOD (µg/kg) (n = 6) | LOQ (µg/kg) (n = 6) | RSDs (%) (n = 9) |
|---|---|---|---|---|---|---|
| IAC | 5 | 75.15 | 12.35 | 0.48 | 1.63 | 11.10 |
| 10 | 83.68 | 2.16 | 6.23 | |||
| 20 | 79.98 | 11.14 | 12.41 | |||
| MIP | 5 | 89.21 | 15.83 | 0.08 | 0.29 | 18.10 |
| 10 | 82.31 | 1.99 | 3.15 | |||
| 20 | 84.78 | 5.5 | 5.73 | |||
| Mycospin™ | 5 | 33.61 | 33.81 | 3.03 | 10.12 | 30.62 |
| 10 | 35.63 | 16.92 | 15.93 | |||
| 20 | 38.91 | 25.93 | 16.22 | |||
| Mycosep™ | 5 | 50.33 | 1.55 | 0.99 | 3.31 | 5.33 |
| 10 | 49.98 | 12.8 | 15.11 | |||
| 20 | 54.74 | 8.64 | 14.33 | |||
| HLB SPE | 5 | 71.51 | 26.34 | 0.22 | 0.74 | 30.94 |
| 10 | 40.15 | 35.26 | 35.01 | |||
| 20 | 43.91 | 20.14 | 21.95 |
2.4. Evaluation of Clean-Up on Chili
| Clean-up method | Validation levels (µg/kg) | Recovery (%) (n = 6) | RSD (%) (n = 6) | LOD (µg/kg) (n = 6) | LOQ (µg/kg) (n = 6) | RSDs (%) (n = 9) |
|---|---|---|---|---|---|---|
| IAC | 2 | 75.20 | 5.20 | 2.27 | 7.55 | 7.17 |
| 10 | 75.10 | 9.34 | 11.49 | |||
| 20 | 91.70 | 2.23 | 7.13 | |||
| MIP | 2 | 83.81 | 31.58 | 1.77 | 5.93 | 34.52 |
| 10 | 74.85 | 0.47 | 5.63 | |||
| 20 | 81.00 | 1.95 | 6.18 | |||
| Mycospin™ | 2 | 53.23 | 11.68 | 2.12 | 7.08 | 14.66 |
| 10 | 65.14 | 18.66 | 21.46 | |||
| 20 | 69.33 | 7.96 | 15.37 | |||
| Mycosep™ | 2 | 91.35 | 8.12 | 0.30 | 1.00 | 9.17 |
| 10 | 102.60 | 1.37 | 6.33 | |||
| 20 | 96.60 | 2.85 | 4.82 | |||
| HLB SPE | 2 | 49.41 | 28.94 | 1.25 | 4.18 | 25.69 |
| 10 | 57.88 | 35.80 | 33.15 | |||
| 20 | 56.29 | 1.11 | 14.23 |

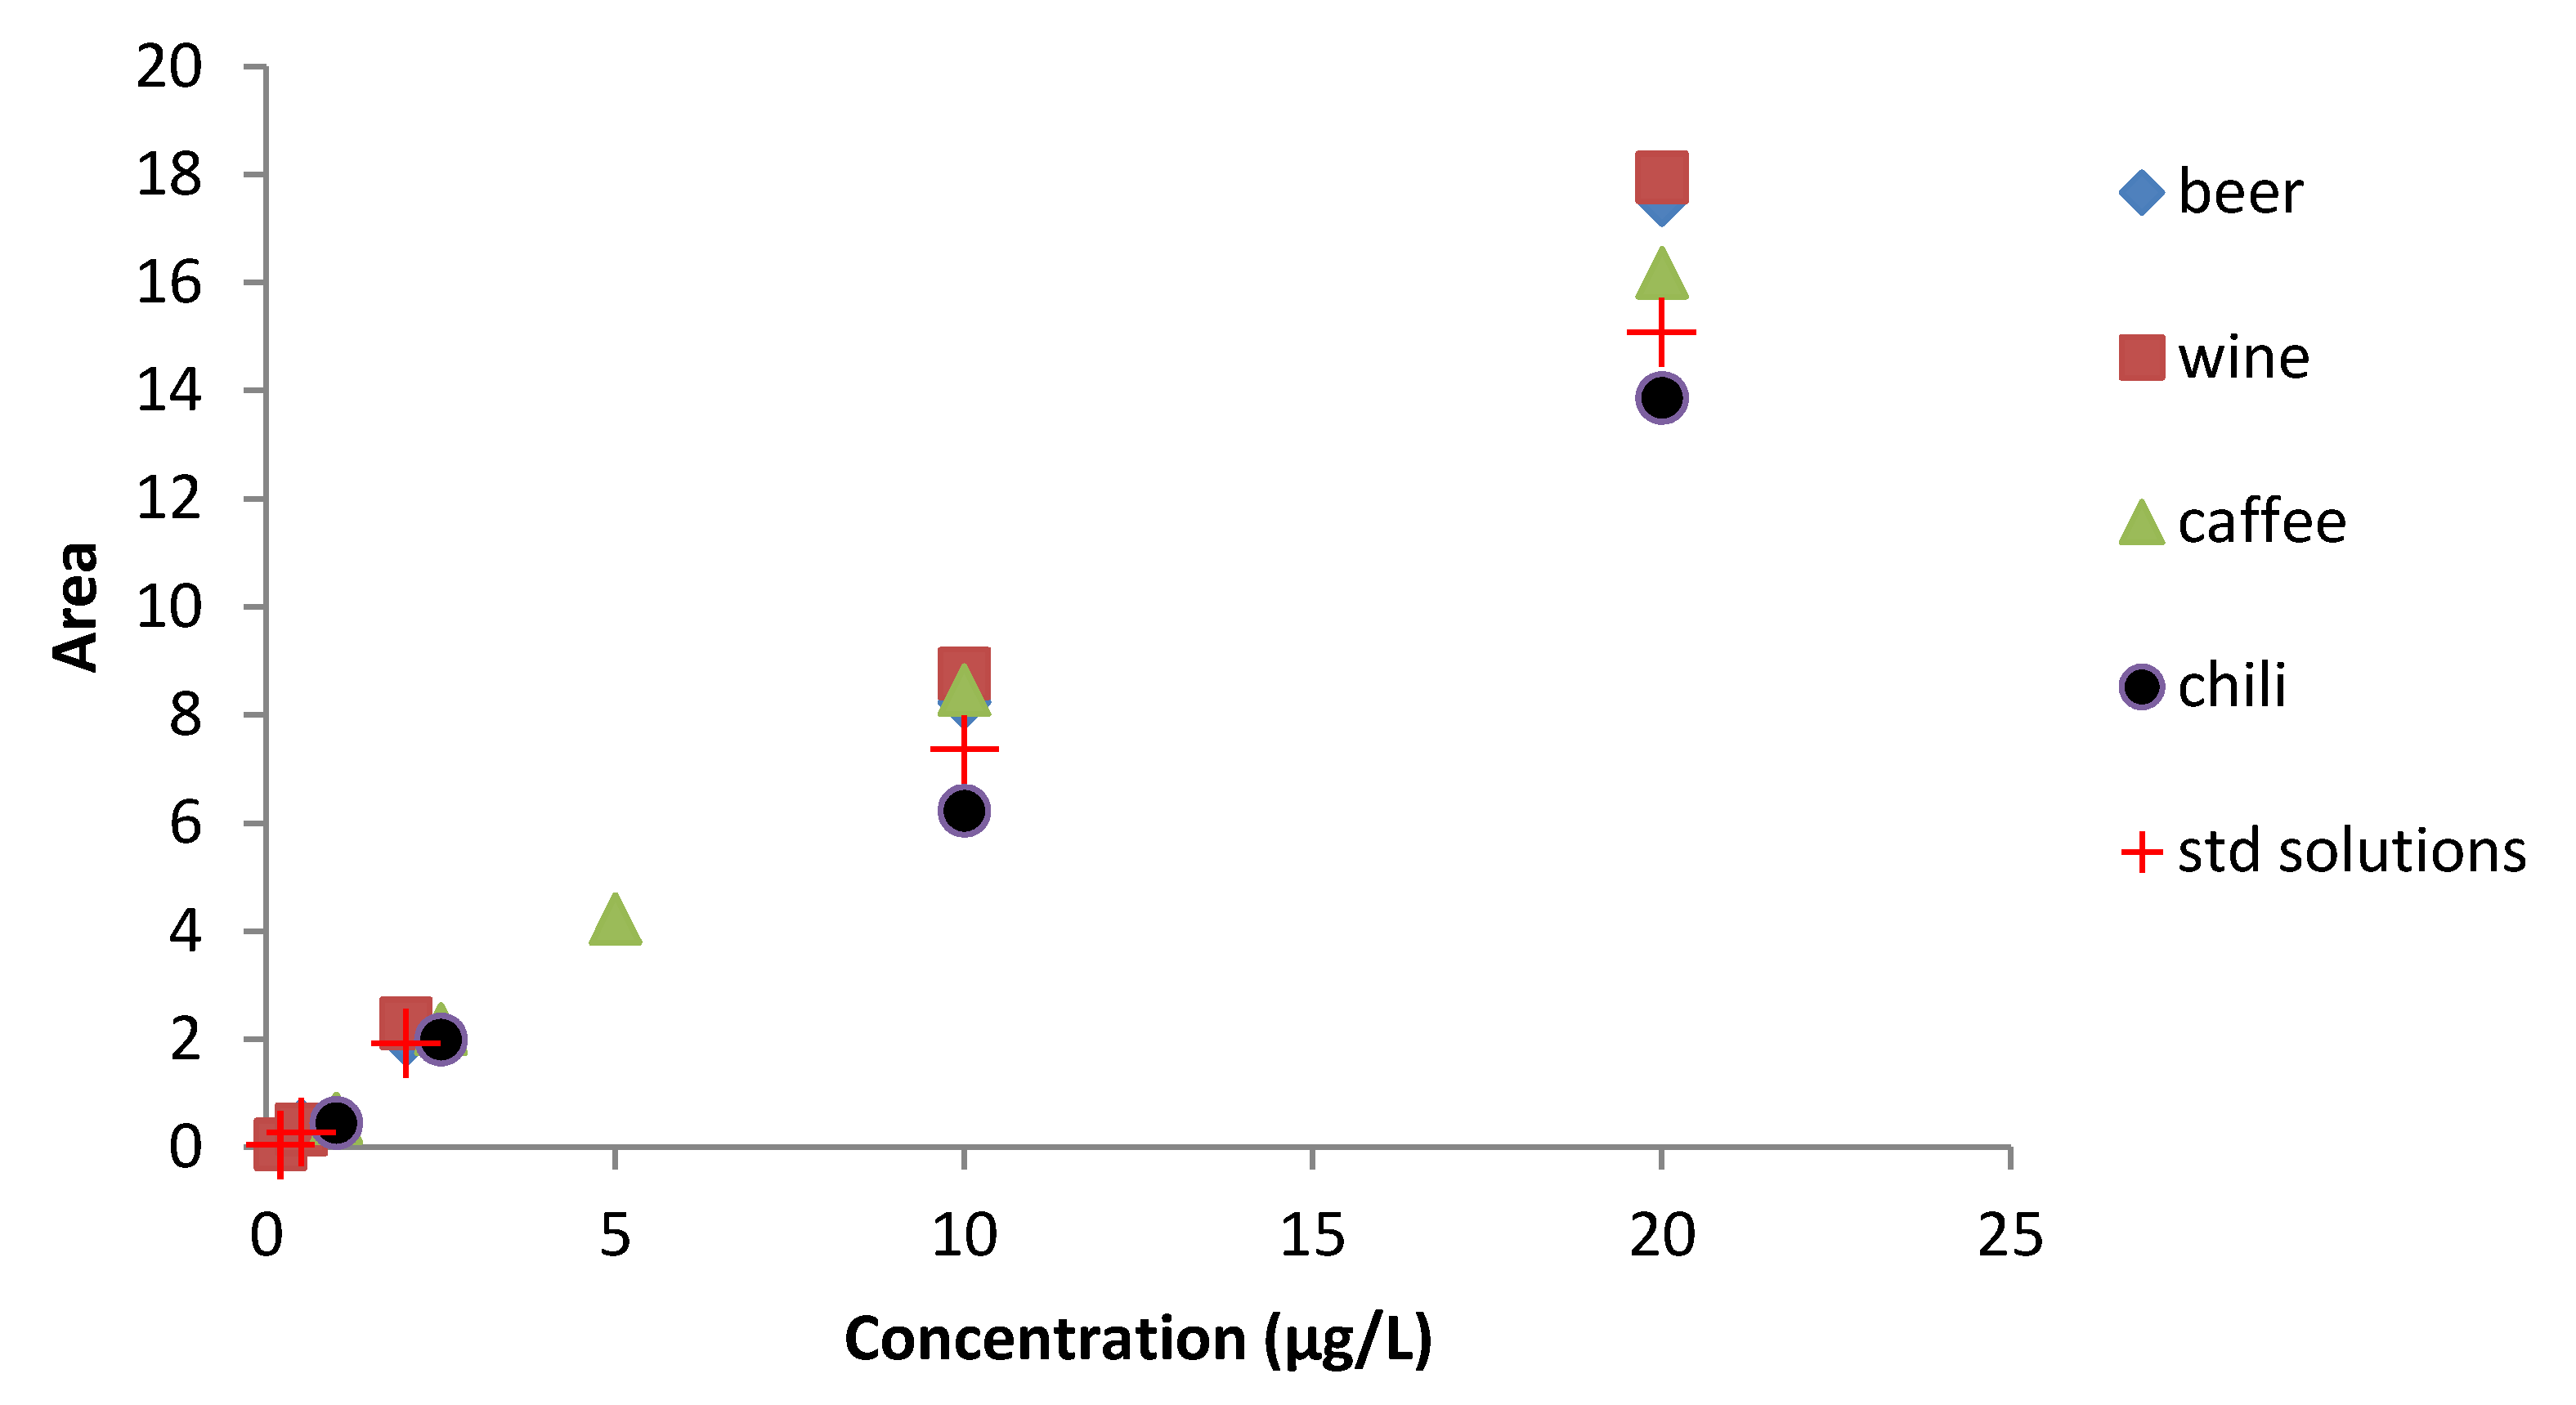
2.5. OTA Analysis in Commercial Food Samples
| Matrix | Calibration range (µg/kg) | r2 |
|---|---|---|
| Wine | 0.2–20 | 0.9986 |
| Beer | 0.2–20 | 0.9910 |
| Coffee | 1–20 | 0.9986 |
| Chili | 1–20 | 0.9997 |
| Matrix | Positive/Total (%) | Average contamination ± SD in positive samples (µg/kg) | Distribution of samples (µg/kg) | |||
|---|---|---|---|---|---|---|
| LOD–2.0 | 2.0–5.0 | 5.0–15.0 | >15.0 | |||
| Wine | 2/30 (6.7%) | 2.34 ± 0.35 | - | 2 | - | - |
| Beer | 5/30 (16.7%) | 0.35 ± 0.06 | 5 | - | - | - |
| Coffee | 8/30 (26.7%) | 1.03 ± 0.17 | 7 | 1 | - | - |
| Chili | 12/30 (40.0%) | 8.45 ± 1.73 | 4 | 5 | 2 | 1 |
3. Experimental Section
3.1. Chemicals and Reagents
3.2. Sample Preparation
3.3. Clean-Up Steps
3.4. HPLC and LC-MS/MS Conditions
3.5. Validation
4. Conclusions
Acknowledgments
Conflicts of Interest
References
- Shephard, G.S.; Berthiller, F.; Burdaspal, P.A.; Crews, C.; Jonker, M.A.; Krska, R.; Lattanzio, V.M.T.; MacDonald, S.; Malone, R.J.; Maragos, C.; et al. Developments in mycotoxin analysis: An update for 2011–2012. World Mycotoxin J. 2013, 6, 3–30. [Google Scholar] [CrossRef]
- Bayman, P.; Baker, J.L. Ochratoxins: A global perspective. Mycopathologia 2006, 162, 215–223. [Google Scholar] [CrossRef]
- Coronel, M.B.; Marin, S.; Cano-Sancho, G.; Ramos, A.J.; Sanchis, V. Exposure assessment to ochratoxin A in Catalonia (Spain) based on the consumption of cereals, nuts, coffee, wine, and beer. Food Addit. Contam. Part A 2012, 29, 979–993. [Google Scholar] [CrossRef]
- Ibanez-Vea, M.; Martinez, R.; Gonzalez-Penas, E.; Lizarraga, E.; Lopez de Cerain, A. Co-occurrence of aflatoxins, ochratoxin A and zearalenone in breakfast cereals from spanish market. Food Control 2011, 22, 1949–1955. [Google Scholar] [CrossRef]
- Liao, C.-D.; Lin, H.-Y.; Chiueh, L.-C.; Shih, D.Y.C. Simultaneous quantification of aflatoxins, ochratoxin A and zearalenone in cereals by LC-MS/MS. J. Food Drug Anal. 2011, 19, 259–268. [Google Scholar]
- Brera, C.; Debegnach, F.; De Santis, B.; Lafrate, E.; Pannunzi, E.; Berdini, C.; Prantera, E.; Gregori, E.; Miraglia, M. Ochratoxin A in cocoa and chocolate products from the italian market: Occurrence and exposure assessment. Food Control 2011, 22, 1663–1667. [Google Scholar] [CrossRef]
- Turcotte, A.M.; Scott, P.M. Ochratoxin A in cocoa and chocolate sampled in Canada. Food Addit. Contam. Part A 2011, 28, 762–766. [Google Scholar] [CrossRef]
- Coronel, M.B.; Marin, S.; Cano, G.; Ramos, A.J.; Sanchis, V. Ochratoxin A in spanish retail ground roasted coffee: Occurrence and assessment of the exposure in Catalonia. Food Control 2011, 22, 414–419. [Google Scholar] [CrossRef]
- Vecchio, A.; Mineo, V.; Planeta, D. Ochratoxin A in instant coffee in Italy. Food Control 2012, 28, 220–223. [Google Scholar] [CrossRef]
- Romagnoli, B.; Menna, V.; Gruppioni, N.; Bergamini, C. Aflatoxins in spices, aromatic herbs, herb-teas and medicinal plants marketed in Italy. Food Control 2007, 18, 697–701. [Google Scholar] [CrossRef]
- Patharajan, S.; Reddy, K.R.N.; Karthikeyan, V.; Spadaro, D.; Lorè, A.; Gullino, M.L.; Garibaldi, A. Potential of yeasts antagonists on in vitro biodegradation of ochratoxin A. Food Control 2011, 22, 290–296. [Google Scholar] [CrossRef]
- Jalili, M.; Jinap, S. Natural occurrence of aflatoxins and ochratoxin A in commercial dried chili. Food Control 2012, 24, 160–164. [Google Scholar] [CrossRef]
- Pfohl-Lezkowicz, A.; Manderville, R.A. An update on direct genotoxicity as molecular mechanism of ochratoxin A carcinogenicity. Chem. Res. Toxicol. 2012, 25, 252–262. [Google Scholar] [CrossRef]
- Pfohl-Lezkowicz, A.; Manderville, R.A. Review on Ochratoxin A: An overview on toxicity and carcinogenicity in animals and humans. Mol. Nutr. Food Res. 2007, 51, 61–99. [Google Scholar] [CrossRef]
- O’Brien, E.; Dietrich, D.R. Ochratoxin A: The continuing enigma. Crit. Rev.Toxicol. 2005, 35, 33–60. [Google Scholar]
- IARC, Some Naturally Occuring Substances: Food Items and Constituents, Heterocyclic Aromatic Amines and Mycotoxins. In IARC Monographs on the Evaluation of Carcinogenic Risk to Humans; IARC Scientific Publication: Lyon, France, 1993; Volume 56, pp. 489–521.
- European Commission. Commission Regulation (EU) No 594/2012 of 5 July 2012 amending Regulation (EC) 1881/2006 as regards the maximum levels of the contaminants ochratoxin A, non- dioxin-like PCBs and melamine in foods. Off. J. Eur. Union 2012, 176, L43–L45.
- European Commission. Commission Regulation (EU) No 165/2010 of 26 February 2006 amending Regulation (EC) No 1881/2006 setting maximum level for certain contaminants in foodstuffs as regards aflatoxins. Off. J. Eur. Union 2010, 50, L8–L12.
- Krueger, C.D.; Fernandes, A.M.; Rosa, C.A.R. Ochratoxin A in wines from 2002 to 2008 harvest marketed in Rio De Janeiro, Brazil. Food Addit. Contam. Part A 2012, 5, 204–207. [Google Scholar] [CrossRef]
- Arroyo-Manzanares, N.; Gamiz-Gracia, L.; Garcia-Campana, A.M. Determination of ochratoxin A in wines by capillary liquid chromatography with laser induced fluorescence detection using dispersive liquid-liquid microextraction. Food Chem. 2012, 135, 368–372. [Google Scholar] [CrossRef]
- Anfossi, L.; Giovannoli, C.; Giraudi, G.; Biagioli, F.; Passini, C.; Baggiani, C. A lateral flow immunoassay for the rapid detection of ochratoxin A in wine and grape must. J. Agric. Food Chem. 2012, 60, 11491–11497. [Google Scholar] [CrossRef]
- Covarelli, L.; Beccari, G.; Marini, A.; Tosi, L. A review on the occurrence and control of ochratoxigenic fungal species and ochratoxin A in dehydrated grapes, non-fortified dessert wines and dried vine fruit in the mediterranean area. Food Control 2012, 26, 347–356. [Google Scholar] [CrossRef]
- Vega, M.; Rios, G.; Von Baer, D.; Mardones, C.; Tessini, C.; Herlitz, E.; Saelzer, R.; Ruiz, M.A. Ochratoxin A occurrence in wines produced in Chile. Food Control 2012, 28, 147–150. [Google Scholar] [CrossRef]
- Geana, E.-I.; Iordache, A.-M.; Ionete, R.E. Ochratoxin A occurrence in romanian wines. Rev. De Chimie 2012, 63, 883–886. [Google Scholar]
- Angel Pavon, M.; Gonzalez, I.; Martin, R.; Garcia, T. Competitive direct ELISA based on a monoclonal antibody for detection of ochratoxin A in dried fig samples. Food Agric. Immun. 2012, 23, 83–91. [Google Scholar] [CrossRef]
- Ozbey, F.; Kabak, B. Natural co-occurrence of aflatoxins and ochratoxin A in spices. Food Control 2012, 28, 354–361. [Google Scholar] [CrossRef]
- Almeida, M.I.; Almeida, N.G.; Carvalho, K.L.; Goncalves, G.A.A.; Silva, C.N.; Santos, E.A.; Garcia, J.C.; Vargas, E.A. Co-occurrence of aflatoxins B1, B2, G1 and G2, ochratoxin A, zearalenone, deoxynivalenol, and citreoviridin in rice in Nrazil. Food Addit. Contam. Part A 2012, 29, 694–703. [Google Scholar] [CrossRef]
- Vidal, J.C.; Duato, P.; Bonel, L.; Castillo, J.R. Molecularly imprinted on-line solid-phase extraction coupled with fluorescence detection for the determination of ochratoxin A in wheat samples. Anal. Lett. 2012, 45, 51–62. [Google Scholar] [CrossRef]
- Wu, J.; Tan, Y.; Wang, Y.; Xu, R. Occurrence of ochratoxin A in grain and manufactured food products in China detected by HPLC with fluorescence detection and confirmed by LC-ESI-MS/MS. Mycopathologia 2012, 173, 199–205. [Google Scholar] [CrossRef]
- Kabak, B. Determination of aflatoxins and ochratoxin A in retail cereal products from Turkey by high performance liquid chromatography with fluorescence detection. Food Control 2012, 28, 1–6. [Google Scholar] [CrossRef]
- Nguyen, M.T.; Tozovanu, M.; Tran, T.L.; Pfohl-Leszkowicz, A. Occurrence of aflatoxin B1, citrinin and ochratoxin A in rice in five provinces of the central region of vietnam. Food Chem. 2007, 105, 42–47. [Google Scholar] [CrossRef]
- Pfohl-Leszkowicz, A.; Tozlovanu, M.; Manderville, R.; Peraica, M.; Castegnaro, M.; Stefanovic, V. New molecular and field evidences for the implication of mycotoxins but not aristolochic acid in human nephropathy and urinary tract tumor. Mol. Nut. Food Res. 2007, 51, 1131–1146. [Google Scholar] [CrossRef]
- Polisenska, I.; Pfohl-Leszkowicz, A.; Hadjeba, K.; Dohnal, V.; Jirsa, O.; Denesova, O.; Jezkova, A.; Macharackova, P. Occurrence of ochratoxin a and citrinin in czech cereals and comparison of two HPLC methods for ochratoxin a detection. Food Addit. Contam. Part A 2010, 27, 1545–1557. [Google Scholar] [CrossRef]
- Da Costa Cunha Bandeira, R.D.; Uekane, T.M.; da Cunha, C.P.; da Cunha, V.S.; Rodrigues, J.M.; De Oliveira Godoy, R.L.; Campino de la Cruz, M.H. Development and validation of a method for detection and quantification of ochratoxin A in green coffee using liquid chromatography coupled to mass spectrometry. Ciênc. Tecnol. Aliment. 2012, 32, 775–782. [Google Scholar]
- Kouadio, I.A.; Koffi, L.B.; Nemlin, J.G.; Dosso, M.B. Effect of Robusta (Coffea canephora p.) coffee cherries quantity put out for sun drying on contamination by fungi and ochratoxin A (OTA) under tropical humid zone (Cote d’Ivoire). Food Chem.Toxicol. 2012, 50, 1969–1979. [Google Scholar] [CrossRef]
- Tozlovanu, M.; Pfohl-Leszkowicz, A. Ochratoxin a in roasted coffee from french supermarkets and transfer in coffee beverages: Comparison of analysis methods. Toxins 2010, 2, 1928–1942. [Google Scholar] [CrossRef]
- Drunday, V.; Pacin, A. Occurrence of OTA in coffe bean, ground roasted coffee nad soluble coffee, and validation method. Food Control 2013, 30, 675–678. [Google Scholar] [CrossRef]
- Keller, L.A.M.; Pereyra, M.L.G.; Keller, K.M.; Alonso, V.A.; Oliveira, A.A.; Almeida, T.X.; Barbosa, T.S.; Nunes, L.M.T.; Cavaglieri, L.R.; Rosa, C.A.R. Fungal and mycotoxins contamination in corn silage: Monitoring risk before and after fermentation. J. Stored Products Res. 2013, 52, 42–47. [Google Scholar] [CrossRef]
- Sieber, M.; Wagner, S.; Rached, E.; Amberg, A.; Mally, A.; Dekant, W. Metabonomic study of ochratoxin A toxicity in rats after repeated administration: Phenotypic anchoring enhances the ability for biomarker discovery. Chem.Res.Toxicol. 2009, 22, 1221–1231. [Google Scholar] [CrossRef]
- Solfrizzo, M.; Alldrick, A.J.; Van Egmond, H.P.; Moni, Q.A.M.P.W. The use of mycotoxin methodology in practice: A need for harmonization. Qual. Assur. Saf. Crops food 2009, 1, 121–132. [Google Scholar] [CrossRef]
- Giesen, C.; Jakubowski, N.; Panne, U.; Weller, M.G. Comparison of ICP-MS and photometric detection of an immunoassay for the determination of ochratoxin a in wine. J. Anal. At. Spectrom. 2010, 25, 1567–1572. [Google Scholar] [CrossRef]
- Cao, J.; Kong, W.; Zhou, S.; Yin, L.; Wan, L.; Yang, M. Molecularly imprinted polymer-based solid phase clean-up for analysis of ochratoxin A in beer, red wine, and grape juice. J. Sep. Sci. 2013, 36, 1291–1297. [Google Scholar] [CrossRef]
- Al-Taher, F.; Banaszewski, K.; Jackson, L.; Zweigenbaum, J.; Ryu, D.; Cappozzo, J. Rapid method for the determination of multiple mycotoxins in wines and beers by LC-MS-MS using a stable isotope dilution assay. J. Agric. Food Chem. 2013, 61, 2378–2384. [Google Scholar] [CrossRef]
- Zhao, Q.; Geng, X.; Wang, H.L. Fluorescent sensing ochratoxin a with single fluorophore-labeled aptamer. Anal. Bioanal. Chem. 2013, 405, 6281–6286. [Google Scholar] [CrossRef]
- Chen, J.; Fang, Z.; Liu, J.; Zeng, L. A simple and rapid biosensor for ochratoxin a based on a structure-switching signaling aptamer. Food Control 2012, 25, 555–560. [Google Scholar] [CrossRef]
- Rhouati, A.; Hayat, A.; Hernandez, D.B.; Meraihi, Z.; Munoz, R.; Marty, J.-L. Development of an automated flow-based electrochemical aptasensor for on-line detection of ochratoxin A. Sens. Actuators B 2013, 176, 1160–1166. [Google Scholar] [CrossRef]
- Novo, P.; Moulas, G.; Prazeres, D.M.F.; Chu, V.; Conde, J.P. Detection of ochratoxin a in wine and beer by chemiluminescence-based ELISA in microfluidics with integrated photodiodes. Sens. Actuators B 2013, 176, 232–240. [Google Scholar] [CrossRef]
- Ricciardi, C.; Castagna, R.; Ferrante, I.; Frascella, F.; Marasso, S.L.; Ricci, A.; Canavese, G.; Lore, A.; Prelle, A.; Gullino, M.L.; et al. Development of a microcantilever-based immunosensing method for mycotoxin detection. Biosens.Bioelectr. 2013, 40, 233–239. [Google Scholar] [CrossRef]
- Entwisle, A.C.; Williams, A.C.; Mann, P.J.; Russell, J.; Slack, P.T.; Gilbert, J. Combined phenyl silane and immunoaffinity column cleanup with liquid chromatography for determination of ochratoxin a in roasted coffee: Collaborative study. J. AOAC Int. 2001, 84, 444–450. [Google Scholar]
- Castegnaro, M.; Tozlovanu, M.; Wild, C.; Molinie, A.; Sylla, A.; Pfohl-Leszkowicz, A. Advantages and drawbacks of immunoaffinity columns in analysis of mycotoxins in food. Mol. Nutr. Food Res. 2006, 50, 480–487. [Google Scholar] [CrossRef]
- Lee, T.P.; Saad, B.; Khayoon, W.S.; Salleh, B. Molecularly imprinted polymer as sorbent in micro-solid phase extraction of ochratoxin A in coffee, grape juice and urine. Talanta 2012, 88, 129–135. [Google Scholar] [CrossRef]
- Verrone, R.; Catucci, L.; Cosma, P.; Fini, P.; Agostiano, A.; Lippolis, V.; Pascale, M. Effect of beta-cyclodextrin on spectroscopic properties of ochratoxin a in aqueous solution. J. Inclusion. Phenom. Macrocycl. Chem. 2007, 57, 475–479. [Google Scholar] [CrossRef]
- Spadaro, D.; Lore, A.; Garibaldi, A.; Gullino, M.L. Occurrence of ochratoxin A before bottling in doc and docg wines produced in Piedmont (Northern Italy). Food Control 2010, 21, 1294–1297. [Google Scholar] [CrossRef]
- Fowles, G. The complete home wine-maker. New Sci. 1989, 123, 38–43. [Google Scholar]
- Baxter, E.D.; Slaiding, I.R.; Kelly, B. Behavior of ochratoxin A in brewing. J. Am. Soc. Brew. Chem. 2001, 59, 98–100. [Google Scholar]
- Prelle, A.; Spadaro, D.; Garibaldi, A.; Gullino, M.L. A new method for detection of five alternaria toxins in food matrices based on LC-APCI-MS. Food Chem. 2013, 140, 161–167. [Google Scholar] [CrossRef]
- Skarkova, J.; Ostry, V.; Malir, F.; Roubal, T. Determination of ochratoxin A in food by high performance liquid chromatography. Anal. Lett. 2013, 46, 1495–1504. [Google Scholar] [CrossRef]
- Iqbal, S.Z.; Asi, M.R.; Zuber, M.; Akhtar, J.; Saif, M.J. Natural occurrence of aflatoxins and ochratoxin A in commercial chilli and chilli sauce samples. Food Control 2013, 30, 621–625. [Google Scholar] [CrossRef]
- Golge, O.; Hepsag, F.; Kabak, B. Incidence and level of aflatoxin contamination in chilli commercialised in Turkey. Food Control 2013, 33, 514–520. [Google Scholar] [CrossRef]
- Remiro, R.; Irigoyen, A.; Gonzalez-Penas, E.; Lizarraga, E.; Lopez de Cerain, A. Levels of ochratoxins in mediterranean red wines. Food Control 2013, 32, 63–68. [Google Scholar] [CrossRef]
- European Commission. Commission Decision (EC) No 657/2002 of 12 August 2002 implementing Council Directive 96/23/EC concerning the performance of analytical methods and the interpretation of results. Off. J. Eur. Union 2002, 221, 8–36.
- Matuszewski, B.K.; Constanzer, M.L.; Chavez-Eng, C.M. Strategies for the assessment of matrix effect in quantitative bioanalytical methods based on HPLC-MS/MS. Anal. Chem. 2003, 75, 3019–3030. [Google Scholar] [CrossRef]
Supplementary Files
© 2013 by the authors; licensee MDPI, Basel, Switzerland. This article is an open access article distributed under the terms and conditions of the Creative Commons Attribution license (http://creativecommons.org/licenses/by/3.0/).
Share and Cite
Prelle, A.; Spadaro, D.; Denca, A.; Garibaldi, A.; Gullino, M.L. Comparison of Clean-Up Methods for Ochratoxin A on Wine, Beer, Roasted Coffee and Chili Commercialized in Italy. Toxins 2013, 5, 1827-1844. https://doi.org/10.3390/toxins5101827
Prelle A, Spadaro D, Denca A, Garibaldi A, Gullino ML. Comparison of Clean-Up Methods for Ochratoxin A on Wine, Beer, Roasted Coffee and Chili Commercialized in Italy. Toxins. 2013; 5(10):1827-1844. https://doi.org/10.3390/toxins5101827
Chicago/Turabian StylePrelle, Ambra, Davide Spadaro, Aleksandra Denca, Angelo Garibaldi, and Maria Lodovica Gullino. 2013. "Comparison of Clean-Up Methods for Ochratoxin A on Wine, Beer, Roasted Coffee and Chili Commercialized in Italy" Toxins 5, no. 10: 1827-1844. https://doi.org/10.3390/toxins5101827
APA StylePrelle, A., Spadaro, D., Denca, A., Garibaldi, A., & Gullino, M. L. (2013). Comparison of Clean-Up Methods for Ochratoxin A on Wine, Beer, Roasted Coffee and Chili Commercialized in Italy. Toxins, 5(10), 1827-1844. https://doi.org/10.3390/toxins5101827