Time-Resolved Visualization of Cyanotoxin Synthesis via Labeling by the Click Reaction in the Bloom-Forming Cyanobacteria Microcystis aeruginosa and Planktothrix agardhii


Abstract

1. Introduction
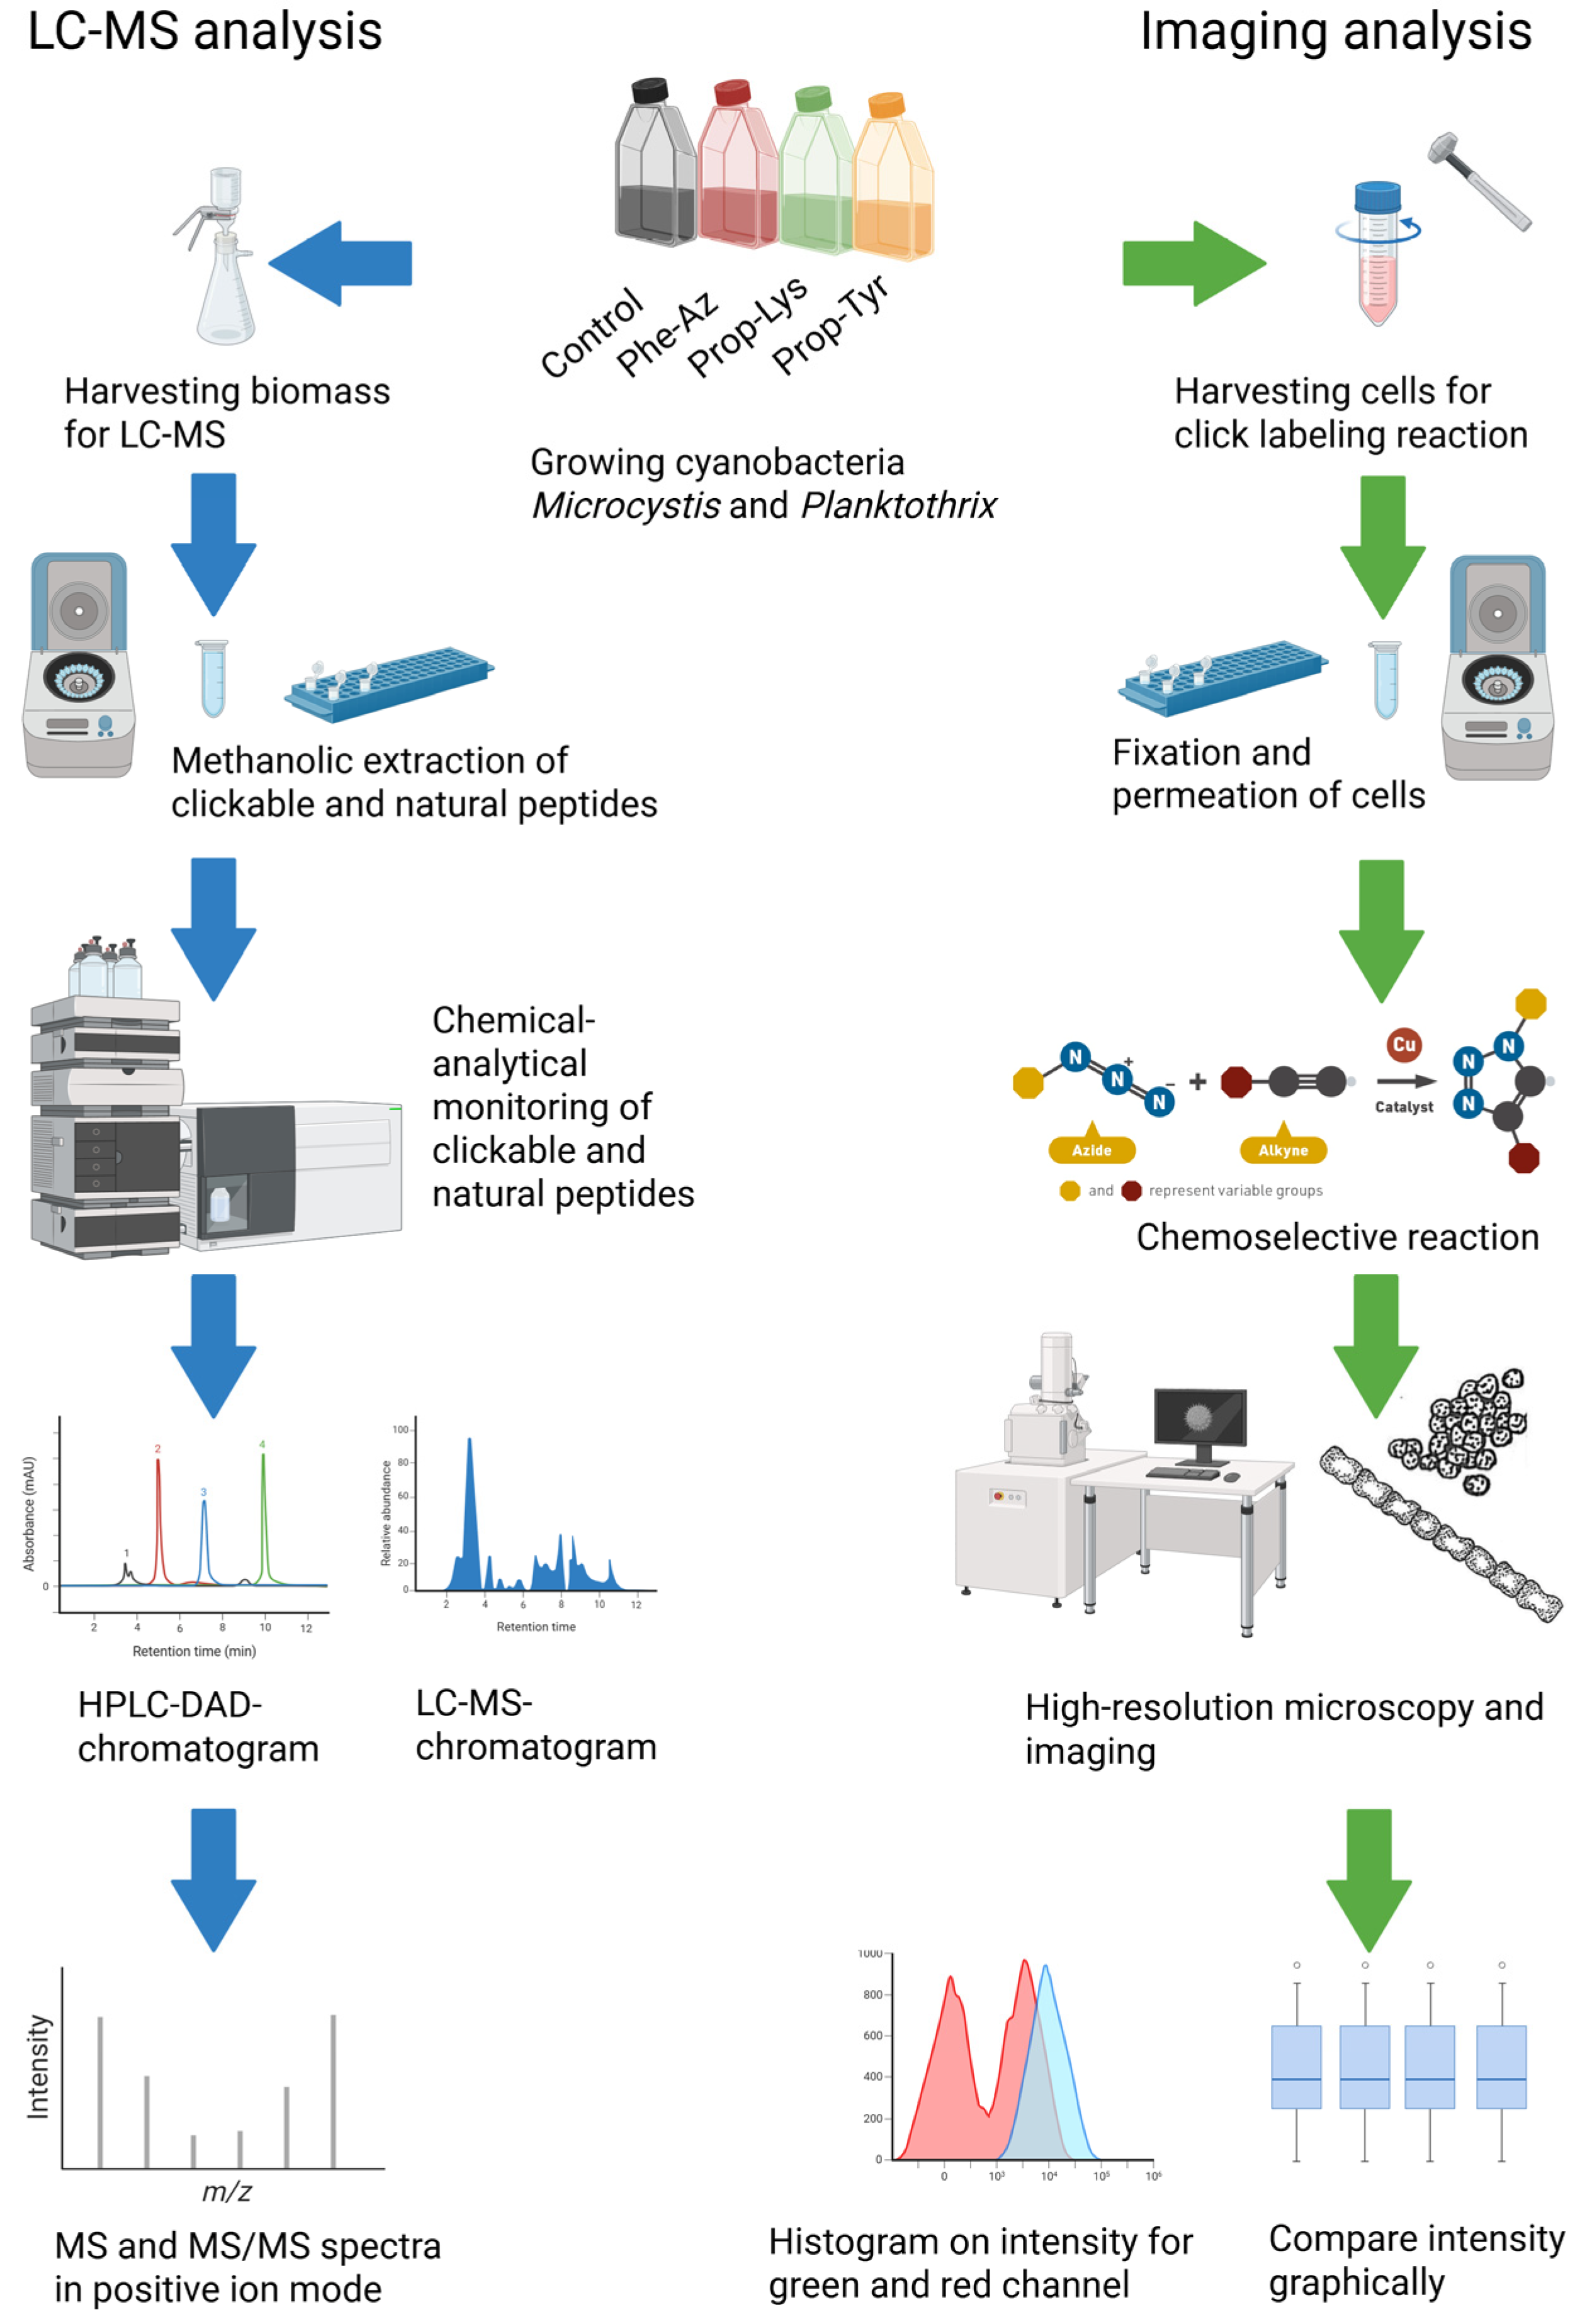
2. Results
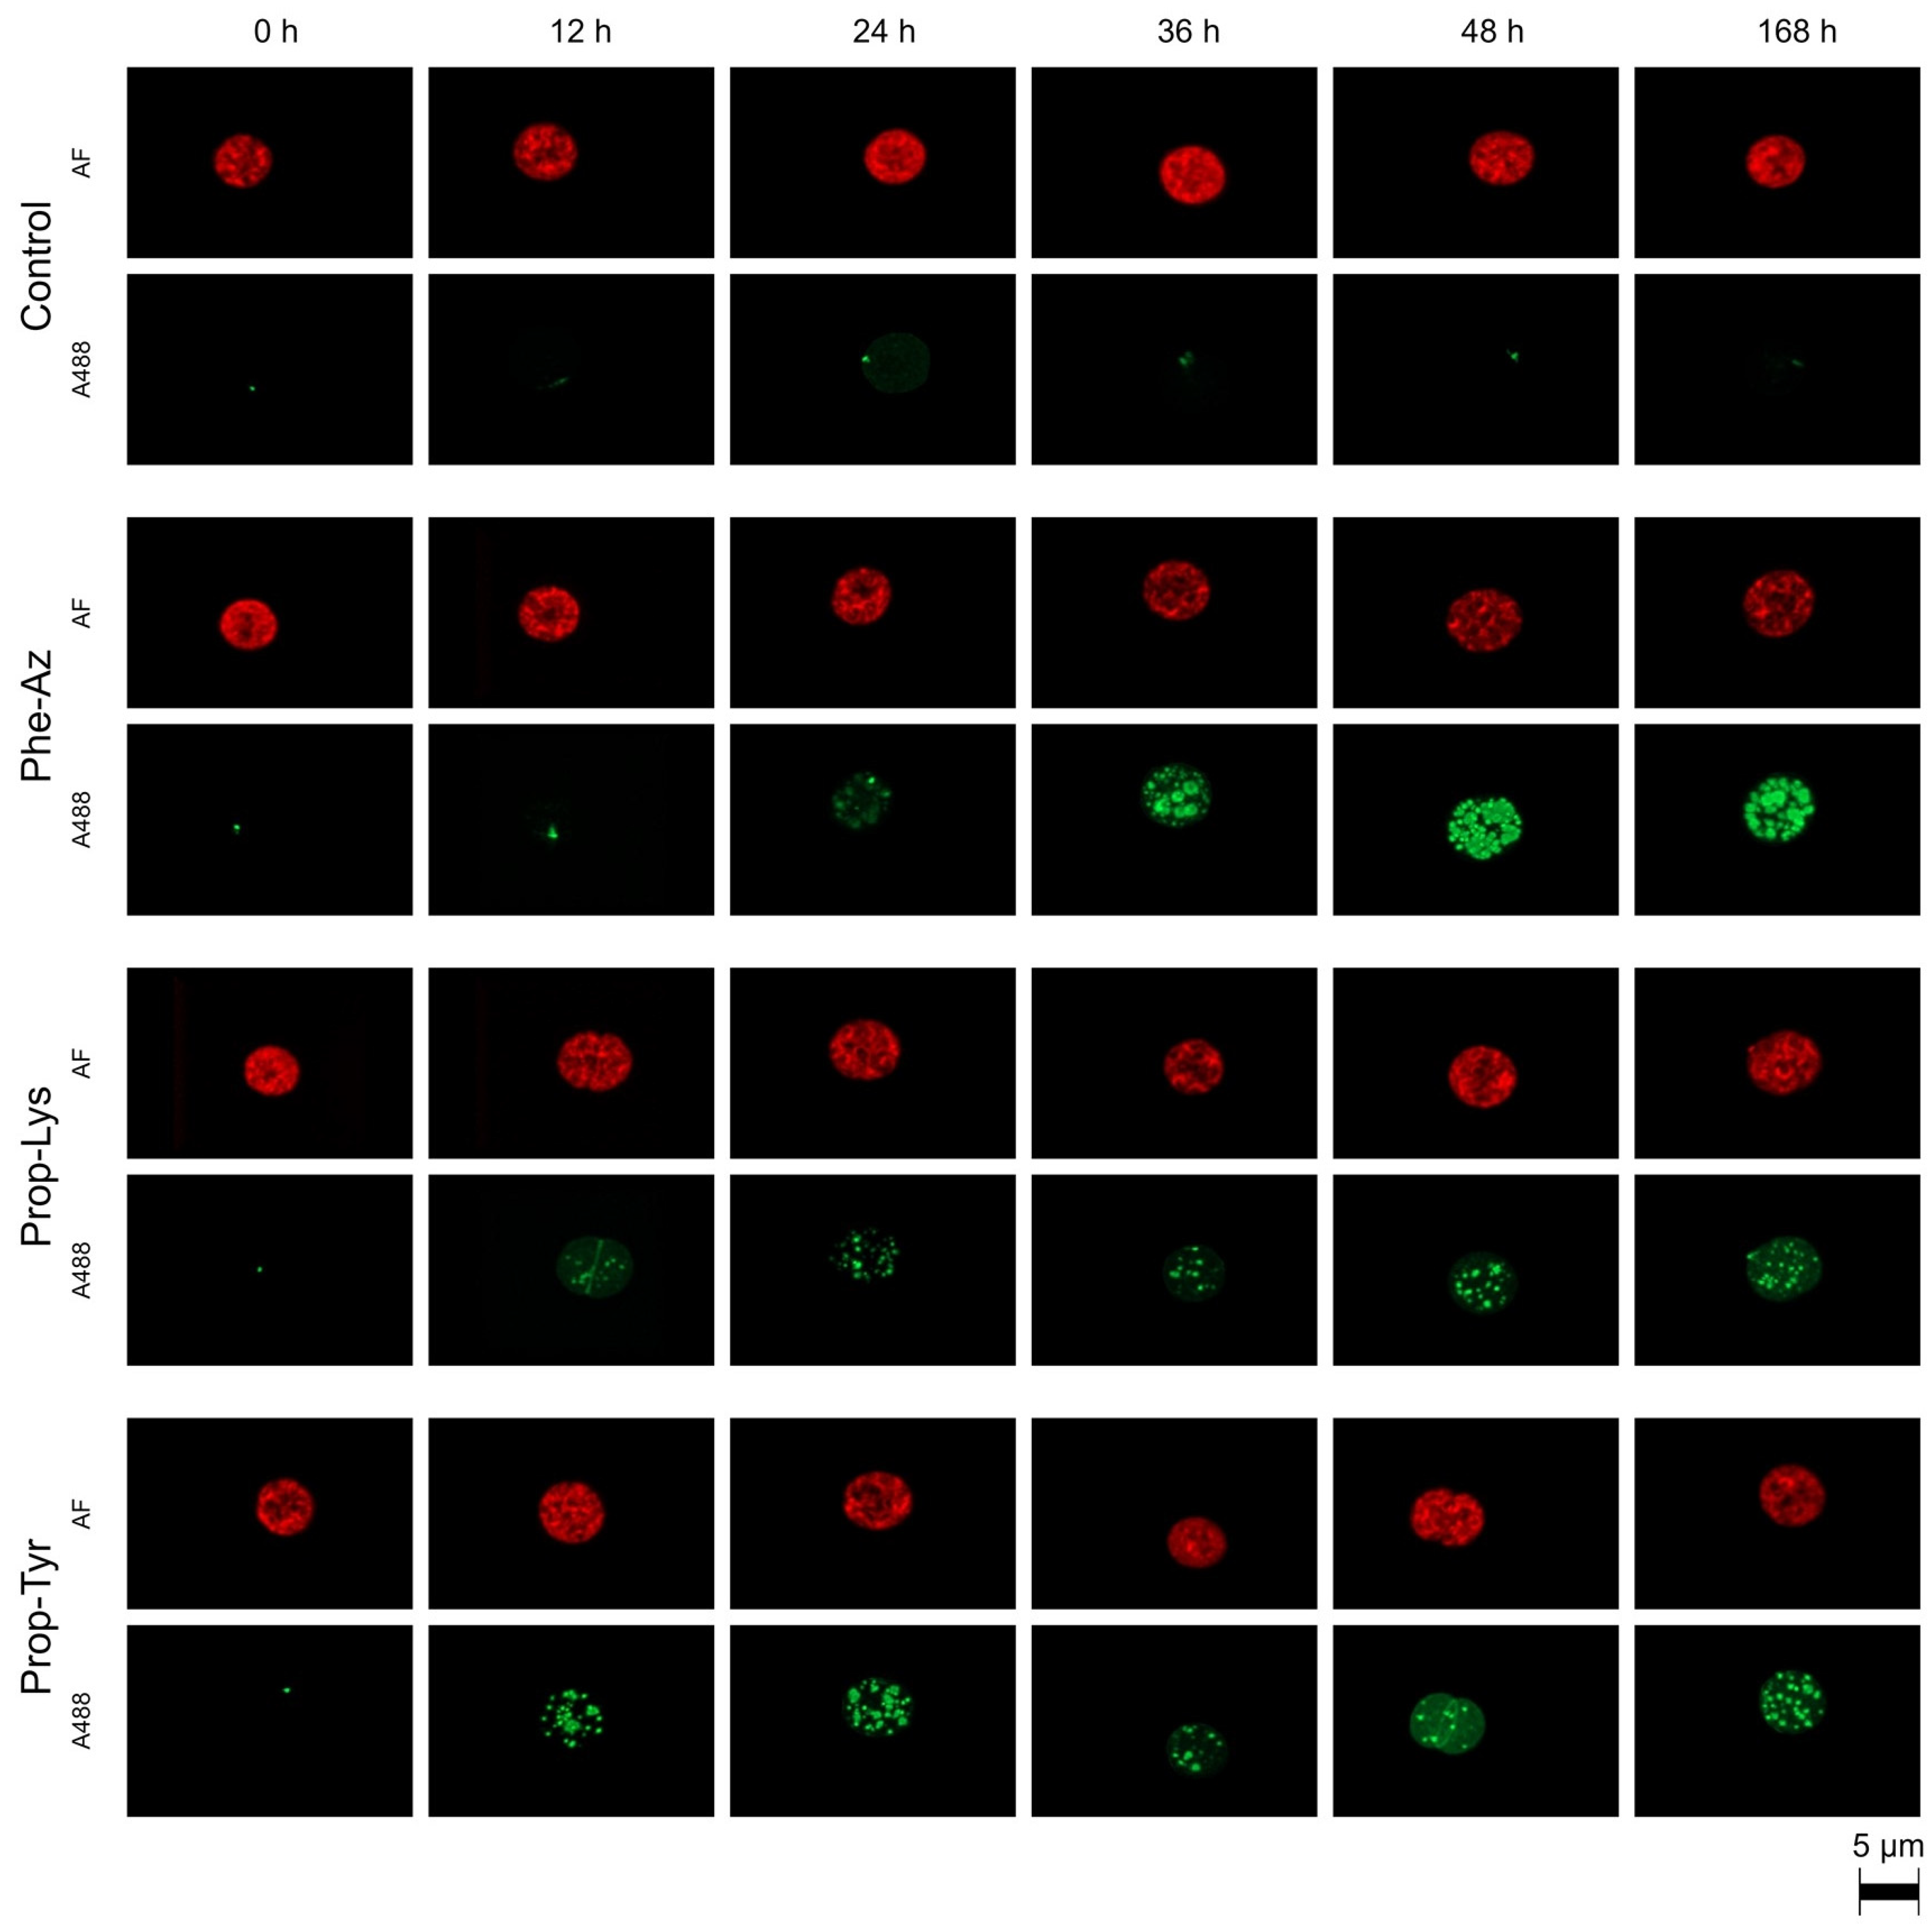
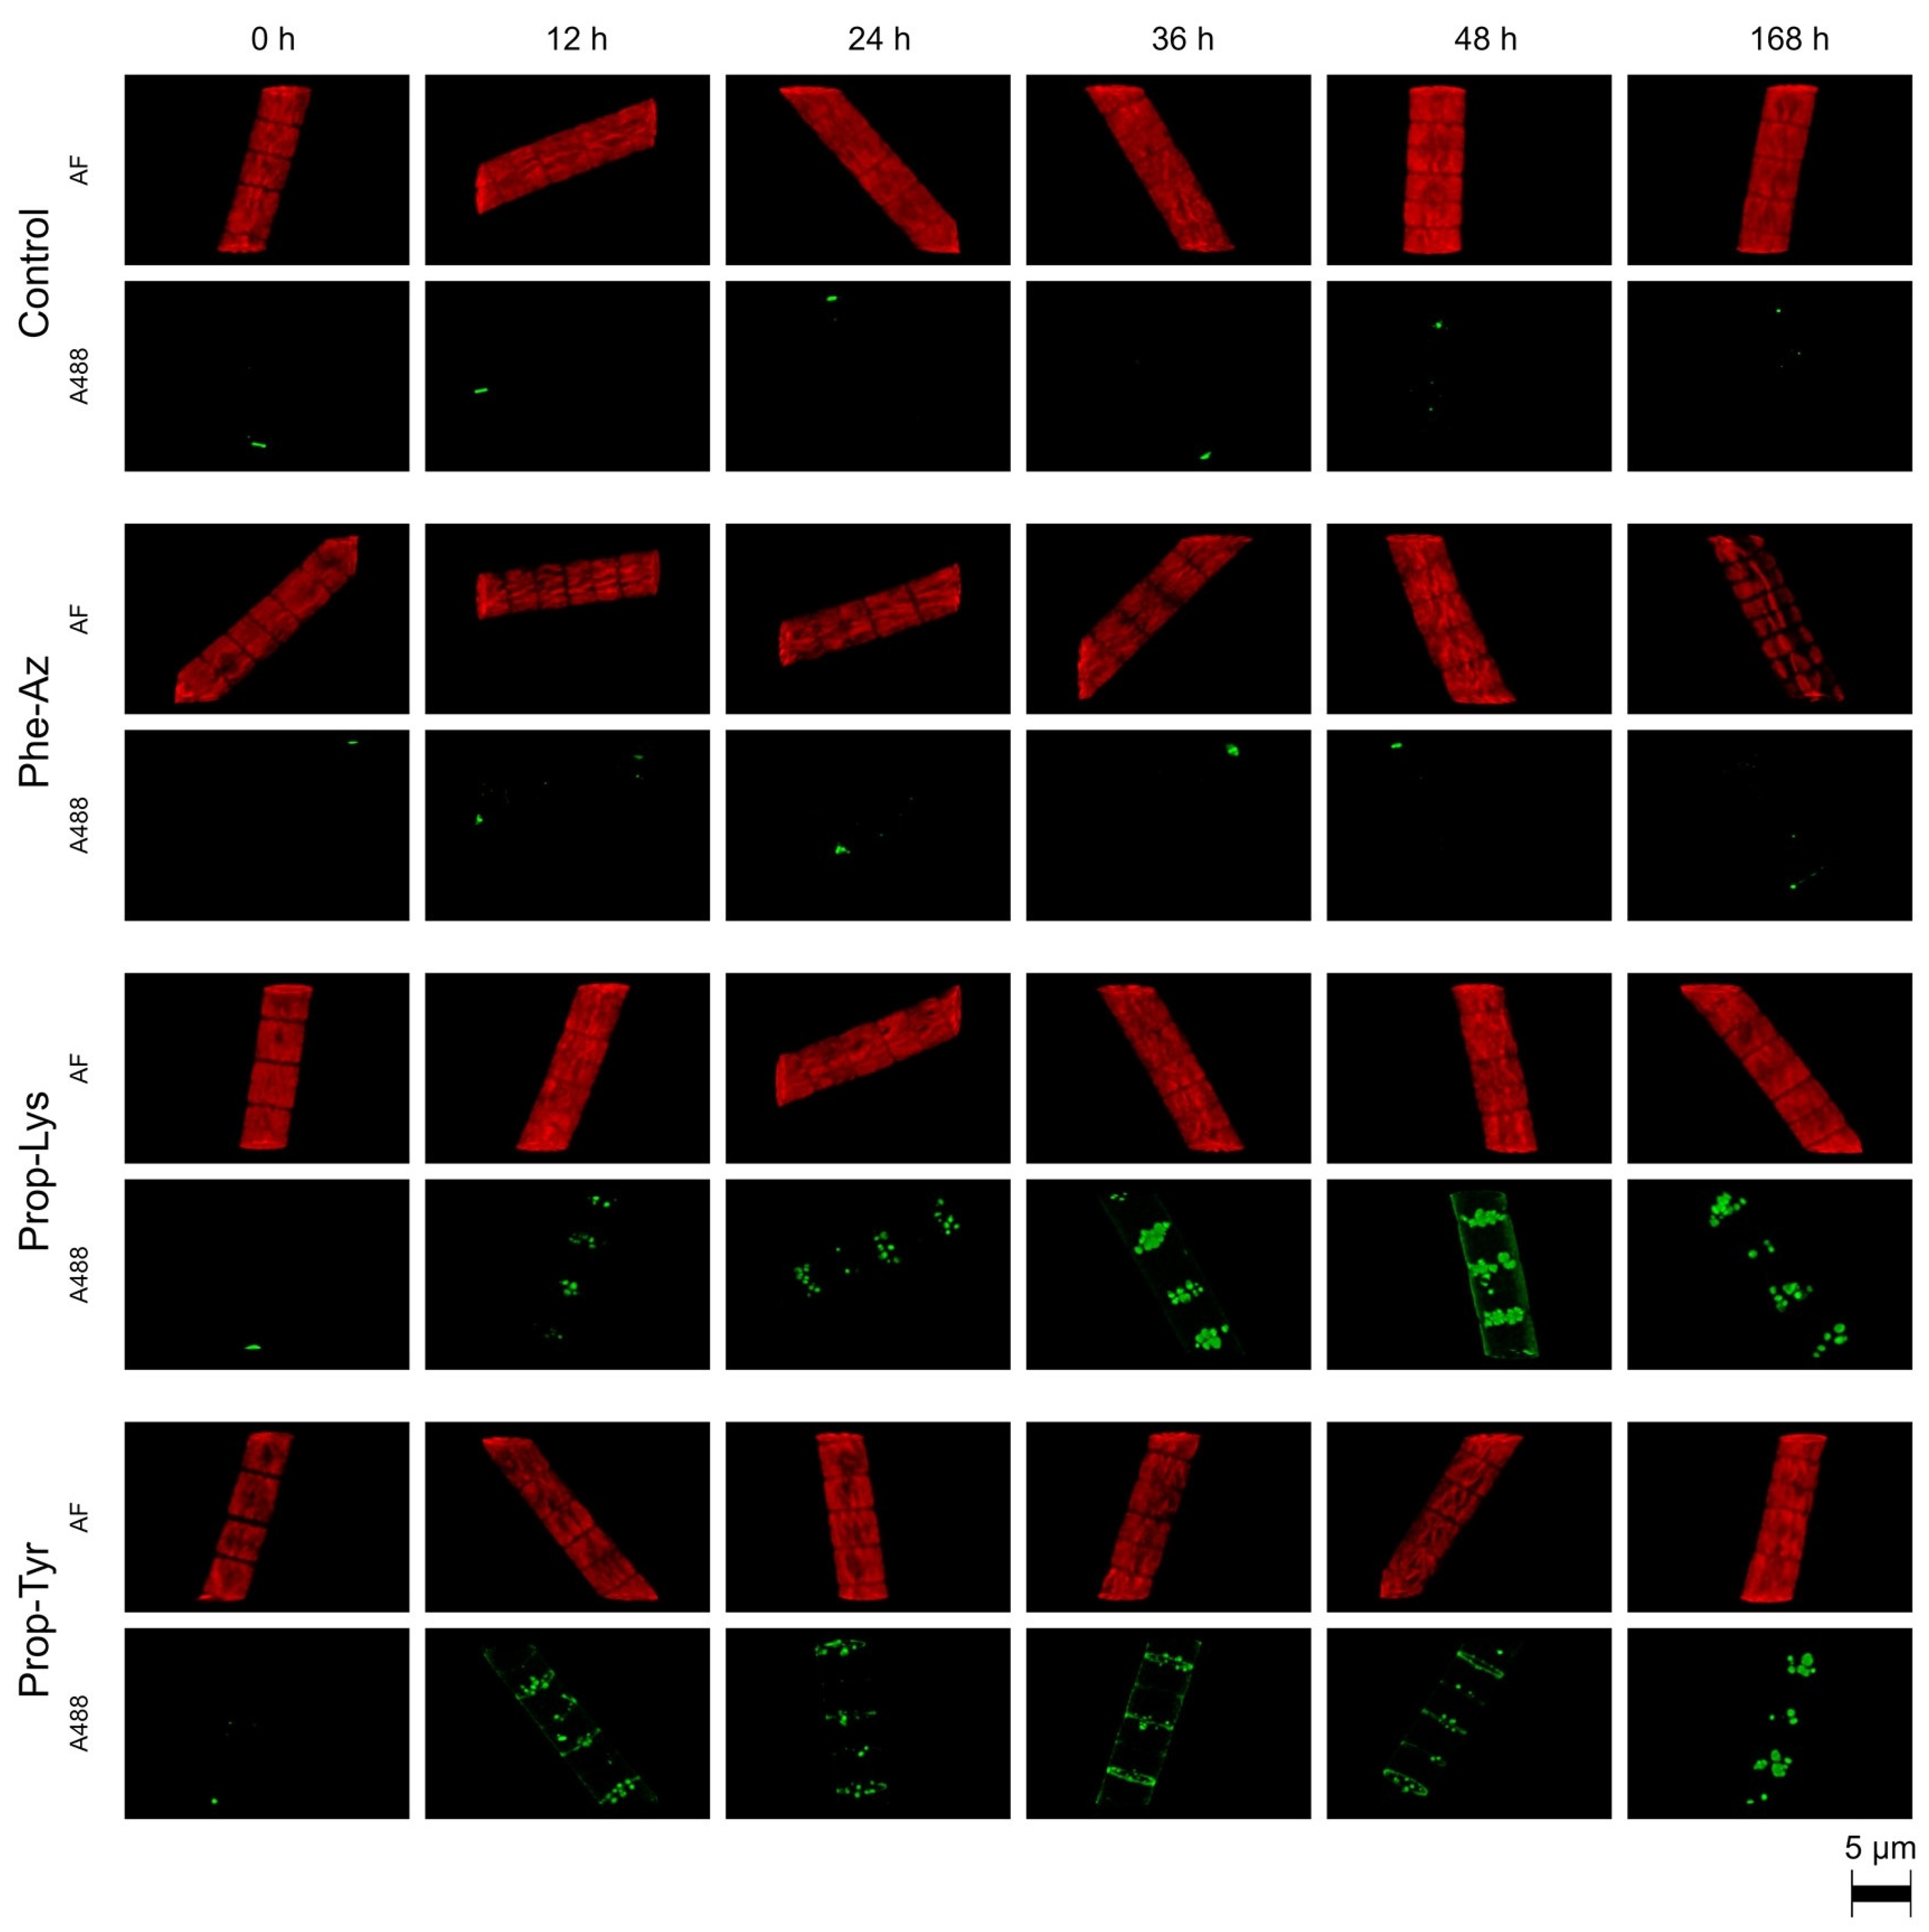
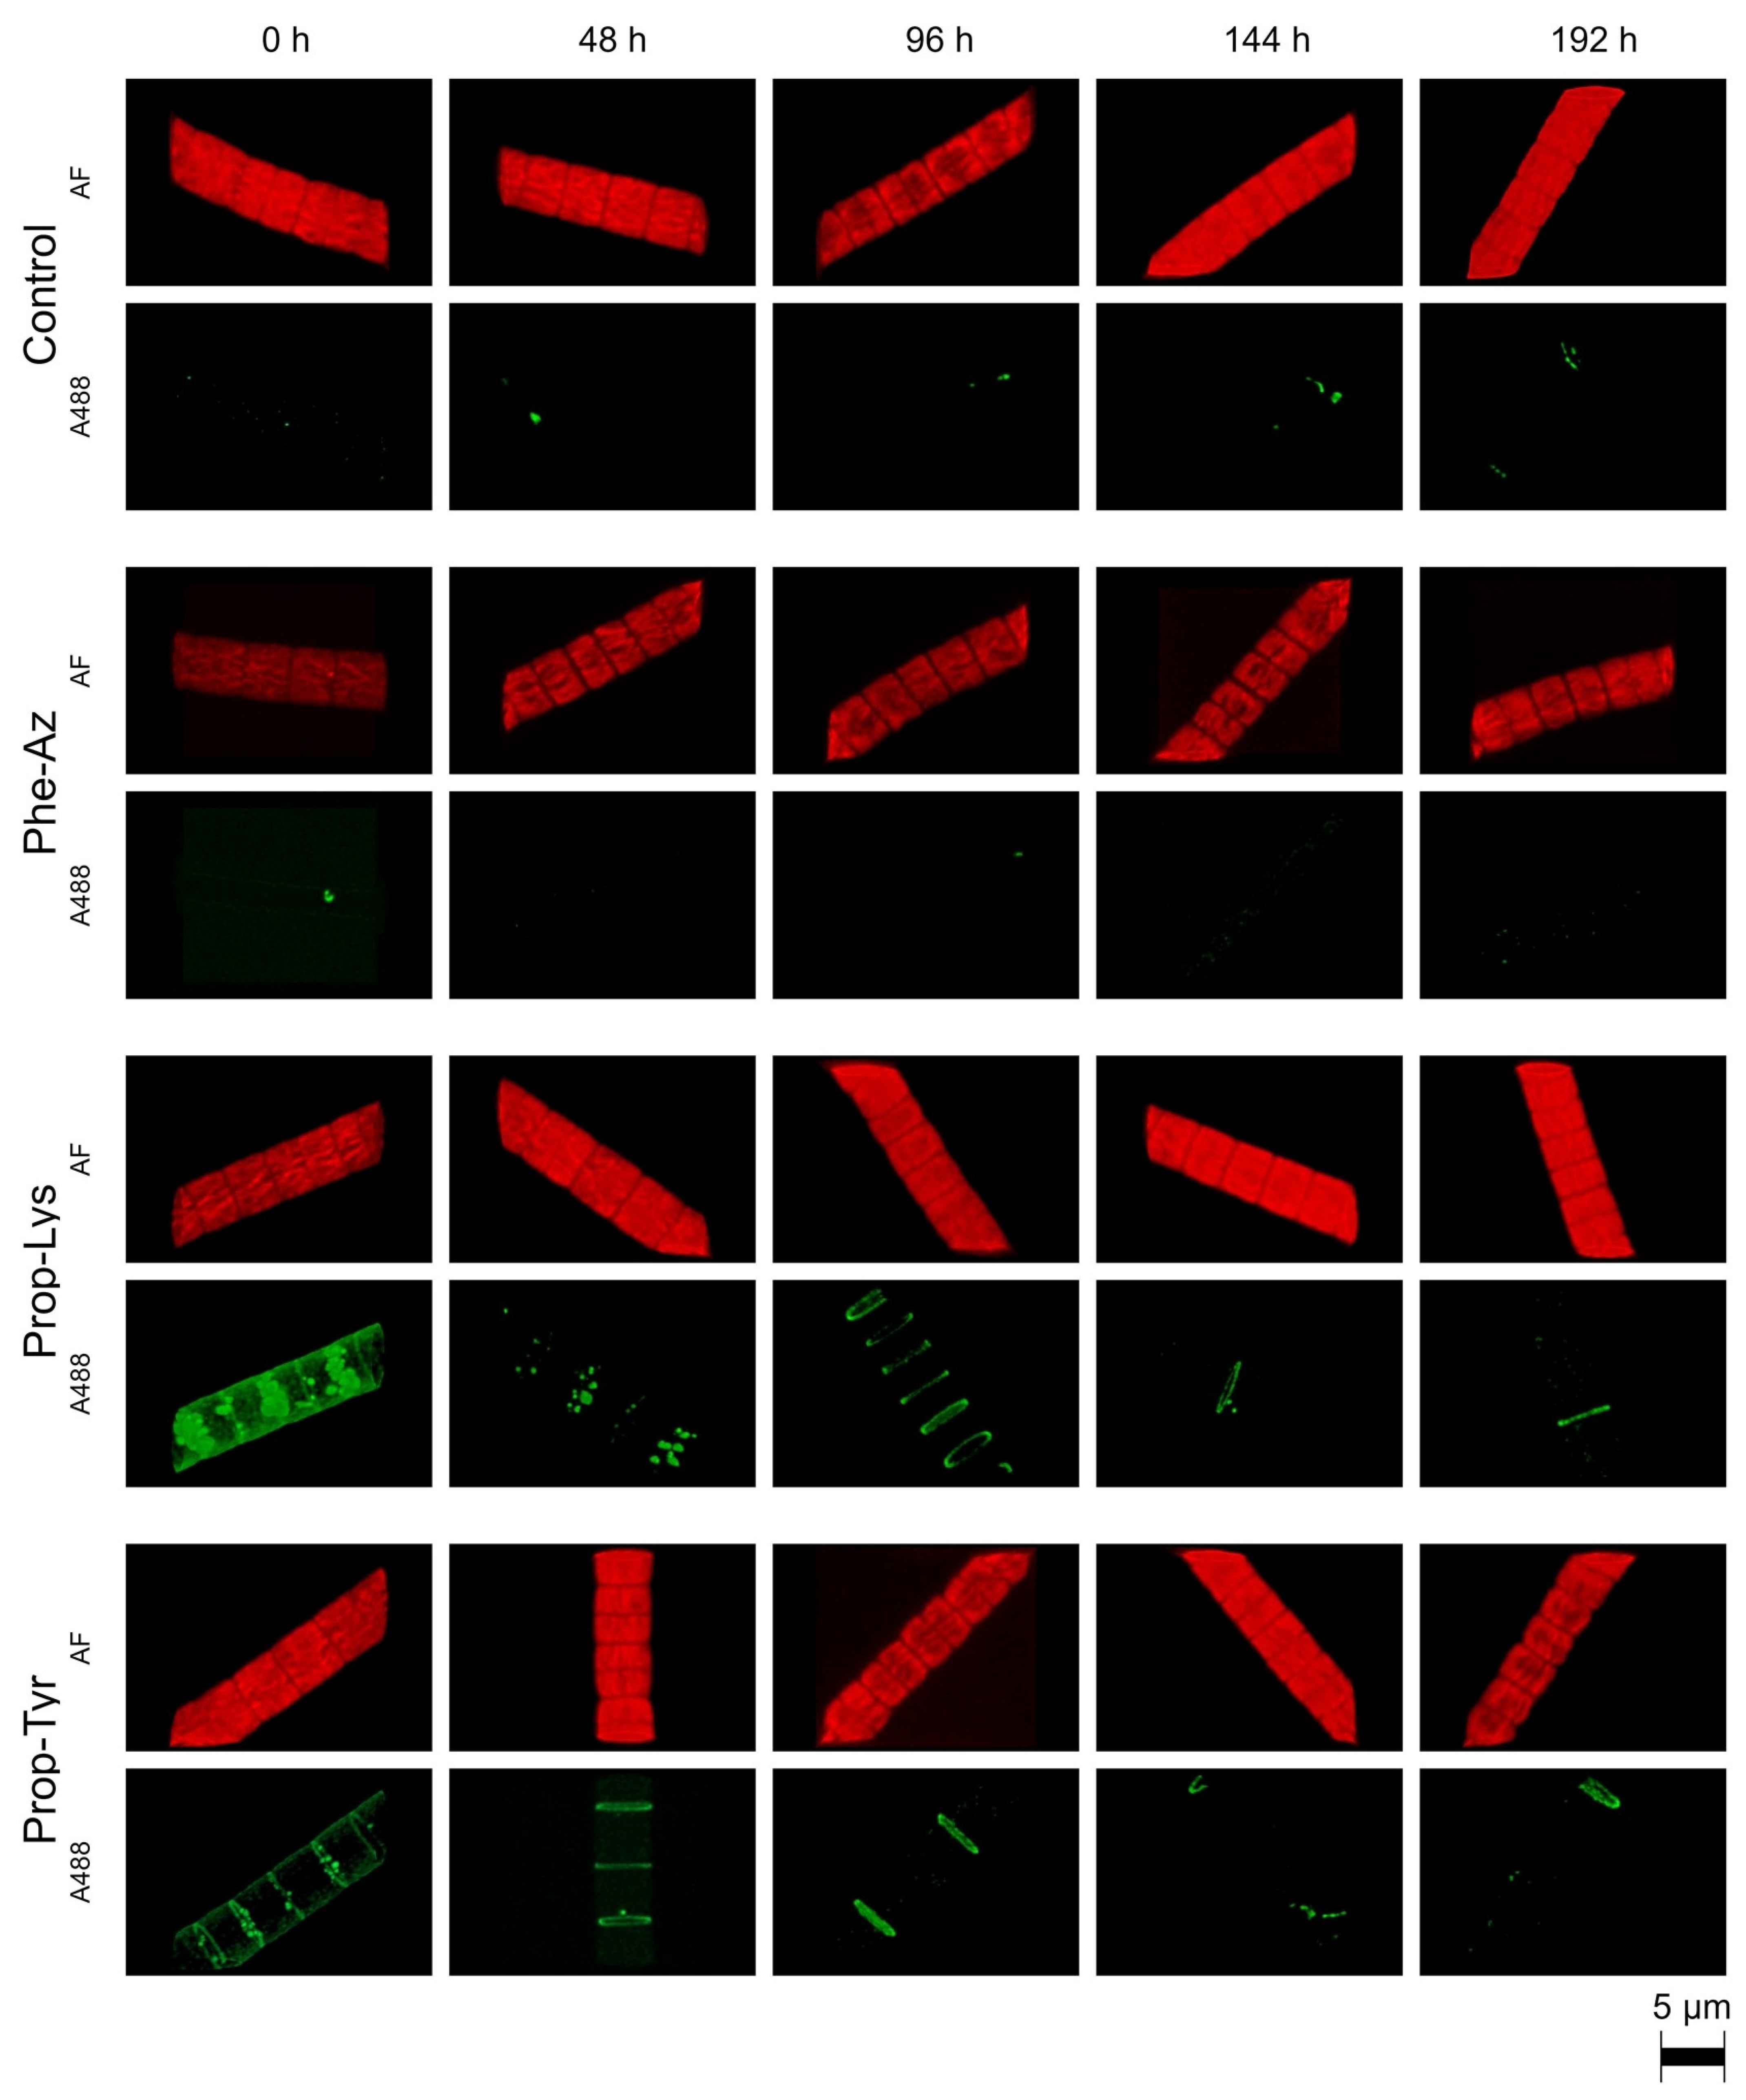
2.1. Qualitative Observation of A488 Signal Generation During Time-Lapse Build up via High-Resolution Microscopy
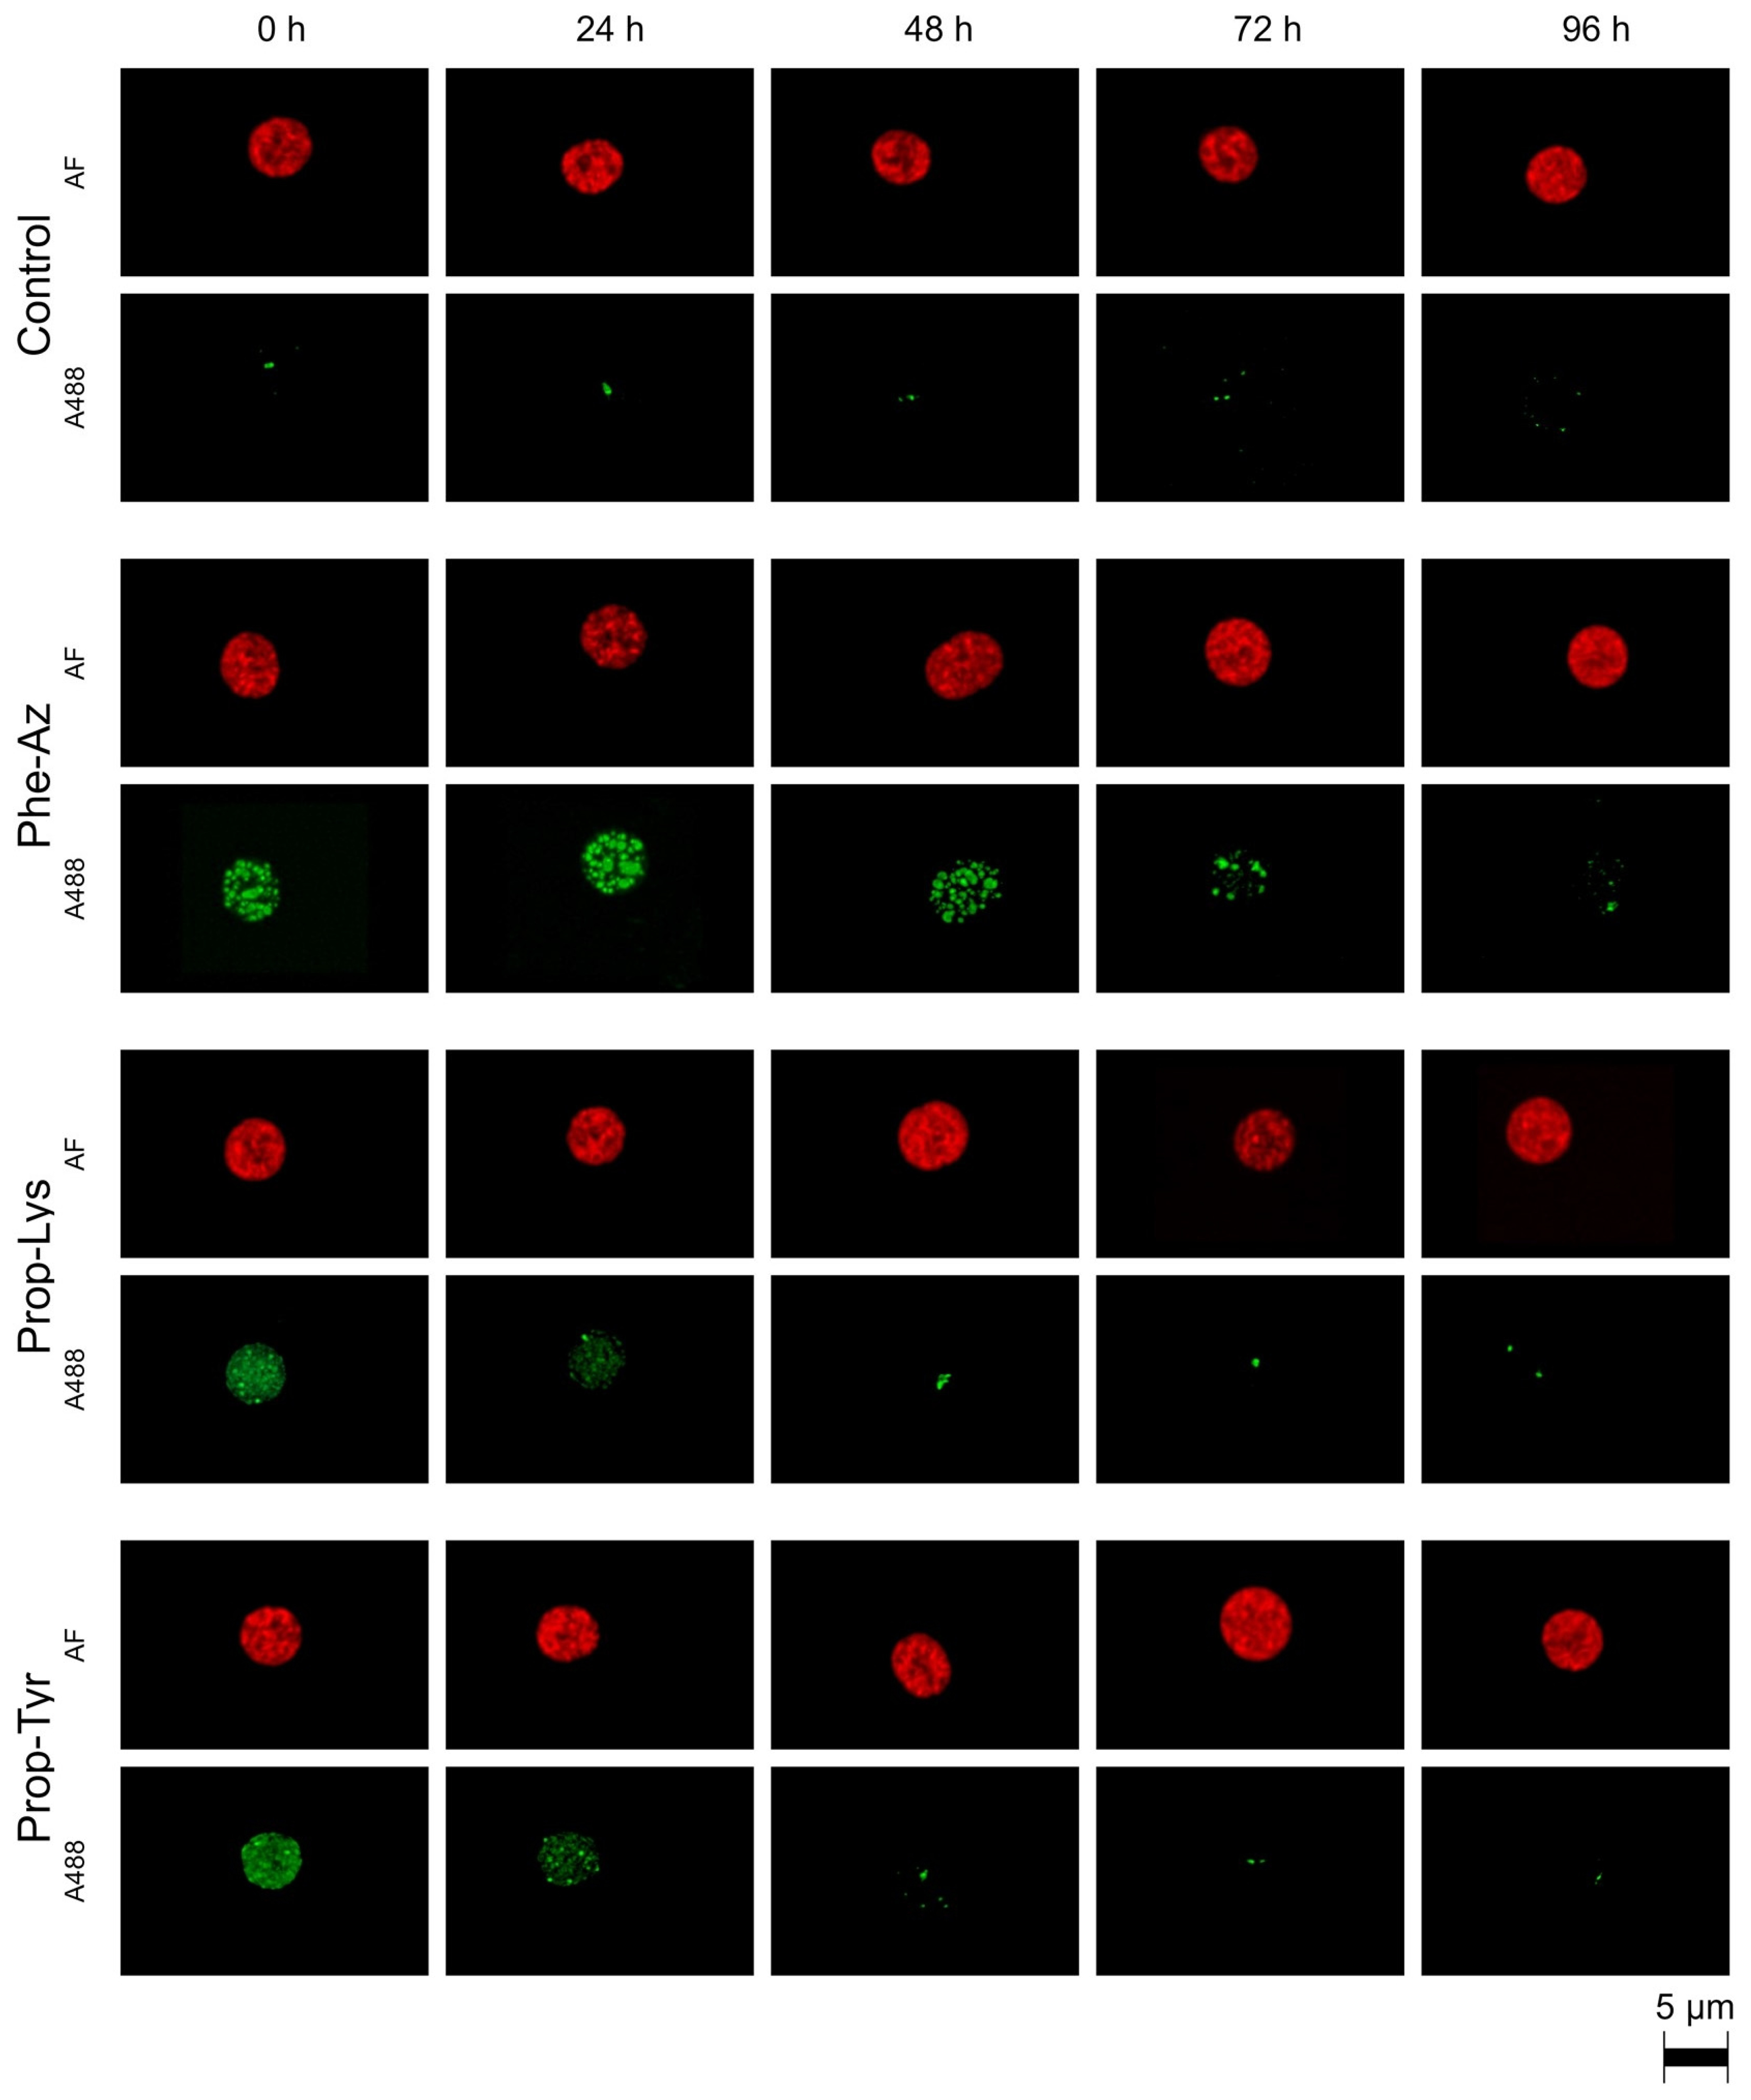
2.2. Qualitative Observation of A488 Signal Reduction During Time-Lapse Decline via High-Resolution Microscopy
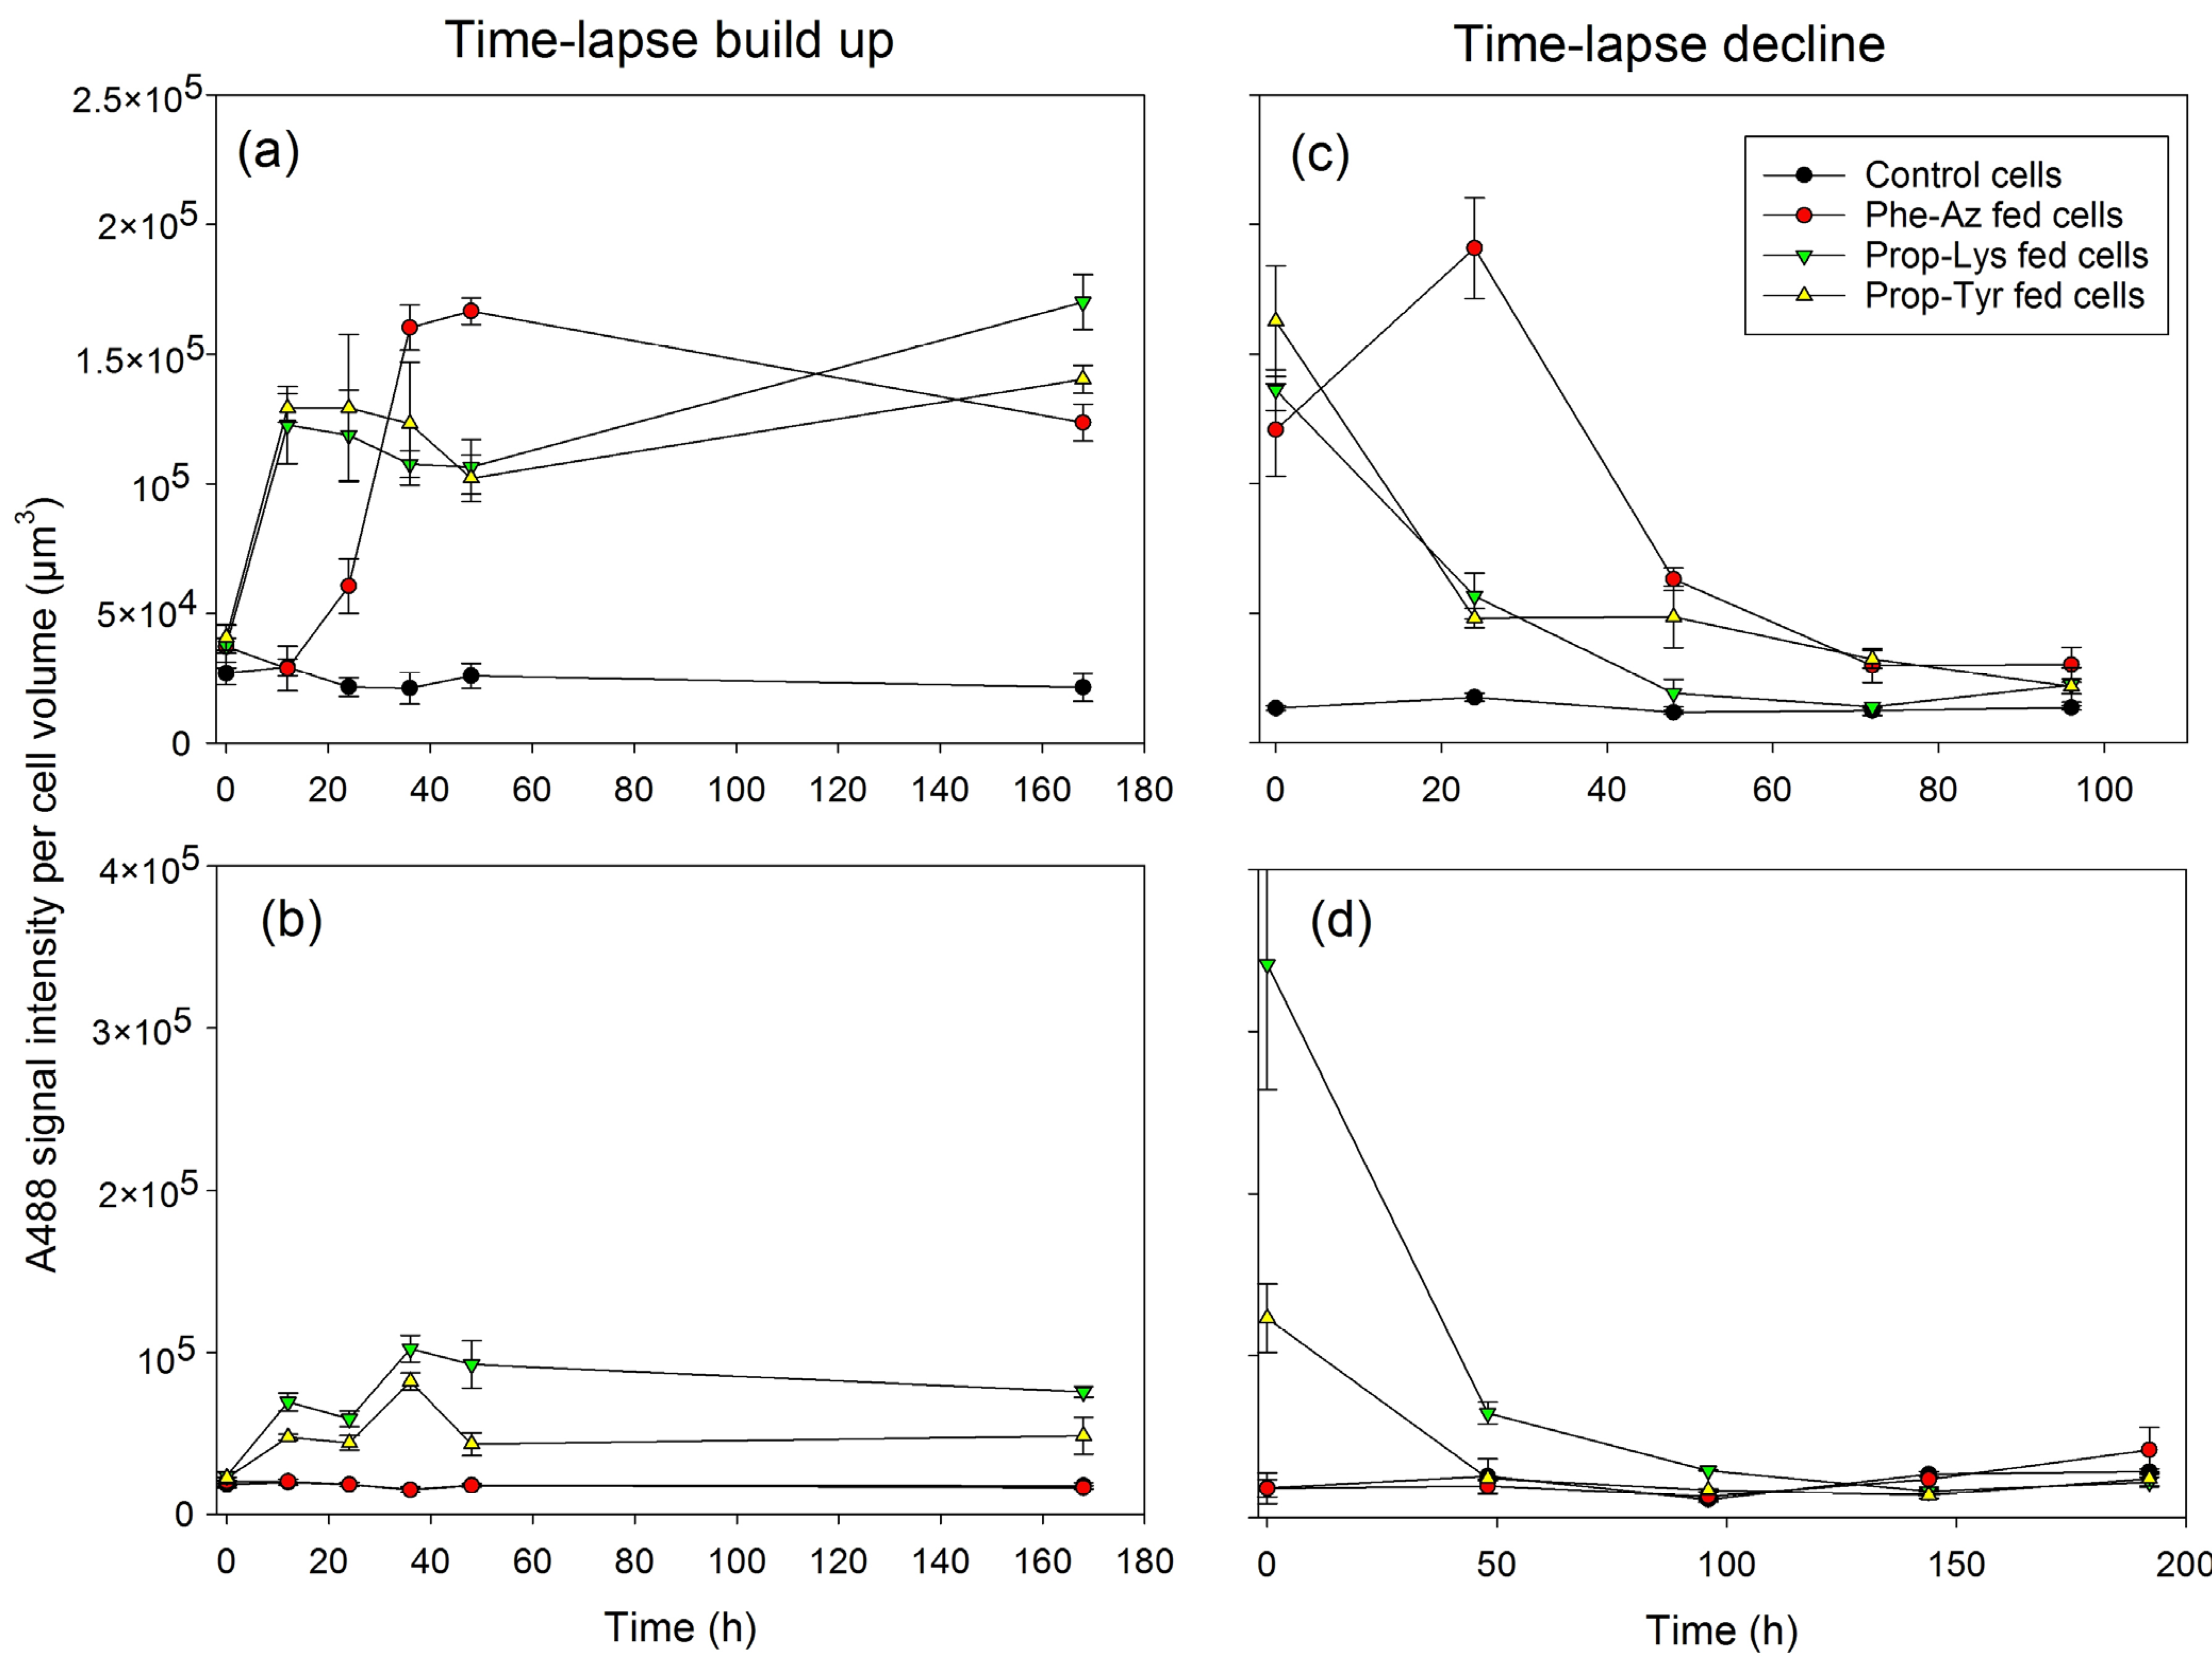
2.3. Quantification of A488 Signal Intensity and AF via High-Resolution Microscopy During Time-Lapse Build up and Decline

| Strain | Experiment | Control | Phe-Az | Prop-Lys | Prop-Tyr | n | p-Value 1,2 (Treatment) | p-Value 3 (Time) |
|---|---|---|---|---|---|---|---|---|
| A488 signal intensity (×104) | ||||||||
| M. aeruginosa | build up | 2.4 ± 0.18 a | 9.6 ± 1.4 b (4.2 ± 0.6) | 11.1 ± 1 bc (4.7 ± 0.5) | 11.1 ± 1 bc (4.7 ± 0.5) | 72 | <0.001 *** | <0.001 *** |
| decline | 1.4 ± 0.07 a | 8.7 ± 1.7 b (6.0 ± 1) | 5 ± 1.1 c (3.6 ± 0.9) | 6.3 ± 1.3 d (4.6 ± 1.1) | 60 | <0.001 *** | <0.001 *** | |
| P. agardhii | build up | 1.8 ± 0.07 a | 1.8 ± 0.07 a (1.0 ± 0.03) | 7 ± 0.67 b (4.0 ± 0.4) | 4.8 ± 0.48 ab (2.8 ± 0.3) | 72 | <0.001 *** | 0.002 ** |
| decline | 2.2 ± 0.25 a | 2.3 ± 0.4 b (1.1 ± 0.2) | 9.5 ± 3.3 a (5.1 ± 2) | 4.0 ± 1.2 a (2.1 ± 0.66) | 60 | 0.003 ** | 0.002 ** | |
| AF intensity (×105) | ||||||||
| M. aeruginosa | build up | 0.8 ± 0.03 a | 0.6 ± 0.03 b (0.8 ± 0.04) | 0.78 ± 0.03 a (1.0 ± 0.03) | 0.76 ± 0.03 a (1.0 ± 0.03) | 72 | <0.001 *** | 0.001 *** |
| decline | 3.5 ± 0.24 a | 2.4 ± 0.23 b (0.67 ± 0.06) | 3.5 ± 0.2 a (1.0 ± 0.3) | 3.5 ± 0.22 a (1.0 ± 0.3) | 60 | 0.003 ** | 0.234 | |
| P. agardhii | build up | 1.7 ± 0.09 a | 1.2 ± 0.08 b (0.8 ± 0.06) | 1.5 ± 0.04 a (0.9 ± 0.03) | 1.5 ± 0.06 a (0.9 ± 0.04) | 72 | 0.003 ** | 0.003 ** |
| decline | 6.1 ± 0.25 a | 1.9 ± 0.44 b (0.3 ± 0.08) | 5.5 ± 0.21 (0.9 ± 0.03) | 5.3 ± 0.22 a (0.9 ± 0.05) | 60 | <0.001 *** | 0.011 * | |
| A488/AF ratio | ||||||||
| M. aeruginosa | build up | 0.32 ± 0.02 a | 1.98 ± 0.34 b | 1.48 ± 0.15 bc | 1.57 ± 0.16 bc | 72 | <0.001 *** | <0.001 ** |
| decline | 0.05 ± 0.01 a | 0.44 ± 0.08 b | 0.16 ± 0.04 bc | 0.2 ± 0.05 bc | 60 | <0.001 *** | 0.078 | |
| P. agardhii | build up | 0.12 ± 0.01 a | 0.16 ± 0.01 a | 0.51 ± 0.06 bc | 0.39 ± 0.06 bd | 72 | <0.001 *** | <0.001 *** |
| decline | 0.04 ± 0.004 a | 0.25 ± 0.08 b | 0.19 ± 0.07 a | 0.08 ± 0.02 a | 60 | 0.017 * | 0.076 | |

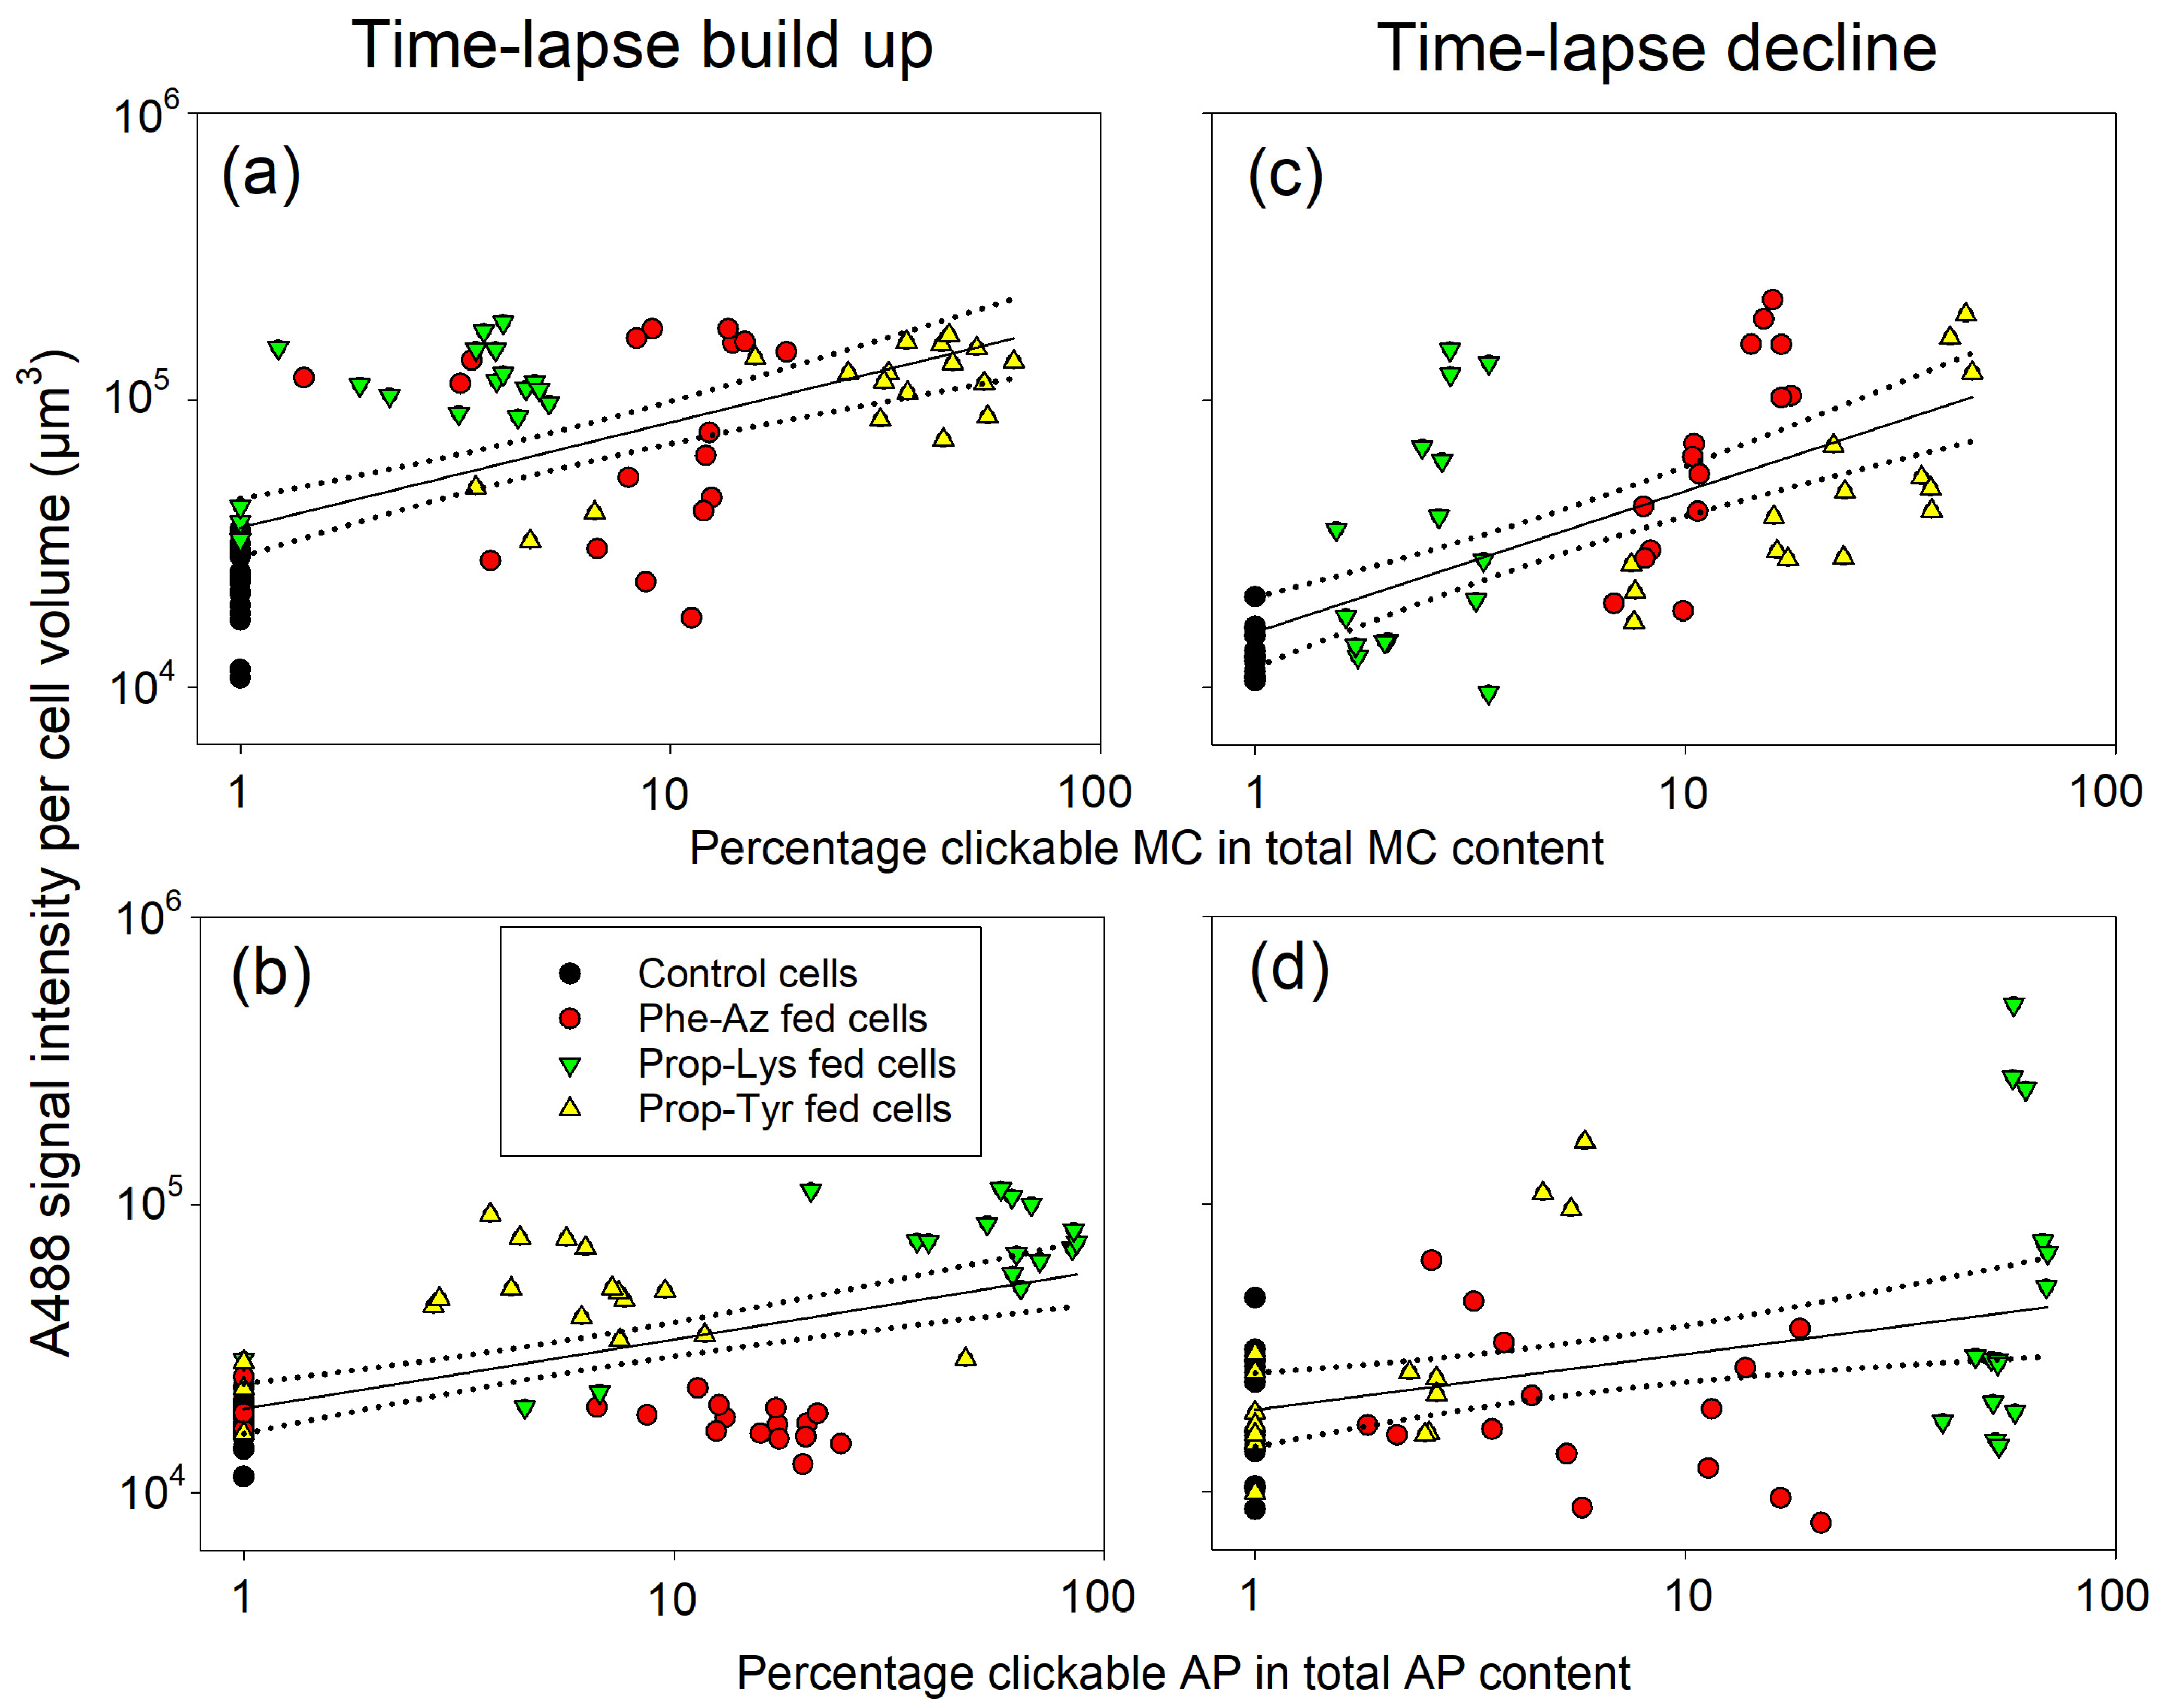
2.4. Relationship Between Clickable Cyanotoxin Content and Labeling by the Click Reaction as Quantified from High-Resolution Microscopy
| Strain | Experiment | Control | Phe-Az | Prop-Lys | Prop-Tyr | n | p-Value 1,2 (Treatment) | p-Value 3 (Time) |
|---|---|---|---|---|---|---|---|---|
| Object Pearson’s co-localization coefficient | ||||||||
| M. aeruginosa | build up | 0.22 ± 0.01 | 0.18 ± 0.01 | 0.21 ± 0.02 | 0.2 ± 0.01 | 72 | 0.288 | 0.03 ** |
| decline | 0.36 ± 0.01 | 0.32 ± 0.01 | 0.35 ± 0.01 | 0.34 ± 0.01 | 60 | 0.105 | 0.006 ** | |
| P. agardhii | build up | 0.23 ± 0.02 a | 0.2 ± 0.02 ab | 0.19 ± 0.02 ab | 0.17 ± 0.02 b | 72 | 0.022 * | 0.003 ** |
| decline | 0.47 ± 0.03 a | 0.14 ± 0.09 b | 0.25 ± 0.03 ab | 0.18 ± 0.03 b | 60 | 0.006 ** | 0.229 | |
| Object Spearman’s co-localization coefficient | ||||||||
| M. aeruginosa | build up | 0.41 ± 0.02 | 0.37 ± 0.02 | 0.39 ± 0.03 | 0.39 ± 0.02 | 72 | 0.727 | 0.006 ** |
| decline | 0.64 ± 0.01 a | 0.61 ± 0.01 b | 0.63 ± 0.01 ab | 0.63 ± 0.01 ab | 60 | 0.035 * | 0.532 | |
| P. agardhii | build up | 0.68 ± 0.02 a | 0.67 ± 0.02 a | 0.53 ± 0.03 b | 0.46 ± 0.04 b | 72 | 0.001 *** | <0.001 *** |
| decline | 0.54 ± 0.04 a | 0.22 ± 0.11 b | 0.56 ± 0.03 a | 0.44 ± 0.05 ab | 60 | 0.013 * | 0.258 | |
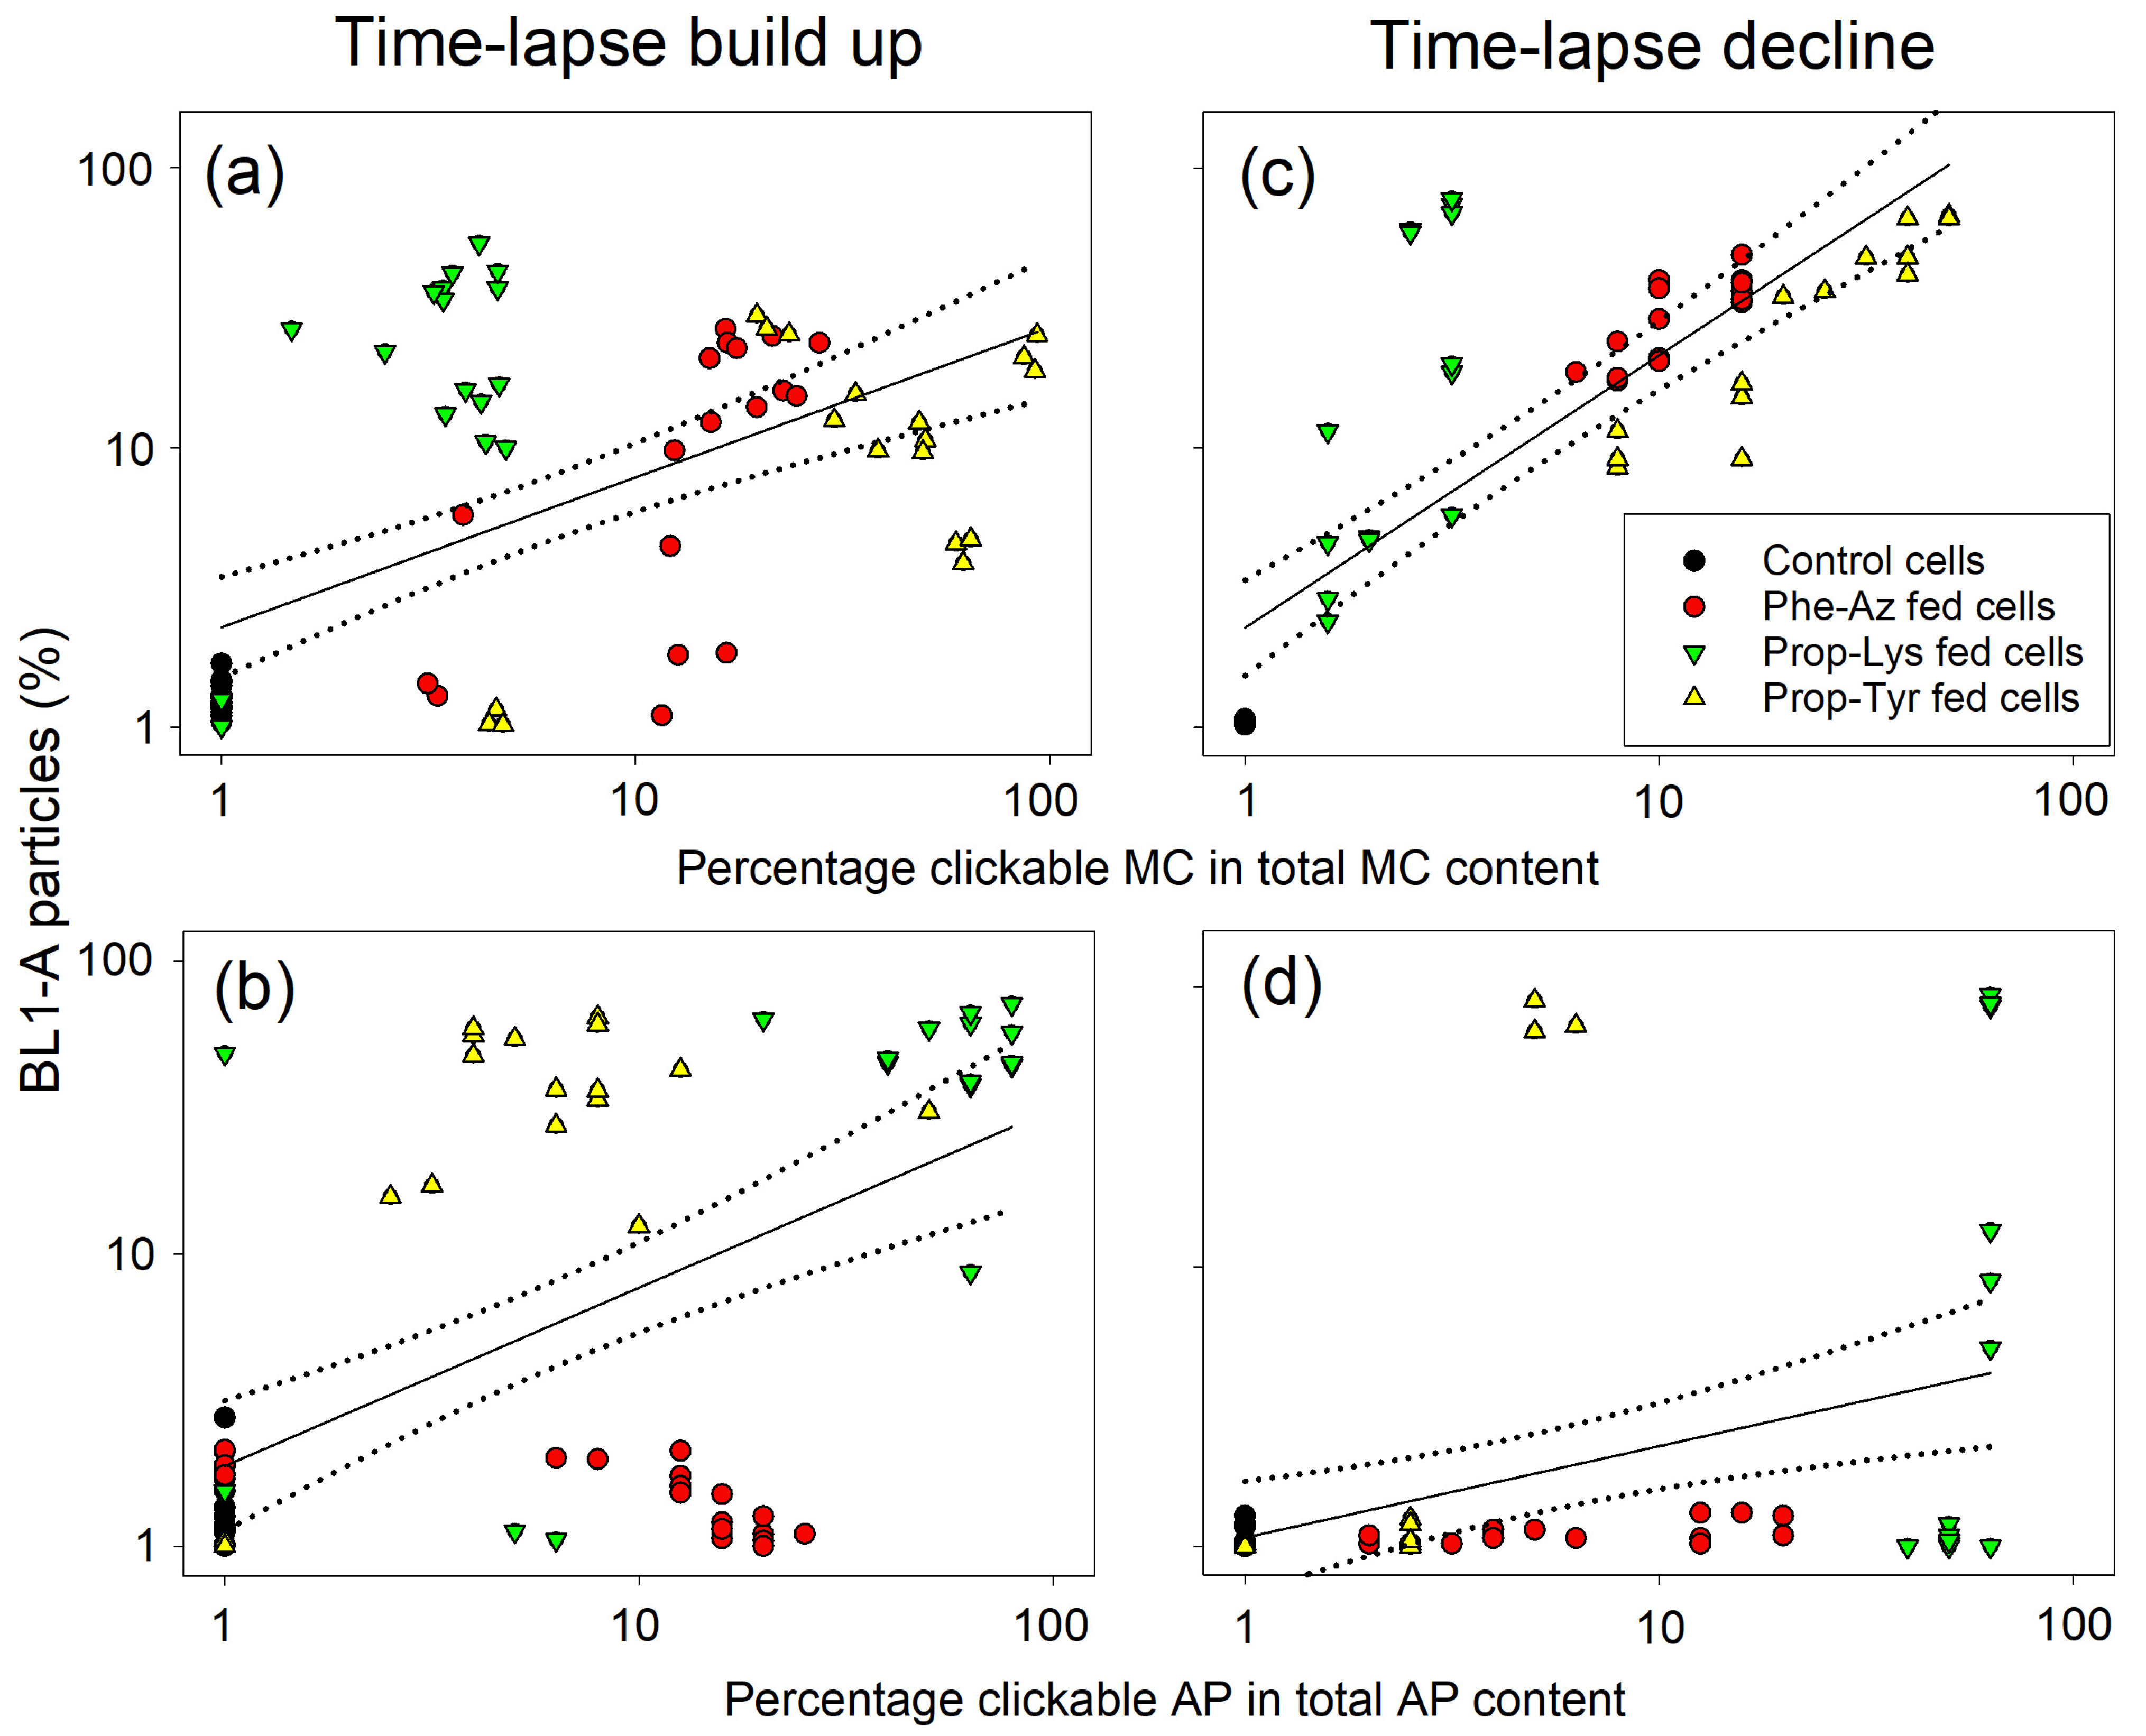
2.5. Relationship Between the Clickable Cyanotoxin Content and Labeling by the Click Reaction as Quantified by FCM
3. Discussion
3.1. Sensitivity of Chemo-Selective Labeling and Visualization via A488
3.2. Quantitative Relationship Between the Clickable Cyanotoxin Content and A488 Labeling Signal by the Click Reaction
3.3. Spatiotemporal Changes in the A488 Signal in Cyanobacteria During the Time-Lapse Decline Experiment
3.4. The Potential of Visualizing Cyanotoxin Synthesis via Chemo-Selective Labeling in Gene or Peptide Function Studies
4. Conclusions
5. Materials and Methods
5.1. Study Organisms and Experimental Design

5.2. Cell Harvesting and Fixation
5.3. Chemo-Selective Labeling of MC/AP Synthesis via the Click Reaction
5.4. Microscopic Recording of Signal Labeling
5.5. Calculation of Co-Localization Indices
5.6. FCM Analysis
5.7. Statistical Analysis
5.8. Chemical Analytical Analysis
Supplementary Materials
Author Contributions
Funding
Institutional Review Board Statement
Informed Consent Statement
Data Availability Statement
Acknowledgments
Conflicts of Interest
Abbreviations
| A488 | Alexa Fluor 488 (fluorophore) |
| A405 | Alexa Fluor 405 (fluorophore) |
| AF | Autofluorescence |
| AP | Anabaenopeptin |
| cHAB | cyanobacterial harmful algal bloom |
| DW | Dry weight of cells extracted for AP/MC peptides |
| CuAAC | Copper catalyzed azide-alkyne cycloaddition |
| FCM | Flow cytometry |
| MC | Microcystin |
| n | Sample size (used in statistical analysis) |
| non-AA | non-natural (clickable) L-amino acid |
| NRPS | Non-ribosomal peptide synthesis |
| Phe-Az | 4-azidophenylalanine |
| Prop-Lys | N-propargyloxy-carbonyl-L-lysine |
| Prop-Tyr | O-propargyl-L-Tyrosine |
| RM-ANOVA | two-way repeated measures analysis of variance |
References
- Huisman, J.; Codd, G.A.; Paerl, H.W.; Ibelings, B.W.; Verspagen, J.M.H.; Visser, P.M. Cyanobacterial blooms. Nat. Rev. Microbiol. 2018, 16, 471–483. [Google Scholar] [CrossRef]
- Song, L.; Jia, Y.; Qin, B.; Li, R.; Carmichael, W.W.; Gan, N.; Xu, H.; Shan, K.; Sukenik, A. Harmful cyanobacterial blooms: Biological traits, mechanisms, risks, and control strategies. Annu. Rev. Environ. Resour. 2023, 48, 123–147. [Google Scholar] [CrossRef]
- Dittmann, E.; Gugger, M.; Sivonen, K.; Fewer, D.P. Natural product biosynthetic diversity and comparative genomics of the cyanobacteria. Trends Microbiol. 2015, 23, 642–652. [Google Scholar] [CrossRef]
- Süssmuth, R.D.; Mainz, A. Nonribosomal Peptide synthesis-principles and prospects. Angew. Chem. Int. Ed. 2017, 56, 3770–3821. [Google Scholar] [CrossRef]
- Tillett, D.; Dittmann, E.; Erhard, M.; von Döhren, H.; Börner, T.; Neilan, B.A. Structural organization of microcystin biosynthesis in Microcystis aeruginosa PCC7806: An integrated peptide-polyketide synthetase system. Chem. Biol. 2000, 7, 753–764. [Google Scholar] [CrossRef]
- Janssen, E.M.L. Cyanobacterial peptides beyond microcystins—A review on co-occurrence, toxicity, and challenges for risk assessment. Water Res. 2019, 151, 488–499. [Google Scholar] [CrossRef]
- Monteiro, P.R.; do Amaral, S.C.; Siqueira, A.S.; Xavier, L.P.; Santos, A.V. Anabaenopeptins: What we know so far. Toxins 2021, 13, 522. [Google Scholar] [CrossRef]
- Pawlik-Skowrońska, B.; Toporowska, M.; Mazur-Marzec, H. Effects of secondary metabolites produced by different cyanobacterial populations on the freshwater zooplankters Brachionus calyciflorus and Daphnia pulex. Environ. Sci. Pollut. Res. 2019, 26, 11793–11804. [Google Scholar] [CrossRef]
- Schwarzenberger, A.; Von Elert, E. Cyanobacterial protease inhibitors lead to maternal transfer of increased protease gene expression in Daphnia. Oecologia 2013, 172, 11–20. [Google Scholar] [CrossRef]
- Rouhiainen, L.; Jokela, J.; Fewer, D.P.; Urmann, M.; Sivonen, K. Two alternative starter modules for the non-ribosomal biosynthesis of specific anabaenopeptin variants in Anabaena (Cyanobacteria). Chem. Biol. 2010, 17, 265–273. [Google Scholar] [CrossRef]
- Christiansen, G.; Philmus, B.; Hemscheidt, T.; Kurmayer, R. Genetic variation of adenylation domains of the anabaenopeptin synthesis operon and evolution of substrate promiscuity. J. Bacteriol. 2011, 193, 3822–3831. [Google Scholar] [CrossRef]
- Entfellner, E.; Frei, M.; Christiansen, G.; Deng, L.; Blom, J.; Kurmayer, R. Evolution of anabaenopeptin peptide structural variability in the cyanobacterium Planktothrix. Front. Microbiol. 2017, 8, 219. [Google Scholar] [CrossRef]
- Kurmayer, R.; Dittmann, E.; Fastner, J.; Chorus, I. Diversity of microcystin genes within a population of the toxic cyanobacterium Microcystis spp. in Lake Wannsee (Berlin, Germany). Microb. Ecol. 2002, 43, 107–118. [Google Scholar] [CrossRef]
- Kurmayer, R.; Christiansen, G.; Gumpenberger, M.; Fastner, J. Genetic identification of microcystin ecotypes in toxic cyanobacteria of the genus Planktothrix. Microbiology 2005, 151, 1525–1533. [Google Scholar] [CrossRef]
- Kurmayer, R.; Gumpenberger, M. Diversity of microcystin genotypes among populations of the filamentous cyanobacteria Planktothrix rubescens and Planktothrix agardhii. Mol. Ecol. 2006, 15, 3849–3861. [Google Scholar] [CrossRef]
- Kosol, S.; Schmidt, J.; Kurmayer, R. Variation in peptide net production and growth among strains of the toxic cyanobacterium Planktothrix spp. Eur. J. Phycol. 2009, 44, 49–62. [Google Scholar] [CrossRef]
- Kaljunen, H.; Schiefelbein, S.H.H.; Stummer, D.; Kozak, S.; Meijers, R.; Christiansen, G.; Rentmeister, A. Structural elucidation of the bispecificity of A-domains as a basis for activating non-natural amino acids. Angew. Chem. Int. Ed. 2015, 54, 8833–8836. [Google Scholar] [CrossRef]
- Stachelhaus, T.; Mootz, H.D.; Marahiel, M.A. The specificity-conferring code of adenylation domains in nonribosomal peptide synthetases. Chem. Biol. 1999, 6, 493–505. [Google Scholar] [CrossRef]
- Kolb, H.C.; Finn, M.G.; Sharpless, K.B. Click Chemistry: Diverse chemical function from a few good reactions. Angew. Chem. Int. Ed. 2001, 40, 2004–2021. [Google Scholar] [CrossRef]
- Presolski, S.I.; Hong, V.P.; Finn, M.G. Copper-catalyzed azide–alkyne click chemistry for bioconjugation. In Current Protocols in Chemical Biology; John Wiley & Sons, Inc.: Hoboken, NJ, USA, 2009. [Google Scholar]
- Kurmayer, R.; Entfellner, E.; Weisse, T.; Offterdinger, M.; Rentmeister, A.; Deng, L. Chemically labeled toxins or bioactive peptides show a heterogeneous intracellular distribution and low spatial overlap with autofluorescence in bloom-forming cyanobacteria. Sci. Rep. 2020, 10, 2781. [Google Scholar] [CrossRef]
- Morón-Asensio, R.; Schuler, D.; Wiedlroither, A.; Offterdinger, M.; Kurmayer, R. Differential labeling of chemically modified peptides and lipids among cyanobacteria Planktothrix and Microcystis. Microorganisms 2021, 9, 1578. [Google Scholar] [CrossRef]
- Kurmayer, R.; Morón Asensio, R. Real-time observation of clickable cyanotoxin synthesis in bloom-forming cyanobacteria Microcystis aeruginosa and Planktothrix agardhii. Toxins 2024, 16, 526. [Google Scholar] [CrossRef]
- Reynolds, C.S. Ecology of Phytoplankton; Cambridge University Press: Cambridge, UK, 2006; p. 524. [Google Scholar]
- Komarek, J.; Kastovsky, J.; Mares, J.; Johansen, J.R. Taxonomic classification of cyanoprokaryotes (cyanobacterial genera) 2014, using a polyphasic approach. Preslia 2014, 86, 295–335. [Google Scholar]
- Wojtasiewicz, B.; Stoń-Egiert, J. Bio-optical characterization of selected cyanobacteria strains present in marine and freshwater ecosystems. J. Appl. Phycol. 2016, 28, 2299–2314. [Google Scholar] [CrossRef]
- Suda, S.; Watanabe, M.M.; Otsuka, S.; Mahakahant, A.; Yongmanitchai, W.; Nopartnaraporn, N.; Liu, Y.; Day, J.G. Taxonomic revision of water-bloom-forming species of oscillatorioid cyanobacteria. Int. J. Syst. Evol. Microbiol. 2002, 52, 1577–1595. [Google Scholar]
- Kurmayer, R.; Deng, L.; Entfellner, E. Role of toxic and bioactive secondary metabolites in colonization and bloom formation by filamentous cyanobacteria Planktothrix. Harmful Algae 2016, 54, 69–86. [Google Scholar] [CrossRef]
- Cohen, A.B.; Novkov-Bloom, A.; Wesselborg, C.; Yagudaeva, M.; Aranguiz, E.; Taylor, G.T. Applying fluorescence in situ hybridization to aquatic systems with cyanobacteria blooms: Autofluorescence suppression and high-throughput image analysis. Limnol. Oceanogr. Methods 2021, 19, 457–475. [Google Scholar] [CrossRef]
- Schönhuber, W.; Zarda, B.; Eix, S.; Rippka, R.; Herdman, M.; Ludwig, W.; Amann, R. In situ identification of cyanobacteria with horseradish peroxidase-labeled, rRNA-targeted oligonucleotide probes. Appl. Environ. Microbiol. 1999, 65, 1259–1267. [Google Scholar] [CrossRef]
- Zeller, P.; Ploux, O.; Mejean, A. A simple protocol for attenuating the autofluorescence of cyanobacteria for optimized fluorescence in situ hybridization (FISH) imaging. J. Microbiol. Methods 2016, 122, 16–19. [Google Scholar] [CrossRef]
- Trigo, C.; Andrade, D.; Vásquez, M. Protein localization in the cyanobacterium Anabaena sp. PCC7120 using immunofluorescence labeling. Bio Protoc. 2017, 7, e2318. [Google Scholar] [CrossRef]
- Baskin, J.M.; Prescher, J.A.; Laughlin, S.T.; Agard, N.J.; Chang, P.V.; Miller, I.A.; Lo, A.; Codelli, J.A.; Bertozzi, C.R. Copper-free click chemistry for dynamic in vivo imaging. Proc. Natl. Acad. Sci. USA 2007, 104, 16793–16797. [Google Scholar] [CrossRef] [PubMed]
- Patterson, D.M.; Nazarova, L.A.; Prescher, J.A. Finding the right (bioorthogonal) chemistry. ACS Chem. Biol. 2014, 9, 592–605. [Google Scholar] [CrossRef] [PubMed]
- Moschny, J.; Lorenzen, W.; Hilfer, A.; Eckenstaler, R.; Jahns, S.; Enke, H.; Enke, D.; Schneider, P.; Benndorf, R.A.; Niedermeyer, T.H.J. Precursor-directed biosynthesis and fluorescence labeling of clickable microcystins. J. Nat. Prod. 2020. [Google Scholar] [CrossRef]
- Kries, H.; Wachtel, R.; Pabst, A.; Wanner, B.; Niquille, D.; Hilvert, D. Reprogramming nonribosomal peptide synthetases for “clickable” amino acids. Angew. Chem. Int. Ed. 2014, 53, 10105–10108. [Google Scholar] [CrossRef]
- Kallow, W.; Von Döhren, H.; Kleinkauf, H. Penicillin biosynthesis: Energy requirement for tripeptide precursor formation by delta-(L-alpha-aminoadipyl)-L-cysteinyl-D-valine synthetase from Acremonium chrysogenum. Biochemistry 1998, 37, 5947–5952. [Google Scholar] [CrossRef]
- Puja, H.; Bianchetti, L.; Revol-Tissot, J.; Simon, N.; Shatalova, A.; Nommé, J.; Fritsch, S.; Stote, R.H.; Mislin, G.L.A.; Potier, N.; et al. Biosynthesis of a clickable pyoverdine via in vivo enzyme engineering of an adenylation domain. Microb. Cell Factories 2024, 23, 207. [Google Scholar] [CrossRef]
- Schock, M.; Bräse, S. Reactive & efficient: Organic azides as cross-linkers in material sciences. Molecules 2020, 25, 1009. [Google Scholar] [CrossRef] [PubMed]
- Jüttner, F.; Lüthi, H. Topology and enhanced toxicity of bound microcystins in Microcystis PCC 7806. Toxicon 2008, 51, 388–397. [Google Scholar] [CrossRef]
- Zeller, P.; Méjean, A.; Biegala, I.; Contremoulins, V.; Ploux, O. Fluorescence in situ hybridization of Microcystis strains producing microcystin using specific mRNA probes. Lett. Appl. Microbiol. 2016, 63, 376–383. [Google Scholar] [CrossRef]
- Brient, L.; Ben Gamra, N.; Periot, M.; Roumagnac, M.; Zeller, P.; Bormans, M.; Méjean, A.; Ploux, O.; Biegala, I.C. Rapid characterization of microcystin-producing cyanobacteria in freshwater lakes by TSA-FISH (Tyramid Signal Amplification-Fluorescent In Situ Hybridization). Front. Environ. Sci. 2017, 5, 43. [Google Scholar] [CrossRef]
- Liu, Y.; Li, B.; Zhang, H.; Liu, Y.; Xie, P. Participation of fluorescence technology in the cross-disciplinary detection of microcystins. Coord. Chem. Rev. 2022, 457, 214416. [Google Scholar] [CrossRef]
- Wei, N.; Hu, L.; Song, L.; Gan, N. Microcystin-bound protein patterns in different cultures of Microcystis aeruginosa and field samples. Toxins 2016, 8, 293. [Google Scholar] [CrossRef]
- Li, B.; Wang, Z.; Chuan, H.; Li, J.; Xie, P.; Liu, Y. Introducing fluorescent probe technology for detecting microcystin-LR in the water and cells. Anal. Chim. Acta 2024, 1288, 342188. [Google Scholar] [CrossRef]
- Li, Z.; Zhu, X.; Wu, Z.; Sun, T.; Tong, Y. Recent advances in cyanotoxin synthesis and applications: A comprehensive review. Microorganisms 2023, 11, 2636. [Google Scholar] [CrossRef] [PubMed]
- Liu, T.; Mazmouz, R.; Ongley, S.E.; Chau, R.; Pickford, R.; Woodhouse, J.N.; Neilan, B.A. Directing the heterologous production of specific cyanobacterial toxin variants. ACS Chem. Biol. 2017, 12, 2021–2029. [Google Scholar] [CrossRef]
- Zheng, Y.; Xue, C.; Chen, H.; Jia, A.; Zhao, L.; Zhang, J.; Zhang, L.; Wang, Q. Reconstitution and expression of mcy gene cluster in the model cyanobacterium Synechococcus 7942 reveals a role of MC-LR in cell division. New Phytol. 2023, 238, 1101–1114. [Google Scholar] [CrossRef]
- Cullen, A.; Pearson, L.A.; Mazmouz, R.; Liu, T.Z.; Soeriyadi, A.H.; Ongley, S.E.; Neilan, B.A. Heterologous expression and biochemical characterisation of cyanotoxin biosynthesis pathways. Nat. Prod. Rep. 2019, 36, 1117–1136. [Google Scholar] [CrossRef]
- Miles, C.O.; McCarron, P.; Thomas, K.; Al-Sinawi, B.; Liu, T.; Neilan, B.A. Microcystins with modified Adda5-residues from a heterologous microcystin expression system. ACS Omega 2024, 9, 27618–27631. [Google Scholar] [CrossRef]
- Liu, T.; Mazmouz, R.; Pearson, L.A.; Neilan, B.A. Mutagenesis of the Microcystin Tailoring and Transport Proteins in a Heterologous Cyanotoxin Expression System. ACS Synth. Biol. 2019, 8, 1187–1194. [Google Scholar] [CrossRef]
- Sallandt, L.L.; Wolf, C.A.; Schuster, S.; Enke, H.; Enke, D.; Wolber, G.; Niedermeyer, T.H.J. Derivatization of microcystins can increase target inhibition while reducing cellular uptake. J. Nat. Prod. 2025, 88, 3–14. [Google Scholar] [CrossRef]
- Neilan, B.A.; Pearson, L.A.; Muenchhoff, J.; Moffitt, M.C.; Dittmann, E. Environmental conditions that influence toxin biosynthesis in cyanobacteria. Environ. Microbiol. 2013, 15, 1239–1253. [Google Scholar] [CrossRef] [PubMed]
- Rippka, R. Isolation and purification of cyanobacteria. Methods Enzymol. 1988, 167, 3–27. [Google Scholar] [PubMed]
- Manders, E.M.M.; Verbeek, F.J.; Aten, J.A. Measurement of co-localization of objects in dual-colour confocal images. J. Microsc. 1993, 169, 375–382. [Google Scholar] [CrossRef] [PubMed]
- Dunn, K.W.; Kamocka, M.M.; McDonald, J.H. A practical guide to evaluating colocalization in biological microscopy. Am. J. Physiol. Cell Physiol. 2011, 300, C723–C742. [Google Scholar] [CrossRef]
- Sarkans, U.; Gostev, M.; Athar, A.; Behrangi, E.; Melnichuk, O.; Ali, A.; Minguet, J.; Rada, J.C.; Snow, C.; Tikhonov, A.; et al. The BioStudies database—One stop shop for all data supporting a life sciences study. Nucleic Acids Res. 2017, 46, D1266–D1270. [Google Scholar] [CrossRef]
| Strain | Experiment | Control | Phe-Az | Prop-Lys | Prop-Tyr | n | p-Value 1,2 (Treatment) | p-Value 3 (Time) |
|---|---|---|---|---|---|---|---|---|
| Cell diameter (µm) | ||||||||
| M. aeruginosa | build up | 4.3 ± 0.04 a | 4.59 ± 0.08 b | 4.42 ± 0.04 c | 4.47 ± 0.04 c | 72 | 0.001 *** | <0.001 *** |
| decline | 4.05 ± 0.03 a | 4.59 ± 0.1 b | 4.23 ± 0.03 c | 4.14 ± 0.03 ac | 60 | <0.001 *** | 0.008 ** | |
| P. agardhii | build up | 3.52 ± 0.02 | 3.56 ± 0.02 | 3.53 ± 0.02 | 3.52 ± 0.02 | 72 | 0.084 | <0.001 *** |
| decline | 3.58 ± 0.05 a | 3.74 ± 0.03 b | 3.58 ± 0.04 a | 3.49 ± 0.06 a | 60 | 0.001 ** | 0.197 | |
| Cell volume (µm3) | ||||||||
| M. aeruginosa | build up | 42.4 ± 1.1 a | 52.4 ± 2.9 b | 46.2 ± 1.3 c | 47.8 ± 1.4 c | 72 | <0.001 *** | <0.001 *** |
| decline | 35.3 ± 0.8 a | 53.1 ± 3.9 b | 40.3 ± 0.9 c | 38 ± 0.7 ac | 60 | <0.001 *** | 0.008 ** | |
| P. agardhii | build up | 133.3 ± 1.6 | 137.2 ± 2 | 134 ± 1.3 | 134 ± 1.4 | 72 | 0.083 | 0.01 * |
| decline | 140.5 ± 3.8 a | 154 ± 2.8 b | 140.5 ± 3.5 a | 133 ± 4.2 a | 60 | 0.002 ** | 0.398 | |
Disclaimer/Publisher’s Note: The statements, opinions and data contained in all publications are solely those of the individual author(s) and contributor(s) and not of MDPI and/or the editor(s). MDPI and/or the editor(s) disclaim responsibility for any injury to people or property resulting from any ideas, methods, instructions or products referred to in the content. |
© 2025 by the authors. Licensee MDPI, Basel, Switzerland. This article is an open access article distributed under the terms and conditions of the Creative Commons Attribution (CC BY) license (https://creativecommons.org/licenses/by/4.0/).
Share and Cite
Kurmayer, R.; Morón Asensio, R. Time-Resolved Visualization of Cyanotoxin Synthesis via Labeling by the Click Reaction in the Bloom-Forming Cyanobacteria Microcystis aeruginosa and Planktothrix agardhii. Toxins 2025, 17, 278. https://doi.org/10.3390/toxins17060278
Kurmayer R, Morón Asensio R. Time-Resolved Visualization of Cyanotoxin Synthesis via Labeling by the Click Reaction in the Bloom-Forming Cyanobacteria Microcystis aeruginosa and Planktothrix agardhii. Toxins. 2025; 17(6):278. https://doi.org/10.3390/toxins17060278
Chicago/Turabian StyleKurmayer, Rainer, and Rubén Morón Asensio. 2025. "Time-Resolved Visualization of Cyanotoxin Synthesis via Labeling by the Click Reaction in the Bloom-Forming Cyanobacteria Microcystis aeruginosa and Planktothrix agardhii" Toxins 17, no. 6: 278. https://doi.org/10.3390/toxins17060278
APA StyleKurmayer, R., & Morón Asensio, R. (2025). Time-Resolved Visualization of Cyanotoxin Synthesis via Labeling by the Click Reaction in the Bloom-Forming Cyanobacteria Microcystis aeruginosa and Planktothrix agardhii. Toxins, 17(6), 278. https://doi.org/10.3390/toxins17060278