Application of a Mechanistic Model for the Prediction of Microcystin Production by Microcystis in Lab Cultures and Tropical Lake


Abstract
:1. Introduction
2. Results
2.1. Population in Batch Experiments
2.2. Microcystin Model in Batch Experiments
2.2.1. Model Performance with Varying Temperature
2.2.2. Model Performance with Various Nutrient Concentrations
2.3. Microcystin Model in the Field
3. Discussion
4. Conclusions
5. Materials and Methods
5.1. Data
5.1.1. Batch Experiments
5.1.2. Field Data
5.2. Model Platform
5.3. Model Equations
5.4. Model Performance
Author Contributions
Funding
Institutional Review Board Statement
Informed Consent Statement
Data Availability Statement
Acknowledgments
Conflicts of Interest
Abbreviations
| Symbol | Description | Unit |
| Microcystin cell quota | fg cell−1 | |
| Decay rate of microcystin | d−1 | |
| Temperature coefficient for microcystin cell quota | fg cell−1 °C−1 | |
| Phosphorus coefficient for microcystin cell quota | fg cell−1 | |
| Nutrient coefficient for microcystin cell quota | fg cell−1 | |
| Microcystin cell quota intercept | fg cell−1 | |
| TN | Total nitrogen | mg-N L−1 |
| TP | Total phosphorus | mg-P L−1 |
| Decay rate of intracellular microcystin (0 d−1) | d−1 | |
| Decay rate of extracellular microcystin (0.623 d−1) | d−1 | |
| Intracellular microcystin | µg L−1 | |
| Extracellular microcystin | µg L−1 | |
| Algae cells | cell mL−1 | |
| Growth Rate | d−1 | |
| Mortality and respiration rate | d−1 | |
| Maximum specific growth rate | d−1 | |
| Water temperature | °C | |
| Irradiance | µmol photons m−2 s−1 | |
| Initial dissolved inorganic nitrogen | mg-N L−1 | |
| Initial dissolved inorganic phosphorus (orthophosphate) | mg-P L−1 | |
| Inhibition rate at high irradiance | d−1 (µmol photons m−2 s−1)−1 | |
| Carrying Capacity | cell mL−1 | |
| Temperature coefficient | — | |
| Temperature coefficient | — | |
| Temperature coefficient | — | |
| Temperature coefficient | — | |
| Growth rate increase at low irradiance | d−1 (µmol photons m−2 s−1)−1 | |
| Nitrogen half saturation constant | mg-N L−1 | |
| Phosphorus half saturation constant | mg-P L−1 | |
| Mortality rate at 20 °C | d−1 | |
| Temperature coefficient | — |
References
- O’Neil, J.M.; Davis, T.W.; Burford, M.A.; Gobler, C.J. The Rise of Harmful Cyanobacteria Blooms: The Potential Roles of Eutrophication and Climate Change. Harmful Algae 2012, 14, 313–334. [Google Scholar] [CrossRef]
- Burford, M.A.; Hamilton, D.P.; Wood, S.A. Emerging HAB research issues in freshwater environments. In Global Ecology and Oceanography of Harmful Algal Blooms; Glibert, P.M., Berdalet, E., Burford, M.A., Pitcher, G.C., Zhou, M., Eds.; Ecological Studies (Analysis and Synthesis); Springer International Publishing: Cham, Switzerland, 2018; Volume 232, pp. 381–402. ISBN 978-3-319-70068-7. [Google Scholar]
- Omidi, A.; Esterhuizen-Londt, M.; Pflugmacher, S. Still Challenging: The Ecological Function of the Cyanobacterial Toxin Microcystin—What We Know so Far. Toxin Rev. 2018, 37, 87–105. [Google Scholar] [CrossRef] [Green Version]
- Wood, S.A.; Rueckert, A.; Hamilton, D.P.; Cary, S.C.; Dietrich, D.R. Switching Toxin Production on and off: Intermittent Microcystin Synthesis in a Microcystis Bloom. Environ. Microbiol. Rep. 2011, 3, 118–124. [Google Scholar] [CrossRef] [PubMed]
- Díez-Quijada, L.; Prieto, A.I.; Guzmán-Guillén, R.; Jos, A.; Cameán, A.M. Occurrence and Toxicity of Microcystin Congeners Other than MC-LR and MC-RR: A Review. Food Chem. Toxicol. 2019, 125, 106–132. [Google Scholar] [CrossRef]
- Saqrane, S.; Oudra, B. CyanoHAB Occurrence and Water Irrigation Cyanotoxin Contamination: Ecological Impacts and Potential Health Risks. Toxins 2009, 1, 113–122. [Google Scholar] [CrossRef] [Green Version]
- WHO Team. Guidelines for Drinking-Water Quality; Incorporating the 1st Addendum, 4th ed.; World Health Organization: Geneva, Switzerland, 2017. [Google Scholar]
- Spoof, L.; Catherine, A. Appendix 3: Tables of microcystins and nodularins. In Handbook of Cyanobacterial Monitoring and Cyanotoxin Analysis; Meriluoto, J., Spoof, L., Codd, G.A., Eds.; John Wiley & Sons, Ltd.: Hoboken, NJ, USA, 2016; pp. 526–537. ISBN 978-1-119-06876-1. [Google Scholar]
- Francy, D.S.; Brady, A.M.G.; Stelzer, E.A.; Cicale, J.R.; Hackney, C.; Dalby, H.D.; Struffolino, P.; Dwyer, D.F. Predicting Microcystin Concentration Action-Level Exceedances Resulting from Cyanobacterial Blooms in Selected Lake Sites in Ohio. Environ. Monit. Assess. 2020, 192, 513. [Google Scholar] [CrossRef]
- Harris, T.D.; Graham, J.L. Predicting Cyanobacterial Abundance, Microcystin, and Geosmin in a Eutrophic Drinking-Water Reservoir Using a 14-Year Dataset. Lake Reserv. Manag. 2017, 33, 32–48. [Google Scholar] [CrossRef]
- Hayes, N.M.; Vanni, M.J. Microcystin Concentrations Can Be Predicted with Phytoplankton Biomass and Watershed Morphology. Inland Waters 2018, 8, 273–283. [Google Scholar] [CrossRef]
- Horst, G.P.; Sarnelle, O.; White, J.D.; Hamilton, S.K.; Kaul, R.B.; Bressie, J.D. Nitrogen Availability Increases the Toxin Quota of a Harmful Cyanobacterium, Microcystis aeruginosa. Water Res. 2014, 54, 188–198. [Google Scholar] [CrossRef]
- Hushchyna, K.; Nguyen-Quang, T. Using the Modified Redfield Ratio to Estimate Harmful Algal Blooms. Environ. Probl. 2017, 2, 101–108. [Google Scholar]
- Song, L.; Sano, T.; Li, R.; Watanabe, M.M.; Liu, Y.; Kaya, K. Microcystin Production of Microcystis Viridis (Cyanobacteria) under Different Culture Conditions. Phycol. Res. 1998, 46, 19–23. [Google Scholar] [CrossRef]
- Kim, K.; Park, C.; Yoon, Y.; Hwang, S.-J. Harmful Cyanobacterial Material Production in the North Han River (South Korea): Genetic Potential and Temperature-Dependent Properties. Int. J. Environ. Res. Public. Health 2018, 15, 444. [Google Scholar] [CrossRef] [PubMed] [Green Version]
- Kameyama, K.; Sugiura, N.; Isoda, H.; Inamori, Y.; Maekawa, T. Effect of Nitrate and Phosphate Concentration on Production of Microcystins by Microcystis Viridis NIES 102. Aquat. Ecosyst. Health Manag. 2002, 5, 443–449. [Google Scholar] [CrossRef]
- Baldia, S.F.; Evangelista, A.D.; Aralar, E.V.; Santiago, A.E. Nitrogen and Phosphorus Utilization in the Cyanobacterium Microcystis aeruginosa Isolated from Laguna de Bay, Philippines. J. Appl. Phycol. 2007, 19, 607–613. [Google Scholar] [CrossRef]
- Te, S.H.; Gin, K.Y.-H. The Dynamics of Cyanobacteria and Microcystin Production in a Tropical Reservoir of Singapore. Harmful Algae 2011, 10, 319–329. [Google Scholar] [CrossRef]
- Polyak, Y.; Zaytseva, T.; Medvedeva, N. Response of Toxic Cyanobacterium Microcystis aeruginosa to Environmental Pollution. Water Air Soil Pollut. 2013, 224, 1494. [Google Scholar] [CrossRef]
- Deblois, C.P.; Juneau, P. Relationship between Photosynthetic Processes and Microcystin in Microcystis aeruginosa Grown under Different Photon Irradiances. Harmful Algae 2010, 9, 18–24. [Google Scholar] [CrossRef]
- Kuniyoshi, T.M.; Sevilla, E.; Bes, M.T.; Fillat, M.F.; Peleato, M.L. Phosphate Deficiency (N/P 40:1) Induces McyD Transcription and Microcystin Synthesis in Microcystis aeruginosa PCC7806. Plant Physiol. Biochem. 2013, 65, 120–124. [Google Scholar] [CrossRef]
- Chen, L.; Gin, K.Y.H.; He, Y. Effects of Sulfate on Microcystin Production, Photosynthesis, and Oxidative Stress in Microcystis aeruginosa. Environ. Sci. Pollut. Res. 2016, 23, 3586–3595. [Google Scholar] [CrossRef]
- Aragão, M.C.; dos Reis, K.C.; Souza, A.C.; Rocha, M.A.M.; Capelo Neto, J. Modeling Total Microcystin Production by Microcystis aeruginosa Using Multiple Regression. J. Water Supply Res. Technol.-Aqua 2020, 69, 415–426. [Google Scholar] [CrossRef] [Green Version]
- Jiang, P.; Liu, X.; Zhang, J.; Yuan, X. A Framework Based on Hidden Markov Model with Adaptive Weighting for Microcystin Forecasting and Early-Warning. Decis. Support Syst. 2016, 84, 89–103. [Google Scholar] [CrossRef]
- Liu, Q.; Rowe, M.D.; Anderson, E.J.; Stow, C.A.; Stumpf, R.P.; Johengen, T.H. Probabilistic Forecast of Microcystin Toxin Using Satellite Remote Sensing, in Situ Observations and Numerical Modeling. Environ. Model. Softw. 2020, 128, 104705. [Google Scholar] [CrossRef]
- Taranu, Z.E.; Gregory-Eaves, I.; Steele, R.J.; Beaulieu, M.; Legendre, P. Predicting Microcystin Concentrations in Lakes and Reservoirs at a Continental Scale: A New Framework for Modelling an Important Health Risk Factor. Glob. Ecol. Biogeogr. 2017, 26, 625–637. [Google Scholar] [CrossRef]
- Yuan, L.L.; Pollard, A.I. Combining National and State Data Improves Predictions of Microcystin Concentration. Harmful Algae 2019, 84, 75–83. [Google Scholar] [CrossRef] [PubMed]
- Melina Celeste, C.M.; Lorena, R.; Jorge Oswaldo, A.; Sandro, G.; Daniela, S.; Dario, A.; Leda, G. Mathematical Modeling of Microcystis aeruginosa Growth and [D-Leu1] Microcystin-LR Production in Culture Media at Different Temperatures. Harmful Algae 2017, 67, 13–25. [Google Scholar] [CrossRef] [Green Version]
- Jähnichen, S.; Long, B.M.; Petzoldt, T. Microcystin Production by Microcystis aeruginosa: Direct Regulation by Multiple Environmental Factors. Harmful Algae 2011, 12, 95–104. [Google Scholar] [CrossRef]
- Long, B.M.; Jones, G.J.; Orr, P.T. Cellular Microcystin Content in N-Limited Microcystis aeruginosa Can Be Predicted from Growth Rate. Appl. Environ. Microbiol. 2001, 67, 278–283. [Google Scholar] [CrossRef] [Green Version]
- Downing, T.G.; Meyer, C.; Gehringer, M.M.; van de Venter, M. Microcystin Content of Microcystis aeruginosa Is Modulated by Nitrogen Uptake Rate Relative to Specific Growth Rate or Carbon Fixation Rate. Environ. Toxicol. 2005, 20, 257–262. [Google Scholar] [CrossRef]
- Ghaffar, S.; Stevenson, R.J.; Khan, Z. Effect of Phosphorus Stress on Microcystis aeruginosa Growth and Phosphorus Uptake. PLoS ONE 2017, 12, e0174349. [Google Scholar] [CrossRef]
- Robson, B.J.; Hamilton, D.P. Three-Dimensional Modelling of a Microcystis Bloom Event in the Swan River Estuary, Western Australia. Ecol. Model. 2004, 174, 203–222. [Google Scholar] [CrossRef]
- Mikawa, M.; Sugimoto, K.; Amano, Y.; Machida, M.; Imazeki, F. Competitive Growth Characteristics between Microcystis aeruginosa and Cyclotella Sp. Accompanying Changes in River Water Inflow and Their Simulation Model. Phycol. Res. 2016, 64, 123–132. [Google Scholar] [CrossRef]
- van der Westhuizen, A.J.; Eloff, J.N. Effect of Temperature and Light on the Toxicity and Growth of the Blue-Green Alga Microcystis aeruginosa (UV-006). Planta 1985, 163, 55–59. [Google Scholar] [CrossRef] [PubMed]
- Wiedner, C.; Visser, P.M.; Fastner, J.; Metcalf, J.S.; Codd, G.A.; Mur, L.R. Effects of Light on the Microcystin Content of Microcystis Strain PCC 7806. Appl. Environ. Microbiol. 2003, 69, 1475–1481. [Google Scholar] [CrossRef] [PubMed] [Green Version]
- Li, W. Occurrence and Fate of Cyanotoxins and Off-Flavors in Tropical Freshwater Environments. Ph.D. Thesis, Shanghai Jiaotong University, Shanghai, China, 2018. [Google Scholar]
- Vinçon-Leite, B.; Casenave, C. Modelling Eutrophication in Lake Ecosystems: A Review. Sci. Total Environ. 2019, 651, 2985–3001. [Google Scholar] [CrossRef] [PubMed]
- Bernard, O.; Rémond, B. Validation of a Simple Model Accounting for Light and Temperature Effect on Microalgal Growth. Bioresour. Technol. 2012, 123, 520–527. [Google Scholar] [CrossRef] [PubMed]
- Beardall, J.; Raven, J.A. Limits to phototrophic growth in dense culture: CO2 Supply and light. In Algae for Biofuels and Energy; Borowitzka, M.A., Moheimani, N.R., Eds.; Developments in Applied Phycology; Springer: Dordrecht, The Netherlands, 2013; Volume 5, ISBN 978-94-007-5478-2. [Google Scholar]
- Downing, T.G.; Sember, C.S.; Gehringer, M.M.; Leukes, W. Medium N:P Ratios and Specific Growth Rate Comodulate Microcystin and Protein Content in Microcystis aeruginosa PCC7806 and M. aeruginosa UV027. Microb. Ecol. 2005, 49, 468–473. [Google Scholar] [CrossRef]
- Chen, R.; Li, F.; Liu, J.; Zheng, H.; Shen, F.; Xue, Y.; Liu, C. The Combined Effects of Dolichospermum Flos-Aquae, Light, and Temperature on Microcystin Production by Microcystis aeruginosa. Chin. J. Oceanol. Limnol. 2016, 34, 1173–1182. [Google Scholar] [CrossRef]
- Giannuzzi, L.; Krock, B.; Minaglia, M.C.C.; Rosso, L.; Houghton, C.; Sedan, D.; Malanga, G.; Espinosa, M.; Andrinolo, D.; Hernando, M. Growth, Toxin Production, Active Oxygen Species and Catalase Activity of Microcystis aeruginosa (Cyanophyceae) Exposed to Temperature Stress. Comp. Biochem. Physiol. Part C Toxicol. Pharmacol. 2016, 189, 22–30. [Google Scholar] [CrossRef] [Green Version]
- Pineda-Mendoza, R.M.; Zúñiga, G.; Martínez-Jerónimo, F. Microcystin Production in Microcystis aeruginosa: Effect of Type of Strain, Environmental Factors, Nutrient Concentrations, and N:P Ratio on McyA Gene Expression. Aquat. Ecol. 2016, 50, 103–119. [Google Scholar] [CrossRef]
- Geada, P.; Pereira, R.N.; Vasconcelos, V.; Vicente, A.A.; Fernandes, B.D. Assessment of Synergistic Interactions between Environmental Factors on Microcystis aeruginosa Growth and Microcystin Production. Algal Res. 2017, 27, 235–243. [Google Scholar] [CrossRef] [Green Version]
- Lyck, S. Simultaneous Changes in Cell Quotas of Microcystin, Chlorophyll a, Protein and Carbohydrate during Different Growth Phases of a Batch Culture Experiment with Microcystis aeruginosa. J. Plankton Res. 2004, 26, 727–736. [Google Scholar] [CrossRef] [Green Version]
- Schatz, D.; Keren, Y.; Vardi, A.; Sukenik, A.; Carmeli, S.; Börner, T.; Dittmann, E.; Kaplan, A. Towards Clarification of the Biological Role of Microcystins, a Family of Cyanobacterial Toxins. Environ. Microbiol. 2007, 9, 965–970. [Google Scholar] [CrossRef] [PubMed]
- Orr, P.T.; Jones, G.J. Relationship between Microcystin Production and Cell Division Rates in Nitrogen-Limited Microcystis aeruginosa Cultures. Limnol. Oceanogr. 1998, 43, 1604–1614. [Google Scholar] [CrossRef]
- Redfield, A.C. The Biological Control of Chemical Factors in the Environment. Am. Sci. 1958, 46, 205–221. [Google Scholar]
- Rohrlack, T.; Hyenstrand, P. Fate of Intracellular Microcystins in the Cyanobacterium Microcystis aeruginosa (Chroococcales, Cyanophyceae). Phycologia 2007, 46, 277–283. [Google Scholar] [CrossRef]
- Mowe, M.A.D.; Porojan, C.; Abbas, F.; Mitrovic, S.M.; Lim, R.P.; Furey, A.; Yeo, D.C.J. Rising Temperatures May Increase Growth Rates and Microcystin Production in Tropical Microcystis Species. Harmful Algae 2015, 50, 88–98. [Google Scholar] [CrossRef]
- Mowe, M.A.D.; Abbas, F.; Porojan, C.; Mitrovic, S.M.; Lim, R.P.; Furey, A.; Yeo, D.C.J. Roles of Nitrogen and Phosphorus in Growth Responses and Toxin Production (Using LC-MS/MS) of Tropical Microcystis Ichthyoblabe and M. flos-aquae. J. Appl. Phycol. 2016, 28, 1543–1552. [Google Scholar] [CrossRef]
- Bright, D.I.; Walsby, A.E. The Daily Integral of Growth by Planktothrix Rubescens Calculated from Growth Rate in Culture and Irradiance in Lake Zürich. New Phytol. 2000, 146, 301–316. [Google Scholar] [CrossRef] [Green Version]
- Monod, J. The Growth of Bacterial Cultures. Annu. Rev. Microbiol. 1949, 3, 371–394. [Google Scholar] [CrossRef] [Green Version]
- Lee, S.J.; Jang, M.-H.; Kim, H.-S.; Yoon, B.-D.; Oh, H.-M. Variation of Microcystin Content of Microcystis aeruginosa Relative to Medium N:P Ratio and Growth Stage. J. Appl. Microbiol. 2000, 89, 323–329. [Google Scholar] [CrossRef] [Green Version]
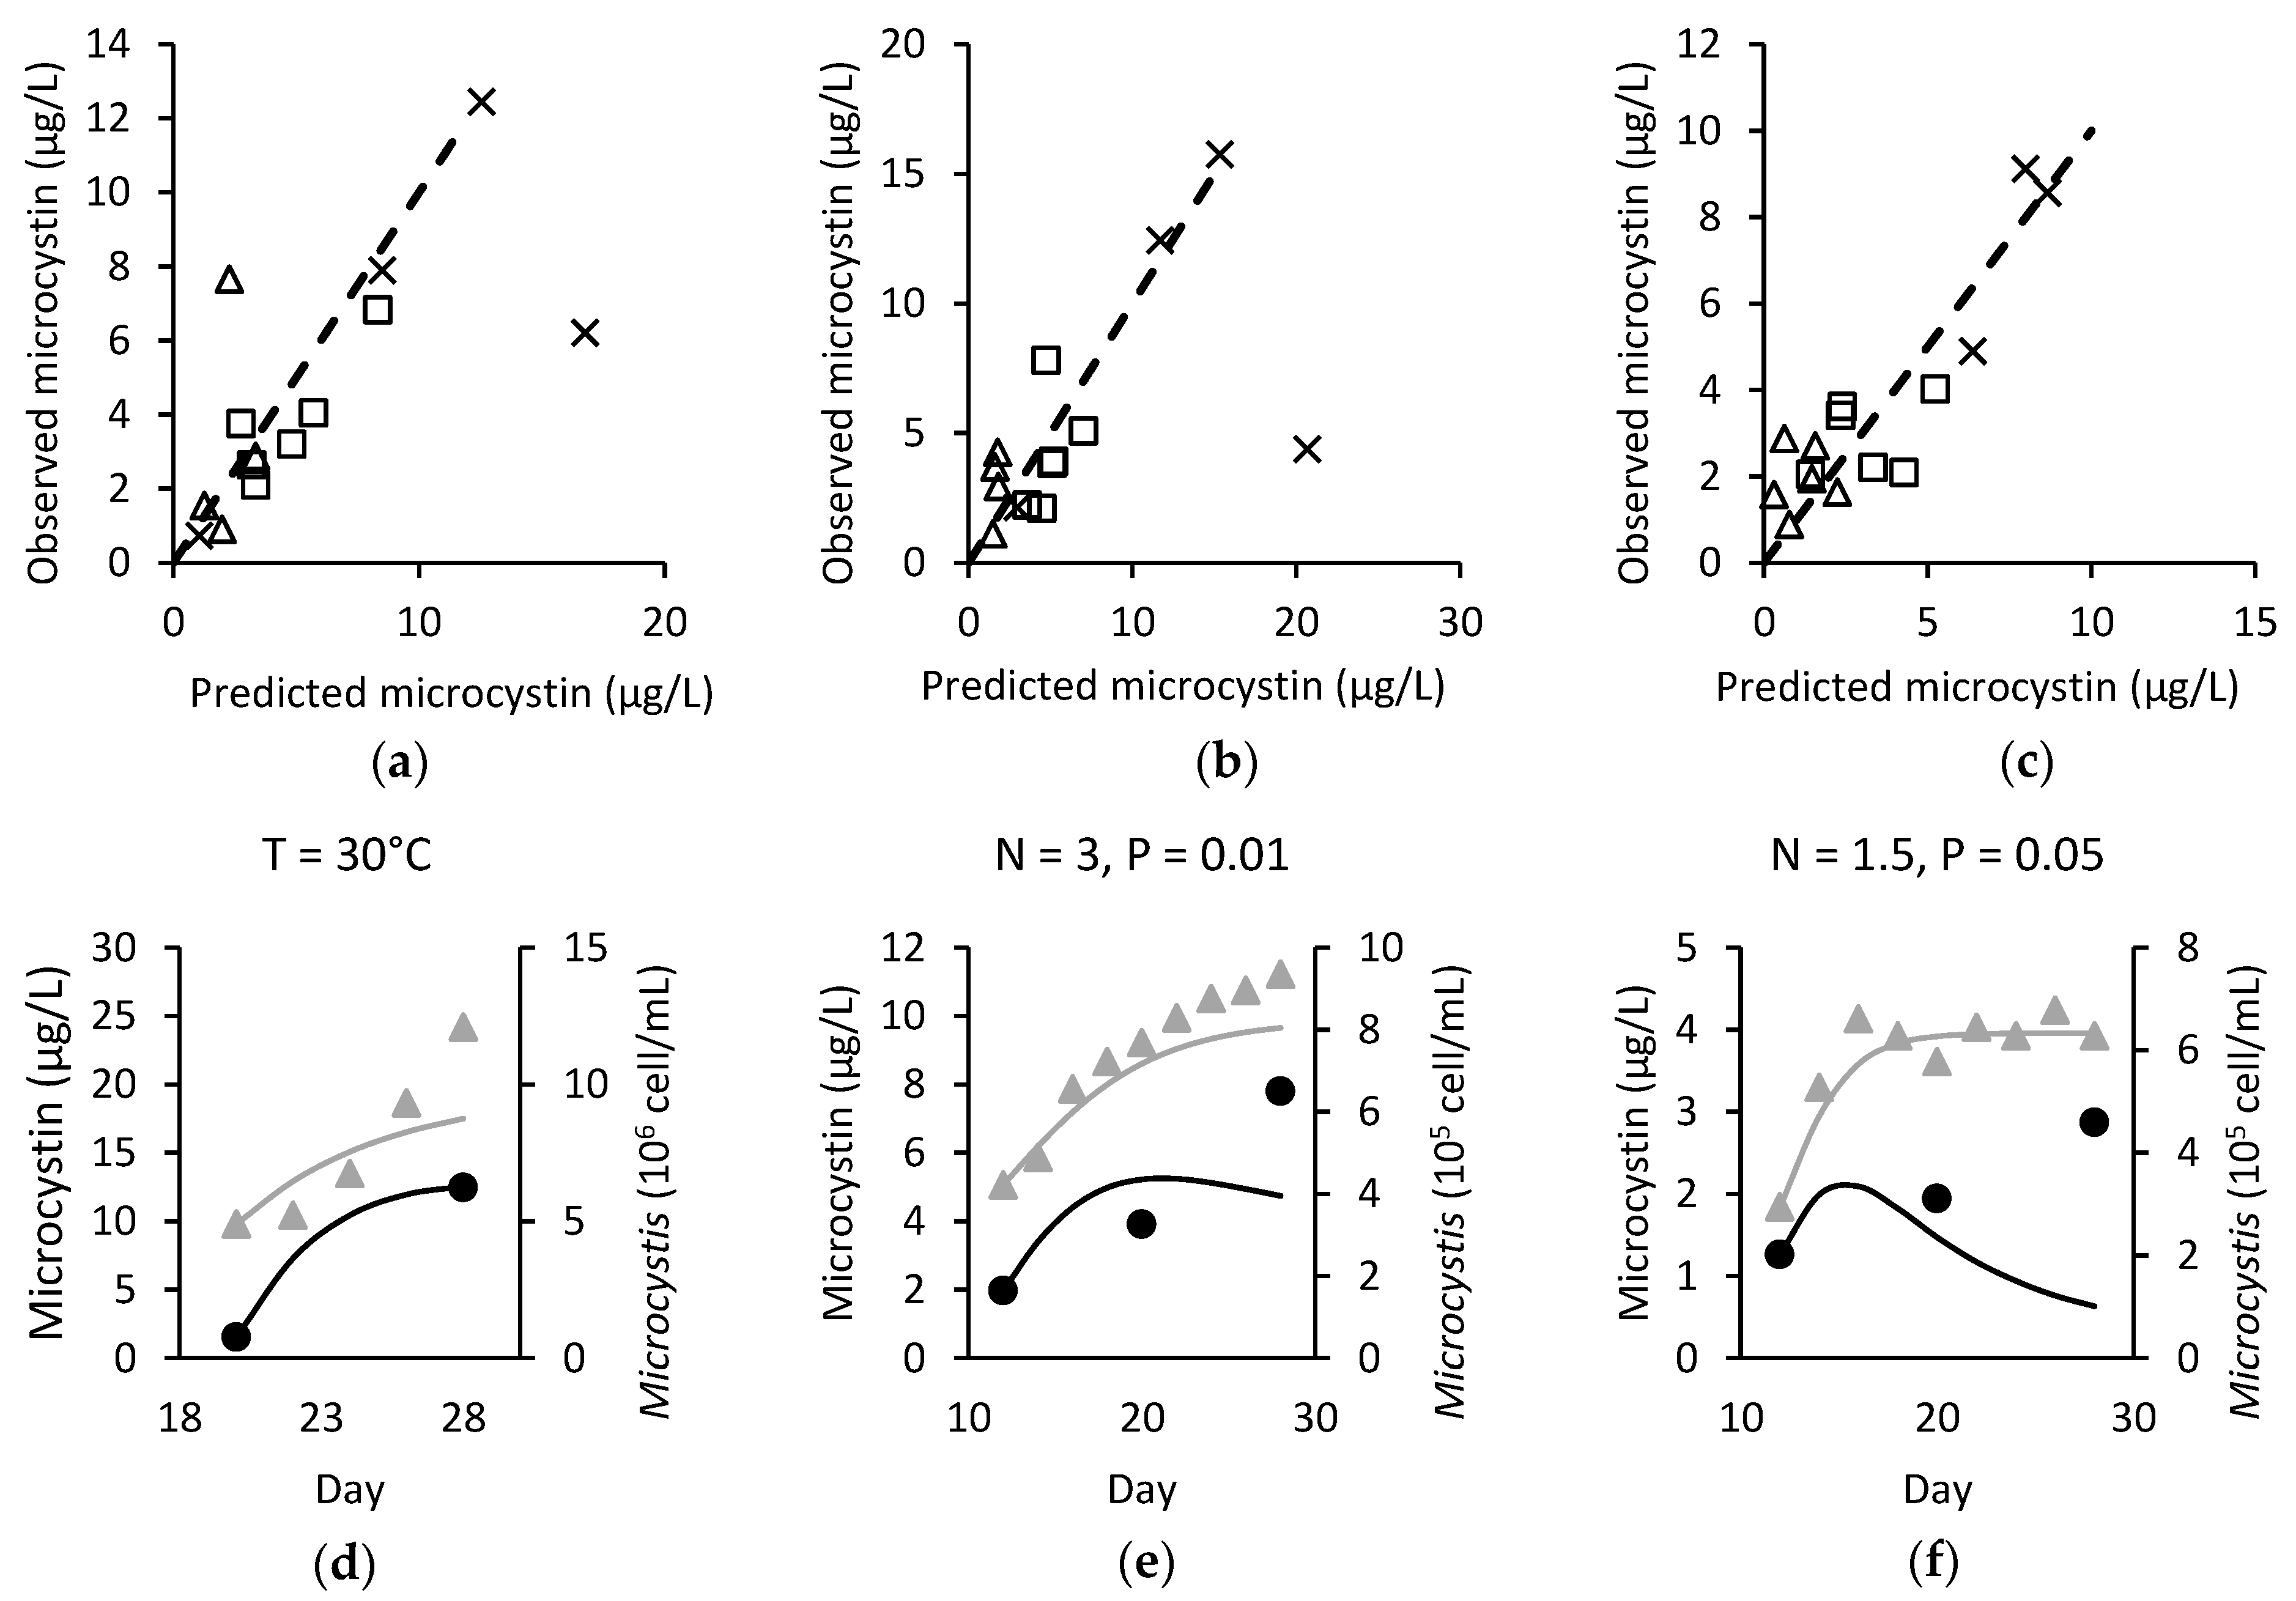
 ) and observed (●/▲) microcystin (black) and Microcystis (grey) over time for (d) M. ichthyoblabe LP at 30 °C; (e) M. ichthyoblabe TG at N = 3 mg L−1 and P = 0.01 mg L−1 and; (f) M. flos-aquae LP at N = 1.5 mg L−1 and P = 0.05 mg L−1.
) and observed (●/▲) microcystin (black) and Microcystis (grey) over time for (d) M. ichthyoblabe LP at 30 °C; (e) M. ichthyoblabe TG at N = 3 mg L−1 and P = 0.01 mg L−1 and; (f) M. flos-aquae LP at N = 1.5 mg L−1 and P = 0.05 mg L−1.
) and observed (●/▲) microcystin (black) and Microcystis (grey) over time for (d) M. ichthyoblabe LP at 30 °C; (e) M. ichthyoblabe TG at N = 3 mg L−1 and P = 0.01 mg L−1 and; (f) M. flos-aquae LP at N = 1.5 mg L−1 and P = 0.05 mg L−1.

 , TP (mg L−1)
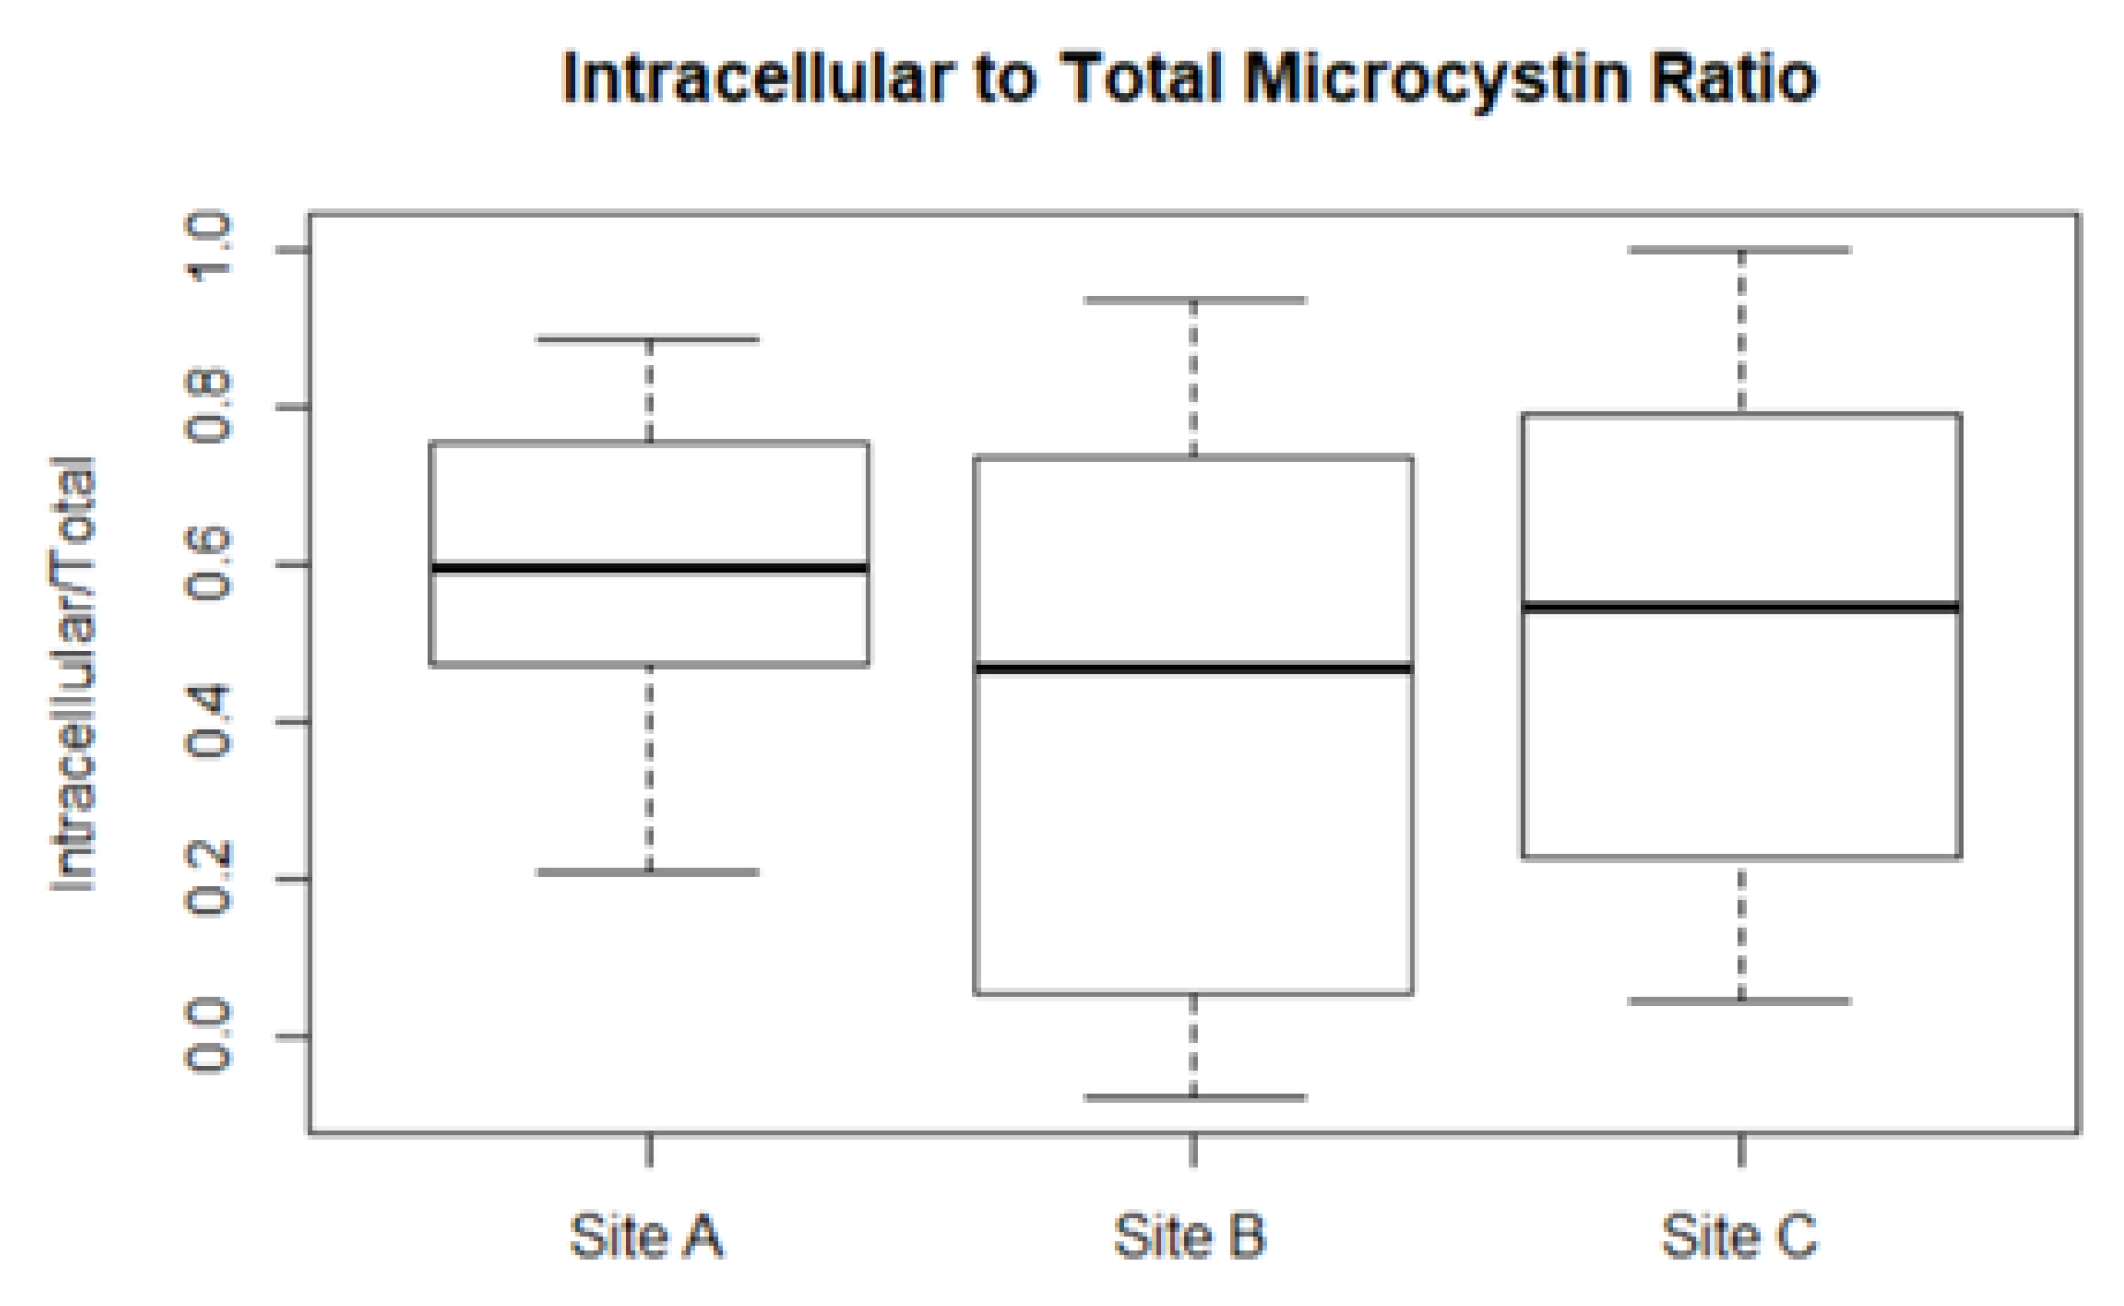
  , intracellular proportion of microcystin (MCY)
  and temperature (°C)
  ; (d–f) observed total
  and toxigenic
  Microcystis population; and (g–i) modelled and observed ● total microcystin for Site A (left), B (middle), and C (right).
, TP (mg L−1) , intracellular proportion of microcystin (MCY) and temperature (°C) ; (d–f) observed total and toxigenic Microcystis population; and (g–i) modelled and observed ● total microcystin for Site A (left), B (middle), and C (right).
Microcystis population; and (g–i) modelled and observed ● total microcystin for Site A (left), B (middle), and C (right).
, TP (mg L−1) , intracellular proportion of microcystin (MCY) and temperature (°C) ; (d–f) observed total and toxigenic Microcystis population; and (g–i) modelled and observed ● total microcystin for Site A (left), B (middle), and C (right).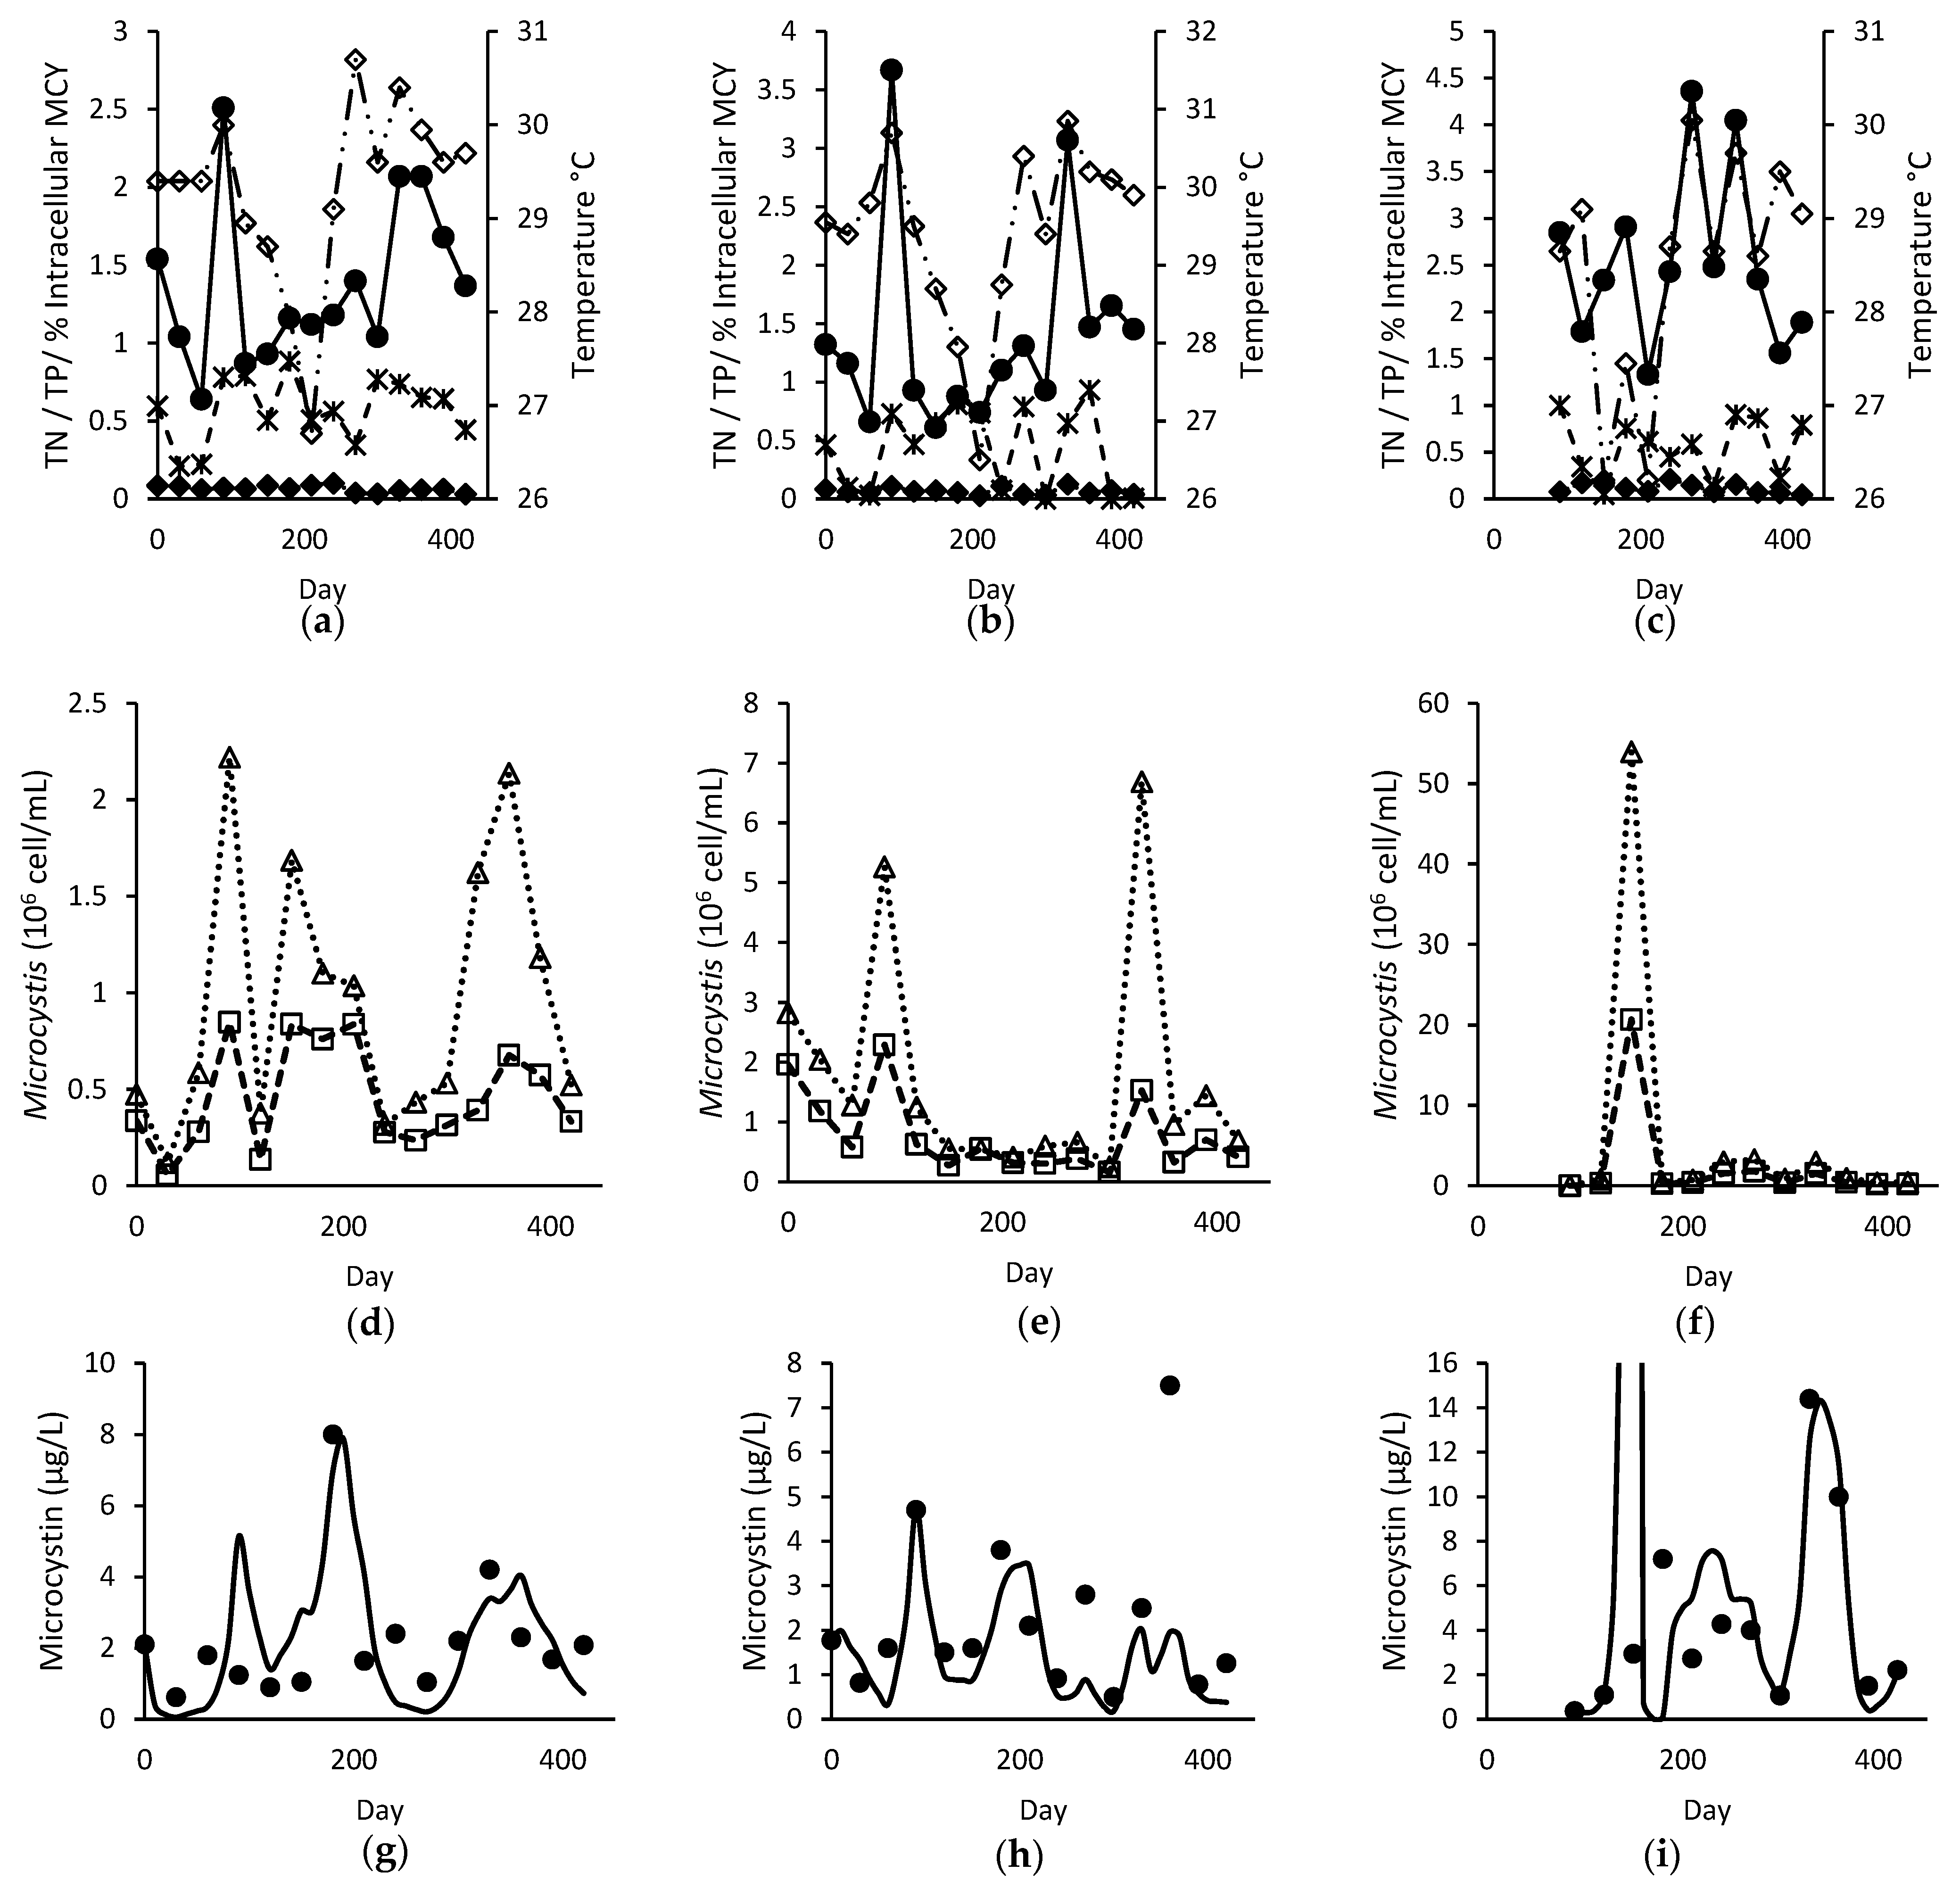

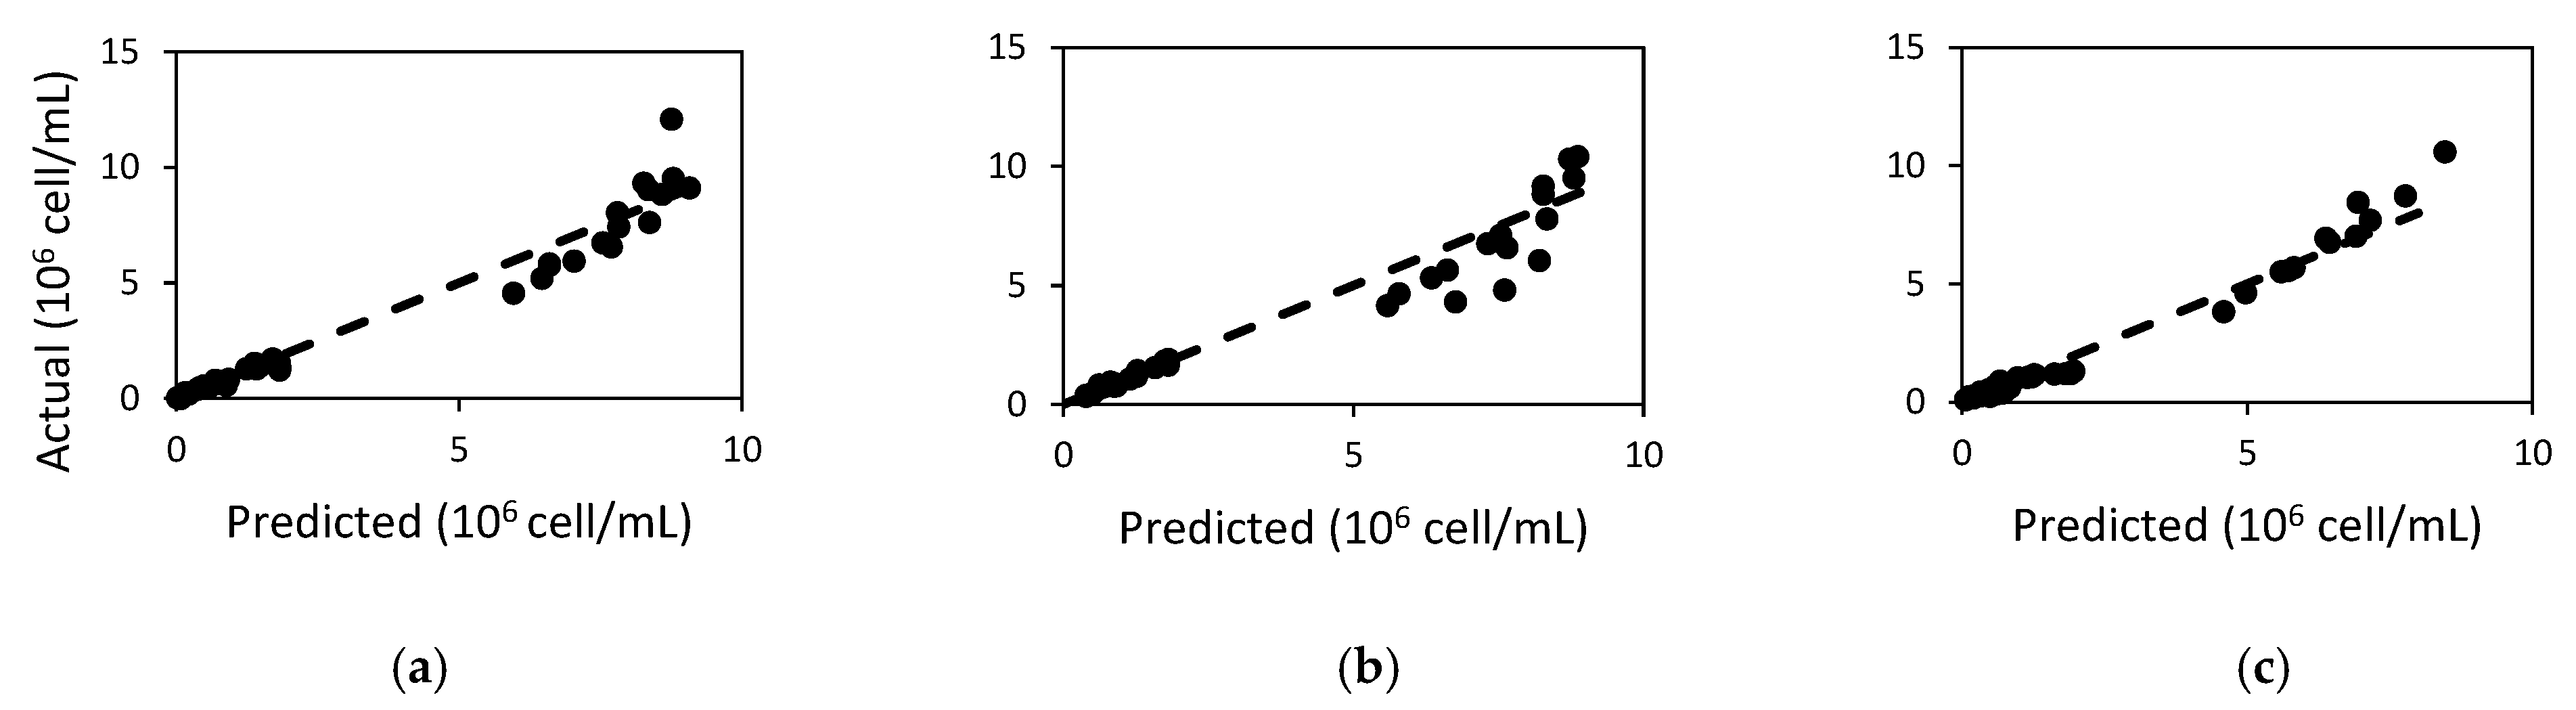
| Microcystis Strain | RMSE (×105) | MEFF | PRE | R2 |
|---|---|---|---|---|
| M. ichthyoblabe LP | 3.62 | 0.964 | 12.2 | 0.982 |
| M. ichthyoblabe TG | 4.31 | 0.934 | 1.12 | 0.970 |
| M. flos-aquae LP | 2.642 | 0.970 | 9.43 | 0.978 |
| Parameter (Unit) | M. ichthyoblabe LP | M. ichthyoblabe TG | M. flos-aquae LP | From Literature |
|---|---|---|---|---|
| (mg L−1) | 0.013 | 0.013 | 0.0063 | 0.00109–0.012 [32] |
| (mg L−1) | 0.19 | 0.19 | 0.1 | 0.008–0.53 [17,33,34] |
| (d−1 (µmol photons m−2 s−1)−1) | 0.06 | 0.06 | 0.025 | 0< (value depends on optimum light for growth, which varies between species and strain; [35,36]) |
| (d−1) | 1.81 | 1.81 | 1.8 | 0.493–2.2 [32,35] |
| (d−1 (µmol photons m−2 s−1)−1) | −0.00525 | −0.00525 | 0 | ≤0 (value depends on photoinhibition effect, which varies between species and strains) [35,36] |
| (–) | 1.4 | 1.4 | 1.309 | – |
| (–) | 0.7 | 0.7 | 0 | – |
| (–) | 1.0037 | 1.0037 | 1.0765 | – |
| (–) | 20.065 | 20.065 | 21 | – |
| (d−1) | 0.03 | 0.03 | 0.01 | – |
| (–) | 1.05 | 1.05 | 1.01 | – |
| (fg cell−1) | 2.8 | 2.8 | 2.3 | – |
| (fg cell−1 °C−1) | −0.55 | −0.61 | 0.49 | −2.15 [29] |
| (fg cell−1) | 14.7 | 17.8 | −14.7 | 177.1 [29] |
| (d−1) | 0.16 | 0.16 | 0.16 | 0.047–0.746 [37] |
| Site A | Site B | Site C | |||||||||||
|---|---|---|---|---|---|---|---|---|---|---|---|---|---|
| , , | Decay Rate (day−1) | MEFF | R2 | RMSE | PRE | MEFF | R2 | RMSE | PRE | MEFF | R2 | RMSE | PRE |
| 0, −2.15, 66.5 | 0.16 | −1.39 | 0.07 | 2.81 | 86.19 | −1.05 | 0.06 | 2.65 | 107.07 | −497.65 | 0.02 | 137.83 | 1497.23 |
| 0.623 | −0.62 | 0.04 | 2.31 | −53.28 | −0.94 | 0.09 | 2.57 | −51.83 | −58.31 | 0.02 | 47.54 | 437.87 | |
| Varied | 0.06 | 0.40 | 1.77 | 29.66 | 0.08 | 0.23 | 1.77 | −16.38 | −66.01 | 0.01 | 50.53 | 523.52 | |
| 2, −2.15, 60 | Varied | 0.15 | 0.40 | 1.67 | 25.75 | 0.16 | 0.32 | 1.70 | −23.25 | −50.68 | 0.00 | 44.37 | 451.19 |
| Site C without Day 150 | |||||
|---|---|---|---|---|---|
| , , | Decay Rate | MEFF | R2 | RE | PRE |
| 0, −0.55, 21.39 | 0.16 | 0.09 | 0.08 | 6.11 | 93.45 |
| 0.623 | 0.31 | 0.04 | 5.32 | −51.54 | |
| Varied | 0.75 | 0.53 | 3.20 | 6.89 | |
| 2, −2.15, 60 | Varied | 0.81 | 0.63 | 2.77 | −3.36 |
| Condition Name | Nitrogen (mg-N L−1) | Phosphorus (mg-P L−1) | Temperature (°C) | Irradiance (µmol m−2 s−1) | Light:Dark | |
|---|---|---|---|---|---|---|
| Varying nutrient | N = 1.5, P = 0.01 | 1.5 | 0.01 | 27 | 45 | 24:0 |
| N = 1.5, P = 0.05 | 0.05 | |||||
| N = 1.5, P = 0.5 | 0.5 | |||||
| N = 3, P = 0.01 | 3 | 0.01 | ||||
| N = 3, P = 0.05 | 0.05 | |||||
| N = 3, P = 0.5 | 0.5 | |||||
| Varying temperature | 27 °C | 28 | 6.19 | 27 | 60 | 12:12 |
| 30 °C | 30 | |||||
| 33 °C | 33 | |||||
| 36 °C | 36 | |||||
| Parameter | Range (Mean) | Unit |
|---|---|---|
| DO | 1.97–14.4 (6.77) | mg L−1 |
| Temperature | 26.2–30.9 (29.1) | °C |
| pH | 7.1–10.4 (8.50) | – |
| Conductivity | 107–303 (222) | µS cm−1 |
| Secchi depth | 19–100 (50.2) | cm |
| Chlorophyll a | 8.43–1585 (155) | µg L−1 |
| Total organic carbon | 3.12–24.6 (9.96) | mg L−1 |
| Total nitrogen (TN) | 0.61–4.36 (1.71) | mg L−1 |
| Total phosphorus (TP) | 0.0272–0.211 (0.0877) | mg L−1 |
| Turbidity | 5.76–225 (53.5) | NTU |
| Description | Equation | Reference |
|---|---|---|
| Rate of change of total microcystin (μg L−1 d−1) | [29] | |
| Microcystin production (fg cell−1) | Original model from [29] | |
| Microcystin production (fg cell−1) | Modified from [29] | |
| Microcystin decay rate (in field test) |
| Description | Equation | Reference |
|---|---|---|
| Rate of change of Microcystis (cell d−1) | ||
| Growth rate of Microcystis (d−1) | ||
| Temperature limitation | [33] | |
| Light limitation | [53] | |
| Nitrogen limitation | [54] | |
| Phosphorus limitation | [54] | |
| Microcystis respiration and mortality rate (d−1) | ||
| Irradiance (µmol photons m−2 s−1) |
Publisher’s Note: MDPI stays neutral with regard to jurisdictional claims in published maps and institutional affiliations. |
© 2022 by the authors. Licensee MDPI, Basel, Switzerland. This article is an open access article distributed under the terms and conditions of the Creative Commons Attribution (CC BY) license (https://creativecommons.org/licenses/by/4.0/).
Share and Cite
bte Sukarji, N.H.; He, Y.; Te, S.H.; Gin, K.Y.-H. Application of a Mechanistic Model for the Prediction of Microcystin Production by Microcystis in Lab Cultures and Tropical Lake. Toxins 2022, 14, 103. https://doi.org/10.3390/toxins14020103
bte Sukarji NH, He Y, Te SH, Gin KY-H. Application of a Mechanistic Model for the Prediction of Microcystin Production by Microcystis in Lab Cultures and Tropical Lake. Toxins. 2022; 14(2):103. https://doi.org/10.3390/toxins14020103
Chicago/Turabian Stylebte Sukarji, Nur Hanisah, Yiliang He, Shu Harn Te, and Karina Yew-Hoong Gin. 2022. "Application of a Mechanistic Model for the Prediction of Microcystin Production by Microcystis in Lab Cultures and Tropical Lake" Toxins 14, no. 2: 103. https://doi.org/10.3390/toxins14020103
APA Stylebte Sukarji, N. H., He, Y., Te, S. H., & Gin, K. Y.-H. (2022). Application of a Mechanistic Model for the Prediction of Microcystin Production by Microcystis in Lab Cultures and Tropical Lake. Toxins, 14(2), 103. https://doi.org/10.3390/toxins14020103