Dietary Exposure to Mycotoxins through Alcoholic and Non-Alcoholic Beverages in Valencia, Spain

 , and
, and
Abstract
:
1. Introduction
2. Results and Discussion
2.1. Analytical Method Validation
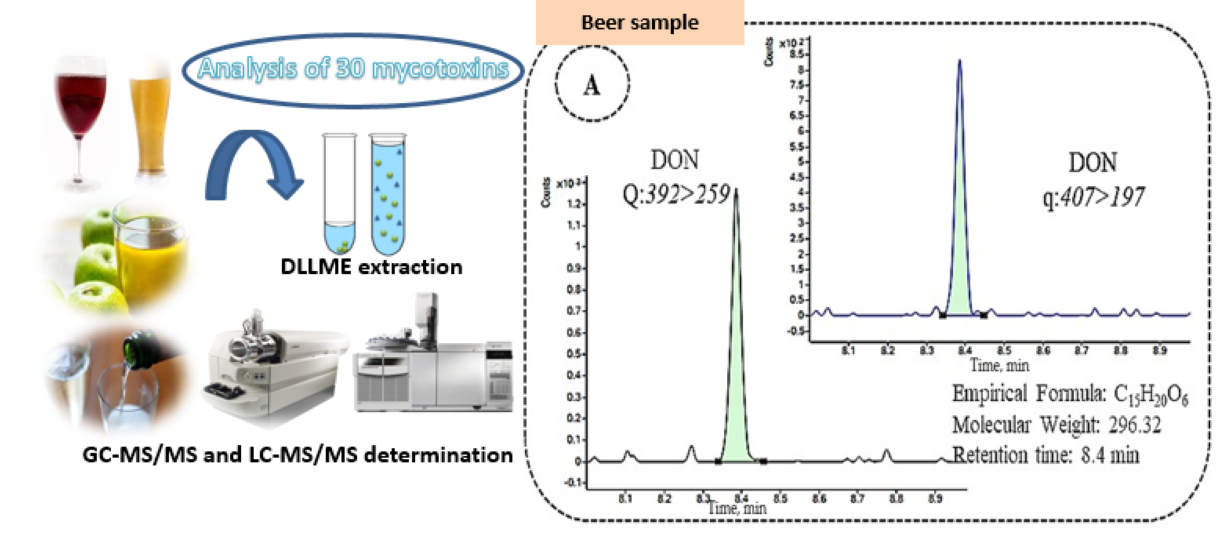
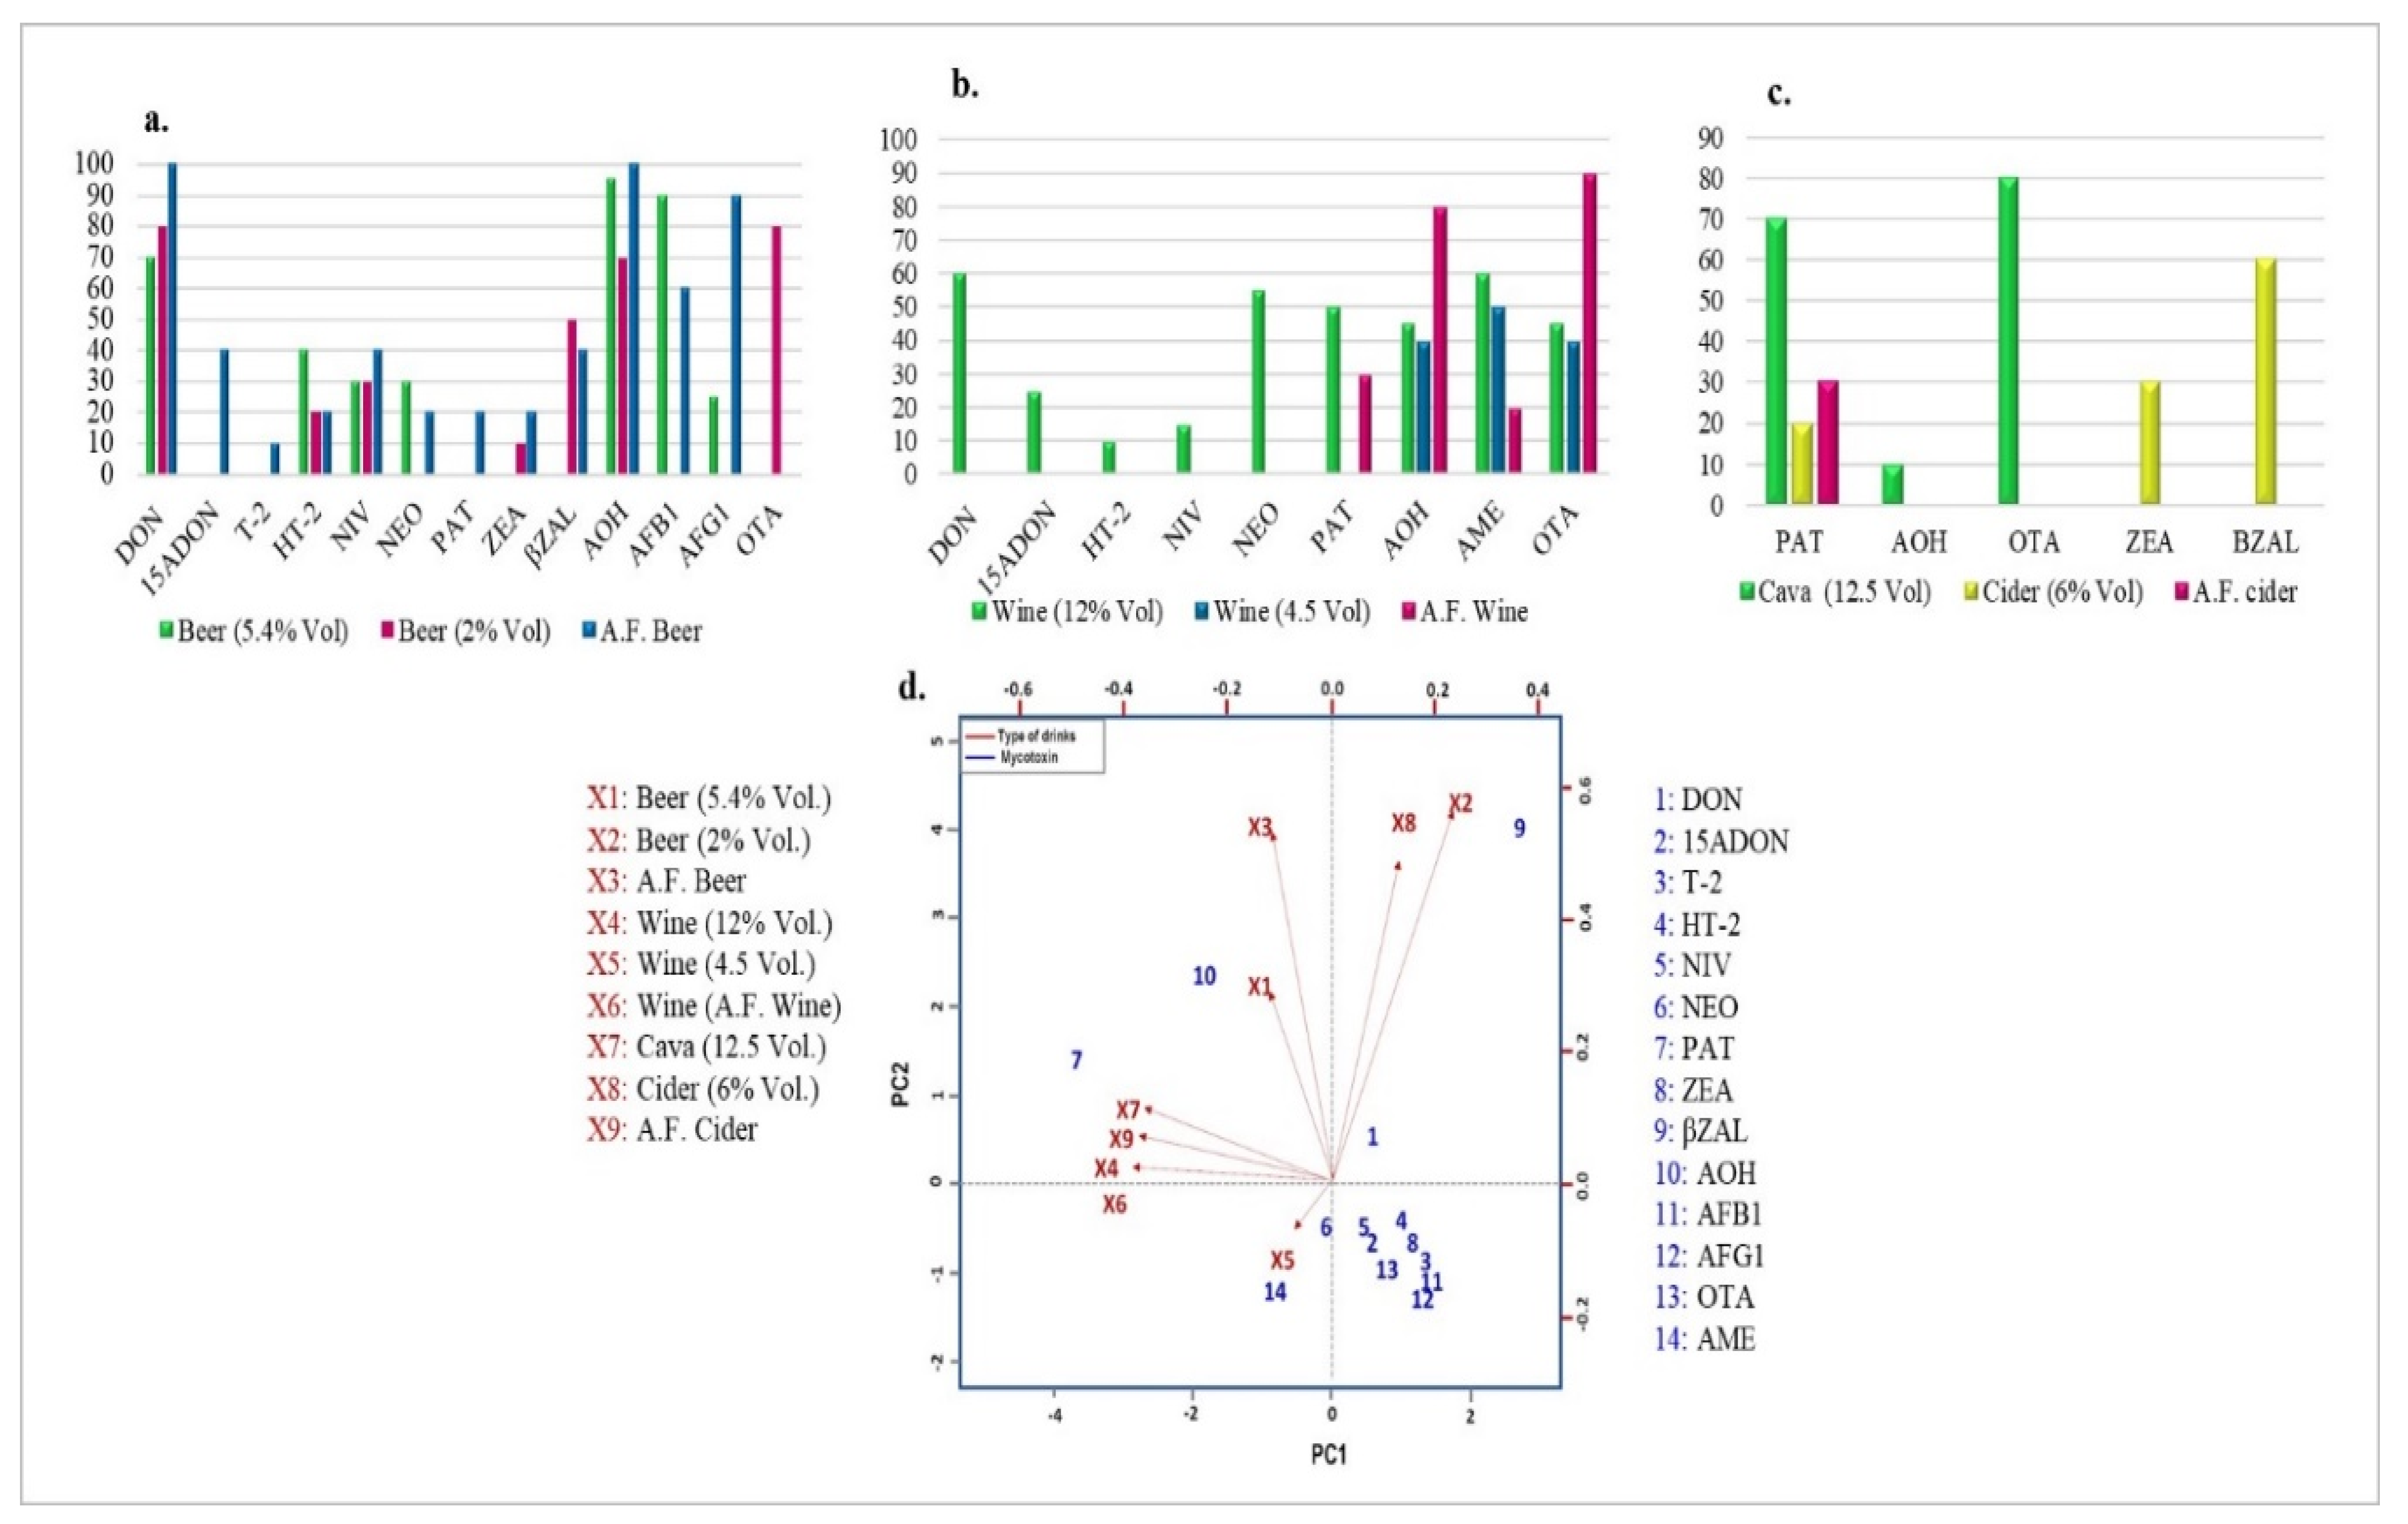
2.2. Mycotoxin Occurrence in Beer Samples
2.3. Mycotoxin Occurrence in Wine Samples
2.4. Mycotoxin Occurrence in Cava and Cider Samples
2.5. Multi-Mycotoxin Occurrence in the Analyzed Beverage Samples
2.6. Risk Assessment
3. Conclusions
4. Materials and Methods
4.1. Chemicals and Reagents
4.2. Standards and Solutions
4.3. Procedures
4.3.1. Samples
4.3.2. Dispersive Liquid–Liquid Microextraction
4.4. GC–MS/MS Analysis
4.5. LC–MS/MS Analysis
4.6. Method Validation
4.7. Statistical Analysis
4.8. Mycotoxin Dietary Intake Calculation
Author Contributions
Funding
Acknowledgments
Conflicts of Interest
References
- Reddy, K.; Abbas, H.K.; Abel, C.A.; Shier, W.T.; Salleh, B. Mycotoxin contamination of beverages: Occurrence of patulin in apple juice and ochratoxin A in coffee, beer and wine and their control methods. Toxins 2010, 2, 229–261. [Google Scholar] [CrossRef] [Green Version]
- Milani, J.; Maleki, G. Effects of processing on mycotoxin stability in cereals. J. Sci. Food Agric. 2014, 94, 2372–2375. [Google Scholar] [CrossRef]
- IARC-International Agency for Research on Cancer. Monographs on the Evaluation of Carcinogenic Risks to Humans: Chemical Agents and Related Occupations. A Review of Human Carcinogens; International Agency for Research on Cancer: Lyon, France, 2012. [Google Scholar]
- WHO (World Health Organization). Alcohol consumption. In Global Status Report on Alcohol and Health; Poznyak, V., Rekve, D., Eds.; World Health Organization: Geneva, Switzerland, 2018; pp. 38–46. [Google Scholar]
- Logrieco, A.; Ferracane, R.; Visconti, A.; Ritieni, A. Natural occurrence of fumonisin B2 in red wine from Italy. Food Addit. Contam. 2010, 27, 1136–1141. [Google Scholar] [CrossRef] [PubMed] [Green Version]
- Puangkham, S.; Poapolathep, A.; Jermnak, U.; Imsilp, K.; Tanhan, P.; Chokejaroenrat, C.; Poapolathep, S. Monitoring and health risk of mycotoxins in imported wines and beers consumed in Thailand. World Mycotoxin J. 2017, 10, 401–409. [Google Scholar] [CrossRef]
- EC. Commission Regulation EC 1881/2006 of 19 December 2006 Setting Maximum Levels for Certain Contaminants in Foodstuff. Off. J. Eur. Union 2006, L364, 5–18. [Google Scholar]
- Pizzutti, I.R.; de Kok, A.; Scholten, J.; Righi, L.W.; Cardoso, C.D.; Rohers, G.N.; da Silva, R.C. Development, optimization and validation of a multimethod for the determination of 36 mycotoxins in wines by liquid chromatography–tandem mass spectrometry. Talanta 2014, 129, 352–363. [Google Scholar] [CrossRef] [PubMed]
- Mariño-Repizo, L.; Gargantini, R.; Manzano, H.; Raba, J.; Cerutti, S. Assessment of ochratoxin A occurrence in Argentine red wines using a novel sensitive quechers-solid phase extraction approach prior to ultra-high performance liquid chromatography-tandem mass spectrometry methodology. J. Sci. Food Agric. 2017, 97, 2487–2497. [Google Scholar] [CrossRef] [PubMed]
- Rodríguez-Carrasco, Y.; Fattore, M.; Albrizio, S.; Berrada, H.; Mañes, J. Occurrence of Fusarium mycotoxins and their dietary intake through beer consumption by the European population. Food Chem. 2015, 178, 149–155. [Google Scholar] [CrossRef]
- Pascari, X.; Ortiz-Solá, J.; Marín, S.; Ramos, A.J.; Sanchis, V. Survey of mycotoxins in beer and exposure assessment through the consumption of commercially available beer in Lleida, Spain. LWT Food Sci. Technol. 2018, 92, 87–91. [Google Scholar] [CrossRef] [Green Version]
- Zachariasova, M.; Cajka, T.; Godula, M.; Malachova, A.; Veprikova, Z.; Hajslova, J. Analysis of multiple mycotoxins in beer employing (ultra)-high-resolution mass spectrometry. Rapid Commun. Mass Spectrom. 2010, 24, 3357–3367. [Google Scholar] [CrossRef]
- Veršilovskis, A.; De Saeger, S.; Mikelsone, V. Determination of sterigmatocystin in beer by high performance liquid chromatography with ultraviolet detection. World Mycotoxin J. 2008, 1, 161–166. [Google Scholar] [CrossRef]
- Cebollero, E.; Gonzalez, R. Induction of autophagy by second-fermentation yeasts during elaboration of sparkling wines. Appl. Environ. Microbiol. 2006, 72, 4121–4127. [Google Scholar] [CrossRef] [PubMed] [Green Version]
- Real, R.; Báez, J.C. The North Atlantic Oscillation affects the quality of Cava (Spanish sparkling wine). Int. J. Biometeorol. 2013, 57, 493–496. [Google Scholar] [CrossRef]
- EC. Commission Regulation No 2154/2005 of December 23rd supplementing the Annex to Regulation No 2400/96 as regards the entry of a name in the “Register of Protected Designation of Origin and Protected Geographical Indications” (Sidra de Asturias). Off. J. Eur. Union 2005, L324, 47. [Google Scholar]
- Lobo, A.P.; Antón-Díaz, M.J.; Bedriñana, R.P.; García, O.F.; Hortal-García, R.; Valles, B.S. Chemical, olfactometric and sensory description of single-variety cider apple juices obtained by cryo-extraction. LWT Food Sci. Technol. 2018, 90, 193–200. [Google Scholar] [CrossRef]
- Tangni, E.K.; Theys, R.; Mignolet, E.; Maudoux, M.; Michelet, J.Y.; Larondelle, Y. Patulin in domestic and imported apple-based drinks in Belgium: Occurrence and exposure assessment. Food Addit. Contam. 2003, 20, 482–489. [Google Scholar] [CrossRef] [PubMed]
- Leblanc, J.C.; Tard, A.; Volatier, J.L.; Verger, P. Estimated dietary exposure to principal food mycotoxins from the first French Total Diet Study. Food Addit. Contam. 2005, 22, 652–672. [Google Scholar] [CrossRef]
- Zgoła-Grześkowiak, A.; Grześkowiak, T. Dispersive liquid-liquid microextraction. TrAC Trend. Anal. Chem. 2011, 30, 1382–1399. [Google Scholar] [CrossRef]
- Rodríguez-Carrasco, Y.; Mañes, J.; Berrada, H.; Juan, C. Development and validation of a LC-ESI-MS/MS method for the determination of Alternaria toxins alternariol, alternariol methyl-ether and tentoxin in tomato and tomato-based products. Toxins 2016, 8, 328. [Google Scholar] [CrossRef] [Green Version]
- Serrano, A.B.; Font, G.; Mañes, J.; Ferrer, E. Development a mitigation strategy of enniatins in pasta under home-cooking conditions. LWT Food Sci. Technol. 2016, 65, 1017–1024. [Google Scholar] [CrossRef]
- Escrivá, L.; Manyes, L.; Font, G.; Berrada, H. Mycotoxin analysis of human urine by LC-MS/MS: A comparative extraction study. Toxins 2017, 9, 330. [Google Scholar] [CrossRef] [PubMed] [Green Version]
- Pereira, V.L.; Fernandes, J.O.; Cunha, S.C. Mycotoxins in cereals and related foodstuffs: A review on occurrence and recent methods of analysis. Trends Food Sci. Technol. 2014, 36, 96–136. [Google Scholar] [CrossRef]
- Bouafifssa, Y.; Manyes, L.; Rahouti, M.; Mañes, J.; Berrada, H.; Zinedine, A.; Fernández-Franzón, M. Multi-Occurrence of Twenty Mycotoxinsin Pasta and a Risk Assessment in the Moroccan Population. Toxins 2018, 10, 432. [Google Scholar] [CrossRef] [Green Version]
- Bauer, J.I.; Gross, M.; Gottschalk, C.; Usleber, E. Investigations on the occurrence of mycotoxins in beer. Food Control 2016, 63, 135–139. [Google Scholar] [CrossRef]
- Prelle, A.; Spadaro, D.; Garibaldi, A.; Gullino, M.L. A new method for detection of five alternaria toxins in food matrices based on LC–APCI-MS. Food Chem. 2013, 140, 161–167. [Google Scholar] [CrossRef]
- Papadopoulou-Bouraoui, A.; Vrabcheva, T.; Valzacchi, S.; Stroka, J.; Anklam, E. Screening survey of deoxynivalenol in beer from the European market by an enzyme-linked immunosorbent assay. Food Addit. Contam. 2004, 21, 607–617. [Google Scholar] [CrossRef]
- Juan, C.; Berrada, H.; Mañes, J.; Oueslati, S. Multi-mycotoxin determination in barley and derived products from Tunisia and estimation of their dietary intake. Food Chem. Toxicol. 2017, 103, 148–156. [Google Scholar] [CrossRef] [PubMed]
- Bertuzzi, T.; Rastelli, S.; Mulazzi, A.; Donadini, G.; Pietri, A. Mycotoxin occurrence in beer produced in several European countries. Food Control 2011, 22, 2059–2064. [Google Scholar] [CrossRef]
- Tamura, M.; Uyama, A.; Mochizuki, N. Development of a multi-mycotoxin analysis in beer-based drinks by a modified QuEChERS method and ultra-high-performance liquid chromatography coupled with tandem mass spectrometry. Anal. Sci. 2011, 27, 629. [Google Scholar] [CrossRef] [Green Version]
- Bryła, M.; Ksieniewicz-Woźniak, E.; Waśkiewicz, A.; Szymczyk, K.; Jędrzejczak, R. Co-occurrence of nivalenol, deoxynivalenol and deoxynivalenol-3-glucoside in beer samples. Food Control 2018, 92, 319–324. [Google Scholar] [CrossRef]
- Burdaspal, P.A.; Legarda, T.M. Survey on aflatoxin in beer sold in Spain and other European countries. World Mycotoxin J. 2013, 6, 93–101. [Google Scholar] [CrossRef]
- Mably, M.; Mankotia, M.; Cavlovic, P.; Tam, J.; Wong, L.; Pantazopoulos, P.; Calway, P.; Scott, P.M. Survey of aflatoxins in beer sold in Canada. Food Addit. Contam. 2005, 22, 1252–1257. [Google Scholar] [CrossRef] [PubMed]
- Benešová, K.; Běláková, S.; Mikulíková, R.; Svoboda, Z. Monitoring of selected aflatoxins in brewing materials and beer by liquid chromatography/mass spectrometry. Food Control 2012, 25, 626–630. [Google Scholar] [CrossRef]
- Molina-García, L.; Córdova, M.L.F.D.; Ruiz-Medina, A. Indirect determination of aflatoxin B1 in beer via a multi-commuted optical sensor. Food Addit. Contam. Part A 2012, 29, 392–402. [Google Scholar] [CrossRef]
- Matumba, L.; Monjerezi, M.; Khonga, E.B.; Lakudzala, D.D. Aflatoxins in sorghum, sorghum malt and traditional opaque beer in southern Malawi. Food Control 2011, 22, 266–268. [Google Scholar] [CrossRef]
- Coronel, M.B.; Marín, S.; Cano-Sancho, G.; Ramos, A.J.; Sanchis, V. Exposure assessment to ochratoxin A in Catalonia (Spain) based on the consumption of cereals, nuts, coffee, wine, and beer. Food Addit. Contam. Part A 2012, 29, 979–993. [Google Scholar] [CrossRef] [PubMed]
- Czerwiecki, L.; Czajkowska, D.; Witkowska-Gwiazdowska, A. On ochratoxin A and fungal flora in Polish cereals from conventional and ecological farms—Part 1: Occurrence of ochratoxin A and fungi in cereals in 1997. Food Addit. Contam. 2002, 19, 470–477. [Google Scholar] [CrossRef]
- Lasram, S.; Oueslati, S.; Chebil, S.; Mliki, A.; Ghorbel, A. Occurrence of ochratoxin A in domestic beers and wines from Tunisia by immunoaffinity clean-up and liquid chromatography. Food Addit. Contam. Part B 2013, 6, 1–5. [Google Scholar] [CrossRef]
- Rubert, J.; Soler, C.; Marín, R.; James, K.J.; Mañes, J. Mass spectrometry strategies for mycotoxins analysis in European beers. Food Control 2013, 30, 122–128. [Google Scholar] [CrossRef]
- Pascari, X.; Ramos, A.J.; Marín, S.; Sanchis, V. Mycotoxins and beer. Impact of beer production process on mycotoxin contamination. A review. Food Res. Int. 2018, 103, 121–129. [Google Scholar] [CrossRef] [Green Version]
- Zwickel, T.; Klaffke, H.; Richards, K.; Rychlik, M. Development of a high performance liquid chromatography tandem mass spectrometry based analysis for the simultaneous quantification of various Alternaria toxins in wine, vegetable juices and fruit juices. J. Chromatogr. A. 2016, 1455, 74–85. [Google Scholar] [CrossRef] [PubMed]
- Asam, S.; Konitzer, K.; Rychlik, M. Precise determination of the Alternaria mycotoxins alternariol and alternariol monomethyl ether in cereal, fruit and vegetable products using stable isotope dilution assays. Mycotoxin Res. 2011, 27, 23–28. [Google Scholar] [CrossRef] [PubMed]
- Scott, P.M.; Lawrence, G.A.; Lau, B.P.Y. Analysis of wines, grape juices and cranberry juices for Alternaria toxins. Mycotoxin Res. 2006, 22, 142–147. [Google Scholar] [CrossRef]
- De Jesus, C.L.; Bartley, A.; Welch, A.Z.; Berry, J.P. High Incidence and Levels of Ochratoxin A in Wines Sourced from the United States. Toxins 2017, 10, 1. [Google Scholar] [CrossRef] [PubMed] [Green Version]
- Al-Taher, F.; Banaszewski, K.; Jackson, L.; Zweigenbaum, J.; Ryu, D.; Cappozzo, J. Rapid method for the determination of multiple mycotoxins in wines and beers by LC-MS/MS using a stable isotope dilution assay. J. Agric. Food Chem. 2013, 61, 2378–2384. [Google Scholar] [CrossRef] [PubMed]
- Harris, K.L.; Bobe, G.; Bourquin, L.D. Patulin surveillance in apple cider and juice marketed in Michigan. J. Food Prot. 2009, 72, 1255–1261. [Google Scholar] [CrossRef] [PubMed]
- Frisvad, J.C. Mycotoxins and Mycotoxigenic Fungi in Storage; Marcel Dekker: New York, NY, USA, 1995. [Google Scholar]
- JECFA—Joint FAO/WHO Expert Committee on Food Additives. Safety Evaluation of Certain Mycotoxins in Food Prepared by the Fifty Sixth Meeting of the Joint FAO/WHO Expert Committee on Food Additives; WHO Food Additives Series 47; World Health Organization: Geneva, Switzerland, 2001. [Google Scholar]
- Pallarés, N.; Font, G.; Mañes, J.; Ferrer, E. Multimycotoxin LC–MS/MS Analysis in Tea Beverages after Dispersive Liquid–Liquid Microextraction (DLLME). J. Agric. Food Chem. 2017, 65, 10282–10289. [Google Scholar] [CrossRef]
- SANTE. Document No. SANTE/11813/2017. Guidance Document on Analytical Quality Control and Validation Procedures for Pesticide Residues Analysis in Food and Feed; European Commission, Directorate General for Health and Food Safety: Brussels, Belgium, 2017. [Google Scholar]
- Ruiz-Delgado, A.; Arrebola-Liébanas, F.J.; Romero-González, R.; López-Ruiz, R.; Garrido Frenich, A. Headspace solid-phase microextraction coupled to gas chromatography-tandem mass spectrometry for the determination of haloanisoles in sparkling (cava and cider) and non-sparkling (wine) alcoholic beverages. Food Addit. Contam. Part A 2016, 33, 1535–1544. [Google Scholar] [CrossRef]
- Le Cao, K.-A.; Rohart, F.; Gonzalez, I.; Dejean, S.; Gautier, B.; Bartolo, F.; Monget, P.; Coquery, J.; Yao, F.; Liquet, B. mixOmics: Omics Data Integration Project. R Package Version 6.1.1. 2016. Available online: https://CRAN.R-projectorg/package=mixOmics (accessed on 1 January 2021).
- Ministry of Agricultural and Environment. Report on Food Consumption in Spain 2016. Available online: http://www.mapama.gob.es (accessed on 15 January 2019).
- Rodríguez-Carrasco, Y.; Moltó, J.C.; Berrada, H.; Font, G. Determination of deoxynivalenol in wheat-based snacks by gas chromatography-triple quadrupole tandem mass spectrometry. Rev. Toxicol. 2013, 30, 198–202. [Google Scholar]
- SCF-Scientific Committee on Food. Opinion of the Scientific Committee on Food on Fusarium Toxins. Part 6: Group Evaluation of T-2 Toxin, HT-2 Toxin, Nivalenol and Deoxynivalenol. SCF/CS/CNTM/MYC/27. 2002, pp. 1–12. Available online: https://ec.europa.eu/food/system/files/2020-12/sci-com_scf_out123_en.pdf (accessed on 1 February 2021).


| Mycotoxin g | RT a (min) | Transitions | Beer | Wine and Similar Beverages | |||||||||||
|---|---|---|---|---|---|---|---|---|---|---|---|---|---|---|---|
| Quantitative | Qualitative | Recovery (%) | Recovery (%) | ||||||||||||
| LOD b | LOQ c | SSE d | Spiked Level µg/L | LOD b | LOQ c | SSE d | Spiked Level µg/L | ||||||||
| µg/L | µg/L | (%) | 50 | 100 | 200 | µg/L | µg/L | (%) | 50 | 100 | 200 | ||||
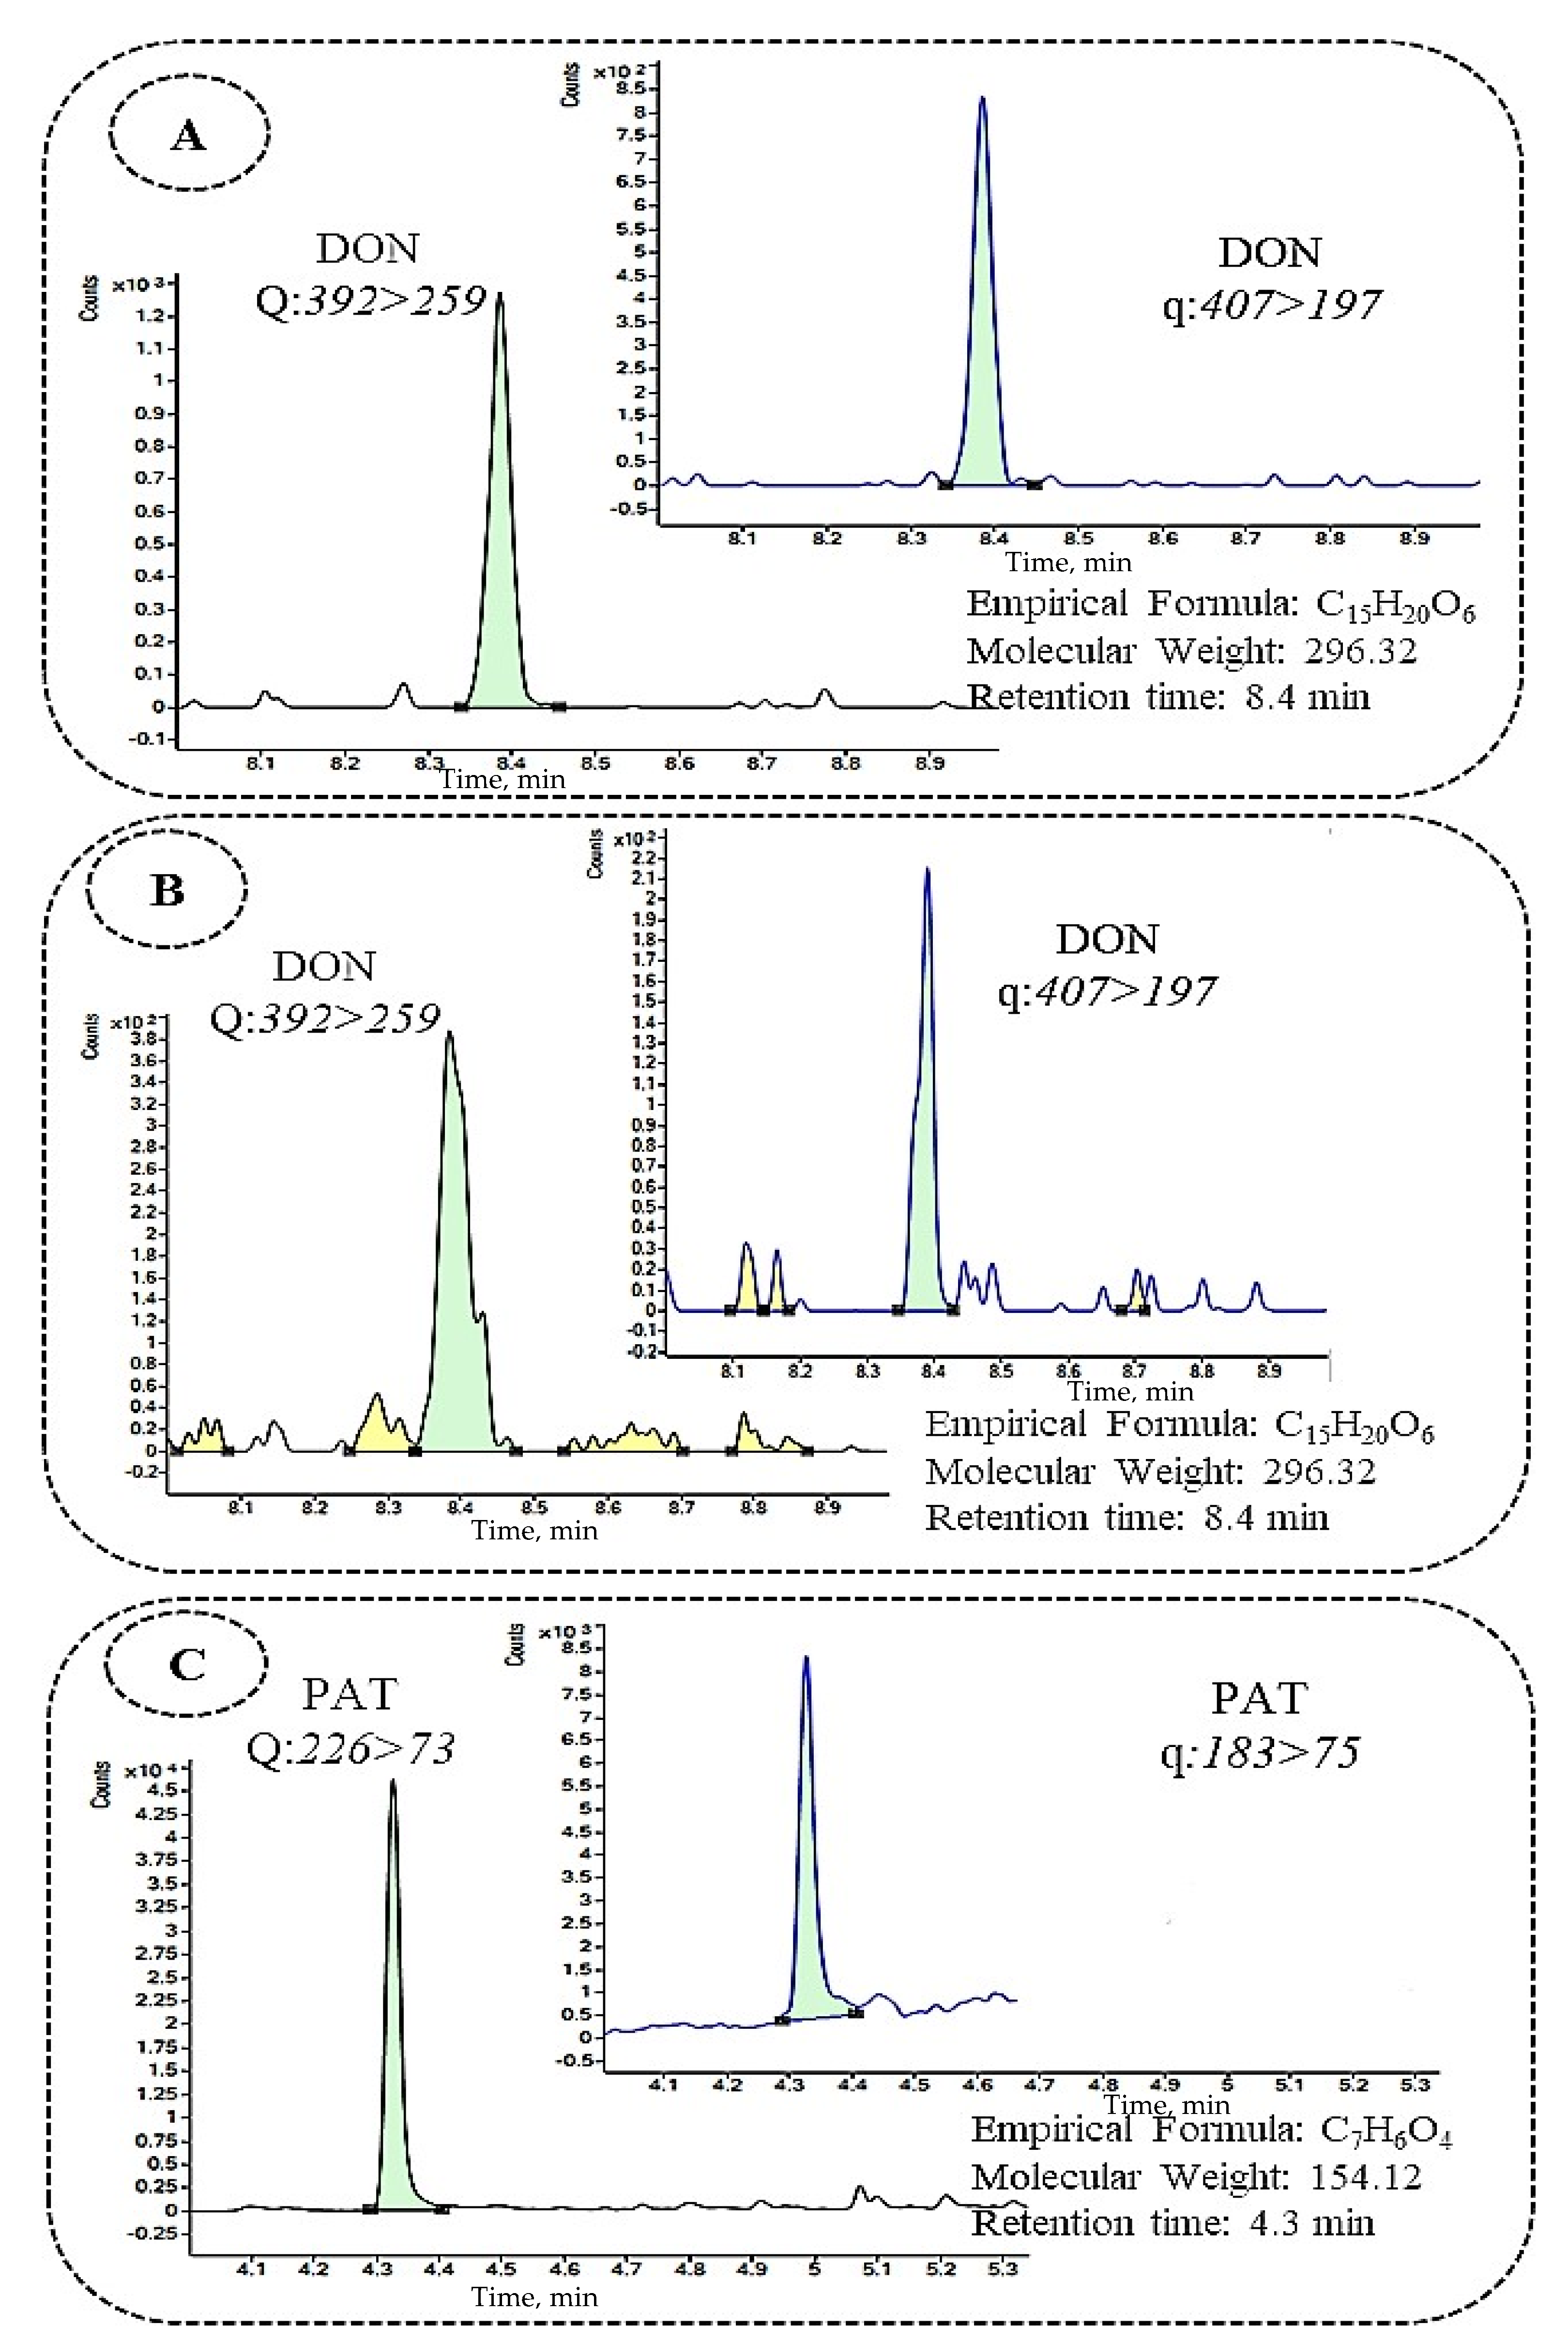
| DON e | 8.4 | 392 > 259 | 407 > 197 | 0.58 | 1.95 | 95 | 68 | 69 | 71 | 0.58 | 1.95 | 96 | 79 | 77 | 71 |
| 3-ADON e | 9.45 | 392 > 259 | 467 > 147 | 1.17 | 3.90 | 78 | 69 | 100 | 106 | 1.17 | 3.90 | 94 | 100 | 99 | 104 |
| 15-ADON e | 9.65 | 292 > 217 | 392 > 184 | 0.58 | 1.95 | 92 | 87 | 97 | 91 | 0.58 | 1.95 | 92 | 103 | 101 | 102 |
| DAS e | 9.73 | 350 > 229 | 378 > 124 | 0.58 | 1.95 | 96 | 67 | 78 | 99 | 0.58 | 1.95 | 96 | 116 | 94 | 98 |
| NEO e | 11.68 | 252 > 195 | 252 > 167 | 0.58 | 1.95 | 92 | 67 | 93 | 83 | 0.58 | 1.95 | 96 | 96 | 98 | 101 |
| NIV e | 10.15 | 289 > 73 | 379 > 73 | 2.34 | 7.81 | 94 | 71 | 75 | 88 | 2.34 | 7.81 | 94 | 114 | 114 | 101 |
| T-2 e | 14.39 | 350 > 244 | 350 > 229 | 2.34 | 7.81 | 72 | 69 | 91 | 102 | 2.34 | 7.81 | 74 | 107 | 100 | 99 |
| HT-2 e | 14.80 | 347 > 157 | 347 > 185 | 0.58 | 1.95 | 78 | 71 | 113 | 107 | 1.17 | 3.90 | 94 | 86 | 101 | 101 |
| PAT e | 4.3 | 226 > 73 | 183 > 75 | 2.34 | 7.81 | 81 | 74 | 81 | 92 | 1.17 | 3.90 | 84 | 61 | 96 | 91 |
| FUS-X e | 9.55 | 450 > 260 | 450 > 245 | 2.34 | 7.81 | 93 | 89 | 84 | 80 | 1.17 | 3.90 | 100 | 87 | 97 | 96 |
| ZON e | 15.95 | 462 > 151 | 462 > 333 | 2.34 | 7.81 | 111 | 67 | 77 | 97 | 1.17 | 3.90 | 90 | 108 | 103 | 91 |
| α-ZAL e | 15.45 | 433 > 309 | 433 > 295 | 1.17 | 3.90 | 101 | 89 | 99 | 107 | 0.58 | 1.95 | 114 | 98 | 99 | 109 |
| β-ZAL e | 15.68 | 307 > 292 | 307 > 277 | 2.34 | 7.81 | 72 | 72 | 67 | 106 | 2.34 | 7.81 | 101 | 95 | 66 | 87 |
| α-ZOL e | 16.45 | 305 > 289 | 305 > 73 | 1.17 | 3.90 | 87 | 75 | 71 | 93 | 2.34 | 7.81 | 104 | 77 | 100 | 96 |
| β-ZOL e | 16.83 | 536 > 446 | 536 > 333 | 1.17 | 3.90 | 93 | 66 | 73 | 108 | 2.34 | 7.81 | 71 | 106 | 104 | 106 |
| AFB1 f | 7.41 | 313 > 241 | 313 > 289 | 0.06 | 0.2 | 85 | 83 | 86 | 81 | 0.3 | 1 | 79 | 71 | 79 | 98 |
| AFB2 f | 7.36 | 315 > 286 | 315 > 259 | 0.3 | 1 | 95 | 85 | 97 | 85 | 1.5 | 5 | 81 | 78 | 89 | 83 |
| AFG1 f | 7.23 | 329 > 243 | 329 > 311 | 0.06 | 0.2 | 77 | 81 | 92 | 82 | 0.3 | 1 | 91 | 111 | 98 | 70 |
| AFG2 f | 7.13 | 331 > 313 | 331 > 245 | 0.3 | 1 | 81 | 70 | 108 | 101 | 1.5 | 5 | 79 | 86 | 85 | 109 |
| AOH f | 8.03 | 259 > 128 | 259 > 184 | 0.3 | 1 | 111 | 89 | 111 | 91 | 0.03 | 0.1 | 92 | 101 | 90 | 107 |
| AME f | 9.10 | 273 > 128 | 273 > 228 | 1.5 | 5 | 78 | 76 | 98 | 103 | 0.3 | 1 | 84 | 99 | 76 | 89 |
| FB1 f | 7.7 | 722 > 334 | 722 > 352 | 1.5 | 5 | 71 | 83 | 71 | 87 | 1.5 | 5 | 76 | 69 | 71 | 79 |
| FB2 f | 7.85 | 706 > 336 | 706 > 318 | 1.5 | 5 | 87 | 76 | 69 | 82 | 1.5 | 5 | 86 | 71 | 65 | 69 |
| ENN A f | 11.74 | 699 > 228 | 699 > 210 | 0.03 | 0.1 | 110 | 69 | 85 | 82 | 0.15 | 0.5 | 71 | 72 | 85 | 87 |
| ENN A1 f | 11.3 | 685 > 214 | 685 > 210 | 0.15 | 0.5 | 106 | 85 | 94 | 93 | 0.03 | 0.1 | 86 | 69 | 82 | 102 |
| ENN B f | 10.73 | 657 > 196 | 657 > 214 | 0.15 | 0.5 | 92 | 91 | 103 | 98 | 0.15 | 0.5 | 111 | 73 | 85 | 86 |
| ENN B1 f | 10.68 | 671 > 214 | 671 > 228 | 0.03 | 0.1 | 91 | 72 | 114 | 102 | 0.15 | 0.5 | 88 | 73 | 85 | 86 |
| BEA f | 10.84 | 801 > 784 | 801 > 244 | 0.3 | 1 | 75 | 98 | 94 | 96 | 1.5 | 5 | 87 | 75 | 83 | 88 |
| STG f | 9.08 | 325 > 281 | 325 > 310 | 1.5 | 5 | 96 | 83 | 93 | 81 | 1.5 | 5 | 95 | 85 | 81 | 89 |
| OTA f | 8.68 | 404 > 102 | 404 > 239 | 0.06 | 0.2 | 99 | 79 | 89 | 87 | 0.15 | 0.5 | 104 | 107 | 84 | 85 |
| Mycotoxin | Beer a (n = 20) | A.F. Beer b (n = 10) | Beer with Lemonade (n = 10) | TOTAL (n = 40) | ||||||||
|---|---|---|---|---|---|---|---|---|---|---|---|---|
| I e (%) | Mean µg/L | Range µg/L | I e (%) | Mean µg/L | Range µg/L | I e (%) | Mean µg/L | Range µg/L | I e (%) | Mean µg/L | Range µg L | |
| AFB1 c | 90 | 1.06 ± 0.15 | 0.87–1.38 | 60 | 2.70 ± 4 | 1–10.60 | - | n.d. | n.d. | 60 | 1.88 ± 1 | 0.87–10.60 |
| AFG1 c | 25 | 1.47 ± 0.9 | 0.43–2.92 | 90 | 0.85 ± 0.6 | 0.7–1.98 | - | n.d. | n.d. | 35 | 1.16 ± 1 | 0.43–2.92 |
| AOH c | 95 | 24.93 ± 10.42 | 8.83–49.82 | 100 | 28.81 ± 9 | 20.25–48.37 | 70 | 4.44 ± 2 | 2.01–8.32 | 90 | 19.39 ± 13 | 2.01–49.82 |
| 15-ADON d | - | n.d. | n.d. | 40 | 12.08 ± 1 | 10.78–12.93 | - | n.d. | n.d. | 10 | 12.08 ± 1 | 10.78–12.93 |
| β-ZAL d | - | n.d. | n.d. | 50 | 43.19 ± 9 | 31.46–54.76 | 50 | 42.97 ± 1.89 | 40.43–45.25 | 25 | 43.08 | 31.46–54.76 |
| DON d | 70 | 8.65 ± 0.12 | 8.50–8.82 | 100 | 9.63 ± 1 | 8.58–11.82 | 80 | 8.76 ± 0.28 | 8.44–9.35 | 80 | 9.01 ± 0.5 | 8.44–11.82 |
| HT-2 d | 40 | 16.31 ± 1 | 14.42–18.59 | 20 | 14.43 ± 5 | 11.20–17.67 | 20 | 15.15 ± 0.07 | 15.10–15.21 | 30 | 15.29 ± 0.9 | 11.20–18.59 |
| NEO d | 30 | 14.20 ± 0.25 | 13.86–14.46 | 20 | 15.17 ± 2 | 13.90–16.44 | - | n.d. | n.d. | 20 | 14.67 ± 0.6 | 13.86–16.44 |
| NIV d | 30 | 10.40 ± 1 | 8.96–14.01 | 40 | 10.34 ± 2 | 8.96–12.52 | 30 | 9.34 ± 0.24 | 9.13–9.60 | 30 | 10.01 ± 0.5 | 8.96–14.01 |
| OTA c | - | n.d. | n.d. | - | n.d. | n.d. | 80 | 1.83 ± 1.18 | 0.24–3.38 | 20 | 1.83 ± 1 | 0.24–3.38 |
| PAT d | - | n.d. | n.d. | 20 | 43.18 ± 0.4 | 42.89–43.48 | - | n.d. | n.d. | 5 | 43.18 ± 0.4 | 42.89–43.48 |
| T-2 d | - | n.d. | n.d. | 10 | 29.88 ± 8 | 29.88 ± 8 | - | n.d. | n.d. | 3 | 29.88 ± 8 | 29.88 ± 8 |
| ZON d | - | n.d. | n.d. | 20 | 14.95 ± 1 | 13.80–16.10 | 10 | 13.60 ± 0.2 | 13.60 ± 0.2 | 8 | 14.17 ± 0.9 | 13.60–16.10 |
| Mycotoxin | Wine a (n = 20) | A.F. Wine b (n = 10) | Wine with Lemonade (n = 10) | TOTAL (n = 40) | ||||||||
|---|---|---|---|---|---|---|---|---|---|---|---|---|
| I e (%) | Mean µg/L | Range µg/L | I e (%) | Mean µg/L | Range µg/L | I e (%) | Mean µg/L | Range µg/L | I e (%) | Mean µg/L | Range µg/L | |
| AOH c | 45 | 7.79 ± 8 | 1.55–26.86 | 80 | 5.35 ± 3 | 0.83–9.29 | 40 | 2.56 ± 2 | 0.61–4.65 | 52 | 5.23 ± 2 | 0.61–26.86 |
| AME c | 60 | 7.55 ± 5 | 1.36–18.05 | 50 | 16.40 ± 4 | 11.14–23.13 | 20 | 12.33 ± 2 | 10.82–13.85 | 50 | 12.09 ± 4 | 1.36–23.13 |
| 15-ADON d | 25 | 11.28 ± 0.5 | 10.61–11.91 | - | n.d. | n.d. | - | n.d. | n.d. | 12 | 11.28 ± 0.5 | 10.61–11.91 |
| β-ZAL d | - | n.d. | n.d. | - | n.d. | n.d. | 20 | 25.86 ± 3 | 23.33–28.40 | 5 | 25.86 ± 3 | 23.33–28.40 |
| DON d | 60 | 8.85 ± 0.3 | 8.47–9.69 | - | n.d. | n.d. | - | n.d. | n.d. | 30 | 8.85 ± 0.3 | 8.48–9.69 |
| HT-2 d | 10 | 15.65 ± 0.1 | 15.55–15.75 | - | n.d. | n.d. | - | n.d. | n.d. | 5 | 15.65 ± 0.1 | 15.55–15.75 |
| NEO d | 45 | 14.27 ± 0.3 | 13.89–14.97 | - | n.d. | n.d. | - | n.d. | n.d. | 22 | 14.27 ± 0.3 | 13.89–14.97 |
| NIV d | 15 | 21.26 ± 4 | 18.06–26.58 | - | n.d | n.d. | 20 | 10.55 ± 0.6 | 10.07–11.03 | 12 | 16.05 ± 7 | 10.07–26.58 |
| OTA c | 45 | 1.12 ± 0.5 | 0.66–2.28 | 90 | 1.08 ± 0.2 | 0.57–1.50 | 40 | 1.21 ± 0.4 | 0.60–1.79 | 47 | 1.13 ± 0.06 | 0.57–2.28 |
| PAT c | 50 | 31.66 ± 22 | 15.35–88.24 | 30 | 17.63 ± 4 | 14.67–22.97 | - | n.d. | n.d. | 32 | 24.64 ± 9 | 15.35–88.24 |
| Mycotoxin | Cava (n = 10) | Cider a (n = 10) | A.F. Cider b (n = 10) | TOTAL (n = 30) | ||||||||
|---|---|---|---|---|---|---|---|---|---|---|---|---|
| I e (%) | Mean µg/L | Range µg/L | I e (%) | Mean µg/L | Range µg/L | I e (%) | Mean µg/L | Range µg/L | I e (%) | Mean µg/L | Range µg/L | |
| AOH c | 10 | 21.56 ± 1 | 21.56 ± 1 | - | n.d | n.d. | - | n.d. | n.d. | 3 | 21.56 ± 1 | 21.56 ± 1 |
| β-ZAL d | - | n.d. | - | 60 | 61.48 ± 30 | 25.17–102.96 | - | n.d. | n.d. | 20 | 61.48 ± 30 | 25.17–102.96 |
| OTA c | 80 | 1.36 ± 0.6 | 0.77–2.44 | - | n.d. | n.d. | - | n.d. | n.d. | 26 | 1.36 ± 0.6 | 0.77–2.44 |
| PAT d | 70 | 17.81 ± 3 | 14.73–24.66 | 20 | 25.79 ± 5 | 21.69–29.98 | 30 | 35.86 ± 7 | 26.85–41.93 | 40 | 26.48 ± 9 | 14.73–41.93 |
| ZON d | - | n.d. | n.d. | 30 | 11.53 ± 13 | 2.53–26.41 | - | n.d. | n.d. | 10 | 11.53 ± 13 | 2.53–26.41 |
| Co-Occurrence | Sample (N) | Sum. C.Min. | Sum. C.Max. | Sum PDI Min. | TDI | Sum PDI Max. | TDI |
|---|---|---|---|---|---|---|---|
| (µg/L) | (µg/L) | (ng/kg bw/day) | (%) | (ng/kg bw/day) | (%) | ||
| Two mycotoxins | |||||||
| AOH, AFB1 | Beer (1) | 22.95 | - | 13.11 | - | - | - |
| NIV, AOH | Beer (1) | 22.84 | - | 13.05 | 0.66 | - | - |
| DON, OTA | Beer with lemonade (1) | 10.86 | - | 1.24 | 0.26 | - | - |
| AOH, AME | A.F. Wine (1) | 16.56 | - | 0.79 | - | - | |
| OTA, AOH | A.F. Wine (2) | 4.45 | 5.78 | 0.19 | 0.14 | 0.24 | 0.28 |
| OTA, NIV | Wine with lemonade (1) | 12.22 | - | 0.52 | 0.30 | - | - |
| OTA, β-ZAL | Wine with lemonade (1) | 30.19 | - | 1.29 | 0.93 | - | - |
| PAT, OTA | Cava (6) | 17.60 | 25.52 | 0.25 | 0.18 | 0.36 | 0.18 |
| ZON, βZAL | Cider (2) | 50.90 | 129.37 | 0.41 | 0.17 | 1.10 | 0.44 |
| PAT, βZAL | Cider (2) | 46.86 | 63.28 | 0.40 | 0.13 | 0.54 | 0.17 |
| Three mycotoxins | |||||||
| DON, AOH, AFB1 | Beer (2) | 30.22 | 46.30 | 17.26 | 0.49 | 26.45 | 0.50 |
| HT-2, AOH, AFB1 | Beer (1) | 67.29 | - | 38.45 | 10.62 | - | - |
| AOH, AFB1, AFG1 | Beer (1) | 17.80 | - | 10.17 | - | - | - |
| βZAL, AOH, OTA | Beer with lemonade (1) | 52.05 | - | 5.94 | 4.09 | - | - |
| DON, AOH, OTA | Beer with lemonade (2) | 11.05 | 16.56 | 1.26 | 0.26 | 1.89 | 0.27 |
| DON, OTA, AME | Wine (1) | 11.98 | - | 1.37 | 1.04 | - | - |
| DON, 15ADON, NEO | Wine (1) | 35.64 | - | 4.07 | 0.24 | - | - |
| DON, NEO, PAT | Wine (1) | 59.51 | - | 6.80 | 1.15 | - | - |
| DON, PAT, AME | Wine (1) | 103.92 | - | 11.87 | 2.61 | - | - |
| PAT, AOH, AME | A.F. Wine (1) | 39.17 | - | 1.67 | 0.16 | - | - |
| OTA, AOH, AME | A.F. Wine (2) | 16.08 | 28.43 | 0.68 | 0.15 | 1.21 | 0.37 |
| PAT, AOH, OTA | A.F. Wine (1) | 17.57 | - | 0.75 | 0.51 | - | - |
| PAT, OTA, AME | A.F. Wine (1) | 47.37 | - | 2.03 | - | 0.36 | - |
| Four mycotoxins | - | ||||||
| DON, NEO, AOH, AFB1 | Beer (4) | 39.54 | 48.32 | 22.59 | 0.49 | 27.61 | 0.50 |
| DON, HT-2, AOH, AFB1 | Beer (2) | 52.44 | 54.96 | 29.96 | 9.09 | 31.40 | 10.80 |
| NIV, βZAL, AOH, OTA | Beer with lemonade (1) | 60.46 | - | 6.90 | 3.55 | - | - |
| DON, 15ADON, βZAL, AOH | A.F. Beer (1) | 77.52 | - | 8.85 | 1.69 | - | - |
| DON, βZAL, AOH, AFG1 | A.F. Beer (2) | 68.86 | 79.44 | 7.84 | 1.76 | 9.07 | 2.34 |
| DON, 15ADON, NEO, PAT | Wine (1) | 51.15 | - | 5.84 | 0.70 | - | - |
| PAT, OTA, AOH, AME | Wine (2) | 44.37 | 77.93 | 5.07 | 1.01 | 8.91 | 1.42 |
| NIV, OTA, AOH, AME | Wine (1) | 42.07 | - | 4.81 | 1.06 | - | - |
| Five mycotoxins | |||||||
| DON, HT2, NIV, AOH, AFB1 | Beer (1) | 83.20 | - | 47.54 | 9.15 | - | - |
| DON, NIV, AOH, AFB1, AFG1 | Beer (1) | 44.73 | - | 25.56 | 0.93 | - | - |
| DON, NIV, NEO, AOH, AFB1 | Beer (1) | 60.37 | - | 31.21 | 0.48 | - | - |
| DON, HT-2, AOH, AFB1, AFG1 | Beer (2) | 52.97 | 56.15 | 30.26 | 10.02 | 32.08 | 15.21 |
| DON, HT-2, AOH, AFB1, AFG1 | A.F. Beer (1) | 67.17 | - | 7.67 | 1.38 | - | - |
| DON, NIV, AOH, AFB1, AFG1 | A.F. Beer (1) | 53.84 | - | 6.15 | 0.10 | - | - |
| DON, 15ADON, βZAL, AOH, AFG1 | A.F. Beer (1) | 91.48 | - | 10.45 | 2.29 | - | - |
| DON, HT2, βZAL, AOH, OTA | Beer with lemonade (1) | 72.46 | - | 8.28 | 5.20 | - | - |
| HT-2, NIV, PAT, AOH, AME | Wine (1) | 63.14 | - | 5.41 | 0.88 | - | - |
| DON, NEO, OTA, AOH, AME | Wine (1) | 36.90 | - | 4.22 | 1.64 | - | - |
| DON, 15ADON, HT-2, NEO, PAT | Wine (1) | 80.63 | - | 9.21 | 0.94 | - | - |
| DON, 15ADON, NEO, AOH, AME | Wine (1) | 61.65 | - | 7.04 | 0.22 | - | - |
| HT2, NIV, PAT, AOH, AME | Wine (1) | 63.14 | - | 5.41 | 0.88 | - | - |
| Six mycotoxins | - | ||||||
| DON, NIV, NEO, AOH, AFB1, AFG1 | Beer (1) | 60.37 | - | 34.49 | 0.49 | - | - |
| DON, 15ADON, βZAL, AOH, AFB1, AFG1 | A.F. Beer (1) | 104.82 | - | 11.97 | 2.78 | - | - |
| DON, NIV, PAT, AOH, AFB1, AFG1 | A.F. Beer (1) | 84.56 | - | 9.66 | 1.43 | - | - |
| DON, HT-2, NIV, βZAL, AOH, OTA | Beer with lemonade (1) | 83.15 | - | 8.53 | 6.14 | - | - |
| DON, NIV, ZON, βZAL, AOH, OTA | Beer with lemonade(1) | 77.89 | - | 8.90 | 3.55 | - | - |
| DON, NEO, PAT, OTA, AOH, AME | Wine (1) | 51.15 | - | 5.85 | 0.79 | - | - |
| DON, 15ADON, NIV, NEO, PAT, AOH | Wine (1) | 80.63 | - | 9.21 | 0.94 | - | - |
| Eight mycotoxins | - | - | |||||
| DON, 15ADON, NIV, NEO, ZON, AOH, AFB1, AFG1 | A.F. Beer (1) | 108.10 | - | 12.35 | 0.94 | - | - |
| Ten mycotoxins | - | - | |||||
| DON, T-2, HT-2, NIV, NEO, PAT, ZON, AOH, AFB1, AFG1 | AF. Beer (1) | 185.15 | - | 21.16 | 7.62 | - | - |
| Beer | A.F. Beer | Beer with Lemonade | Wine | A.F. Wine | Wine with Lemonade | Cava | Cider Alcohol | A.F. Cider | ||||||||||
|---|---|---|---|---|---|---|---|---|---|---|---|---|---|---|---|---|---|---|
| Mycotoxin | PDI (ng/kg bw/day) | % TDI | PDI (ng/kg bw/day) | % TDI | PDI (ng/kg bw/day) | % TDI | PDI (ng/kg bw/day) | % TDI | PDI (ng/kg bw day) | % TDI | PDI (ng/kg bw/day) | % TDI | PDI (ng kg bw/day) | % TDI | PDI (ng/kg bw/day) | % TDI | PDI (ng/kg bw/day) | % TDI |
| AFB1 | 0.63 | - | 0.32 | - | - | - | - | - | - | - | - | - | - | - | - | - | - | |
| AFG1 | 0.88 | - | 0.10 | - | - | - | - | - | - | - | - | - | - | - | - | - | - | - |
| AME | - | - | - | - | - | - | 0.89 | - | 0.80 | - | 0.60 | - | - | - | - | - | - | - |
| AOH | 15.01 | - | 3.5 | - | 0.54 | - | 0.92 | - | 0.26 | - | 0.12 | - | 0.5 | - | - | - | - | - |
| 15ADON | - | - | 1.47 | 0.14 | - | - | 1.33 | 0.13 | - | - | - | - | - | - | - | - | - | - |
| β-ZAL | - | - | 5.25 | 2.10 | 5.23 | 2.09 | - | - | - | - | 1.26 | 0.50 | - | - | 0.60 | 0.24 | - | - |
| DON | 5.21 | 0.52 | 1.17 | 0.11 | 1.06 | 0.10 | 1.04 | 0.10 | - | - | - | - | - | - | - | - | - | - |
| HT-2 | 9.82 | 9.82 | 1.76 | 1.76 | 1.84 | 1.84 | 1.84 | 1.84 | - | - | - | - | - | - | - | - | - | - |
| NEO | 8.54 | - | 1.84 | - | - | - | 1.69 | - | - | - | - | - | - | - | - | - | - | - |
| NIV | 6.24 | 0.52 | 1.25 | 0.10 | 1.13 | 0.09 | 2.51 | 0.20 | - | - | 0.51 | 0.04 | - | - | - | - | - | - |
| OTA | - | - | - | - | 0.22 | 1.31 | 0.13 | 0.77 | 0.05 | 0.31 | 0.06 | 0.35 | 0.03 | 0.18 | - | - | - | - |
| PAT | - | - | 5.25 | 1.31 | - | - | 3.74 | 0.93 | 0.86 | 0.21 | - | - | 0.40 | 0.10 | 0.25 | 0.06 | 0.35 | 0.08 |
| T-2 | - | - | 3.64 | 3.64 | - | - | - | - | - | - | - | - | - | - | - | - | - | |
| ZON | - | - | 1.81 | 0.72 | 1.66 | 0.66 | - | - | - | - | - | - | - | - | 0.11 | 0.04 | - | - |
Publisher’s Note: MDPI stays neutral with regard to jurisdictional claims in published maps and institutional affiliations. |
© 2021 by the authors. Licensee MDPI, Basel, Switzerland. This article is an open access article distributed under the terms and conditions of the Creative Commons Attribution (CC BY) license (https://creativecommons.org/licenses/by/4.0/).
Share and Cite
Carballo, D.; Fernández-Franzón, M.; Ferrer, E.; Pallarés, N.; Berrada, H. Dietary Exposure to Mycotoxins through Alcoholic and Non-Alcoholic Beverages in Valencia, Spain. Toxins 2021, 13, 438. https://doi.org/10.3390/toxins13070438
Carballo D, Fernández-Franzón M, Ferrer E, Pallarés N, Berrada H. Dietary Exposure to Mycotoxins through Alcoholic and Non-Alcoholic Beverages in Valencia, Spain. Toxins. 2021; 13(7):438. https://doi.org/10.3390/toxins13070438
Chicago/Turabian StyleCarballo, Dionisia, Mónica Fernández-Franzón, Emilia Ferrer, Noelia Pallarés, and Houda Berrada. 2021. "Dietary Exposure to Mycotoxins through Alcoholic and Non-Alcoholic Beverages in Valencia, Spain" Toxins 13, no. 7: 438. https://doi.org/10.3390/toxins13070438
APA StyleCarballo, D., Fernández-Franzón, M., Ferrer, E., Pallarés, N., & Berrada, H. (2021). Dietary Exposure to Mycotoxins through Alcoholic and Non-Alcoholic Beverages in Valencia, Spain. Toxins, 13(7), 438. https://doi.org/10.3390/toxins13070438