Article

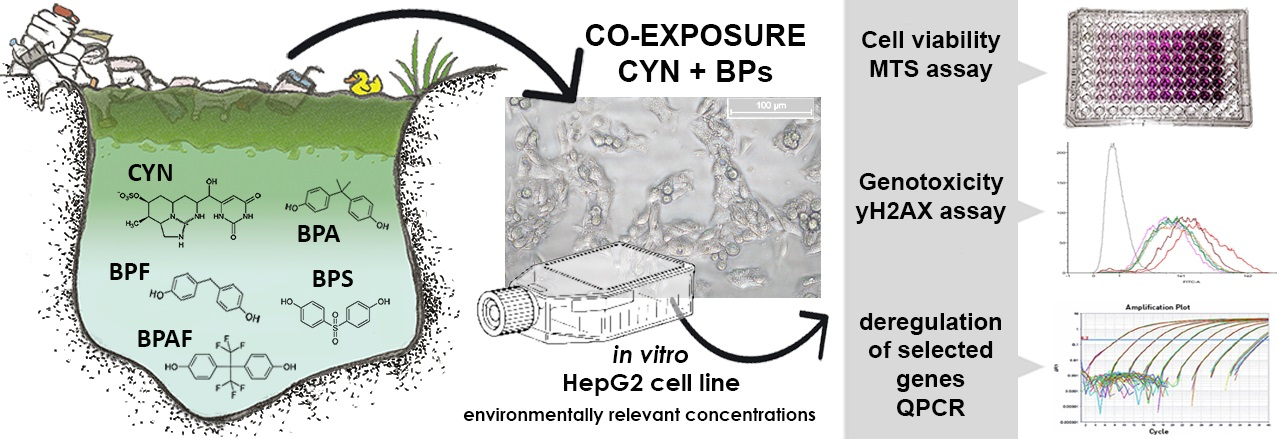
Plastics in Cyanobacterial Blooms—Genotoxic Effects of Binary Mixtures of Cylindrospermopsin and Bisphenols in HepG2 Cells

1
National Institute of Biology, Department of Genetic Toxicology and Cancer Biology, Večna pot 111, 1000 Ljubljana, Slovenia
2
Jozef Stefan International Postgraduate School, Jamova 39, 1000 Ljubljana, Slovenia
3
Area of Toxicology, Department of Molecular Biology and Biochemistry Engineering, University Pablo de Olavide, 41013 Sevilla, Spain
*
Author to whom correspondence should be addressed.
Toxins 2020, 12(4), 219; https://doi.org/10.3390/toxins12040219
Submission received: 27 February 2020 / Revised: 26 March 2020 / Accepted: 27 March 2020 / Published: 31 March 2020

Abstract

:
Ever-expanding environmental pollution is causing a rise in cyanobacterial blooms and the accumulation of plastics in water bodies. Consequently, exposure to mixtures of cyanotoxins and plastic-related contaminants such as bisphenols (BPs) is of increasing concern. The present study describes genotoxic effects induced by co-exposure to one of the emerging cyanotoxins—cylindrospermopsin (CYN)—(0.5 µg/mL) and BPs (bisphenol A (BPA), S (BPS), and F (BPF); (10 µg/mL)) in HepG2 cells after 24 and 72 h of exposure. The cytotoxicity was evaluated with an MTS assay and genotoxicity was assessed through the measurement of the induction of DNA double strand breaks (DSB) with the γH2AX assay. The deregulation of selected genes (xenobiotic metabolic enzyme genes, DNA damage, and oxidative response genes) was assessed using qPCR. The results showed a moderate reduction of cell viability and induction of DSBs after 72 h of exposure to the CYN/BPs mixtures and CYN alone. None of the BPs alone reduced cell viability or induced DSBs. No significant difference was observed between CYN and CYN/BPs exposed cells, except with CYN/BPA, where the antagonistic activity of BPA against CYN was indicated. The deregulation of some of the tested genes (CYP1A1, CDKN1A, GADD45A, and GCLC) was more pronounced after exposure to the CYN/BPs mixtures compared to single compounds, suggesting additive or synergistic action. The present study confirms the importance of co-exposure studies, as our results show pollutant mixtures to induce effects different from those confirmed for single compounds.
Key Contribution: Antagonistic activity of bisphenol A (BPA) against DNA double-strand break induction by cylindrospermopsin (CYN) was indicated in HepG2 cells following 72 h co-exposure. Additive or synergistic activity of CYN and BPs (BPA, BPS, BPF, and BPAF) on the expression of genes involved in the metabolism of xenobiotics (CYP1A1), DNA damage response (CDKN1A, GADD45A) and oxidative stress response (GCLC) in HepG2 cells was indicated following 24 h co-exposure.

Graphical Abstract

1. Introduction

Environmental pollution and accumulation of plastic in the environment are becoming an increasing concern, given the steady rise in plastic production and the release of diverse anthropogenic contaminants into the environment. Organic waste is causing eutrophication of water bodies, which, together with climate change, creates favorable conditions for extensive cyanobacterial proliferation. Cyanobacterial blooms in surface waters are, therefore, globally increasing in extension, frequency, and magnitude [1]. Cyanobacteria produce an impressive plethora of bioactive substances, including a variety of toxins. Among them is the cyanotoxin cylindrospermopsin (CYN), which is considered an emerging health threat worldwide. Compared to other cyanotoxins, humans are more likely to be exposed to CYN, as it is highly water-soluble, very stable and persistent in aquatic environments [2,3], and is predominantly extracellular, especially in older blooms [2,4]. It is produced by a wide variety of species from the genera Cylindrospermopsis, Raphidiopsis, Aphanizomenon, Chrysosporum, and Dolichospermum (Anabaena) [1,5]. The distribution of CYN producing cyanobacteria is expanding globally, also into temperate zones [1,6]. The toxin has been detected in surface fresh and brackish waters in America, Asia, Europe, Oceania, and even in Antarctica, at concentrations up to 200 μg/L (for a review see: [5]). It has even been detected in water used for drinking in the United States of America (USA), China, and Taiwan, at concentrations 0.41 to 36 μg/L [7,8,9]. Furthermore, bioaccumulation of CYN in various aquatic animals and plants has been reported (for a review see: [10]) and the predicted exposure of humans, consuming such organisms, could exceed the provisional tolerable daily intake (TDI) proposed for CYN (0.03 µg/kg body weight) [11].
CYN is an alkaloid with a cyclic guanidine moiety bound to a hydroxymethyluracil group [12]. Its structure alone suggests it could exert a wide range of adverse effects in mammalian cells. In fact, all the main functional groups (uracil, hydroxyl, and guanidine) are crucial for CYN toxicity [13]. CYN is a potent protein synthesis inhibitor [14,15,16] and has been shown to induce oxidative stress [17,18,19]. It has traditionally been classified as a hepatotoxin but has subsequently been shown to target various other organs (for a review see: [20]) and was even reported to have endocrine-disrupting potential [21,22]. The toxin is genotoxic and potentially carcinogenic and needs metabolic activation by cytochrome P450 enzymes to exert genotoxic effects (for a review see: [20,23]). CYN has been shown to induce DNA, and chromosome damage in vitro, suggesting CYN has clastogenic activity [17,24,25,26,27,28]. Its genotoxicity has also been demonstrated in vivo [29,30,31]. Moreover, there are indications that it can also act as a tumor-initiator [29]. However, CYN has not yet been classified for its carcinogenic potential by the International Agency for Research on Cancer (IARC) due to insufficient information on its carcinogenic activity, and the mechanisms potentially involved are still under investigation.
Concomitantly with the rising emergence of toxic cyanobacterial blooms, the accumulation of plastic in the environment is also increasing. It is estimated that 12,000 million metric tons of plastic waste will be released into the environment by 2050 [32]. Consequently, plastic constituents are becoming ubiquitously present in marine and terrestrial water environments [33], adding to the mixture of present pollutants. A study recently suggested that cyanobacterial blooms could act as a sink for such pollutants [34]. The authors detected three of the plastic-related pollutants bisphenol A (BPA), S (BPS), and F (BPF) in bloom samples in a heavily eutrophic lake in China, at relatively high concentrations of 3954 ng/g dry weight (d.w.), 547 ng/g d.w., and 324 ng/g d.w., respectively.
Among the plastic-related contaminants, BPA is the most common, as it is the most widely-used material in the production of polycarbonate plastics, epoxy resins, and phenolic resins [35]. BPA is an organic synthetic compound belonging to the group of diphenylmethane derivatives, with two hydroxyphenyl groups. The global consumption of this compound in 2016 was estimated to be around 8 million tons, and the global BPA demand is projected to increase to 10.6 million tons by 2022 [36]. However, due to its known endocrine-disrupting activity and its other potential hazardous effects, the use of BPA is being restricted [36], resulting in the gradual replacement of BPA by presumably safer alternatives, its chemical analogues (BPS, BPF, and BPAF). BPS is the most commonly used replacement in various consumer BPA-free products, but BPF and BPAF are used as well in a broad range of industrial applications [37].
Due to their massive production, BPs can at present be detected in the environment at alarming concentrations [33,38,39]. They leach off during production, treatment, processing, and hydrolysis of the polymers into the ground water, wastewater, air, and food [40]. BPA tends to elute easily from plastic waste and move rapidly into the aqueous environment, due to its relatively low hydrophobicity (for a review see: [41]). Human exposure is thus unavoidable. The average BPA concentration detected in surface waters is approximately 100 ng/L, but was recorded to be as high as 44,000 ng/L [38]. There are fewer data about the concentrations of BPA analogues, but they are in the range between 1 and 100 ng/L; however, up to 100-fold higher concentrations were detected in the down flow from industrial effluents [33]. Nevertheless, the dietary ingestion of free BPA accounts for its major route of exposure. The daily uptake rate of BPA for humans is estimated to be 50 ng/kg bw/day [42]. It was found to prevail in diverse human tissues and body fluids [43]. Similar data for BPA analogues are scarce. It has to be emphasized that BPA analogue consumption is rising because they are considered safer than BPA. However, the latter assumption is based on insufficient toxicological data to support the risk assessment. Considering the structural similarities and physicochemical properties, BPA analogues are expected to exhibit similar or even stronger endocrine-disrupting and toxic potential as BPA, which is also gradually being confirmed (for a review see: [37]).
Apart from the well-known endocrine disruption effects of BPA, evidence for its potential genotoxicity is accumulating (for a review see: [37,40]). BPA and its metabolites have been reported to induce DNA strand breaks in vitro [44,45,46] and in vivo [47], chromosomal aberrations in vitro [45,48] and in vivo [45,47,48], and to form DNA adducts in vitro [45,49,50] and in vivo [51]. Similar data for BPA analogues are again scarce. BPF and BPAF were found to induce DNA double-strand breaks in vitro, while BPS was inactive at concentrations up to 20 μg/mL in hepatic cells [46].
Data on the adverse effects of single compound exposure for CYN and BPA are accumulating. However, combined exposure to these pollutants has not been studied thus far. Recently, a review highlighted the importance of BPA co-exposure studies with other chemicals and environmental stressors for the assessment of outcomes that common co-exposures can exert on human health [52]. Considering their simultaneous presence in the environment, exposure to mixtures of different pollutants is the only realistic exposure scenario. Humans can thus be exposed to cyanotoxin/BPs mixtures following recreational activities and/or through the consumption of contaminated water and food. Co-exposure to various pollutants can induce effects that differ from those observed for single compounds due to unknown interactions that can occur between the compounds. The aim of this study was, therefore, to evaluate the cytotoxic and genotoxic potential of mixtures of CYN, BPA, and its commonly used analogues BPS, BPF, and BPAF (Table 1). The co-exposure was studied in the metabolically competent human hepatocellular carcinoma cell line HepG2. This cell line is considered one of the in vitro models of choice when studying the genotoxic effects of progenotoxic agents and is also recommended by Organization for Economic Co-operation and Development (OECD) standards (e.g., 487) [53], as it retained several phase I and II metabolic enzymes, involved in the metabolism of xenobiotics [54]. The genotoxic effects of the mixtures were determined by the detection of H2AX histone phosphorylation, which reflects an early reaction to a genotoxic insult resulting in the formation of DNA double-strand breaks (DNA DSBs). The cellular response to the exposure to these mixtures was further studied by analysis of the transcriptional response—deregulation of selected genes (genes involved in the metabolism of xenobiotics, immediate-early response, and DNA damage response), using qPCR.

2. Results and Discussion

2.1. The Influence of CYN, BPs, and Their Combinations on Cell Viability

The influence of single compounds and CYN/BPs combinations on HepG2 cell viability was evaluated with the tetrazolium-based MTS assay. The concentrations of CYN (0.5 µg/mL) and BPs (10 µg/mL) were chosen based on previous findings on the genotoxic effects of CYN [25,27,28] and BPs [46] in HepG2 cells, also considering reported environmental concentrations and the significant daily uptake rate through dietary ingestion in the case of BPA. Although these concentrations are still higher than those reported in the environment and are not expected to be directly relevant for human exposure, they serve the aim of this study, which was to identify the possible DNA damaging effects (induction of DNA DSBs) and potential mechanisms of action of non-cytotoxic concentrations of CYN/BPs binary mixtures. It is thought that chemicals, directly inducing DNA damage, have no safe exposure threshold dose, only that the probability of potentially harmful mutations, resulting from the induced DNA damage (e.g., DNA DSBs), decreases with lower concentrations [55].
After 24 h of exposure, neither single compounds nor the combinations induced any measurable effect on HepG2 cell viability (Figure 1A). At the same time, the positive control (etoposide—ET) reduced cell viability for roughly 16% on average. After longer exposure (72 h), CYN (0.5 µg/mL) and all of its combinations with BPs (10 μg/mL) significantly reduced cell viability by 23% to 38%; however, there was no significant difference between CYN treated cells and cells treated with any of the CYN/BPs combinations (Figure 1B). None of the BPs (10 μg/mL) alone induced a measurable reduction in cell viability. BPS and BPAF even had a slight proliferating or more likely cell metabolic activity enhancing effect, which can commonly be observed after exposure to various toxic agents in cell lines as the consequence of increased mitochondrial activity in cell-cycle arrested cells [56]. Our results are in line with previous findings, showing a reduction in cell viability only after exposure to higher concentrations (15 µg/mL) of BPs (BPA, BPS, BPF, and BPAF) in HepG2 cells [46]. Low cytotoxicity was, for these BPs, also reported in other in vitro model systems (human breast adenocarcinoma cells (MCF-7), human 189 cervical epithelial cancer cells (HeLa), mouse fibroblasts (3T3-L1), and rat glioma cells (C6)), with the calculated half-maximal inhibitory concentrations (IC50) generally being in the range of 20–75 µg/mL [57]. The exception was BPAF, which was slightly more toxic (IC50: 4–20 µg/mL) in some of the cell models. Thus, we can conclude that the decrease in cell viability observed in cells exposed to the CYN/BPs combinations was the consequence of CYN activity. CYN was previously shown to decrease cell viability and cell proliferation in HepG2 cells after prolonged exposure (96 h) at concentrations of up to 0.5 µg/mL, which was found to be due to the induction of cell cycle arrest rather cell death [28]. Therefore, the observed effects of CYN and the CYN/BPs combinations in this study were probably predominantly the consequence of cell cycle arrest induced by CYN. Compared to the control, CYN at 0.5 µg/mL and CYN/BPs combinations did not reduce cell viability for more than 40%, which is considered the limit value for genotoxicity assessment; thus, these concentrations were used for further studies of their genotoxic effects.

2.2. Induction of DNA Double-Strand Breaks by CYN, BPs, and Their Combinations

DNA DSB induction in HepG2 cells after exposure to CYN, BPs, and the CYN/BPs combinations was measured indirectly through the measurement of γ-H2AX formation, using flow cytometry. γ-H2AX is the phosphorylated form of the histone H2AX, which becomes phosphorylated on serine residue 139 in response to DNA DSB induction and forms nuclear foci adjacent to the sites of the DSBs [58]. Because the phosphorylation of H2AX is rapid, abundant, and correlates well with the number of DSBs [59], it is a very sensitive marker for DNA DSB induction (for a review see: [60]).
No increase in γH2X formation was detected after 24 h exposure to CYN, BPs, or CYN/BPs combinations (data not shown). After 72 h of exposure, a significant increase in DSB formation was observed in cells exposed to CYN and its combinations with BPS, BPF, and BPAF (Figure 2). CYN-induced DNA DSB formation in HepG2 cells has also been reported in a previous study [28]. No induction of γH2X was detected in cells exposed to the tested BPs alone except for BPAF, which slightly increased DSB formation. Additionally, in our previous study [46], no induction of DSBs in HepG2 cells at comparable exposure conditions by BPs was observed. BPF and BPAF were found to increase the formation of γH2X at higher concentrations (≥10 μg/mL) or at an earlier time point (24 h). Similarly, Audebert et al. [61] reported that BPA does not induce γ-H2AX in HepG2 cells, human renal cell adenocarcinoma cells (ACHN), and human epithelial colorectal adenocarcinoma cells (LS174T), while BPF (10–50 μM) induced DNA DSBs in HepG2 cells, but not in ACHN and LS174T cells. Comparing the effects of CYN alone and its combination with BPS, BPF, or BPAF, on DSB formation, no significant difference could be detected, indicating that the formed DSBs were the consequence of CYN activity. Interestingly, CYN in combination with BPA induced slightly but statistically significantly less DNA DSB compared to the induction by CYN alone, indicating an antagonistic effect of BPA.
CYN is considered to be a pro-genotoxin [17,18,24,25,62], predominantly activated by CYP450 enzymes [62,63]. BPA is also known to be metabolized by phase I and II xenobiotic-metabolizing enzymes [64,65]. Furthermore, BPA was reported to suppress or inhibit certain human hepatic cytochrome P450s activities [66,67,68]. Thus, the observed antagonistic effects of BPA in the CYN/BPA combination may be due to BPA-mediated suppression of the metabolic activation of CYN.

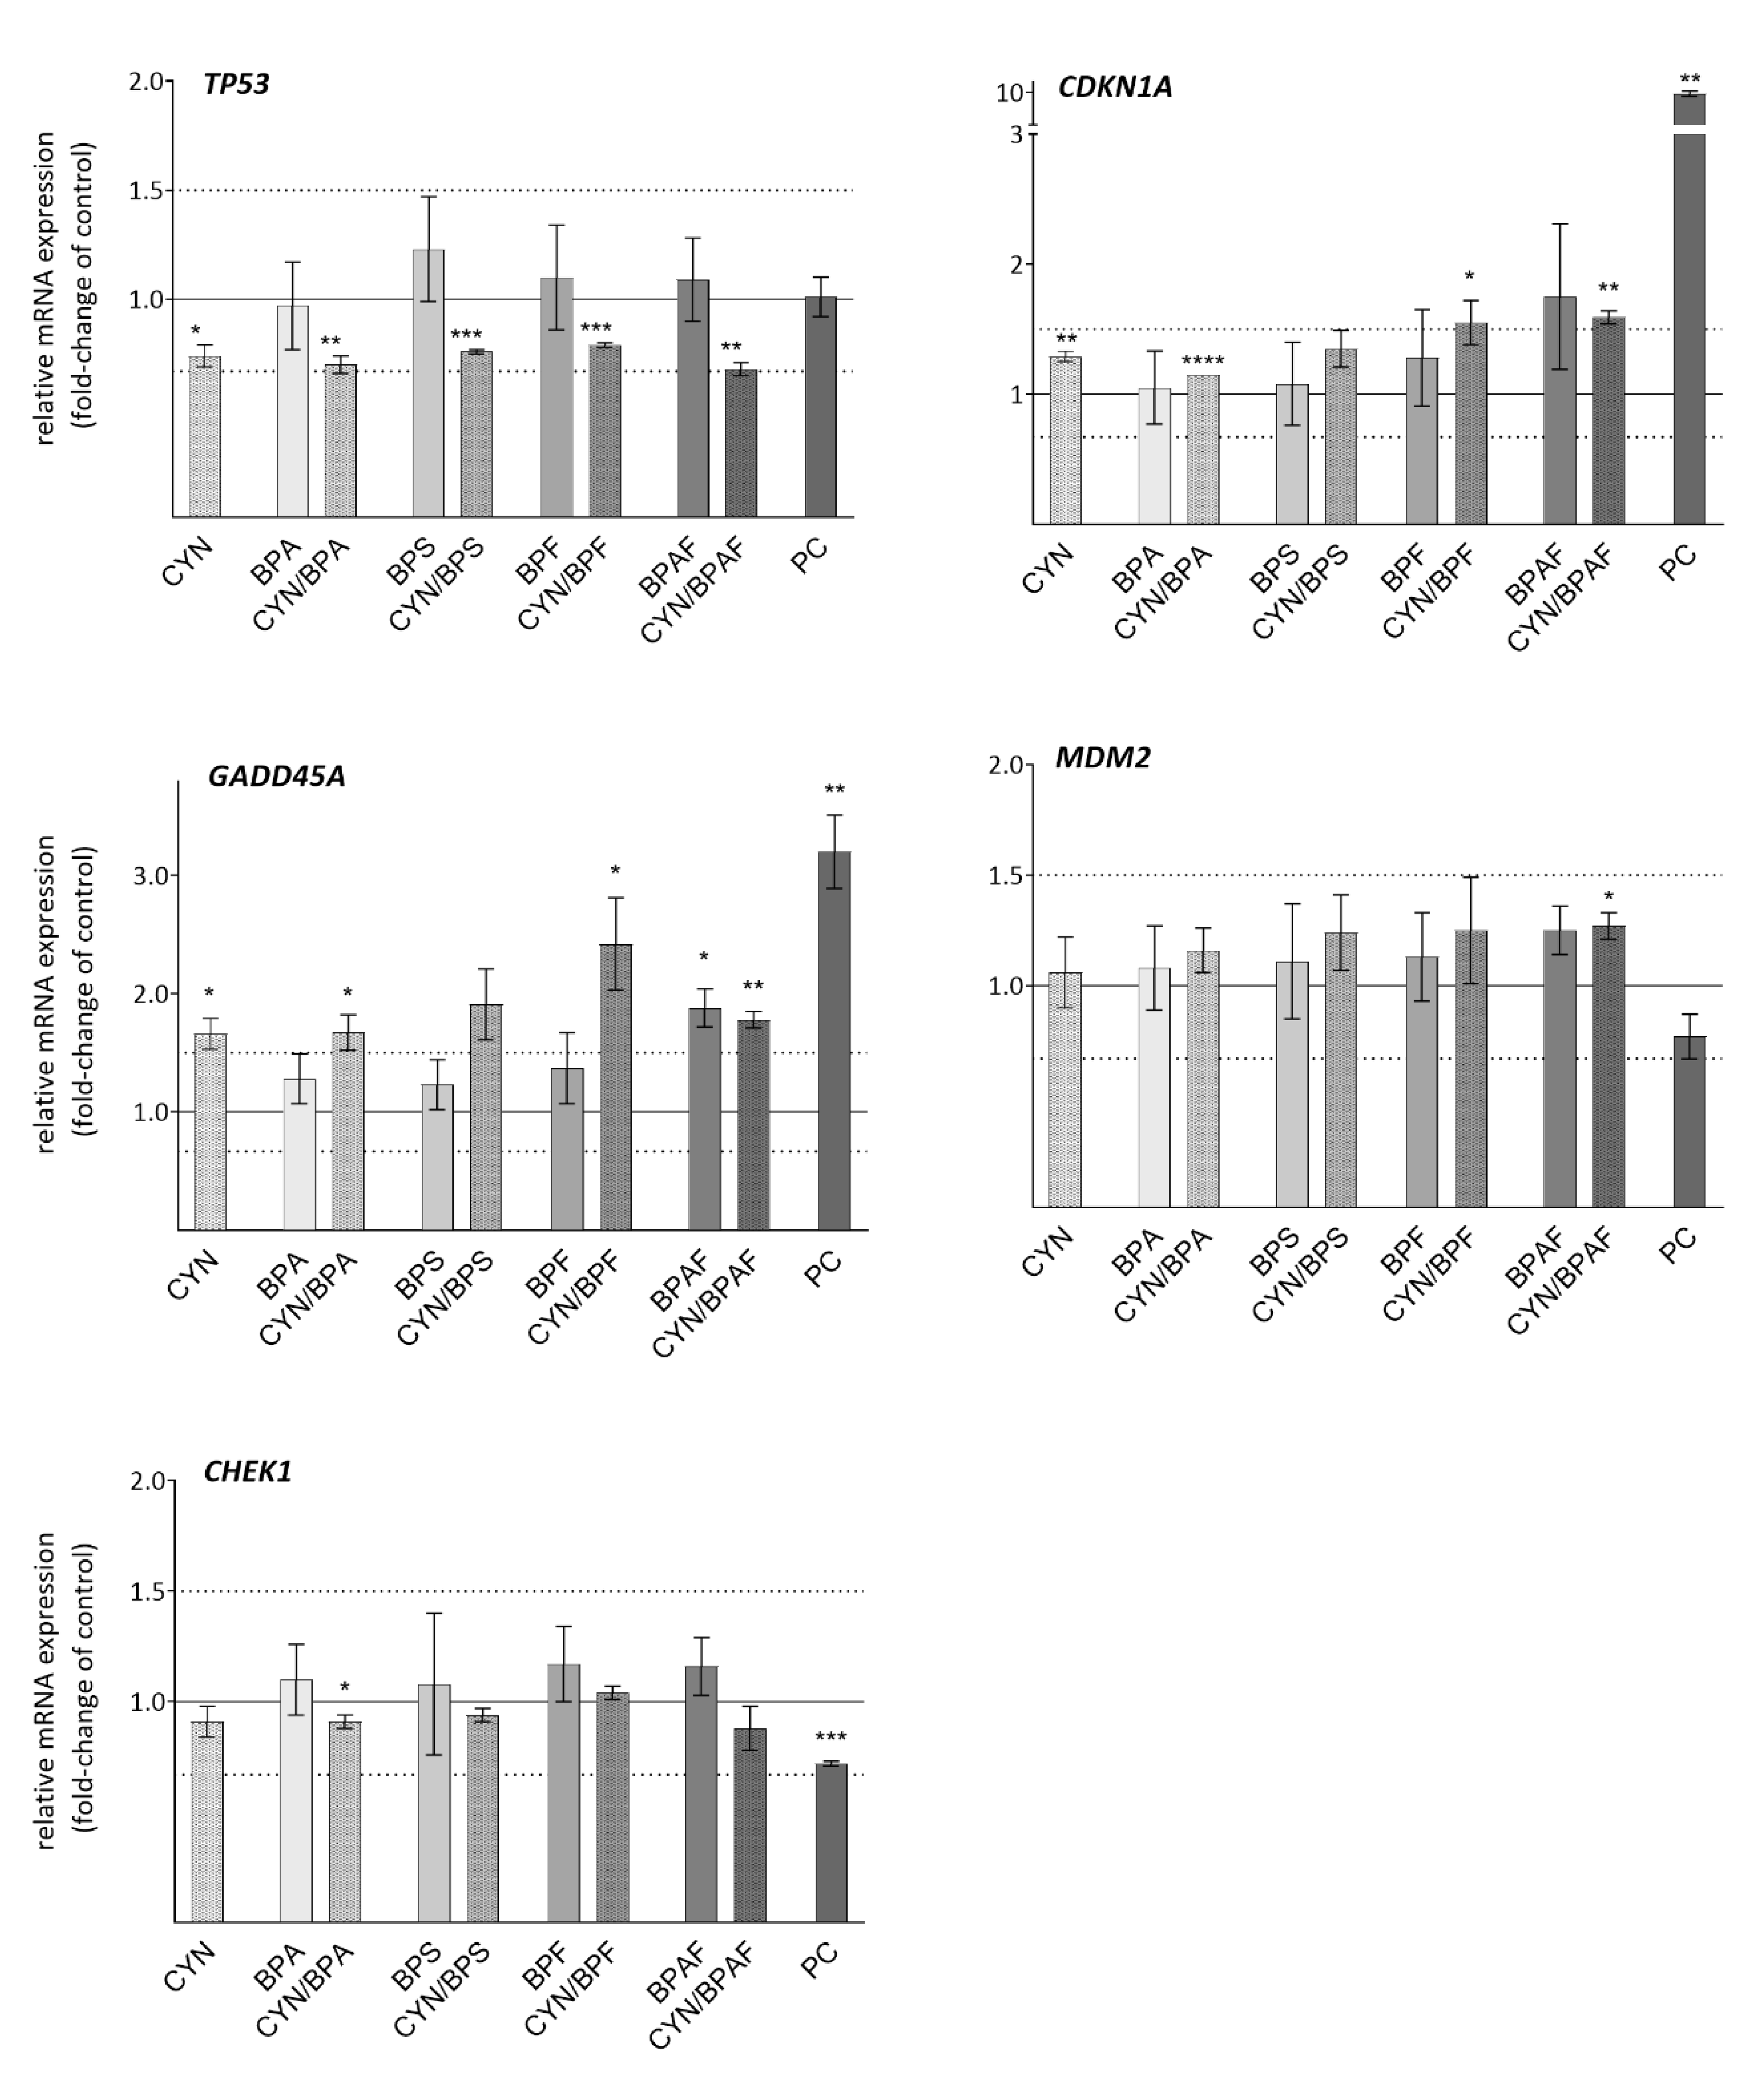
2.3. Gene Deregulation in Response to CYN/BPs Exposure

To get an insight into the response of HepG2 cells to the exposure to CYN in combination with BPs at the molecular level, expression of the metabolic enzyme gene CYP1A1 (involved in the metabolism of CYN and BPs), and the expression of selected genes involved in DNA damage (TP53, MDM2, CDKN1A, GADD45A) and oxidative stress response (GCLC, GPX1, GSR, SOD1A, and CAT) was analyzed after 24 h of exposure by quantitative real-time PCR.

2.4. Xenobiotic Metabolism—CYP1A1

All of the tested compounds either alone or in combination up-regulated CYP1A1 expression (Figure 3). The CYP1A1 gene encodes a member of the family of cytochrome P450 enzymes that are involved in phase I of xenobiotic and drug metabolism. CYN alone up-regulated CYP1A1 expression by 2.7-fold on average, while the BPs induced an even higher up-regulation. The highest up-regulation was observed in BPAF exposed cells (11.6-fold up-regulation). The exposure to the CYN/BPs combinations exerted stronger response than single compounds and induced CYP1A1 up-regulation in an additive manner. In the CYN/BPA treated cells, even synergistic action was indicated as CYP1A1 up-regulation induced by CYN/BPA (12.4-fold) was higher than the sum up-regulation induced by the single compounds (CYN 2.7-fold and BPA 5.3-fold).
Although the main enzymes involved in BPA detoxification are uridine 5′-diphospho-glucuronosyltransferases (UGT) and sulfotransferases (SULT) (for a review see: [66]), they also undergo CYP450-mediated oxidative transformations, as does CYN. The involvement of CYP450 enzymes in the toxic and genotoxic activation of CYN has been demonstrated using different broad-spectrum CYP450 inhibitors, which showed protective effects against toxicity [14,63,69] and genotoxicity [24,62] of CYN. Besides, CYN genotoxic effects were observed only in metabolically competent test systems (for a review see: [20,23]). Furthermore, BPA and BPF have been reported to be oxidized to reactive intermediates as well [70,71], which have been reported to form DNA adducts [51,72,73]. In line with our results, CYN was previously shown to up-regulate CYP1A1, and other CYP isoforms (CYP1B1 and CYP1A2) in HepG2 cells [18,25,26,27] and human peripheral blood lymphocytes (HPBLs) [26]. Recently, the up-regulation of the expression of CYP1A1 was reported following the exposure to BPs (BPA, BPS, BPF, and BPAF) in HepG2 cells [46] and the up-regulation of CYP1A1 on the protein level following exposure to BPA in human placental JEG-3 choriocarcinoma cells was reported [74].
As our results show a more pronounced up-regulation of CYP1A1 by all tested CYN/BPs combinations compared to the up-regulation of this gene by single compounds, this indicates an even stronger induction of the xenobiotic metabolism. [75,76,77] Meaning that also in addition, CYN and the BPs could potentially increase each other’s genotoxic potency through the increased induction of CYP enzymes. However, as the results from the γH2AX assay demonstrate otherwise, showing no further increase in DNA DSB formation in the CYN/BPs exposed; on the contrary, it even reduced in the case of CYN/BPA. Thus, BPs may impair CYN activation through the inhibition of CYP activity.

2.5. DNA Damage Response Genes

Deregulations of crucial DNA damage response genes (TP53, MDM2, GADD45A, CDKN1A), which were analyzed in the present study (Figure 4) are considered as molecular markers of genotoxic and carcinogenic stress [78,79,80,81,82]. The protein P53 plays a central role in the major DNA damage response pathways: the regulation of DNA damage repair, cell cycle progression, senescence, differentiation, and apoptosis [83]. In response to DNA damage, P53 protein is predominantly activated through its phosphorylation by DNA damage responsive kinases and, to a lesser extent, through the up-regulation of gene expression [84]. The expression of the tumor-suppressor gene, TP53, was not significantly altered by BPs exposure, whereas it was slightly (<1.5-fold) down-regulated by CYN and the CYN/BPs combinations. Previous studies on the expression of the TP53 gene reported that CYN [18,25,27] and BPs [46] did not influence TP53 expression in HepG2 cells. Our results indicate that the combined exposure to CYN/BPs does not affect the expression of this gene differently than exposure to CYN as a single compound.
The main P53 down-stream regulated genes are CDKN1A and GADD45A. The gene CDKN1A encodes the cyclin-dependent kinase inhibitor P21WAF1/CIP1, an essential regulator of cell cycle progression, and mediator of the P53-dependant G1 and G2 phase arrests (for a review see: [85]). CDKN1A was more than 1.5-fold up-regulated only after exposure to BPAF (1.75-fold) alone and the CYN/BPAF (1.59-fold) and CYN/BPF (1.55-fold) combinations. The up-regulation of CDKN1A by CYN alone in the present study was only 1.3-fold, which is lower than found previously [18,25].
The protein encoded by GADD45A (Growth arrest and DNA damage-inducible protein alpha) is implicated in the control of cell cycle G2-M transition, induction of cell death/survival, DNA repair process, chromatin assembly, and genome stability [86]. In contrast to CDKN1A, the expression of the gene GADD45A was up-regulated more than 1.5-fold in all CYN exposed groups (CYN alone 1.66-fold; CYN/BPs combinations 1.78–2.42-fold). The BPs alone did not influence GADD45A expression, with the exception of BPAF, which up-regulated its expression by approximately 1.9-fold. Among the tested BPA analogues, BPAF was previously found to be the only one that induced up-regulation of the expression of CDKN1A1 and GADD45A and was also the most potent inducer of DNA DSBs in HepG2 cells [46]. Nevertheless, no additive or synergistic effect of BPAF in combination with CYN on the CDKN1A1 or GADD45A expression was indicated. The highest up-regulation of GADD45A was observed in cells exposed to the CYN/BPF mixture (2.42-fold), much higher than BPF (1.37-fold) or CYN alone, which suggests synergistic action of the compounds in the mixture.
The MDM2 and CHEK1 genes were the most un-responsive to the exposure to the tested compounds. The expression of the gene encoding the MDM2 protein, a negative regulator of P53 [87], was stable in all the tested cell populations, regardless of the exposure to CYN, BPs, or their binary mixtures. The same was observed with the CHEK1 gene, the protein product of which is a checkpoint kinase that is activated in response to DNA damage and can thereafter modulate the activity of a number of proteins, including P53, providing a link between DNA damage and P53 checkpoint activity [88]. The results observed in single compound exposure groups are in agreement with previous reports, showing no deregulation of these genes by CYN or BPs in HepG2 cells [25,27,46], and the tested binary mixtures did not induce any different deregulation patterns from single compounds.

2.6. Oxidative Stress Response Genes

The influence of single compounds and CYN/BPs binary mixtures on oxidative stress induction in HepG2 cells was evaluated by analyzing the deregulation of selected oxidative stress response genes. One of the possible mechanisms of CYN genotoxicity is postulated to be the formation of reactive oxygen species (ROS) that can induce DNA damage. However, the published data are not consistent. While there are studies reporting increased ROS formation by CYN in various test systems, oxidative damage was observed rarely (for a review see: [20,23]).
There is growing evidence for ROS induction by BPA that may contribute to its toxicity and carcinogenic potential (for a review see: [89]). Huc et al. [90] reported mitochondria-dependent ROS generation, cytosolic oxidative stress, and lipid peroxidation in HepG2 cells following exposure to low doses (10−6–100 µM) of BPA. Moreover, BPA and its analogues (BPS, BPF, and BPAF) have been reported to induce oxidative stress and oxidative damage in human peripheral mononuclear cells and human red blood cells [91,92].
The reported increase in ROS formation following exposure to CYN and BPs could be, at least in part, the consequence of their metabolic activation. It is known that reactions catalyzed by CYP450 enzymes, which are involved in CYN and BPs metabolism, are a significant source of ROS formation (for a review see: [93]). Given that our results show increased up-regulation of CYP1A1 by CYN/BPs binary mixtures, a higher increase in ROS formation and enhanced oxidative stress response could be expected in cells exposed to the mixtures compared to single compound exposure. The cellular response to an increase in intracellular ROS formation is the induction of enzymatic and non-enzymatic defensive mechanisms. The enzymes superoxide dismutase (SOD), catalase (CAT), and glutathione peroxidase (GPx) play critical roles in maintaining intracellular redox homeostasis by scavenging and catalytic removal of the generated ROS [94]. The most abundant intracellular antioxidant, central to the non-enzymatic oxidative stress defense, is glutathione (GSH). During oxidative stress, reduced GSH is oxidized to glutathione disulfide (GSSG); therefore, the ratio of GSH to GSSG reflects cellular oxidative stress [95]. Two of the major enzymes involved in the regulation of the intracellular GSH content are glutathione reductase (GSR), which catalyzes the reduction of GSSG to GSH and γ-glutamylcysteine synthetase (GCL), which is recognized as the rate-limiting enzyme in GSH de-novo biosynthesis [96]. Thus, the deregulation of the major antioxidant enzymes and enzymes involved in the GSH detoxification and antioxidant pathways can be considered as a marker for oxidative stress.
In the present study, among the tested oxidative response genes (Figure 5), the GCLC gene, which encodes the catalytic subunit of GCL, was the most affected by the exposure to CYN and all CYN/BPs mixtures. The gene was significantly up-regulated by CYN (1.66-fold) alone but not by the single BPs (<1.39-fold). The co-exposure to CYN/BPA (1.96-fold), CYN/BPS (1.72-fold), CYN/BPF (1.94-fold), and CYN/BPAF (1.73-fold) up-regulated GCLC gene expression to a higher extend then exposure to CYN alone, suggesting additive effects of the compounds in the binary mixtures. GCLC gene up-regulation indicates a possible cell response to GSH depletion, increasing its biosynthesis. Decreased GSH content in the cells can result from either increased oxidation, increased efflux, the formation of GSH-conjugates, or decreased synthesis (for a review see: [97]). CYN [62,69] and BPA (for a review see: [89]) have both been shown to reduce intracellular GSH. However, in the case of CYN, the GSH depletion might be the consequence of GSH synthesis inhibition, as has been shown in primary rat and mouse hepatocytes [62,69]. Thus, our results indicate that exposure to the CYN/BPs binary mixtures might reduce intracellular GSH levels in an additive manner.
The other studied oxidative stress-responsive genes were generally not significantly deregulated by the tested compounds and/or the deregulation was less than 1.5-fold (Figure 5). SOD1 was slightly down-regulated by CYN, while BPs and the combinations did not influence the expression of this gene. There was an indication of slight down-regulation of CAT and slight up-regulation of GPX1 by CYN and all CYN/BPs combinations. Our results suggest that single or combined exposure to CYN and BPs after 24 h in HepG2, at the tested conditions, did not cause major oxidative stress. Except in the case of the gene GCLC, there was no indication for additive, synergistic, or antagonistic interactions of the compounds in the binary mixtures that would affect oxidative response gene expression. In line with previous findings [46] in the HepG2 cell line, BPA and its analogues (BPS, BPF, and BPAF) as single compounds had no significant influence on the expression of the selected oxidative stress response genes. On the other hand, the activities of the enzymes SOD, CAT, and GPX were reported to be increased in human erythrocytes following exposure to BPA, BPF, and BPAF, but not BPS [92]. However, changes were observed at 10-fold higher concentrations than used in the present study. Therefore, the slight deregulations of CAT and GPX1 in the cells exposed to the CYN/BPs combinations seem to be the consequence of CYN activity and reflect previously confirmed findings, showing CYN to induce only minor oxidative stress in HepG2 cells at the tested time point and concentration range used [18,19]. In addition, CYN induced a significant increase in the expression of genes GCLC, GSR, GPX1, and SOD1 after 24 h of exposure in HPBLs. In contrast, the expression of CAT was not changed [26], indicating that lymphocytes might be more sensitive to CYN in terms of oxidative stress than hepatocytes.

3. Conclusions

In the present study, the cyto/genotoxic effects after co-exposure to emerging aquatic contaminants, the cyanobacterial toxin CYN in combination with BPA, and its analogues BPS, BPF, and BPAF were studied in the metabolically competent HepG2 cell line, for the first time. Exposure to CYN and the CYN/BPs binary mixtures significantly reduced the viability of HepG2 cells and increased the formation of DNA DSBs. The BPs alone did not decrease HepG2 cell viability and had no effect on DNA DSB induction. Generally, no significant differences were observed between cells treated with CYN alone and the CYN/BPs combinations, suggesting that the observed effects were the consequence of CYN activity. The only exception was the CYN/BPA combination, where significantly lower DNA DSBs were induced compared to the induction by CYN alone, suggesting antagonistic action of BPA against CYN in the mixture. The gene expression analysis, on the other hand, indicated additive or synergistic interactive effects in the CYN/BPs mixtures in several of the tested genes. The most pronounced effects were detected for the gene CYP1A1, where additive effects of CYN and BPs in all of the tested binary mixtures on gene up-regulation were indicated. In the case of the CYN/BPA mixture, the observed combined effect on CYP1A1 up-regulation might have even been synergistic. The up-regulation of CYP1A1 is of particular concern as the enzyme product of this gene catalyzes metabolic activation of pro-carcinogens to carcinogens that may result in increased susceptibility for genotoxic injury by indirect-acting genotoxic compounds to which humans can be exposed. The other genes, found differentially deregulated upon exposure to CYN/BPs mixtures compared to single compounds were CDKN1A and GADD45A, involved in DNA damage response, and GCLC, involved in oxidative stress response. The deregulation of these genes was more pronounced after exposure to the CYN/BPs binary mixtures compared to single compound exposure, suggesting an additive action of CYN and BPs. Our results confirm that co-exposure to pollutant mixtures can exert effects different from those caused by single compounds, even at relatively low concentrations, relevant for human exposure. Additionally, the results highlight the importance of co-exposure studies.

4. Materials and Methods

4.1. Chemicals

Cylindrospermopsin (CYN) was from Enzo Life Sciences GmbH (Lausen, Switzerland) (Table 1). A 0.5 mg/mL stock solution of CYN was prepared in 50% methanol and stored at −20 °C. Bisphenol A (BPA), bisphenol S (BPS), bisphenol F (BPF), and bisphenol AF (BPAF) were from Sigma-Aldrich (St. Louis, MO, USA) (Table 1). Stock solutions of all the BPs (25 mg/mL) were prepared in dimethylsulphoxide (DMSO): BPA (109.5 mM), BPS (99.89 mM), BPF (124.86 mM), and BPAF (74.35 mM), and stored at −20 °C. Minimal Essential Medium Eagle (MEM), non-essential amino acids (NEAA), Benzo(a)pyrene (BaP), methanol, DMSO, NaHCO3, phenazine methosulfate (PMS), and sodium pyruvate were from Sigma, USA. Penicillin/streptomycin, fetal bovine serum, L-glutamine, and phosphate-buffered saline (PBS) were from PAA Laboratories, USA. Etoposide (ET) was from Santa Cruz Biotechnology, USA. The CellTiter 96® AQueous cell proliferation assay (3-(4,5-dimethylthiazol-2-yl)-2,5-diphenyltetrazolium bromide; MTS) was from Promega, Madison, WI, USA. Human recombinant Anti-H2AX pS139, FITC conjugate antibodies were from Miltenyi Biotec GmbH, Bergisch Gladbach, Germany. Trypsin was from Invitrogen™, Life Technologies, Waltham, MA, USA. The TRIzol® reagent was from Thermo Fisher Scientific, Waltham, MA, USA. The cDNA High Capacity Archive Kit, TaqMan Universal PCR Master Mix, and Taq Man Gene Expression Assays (Table 1) were from Applied Biosystems, Waltham, MA, USA. All chemical reagents were of the purest grade available, and all solutions were made using Milli-Q water. The chemical structures shown in Table 1 were prepared with the ChemDraw Prime software from PerkinElmer Informatics, Waltham, MA, USA.

4.2. Cell Culture

The HepG2 cell line was obtained from the American Type Culture Collection (ATCC), USA, at passage 108. The cells were grown in MEM medium supplemented with 10% FBS, 2 mM L-glutamine, 1% NEAA, 2.2 g/L NaHCO3, 1 mM sodium pyruvate, and 100 IU/mL penicillin/streptomycin, at 37 °C and 5% CO2. Cell passages between 120 and 130 were used in the experiments. The cells were seeded on culture plates and left overnight to attach. Subsequently, the growth medium was replaced with fresh medium containing appropriate concentrations of single compounds CYN (0.5 µg/mL) and BPA, BPF, BPS, and BPAF (10 μg/mL) and binary mixtures of CNY and the different BPs, and incubated for 24 and 72 h. A negative control (growth medium containing 0.05% methanol and 0.04% DMSO) and assay-specific positive controls were included in all experiments. The final concentration of the solvent in the medium was adjusted in all experimental points.

4.3. Cell Viability—MTS Assay

Cell viability was studied after 24 and 72 h exposure of HepG2 cells to CYN, the BPs, and combinations thereof. ET (30 μg/mL) was used as a positive control. Cell viability was evaluated using the MTS tetrazolium reduction assay, as previously described by Hercog et al. [46]. Three independent experiments were performed, with five replicates per treatment point.

4.4. Analyses of the Induction of DNA DSB by the γ-H2AX Assay

Double-strand break (DSB) induction was evaluated through measuring γH2X formation, using flow cytometry (MACSQuant Analyzer 10; Miltenyi Biotech, Germany). The experiments were performed as described by Hercog et al. [46]. The cells were seeded on six-well plates (Corning Inc., USA), exposed to the tested compounds and their mixtures, and then collected and fixed using ethanol (70%). Fixed cells were washed and labeled with Anti-H2AX pS139 antibodies (130-118-339) according to the manufacturer’s protocol. Etoposide (ET, 1 μg/mL) was used as a positive control. FITC intensity was recorded for 104 single cells in each sample. Independent experiments were repeated three times. GraphPad Prism 8 was used to generate box and whiskers plots. Statistical significance between treated groups and the vehicle control was determined with a linear mixed-effects model with the statistical program R [98] and its packages reshape [99], and nlme [100].

4.5. Real-Time Quantitative PCR (qPCR) Analysis

The mRNA expression of selected genes was analyzed by quantitative real-time PCR (qPCR). HepG2 cells were seeded on T25 plates (600,000 cells/plate) exposed to CYN, BPs alone, and to combinations thereof for 24 h. Total RNA was isolated using the TRIzol reagent according to the manufacturer’s protocol with minor modifications described by Maisanaba et al. [101]. The RNA was transcribed to cDNA using 1 μg of total RNA and cDNA High Capacity Archive Kit, according to the manufacturer’s protocol. Relative quantification of the selected genes was performed using qPCR, where the TaqMan Universal PCR Master Mix and Taqman Gene Expression Assays were used (Table 2).
GAPDH (VIC-TAMRA, Cat. No.:4310884E, Applied Biosystems, USA) was used as a reference gene in all experiments. All experiments were performed on 384-well plates, with a single probe per well using the ViiA™ 7 Real-Time PCR System (Applied Biosystems™). The conditions for the PCR were 50 °C for 2 min, 95 °C for 10 min, and 40 cycles of 95 °C for 15 s and 60 °C for 1 min. The relative quantification of gene expression was done by comparison of the Ct values of treated and control groups considering the actual efficiency of each assay using the Quant Genious protocol [102]. BaP (30 μM) was used as a positive control. Three independent experiments were performed each time in duplicates. Statistical difference between treated groups and controls was determined by two-tailed Student’s t-test. A ≥ 1.5-fold change in gene expression compared to control was considered as up-regulation and down-regulation, respectively.

Author Contributions

Conceptualization: B.Ž. and K.H.; Methodology: K.H., S.M., and B.Ž.; Software: K.H. and A.Š.; Validation: K.H., S.M., and A.Š.; Formal analysis: K.H., A.Š., and S.M.; Investigation: K.H., S.M., and B.Ž.; Resources: M.F.; Data curation: K.H. and S.M.; Writing—original draft: Alja Štern; Writing—review and editing: B.Ž., M.F., K.H., and S.M.; Visualization: K.H. and S.M.; Supervision: B.Ž. and M.F.; Project administration: B.Ž. and M.F.; Funding acquisition: M.F. All authors have read and agreed to the published version of the manuscript.

Funding

This research was funded by the Slovenian Research Agency [research core funding P1-0245, and PhD grant to Klara Hercog MR36321], and the PhD grant from the University of Seville to the Sara Maisanaba (VI PPIT, I.3A1, 2017) and the COST Actions ES1105 (Cyanobacterial blooms and toxins in water resources: Occurrence, impacts and management).

Acknowledgments

The authors thank Marija Sollner-Dolenc and the Faculty of Pharmacy for providing BPA and its analogues.

Conflicts of Interest

The authors declare no conflict of interest.

References

  1. Huisman, J.; Codd, G.A.; Paerl, H.W.; Ibelings, B.W.; Verspagen, J.M.H.; Visser, P.M. Cyanobacterial blooms. Nat. Rev. Microbiol. 2018, 16, 471–483. [Google Scholar] [CrossRef] [PubMed]
  2. Chiswell, R.K.; Shaw, G.R.; Eaglesham, G.; Smith, M.J.; Norris, R.L.; Seawright, A.A.; Moore, M.R. Stability of cylindrospermopsin, the toxin from the cyanobacterium, cylindrospermopsis raciborskii: Effect of pH, temperature, and sunlight on decomposition. Environ. Toxicol. 1999, 14, 155–161. [Google Scholar] [CrossRef]
  3. Wormer, L.; Cirés, S.; Carrasco, D.; Quesada, A. Cylindrospermopsin is not degraded by co-occurring natural bacterial communities during a 40-day study. Harmful Algae 2008, 7, 206–213. [Google Scholar] [CrossRef]
  4. Rücker, J.; Stüken, A.; Nixdorf, B.; Fastner, J.; Chorus, I.; Wiedner, C. Concentrations of particulate and dissolved cylindrospermopsin in 21 Aphanizomenon-dominated temperate lakes. Toxicon 2007, 50, 800–809. [Google Scholar] [CrossRef] [PubMed]
  5. Rzymski, P.; Poniedziałek, B. In search of environmental role of cylindrospermopsin: A review on global distribution and ecology of its producers. Water Res. 2014, 66, 320–337. [Google Scholar] [CrossRef]
  6. Antunes, J.T.; Leão, P.N.; Vasconcelos, V.M. Cylindrospermopsis raciborskii: Review of the distribution, phylogeography, and ecophysiology of a global invasive species. Front. Microbiol. 2015, 6, 473. [Google Scholar] [CrossRef] [Green Version]
  7. Szlag, D.C.; Sinclair, J.L.; Southwell, B.; Westrick, J.A. Cyanobacteria and cyanotoxins occurrence and removal from five high-risk conventional treatment drinking water plants. Toxins (Basel) 2015, 7, 2198–2220. [Google Scholar] [CrossRef] [Green Version]
  8. Yen, H.K.; Lin, T.F.; Liao, P.C. Simultaneous detection of nine cyanotoxins in drinking water using dual solid-phase extraction and liquid chromatography-mass spectrometry. Toxicon 2011, 58, 209–218. [Google Scholar] [CrossRef]
  9. Lei, L.; Peng, L.; Huang, X.; Han, B.P. Occurrence and dominance of Cylindrospermopsis raciborskii and dissolved cylindrospermopsin in urban reservoirs used for drinking water supply, South China. Environ. Monit. Assess. 2014, 186, 3079–3090. [Google Scholar] [CrossRef]
  10. Gutiérrez-Praena, D.; Jos, Á.; Pichardo, S.; Moreno, I.M.; Cameán, A.M. Presence and bioaccumulation of microcystins and cylindrospermopsin in food and the effectiveness of some cooking techniques at decreasing their concentrations: A review. Food Chem. Toxicol. 2013, 53, 139–152. [Google Scholar] [CrossRef]
  11. Mohamed, Z.A.; Bakr, A. Concentrations of cylindrospermopsin toxin in water and tilapia fish of tropical fishponds in Egypt, and assessing their potential risk to human health. Environ. Sci. Pollut. Res. 2018, 25, 36287–36297. [Google Scholar] [CrossRef] [PubMed]
  12. Ohtani, I.; Moore, R.E.; Runnegar, M.T.C. Cylindrospermopsin: A Potent Hepatotoxin from the Blue-Green Alga Cylindrospermopsis raciborskii. J. Am. Chem. Soc. 1992, 114, 7941–7942. [Google Scholar] [CrossRef]
  13. Evans, D.M.; Hughes, J.; Jones, L.F.; Murphy, P.J.; Falfushynska, H.; Horyn, O.; Sokolova, I.M.; Christensen, J.; Coles, S.J.; Rzymski, P. Elucidating cylindrospermopsin toxicity via synthetic analogues: An in vitro approach. Chemosphere 2019, 234, 139–147. [Google Scholar] [CrossRef]
  14. Froscio, S.M.; Humpage, A.R.; Burcham, P.C.; Falconer, I.R. Cylindrospermopsin-induced protein synthesis inhibition and its dissociation from acute toxicity in mouse hepatocytes. Environ. Toxicol. 2003, 18, 243–251. [Google Scholar] [CrossRef]
  15. Runnegar, M.T.; Xie, C.; Snider, B.B.; Wallace, G.A.; Weinreb, S.M.; Kuhlenkamp, J. In vitro hepatotoxicity of the cyanobacterial alkaloid cyclindrospermopsin and related synthetic analogues. Toxicol. Sci. 2002, 67, 81–87. [Google Scholar] [CrossRef] [Green Version]
  16. Terao, K.; Ohmori, S.; Igarashi, K.; Ohtani, I.; Watanabe, M.F.; Harada, K.I.; Ito, E.; Watanabe, M. Electron microscopic studies on experimental poisoning in mice induced by cylindrospermopsin isolated from blue-green alga Umezakia natans. Toxicon 1994, 32, 833–843. [Google Scholar] [CrossRef]
  17. Puerto, M.; Prieto, A.I.; Maisanaba, S.; Gutiérrez-Praena, D.; Mellado-García, P.; Jos, Á.; Cameán, A.M. Mutagenic and genotoxic potential of pure Cylindrospermopsin by a battery of in vitro tests. Food Chem. Toxicol. 2018, 121, 413–422. [Google Scholar] [CrossRef]
  18. Štraser, A.; Filipič, M.; Žegura, B. Cylindrospermopsin induced transcriptional responses in human hepatoma HepG2 cells. Toxicol. Vitr. 2013, 27, 1809–1819. [Google Scholar] [CrossRef]
  19. Štraser, A.; Filipič, M.; Gorenc, I.; Žegura, B. The influence of cylindrospermopsin on oxidative DNA damage and apoptosis induction in HepG2 cells. Chemosphere 2013, 92, 24–30. [Google Scholar] [CrossRef]
  20. Pichardo, S.; Cameán, A.M.; Jos, A. In vitro toxicological assessment of cylindrospermopsin: A review. Toxins (Basel) 2017, 9, 402. [Google Scholar] [CrossRef] [Green Version]
  21. Young, F.M.; Micklem, J.; Humpage, A.R. Effects of blue-green algal toxin cylindrospermopsin (CYN) on human granulosa cells in vitro. Reprod. Toxicol. 2008, 25, 374–380. [Google Scholar] [CrossRef] [PubMed]
  22. Liu, J.; Hernández, S.E.; Swift, S.; Singhal, N. Estrogenic activity of cylindrospermopsin and anatoxin-a and their oxidative products by FeIII-B*/H2O2. Water Res. 2018, 132, 309–319. [Google Scholar] [CrossRef] [PubMed]
  23. Žegura, B.; Štraser, A.; Filipič, M. Genotoxicity and potential carcinogenicity of cyanobacterial toxins—A review. Mutat. Res. Rev. Mutat. Res. 2011, 727, 16–41. [Google Scholar] [CrossRef] [PubMed]
  24. Bazin, E.; Mourot, A.; Humpage, A.R.; Fessard, V. Genotoxicity of a freshwater cyanotoxin, cylindrospermopsin, in two human cell lines: Caco-2 and HepaRG. Environ. Mol. Mutagen. 2010, 51, 251–259. [Google Scholar] [CrossRef]
  25. Štraser, A.; Filipič, M.; Žegura, B. Genotoxic effects of the cyanobacterial hepatotoxin cylindrospermopsin in the HepG2 cell line. Arch. Toxicol. 2011, 85, 1617–1626. [Google Scholar] [CrossRef]
  26. Žegura, B.; Gajski, G.; Štraser, A.; Garaj-Vrhovac, V. Cylindrospermopsin induced DNA damage and alteration in the expression of genes involved in the response to DNA damage, apoptosis and oxidative stress. Toxicon 2011, 58, 471–479. [Google Scholar] [CrossRef]
  27. Hercog, K.; Maisanaba, S.; Filipič, M.; Jos, Á.; Cameán, A.M.; Žegura, B. Genotoxic potential of the binary mixture of cyanotoxins microcystin-LR and cylindrospermopsin. Chemosphere 2017, 189, 319–329. [Google Scholar] [CrossRef]
  28. Štraser, A.; Filipič, M.; Novak, M.; Žegura, B. Double strand breaks and cell-cycle arrest induced by the cyanobacterial toxin cylindrospermopsin in HepG2 cells. Mar. Drugs 2013, 11, 3077–3090. [Google Scholar]
  29. Falconer, I.R.; Humpage, A.R. Preliminary evidence for in vivo tumour initiation by oral administration of extracts of the blue-green alga cylindrospermopsis raciborskil containing the toxin cylindrospermopsin. Environ. Toxicol. 2001, 16, 192–195. [Google Scholar] [CrossRef]
  30. Shen, X.; Lam, P.K.S.; Shaw, G.R.; Wickramasinghe, W. Genotoxicity investigation of a cyanobacterial toxin, cylindrospermopsin. Toxicon 2002, 40, 1499–1501. [Google Scholar] [CrossRef]
  31. Díez-Quijada, L.; Llana-Ruiz-Cabello, M.; Cătunescu, G.M.; Puerto, M.; Moyano, R.; Jos, A.; Cameán, A.M. In vivo genotoxicity evaluation of cylindrospermopsin in rats using a combined micronucleus and comet assay. Food Chem. Toxicol. 2019, 132, 110664. [Google Scholar] [CrossRef] [PubMed]
  32. Geyer, R.; Jambeck, J.R.; Law, K.L. Production, use, and fate of all plastics ever made. Sci. Adv. 2017, 3, e1700782. [Google Scholar] [CrossRef] [PubMed] [Green Version]
  33. Yamazaki, E.; Yamashita, N.; Taniyasu, S.; Lam, J.; Lam, P.K.S.; Moon, H.-B.; Jeong, Y.; Kannan, P.; Achyuthan, H.; Munuswamy, N.; et al. Bisphenol A and other bisphenol analogues including BPS and BPF in surface water samples from Japan, China, Korea and India. Ecotoxicol. Environ. Saf. 2015, 122, 565–572. [Google Scholar] [CrossRef] [PubMed]
  34. Jia, Y.; Chen, Q.; Crawford, S.E.; Song, L.; Chen, W.; Hammers-Wirtz, M.; Strauss, T.; Seiler, T.B.; Schäffer, A.; Hollert, H. Cyanobacterial blooms act as sink and source of endocrine disruptors in the third largest freshwater lake in China. Environ. Pollut. 2019, 245, 408–418. [Google Scholar] [CrossRef]
  35. Park, J.C.; Lee, M.-C.; Yoon, D.-S.; Han, J.; Kim, M.; Hwang, U.-K.; Jung, J.-H.; Lee, J.-S. Effects of bisphenol A and its analogs bisphenol F and S on life parameters, antioxidant system, and response of defensome in the marine rotifer Brachionus koreanus. Aquat. Toxicol. 2018, 199, 21–29. [Google Scholar] [CrossRef]
  36. Lehmler, H.-J.; Liu, B.; Gadogbe, M.; Bao, W. Exposure to Bisphenol A, Bisphenol F, and Bisphenol S in U.S. Adults and Children: The National Health and Nutrition Examination Survey 2013–2014. ACS Omega 2018, 3, 6523–6532. [Google Scholar] [CrossRef] [Green Version]
  37. Chen, D.; Kannan, K.; Tan, H.; Zheng, Z.; Feng, Y.L.; Wu, Y.; Widelka, M. Bisphenol Analogues Other Than BPA: Environmental Occurrence, Human Exposure, and Toxicity—A Review. Environ. Sci. Technol. 2016, 50, 5438–5453. [Google Scholar] [CrossRef]
  38. Corrales, J.; Kristofco, L.A.; Steele, W.B.; Yates, B.S.; Breed, C.S.; Williams, E.S.; Brooks, B.W. Global Assessment of Bisphenol A in the Environment: Review and Analysis of Its Occurrence and Bioaccumulation. Dose-Response 2015, 13, 1559325815598308. [Google Scholar] [CrossRef] [Green Version]
  39. Balabanič, D.; Filipič, M.; Krivograd Klemenčič, A.; Žegura, B. Raw and biologically treated paper mill wastewater effluents and the recipient surface waters: Cytotoxic and genotoxic activity and the presence of endocrine disrupting compounds. Sci. Total Environ. 2017, 574, 78–89. [Google Scholar] [CrossRef]
  40. Usman, A.; Ahmad, M. From BPA to its analogues: Is it a safe journey? Chemosphere 2016, 158, 131–142. [Google Scholar] [CrossRef]
  41. Kwan, C.S.; Takada, H. Release of Additives and Monomers from Plastic Wastes. In Handbook of Environmental Chemistry; Springer Verlag: Heidelberg, Germany, 2019; Volume 78, pp. 51–70. [Google Scholar]
  42. Huang, R.P.; Liu, Z.H.; Yuan, S.F.; Yin, H.; Dang, Z.; Wu, P.X. Worldwide human daily intakes of bisphenol A (BPA) estimated from global urinary concentration data (2000–2016) and its risk analysis. Environ. Pollut. 2017, 230, 143–152. [Google Scholar] [CrossRef] [PubMed]
  43. Vandenberg, L.N.; Hauser, R.; Marcus, M.; Olea, N.; Welshons, W.V. Human exposure to bisphenol A (BPA). Reprod. Toxicol. 2007, 24, 139–177. [Google Scholar] [CrossRef] [PubMed]
  44. Fic, A.; Žegura, B.; Sollner Dolenc, M.; Filipič, M.; Peterlin Mašič, L. Mutagenicity and DNA damage of bisphenol a and its structural analogues in HepG2 cells. Arh. Hig. Rada Toksikol. 2013, 64, 189–200. [Google Scholar] [CrossRef]
  45. Xin, L.; Lin, Y.; Wang, A.; Zhu, W.; Liang, Y.; Su, X.; Hong, C.; Wan, J.; Wang, Y.; Tian, H. Cytogenetic evaluation for the genotoxicity of bisphenol-A in Chinese hamster ovary cells. Environ. Toxicol. Pharmacol. 2015, 40, 524–529. [Google Scholar] [CrossRef]
  46. Hercog, K.; Maisanaba, S.; Filipič, M.; Sollner-Dolenc, M.; Kač, L.; Žegura, B. Genotoxic activity of bisphenol A and its analogues bisphenol S, bisphenol F and bisphenol AF and their mixtures in human hepatocellular carcinoma (HepG2) cells. Sci. Total Environ. 2019, 687, 267–276. [Google Scholar] [CrossRef]
  47. Tiwari, D.; Kamble, J.; Chilgunde, S.; Patil, P.; Maru, G.; Kawle, D.; Bhartiya, U.; Joseph, L.; Vanage, G. Clastogenic and mutagenic effects of bisphenol A: An endocrine disruptor. Mutat. Res. Genet. Toxicol. Environ. Mutagen. 2012, 743, 83–90. [Google Scholar] [CrossRef]
  48. Santovito, A.; Cannarsa, E.; Schleicherova, D.; Cervella, P. Clastogenic effects of bisphenol A on human cultured lymphocytes. Hum. Exp. Toxicol. 2018, 37, 69–77. [Google Scholar] [CrossRef] [Green Version]
  49. Kittler, K.; Hurtaud-Pessel, D.; Maul, R.; Kolrep, F.; Fessard, V. In vitro metabolism of the cyanotoxin cylindrospermopsin in HepaRG cells and liver tissue fractions. Toxicon 2016, 110, 47–50. [Google Scholar] [CrossRef]
  50. Wu, L.-H.; Zhang, X.-M.; Wang, F.; Gao, C.-J.; Chen, D.; Palumbo, J.R.; Guo, Y.; Zeng, E.Y. Occurrence of bisphenol S in the environment and implications for human exposure: A short review. Sci. Total Environ. 2018, 615, 87–98. [Google Scholar] [CrossRef]
  51. Izzotti, A.; Kanitz, S.; D’Agostini, F.; Camoirano, A.; De Flora, S. Formation of adducts by bisphenol A, an endocrine disruptor, in DNA in vitro and in liver and mammary tissue of mice. Mutat. Res. Genet. Toxicol. Environ. Mutagen. 2009, 679, 28–32. [Google Scholar] [CrossRef]
  52. Sonavane, M.; Gassman, N.R. Bisphenol A co-exposure effects: A key factor in understanding BPA’s complex mechanism and health outcomes. Crit. Rev. Toxicol. 2019, 49, 371–386. [Google Scholar] [CrossRef] [PubMed]
  53. OECD. No. 487: In Vitro Mammalian Cell Micronucleus Test. In OECD Guidelines for the Testing of Chemicals, Section 4; OECD iLibrary: Paris, France, 2014. [Google Scholar] [CrossRef]
  54. Westerink, W.M.A.; Schoonen, W.G.E.J. Cytochrome P450 enzyme levels in HepG2 cells and cryopreserved primary human hepatocytes and their induction in HepG2 cells. Toxicol. Vitr. 2007, 21, 1581–1591. [Google Scholar] [CrossRef] [PubMed]
  55. Nohmi, T. Thresholds of genotoxic and non-genotoxic carcinogens. Toxicol. Res. 2018, 34, 281–290. [Google Scholar] [CrossRef] [PubMed]
  56. Chan, G.K.Y.; Kleinheinz, T.L.; Peterson, D.; Moffat, J.G. A Simple High-Content Cell Cycle Assay Reveals Frequent Discrepancies between Cell Number and ATP and MTS Proliferation Assays. PLoS ONE 2013, 8, e63583. [Google Scholar] [CrossRef] [PubMed] [Green Version]
  57. Russo, G.; Capuozzo, A.; Barbato, F.; Irace, C.; Santamaria, R.; Grumetto, L. Cytotoxicity of seven bisphenol analogues compared to bisphenol A and relationships with membrane affinity data. Chemosphere 2018, 201, 432–440. [Google Scholar] [CrossRef]
  58. Rogakou, E.P.; Pilch, D.R.; Orr, A.H.; Ivanova, V.S.; Bonner, W.M. DNA double-stranded breaks induce histone H2AX phosphorylation on serine 139. J. Biol. Chem. 1998, 273, 5858–5868. [Google Scholar] [CrossRef] [Green Version]
  59. Rogakou, E.P.; Boon, C.; Redon, C.; Bonner, W.M. Megabase chromatin domains involved in DNA double-strand breaks in vivo. J. Cell Biol. 1999, 146, 905–916. [Google Scholar] [CrossRef] [Green Version]
  60. Kopp, B.; Khoury, L.; Audebert, M. Validation of the γH2AX biomarker for genotoxicity assessment: A review. Arch. Toxicol. 2019, 93, 2103–2114. [Google Scholar] [CrossRef]
  61. Audebert, M.; Dolo, L.; Perdu, E.; Cravedi, J.-P.; Zalko, D. Use of the γH2AX assay for assessing the genotoxicity of bisphenol A and bisphenol F in human cell lines. Arch. Toxicol. 2011, 85, 1463. [Google Scholar] [CrossRef]
  62. Humpage, A.R.; Fontaine, F.; Froscio, S.; Burcham, P.; Falconer, I.R. Cylindrospermopsin Genotoxicity and Cytotoxicity: Role Of Cytochrome P-450 and Oxidative Stress. J. Toxicol. Environ. Heal. Part A 2005, 68, 739–753. [Google Scholar] [CrossRef]
  63. Norris, R.L.; Seawright, A.; Shaw, G.; Senogles, P.; Eaglesham, G.; Smith, M.; Chiswell, R.; Moore, M. Hepatic xenobiotic metabolism of cylindrospermopsin in vivo in the mouse. Toxicon 2002, 40, 471–476. [Google Scholar] [CrossRef]
  64. Gramec Skledar, D.; Peterlin Mašič, L. Bisphenol A and its analogs: Do their metabolites have endocrine activity? Environ. Toxicol. Pharmacol. 2016, 47, 182–199. [Google Scholar] [CrossRef] [PubMed]
  65. Kang, J.H.; Katayama, Y.; Kondo, F. Biodegradation or metabolism of bisphenol A: From microorganisms to mammals. Toxicology 2006, 217, 81–90. [Google Scholar] [CrossRef] [PubMed]
  66. Hanioka, N.; Jinno, H.; Nishimura, T.; Ando, M. Suppression of male-specific cytochrome P450 isoforms by bisphenol A in rat liver. Arch. Toxicol. 1998, 72, 387–394. [Google Scholar] [CrossRef]
  67. Niwa, T.; Tsusui, M.; Kishimoto, K.; Yabusaki, Y.; Ishibashi, F.; Katagiri, M. Inhibition of Drug-Metabolizing Enzyme Activity in Human Hepatic Cytochrome P450s by Bisphenol A. Biol. Pharm. Bull. 2000, 23, 498–501. [Google Scholar] [CrossRef] [Green Version]
  68. Pfeiffer, E.; Metzler, M. Effect of bisphenol A on drug metabolising enzymes in rat hepatic microsomes and precision-cut rat liver slices. Arch. Toxicol. 2004, 78, 369–377. [Google Scholar] [CrossRef]
  69. Runnegar, M.T.; Kong, S.-M.; Zhong, Y.-Z.; Lu, S.C. Inhibition of reduced glutathione synthesis by cyanobacterial alkaloid cylindrospermopsin in cultured rat hepatocytes. Biochem. Pharmacol. 1995, 49, 219–225. [Google Scholar] [CrossRef]
  70. Cabaton, N.; Zalko, D.; Rathahao, E.; Canlet, C.; Delous, G.; Chagnon, M.-C.; Cravedi, J.-P.; Perdu, E. Biotransformation of bisphenol F by human and rat liver subcellular fractions. Toxicol. Vitr. 2008, 22, 1697–1704. [Google Scholar] [CrossRef]
  71. Jaeg, J.P.; Perdu, E.; Dolo, L.; Debrauwer, L.; Cravedi, J.-P.; Zalko, D. Characterization of New Bisphenol A Metabolites Produced by CD1 Mice Liver Microsomes and S9 Fractions. J. Agric. Food Chem. 2004, 52, 4935–4942. [Google Scholar] [CrossRef]
  72. Atkinson, A.; Roy, D. In Vitro Conversion of Environmental Estrogenic Chemical Bisphenol A to DNA Binding Metabolite(s). Biochem. Biophys. Res. Commun. 1995, 210, 424–433. [Google Scholar] [CrossRef]
  73. Kolšek, K.; Mavri, J.; Sollner Dolenc, M. Reactivity of bisphenol A-3,4-quinone with DNA. A quantum chemical study. Toxicol. Vitr. 2012, 26, 102–106. [Google Scholar] [CrossRef]
  74. Xu, H.; Zhang, X.; Ye, Y.; Li, X. Bisphenol A affects estradiol metabolism by targeting CYP1A1 and CYP19A1 in human placental JEG-3 cells. Toxicol. Vitr. 2019, 61, 104615. [Google Scholar] [CrossRef] [PubMed]
  75. Wei, W.; Zhang, C.; Liu, A.-L.; Xie, S.-H.; Chen, X.-M.; Lu, W.-Q. PCB126 enhanced the genotoxicity of BaP in HepG2 cells by modulating metabolic enzyme and DNA repair activities. Toxicol. Lett. 2009, 189, 91–95. [Google Scholar] [CrossRef] [PubMed]
  76. Yuan, J.; Lu, W.-Q.; Zou, Y.-L.; Wei, W.; Zhang, C.; Xie, H.; Chen, X.-M. Influence of aroclor 1254 on benzo(a)pyrene-induced DNA breakage, oxidative DNA damage, and cytochrome P4501A activity in human hepatoma cell line. Environ. Toxicol. 2009, 24, 327–333. [Google Scholar] [CrossRef] [PubMed]
  77. Wu, X.; Lu, W.; Mersch-Sundermann, V. Benzo(a)pyrene induced micronucleus formation was modulated by persistent organic pollutants (POPs) in metabolically competent human HepG2 cells. Toxicol. Lett. 2003, 144, 143–150. [Google Scholar] [CrossRef]
  78. Ellinger-Ziegelbauer, H.; Stuart, B.; Wahle, B.; Bomann, W.; Ahr, H.J. Comparison of the expression profiles induced by genotoxic and nongenotoxic carcinogens in rat liver. Mutat. Res. Mol. Mech. Mutagen. 2005, 575, 61–84. [Google Scholar] [CrossRef]
  79. Hreljac, I.; Zajc, I.; Lah, T.; Filipič, M. Effects of model organophosphorous pesticides on DNA damage and proliferation of HepG2 cells. Environ. Mol. Mutagen. 2008, 49, 360–367. [Google Scholar] [CrossRef]
  80. Petković, J.; Žegura, B.; StevanoviĆ, M.; Drnovšek, N.; UskokoviĆ, D.; Novak, S.; FilipiČ, M. DNA damage and alterations in expression of DNA damage responsive genes induced by TiO 2 nanoparticles in human hepatoma HepG2 cells. Nanotoxicology 2011, 5, 341–353. [Google Scholar] [CrossRef] [Green Version]
  81. Pezdirc, M.; Žegura, B.; Filipič, M. Genotoxicity and induction of DNA damage responsive genes by food-borne heterocyclic aromatic amines in human hepatoma HepG2 cells. Food Chem. Toxicol. 2013, 59, 386–394. [Google Scholar] [CrossRef]
  82. Žegura, B.; Zajc, I.; Lah, T.T.; Filipič, M. Patterns of microcystin-LR induced alteration of the expression of genes involved in response to DNA damage and apoptosis. Toxicon 2008, 51, 615–623. [Google Scholar] [CrossRef]
  83. Oren, M. Decision making by p53: Life, death and cancer. Cell Death Differ. 2003, 10, 431–442. [Google Scholar] [CrossRef] [PubMed]
  84. Lakin, N.D.; Jackson, S.P. Regulation of p53 in response to DNA damage. Oncogene 1999, 18, 7644–7655. [Google Scholar] [CrossRef] [PubMed] [Green Version]
  85. Cazzalini, O.; Scovassi, A.I.; Savio, M.; Stivala, L.A.; Prosperi, E. Multiple roles of the cell cycle inhibitor p21CDKN1A in the DNA damage response. Mutat. Res. Mutat. Res. 2010, 704, 12–20. [Google Scholar] [CrossRef]
  86. Zhan, Q. Gadd45a, a p53- and BRCA1-regulated stress protein, in cellular response to DNA damage. Mutat. Res. Mol. Mech. Mutagen. 2005, 569, 133–143. [Google Scholar] [CrossRef]
  87. Michael, D.; Oren, M. The p53–Mdm2 module and the ubiquitin system. Semin. Cancer Biol. 2003, 13, 49–58. [Google Scholar] [CrossRef]
  88. Ranuncolo, S.M.; Wang, L.; Polo, J.M.; Dell’Oso, T.; Dierov, J.; Gaymes, T.J.; Rassool, F.; Carroll, M.; Melnick, A. BCL6-mediated attenuation of DNA damage sensing triggers growth arrest and senescence through a p53-dependent pathway in a cell context-dependent manner. J. Biol. Chem. 2008, 283, 22565–22572. [Google Scholar] [CrossRef] [Green Version]
  89. Gassman, N.R. Induction of oxidative stress by bisphenol A and its pleiotropic effects. Environ. Mol. Mutagen. 2017, 58, 60–71. [Google Scholar] [CrossRef] [Green Version]
  90. Huc, L.; Lemarié, A.; Guéraud, F.; Héliès-Toussaint, C. Low concentrations of bisphenol A induce lipid accumulation mediated by the production of reactive oxygen species in the mitochondria of HepG2 cells. Toxicol. Vitr. 2012, 26, 709–717. [Google Scholar] [CrossRef]
  91. Mokra, K.; Woźniak, K.; Bukowska, B.; Sicińska, P.; Michałowicz, J. Low-concentration exposure to BPA, BPF and BPAF induces oxidative DNA bases lesions in human peripheral blood mononuclear cells. Chemosphere 2018, 201, 119–126. [Google Scholar] [CrossRef]
  92. Maćczak, A.; Cyrkler, M.; Bukowska, B.; Michałowicz, J. Bisphenol A, bisphenol S, bisphenol F and bisphenol AF induce different oxidative stress and damage in human red blood cells (in vitro study). Toxicol. Vitr. 2017, 41, 143–149. [Google Scholar] [CrossRef]
  93. Zangar, R.C.; Davydov, D.R.; Verma, S. Mechanisms that regulate production of reactive oxygen species by cytochrome P450. Toxicol. Appl. Pharmacol. 2004, 199, 316–331. [Google Scholar] [CrossRef] [PubMed]
  94. Matés, J.M. Effects of antioxidant enzymes in the molecular control of reactive oxygen species toxicology. Toxicology 2000, 153, 83–104. [Google Scholar] [CrossRef]
  95. Schafer, F.Q.; Buettner, G.R. Redox environment of the cell as viewed through the redox state of the glutathione disulfide/glutathione couple. Free Radic. Biol. Med. 2001, 30, 1191–1212. [Google Scholar] [CrossRef]
  96. Griffith, O.W. Biologic and pharmacologic regulation of mammalian glutathione synthesis. In Proceedings of the Free Radical Biology and Medicine; Pergamon: Oxford, United Kingdom, 1999; Volume 27, pp. 922–935. [Google Scholar]
  97. Circu, M.L.; Aw, T.Y. Reactive oxygen species, cellular redox systems, and apoptosis. Free Radic. Biol. Med. 2010, 48, 749–762. [Google Scholar] [CrossRef] [Green Version]
  98. R Core Team. R: A Language and Environment for Statistical Computing. R Foundation forStatistical Computing, Vienna, Austria. 2018. Available online: https://www.R-project.org/ (accessed on 11 December 2019).
  99. Wickham, H. Reshaping data with the reshape package. J. Stat. Softw. 2007, 21, 1–20. [Google Scholar] [CrossRef]
  100. Pinheiro, J.; Bates, D.; DebRoy, S.; Sarkar, D. R Development Core Team. 2010. nlme: Linear and Nonlinear Mixed Effects Models. R Packag. version 3 2007, 186. Available online: https://www.R-project.org/ (accessed on 11 December 2019).
  101. Maisanaba, S.; Hercog, K.; Ortuño, N.; Jos, Á.; Žegura, B. Induction of micronuclei and alteration of gene expression by an organomodified clay in HepG2 cells. Chemosphere 2016, 154, 240–248. [Google Scholar] [CrossRef]
  102. Baebler, Š.; Svalina, M.; Petek, M.; Stare, K.; Rotter, A.; Pompe-Novak, M.; Gruden, K. QuantGenius: Implementation of a decision support system for qPCR-based gene quantification. BMC Bioinform. 2017, 18, 276. [Google Scholar] [CrossRef]
Figure 1. The effects of single compounds and binary mixtures of CYN (0.5 µg/mL) and BPs (BPA, BPS, BPF, BPAF; 10 µg/mL) on the viability of HepG2 cells after 24 h (A) and 72 h (B) exposure, expressed in percentage of the solvent control (0.05% methanol and 0.04% DMSO = dotted line at value 1.0). PC is the positive control—etoposide ET (30 μg/mL). The lower dotted line in figure B denotes the average viability reduction by CYN. The asterisks (*) denote statistically significant difference between solvent control and treated cells (* p ≤ 0.05; ** p ≤ 0.01; **** p ≤ 0.0001).
Toxins 12 00219 g001
Figure 2. The effect of single compounds and binary mixtures of CYN (0.5 µg/mL) and BPs (BPA, BPS, BPF, BPAF; 10 µg/mL) on the induction of γ-H2AX formation (a sensitive marker for DNA double-strand breaks (DSBs)) in HepG2 cells after 72 h of exposure, using flow cytometry. The data are presented as quantile box plots. The edges represent the 25th and 75th percentiles, the solid line through the box is the median, and the error bars represent 95% confidence intervals. The solvent control (0 = 0.05% methanol and 0.04% DMSO) and a positive control (Etoposide ET, 1 μg/mL) were included in the experiment. The asterisks (*) denote statistically significant difference between solvent control and treated cells (* p ≤ 0.05; ** p ≤ 0.01; **** p ≤ 0.0001). The dots (•) denote a statistically significant difference between CYN alone and CYN/BPs treated cells (• p ≤ 0.05; •• p ≤ 0.01; •••• p ≤ 0.0001).
Toxins 12 00219 g002
Figure 3. The effect of CYN (0.5 µg/mL), BPs (BPA, BPS, BPF, BPAF; 10 µg/mL) and their binary mixtures on the expression of the CYP1A1 gene, involved in xenobiotic metabolism, in HepG2 cells after 24 h of exposure. The deregulations are expressed in the fold-change of expression of the gene in the solvent control group (0.05% methanol and 0.04% DMSO = solid line at value 1.0). PC is the positive control—Benzo[a]pyrene BaP (30 μM). The dotted line denotes biologically significant differences in gene expression (1.5-fold change). The asterisks (*) denote a statistically significant difference between solvent control and treated cells (* p ≤ 0.05; ** p = 0.01; **** p = 0.0001).
Toxins 12 00219 g003
Figure 4. The effect of CYN (0.5 µg/mL), BPs (BPA, BPS, BPF, BPAF; 10 µg/mL), and their binary mixtures on the expression of DNA damage response genes (TP53, MDM2, CDKN1A, GADD45A) in HepG2 cells after 24 h of exposure. The deregulations are expressed in fold-change of expression of the gene in the solvent control group (0.05% methanol and 0.04% DMSO = solid line at value 1.0). PC is the positive control—Benzo[a]pyrene BaP (30 μM). The lower and upper dotted lines denote biologically significant differences in gene expression (1.5-fold change). The asterisks (*) denote a statistically significant difference between solvent control and treated cells (* p = 0.05; ** p = 0.01; *** p = 0.001).
Toxins 12 00219 g004
Figure 5. The effect of CYN (0.5 µg/mL), BPs (BPA, BPS, BPF, BPAF; 10 µg/mL), and their binary mixtures on the expression of oxidative stress response genes (GCLC, GPX1, GSR, SOD1A, CAT) in HepG2 cells after 24 h of exposure. The deregulations are expressed in fold-change of expression of the gene in the solvent control group (0.05% methanol and 0.04% DMSO = solid line at value 1.0). PC is the positive control—Benzo[a]pyrene BaP (30 μM). The lower and upper dotted lines denote biologically significant differences in gene expression (1.5-fold change). The asterisks (*) denote a statistically significant difference between solvent control and treated cells (* p = 0.05; ** p = 0.01; *** p = 0.001).
Toxins 12 00219 g005
Table 1. CYN, BPA, and its structural analogues.
AbbreviationCAS N°Chemical StructureFormulaMW (g/mol)
CylindrospermopsinCYN143545-90-8 Toxins 12 00219 i001C15H21N5O7S415.4
Bisphenol ABPA080-05-7 Toxins 12 00219 i002C15H16O2228.29
Bisphenol SBPS080-09-1 Toxins 12 00219 i003C12H10O4S250.27
Bisphenol FBPF620-92-8 Toxins 12 00219 i004C13H12O2200.23
Bisphenol AFBPAF1478-61-1 Toxins 12 00219 i005C15H10F6O2336.23
Table 2. List of Taqman Gene Expression Assays used.
Gene SymbolAssay IDEntrez Gene NameCellular Function
CYP1A1Hs01054797_g1Cytochrome P450, family 1, subfamily A, polypeptide 1Metabolism of xenobiotics, detoxification response
GCLCHs00155249_m1Glutamate-cysteine ligase, catalytic subunitOxidative stress response
GPX1Hs00829989_gHGlutathione peroxidase 1Oxidative stress response
GSRHs00167317_m1Glutathione reductaseOxidative stress response
SOD1AHs00533490_m1Superoxide dis-mutase 1 Oxidative stress response
CATHs00156308_m1CatalaseOxidative stress response
CDKN1AHs00355782_m1Cyclin-dependent kinase inhibitor 1A (p21. Cip1)DNA-damage response genes
GADD45AHs00169255_m1Growth arrest and DNA damage-inducible, alphaDNA-damage response genes
MDM2Hs00234753_m1 MDM2 proto-oncogenDNA-damage response genes
TP53Hs01034249_m1Tumor protein P53DNA-damage response genes
CHEK1Hs00967506_m1Checkpoint kinase 1DNA-damage response genes

