Laser Ablation Remote-Electrospray Ionisation Mass Spectrometry (LARESI MSI) Imaging—New Method for Detection and Spatial Localization of Metabolites and Mycotoxins Produced by Moulds


Abstract
1. Introduction
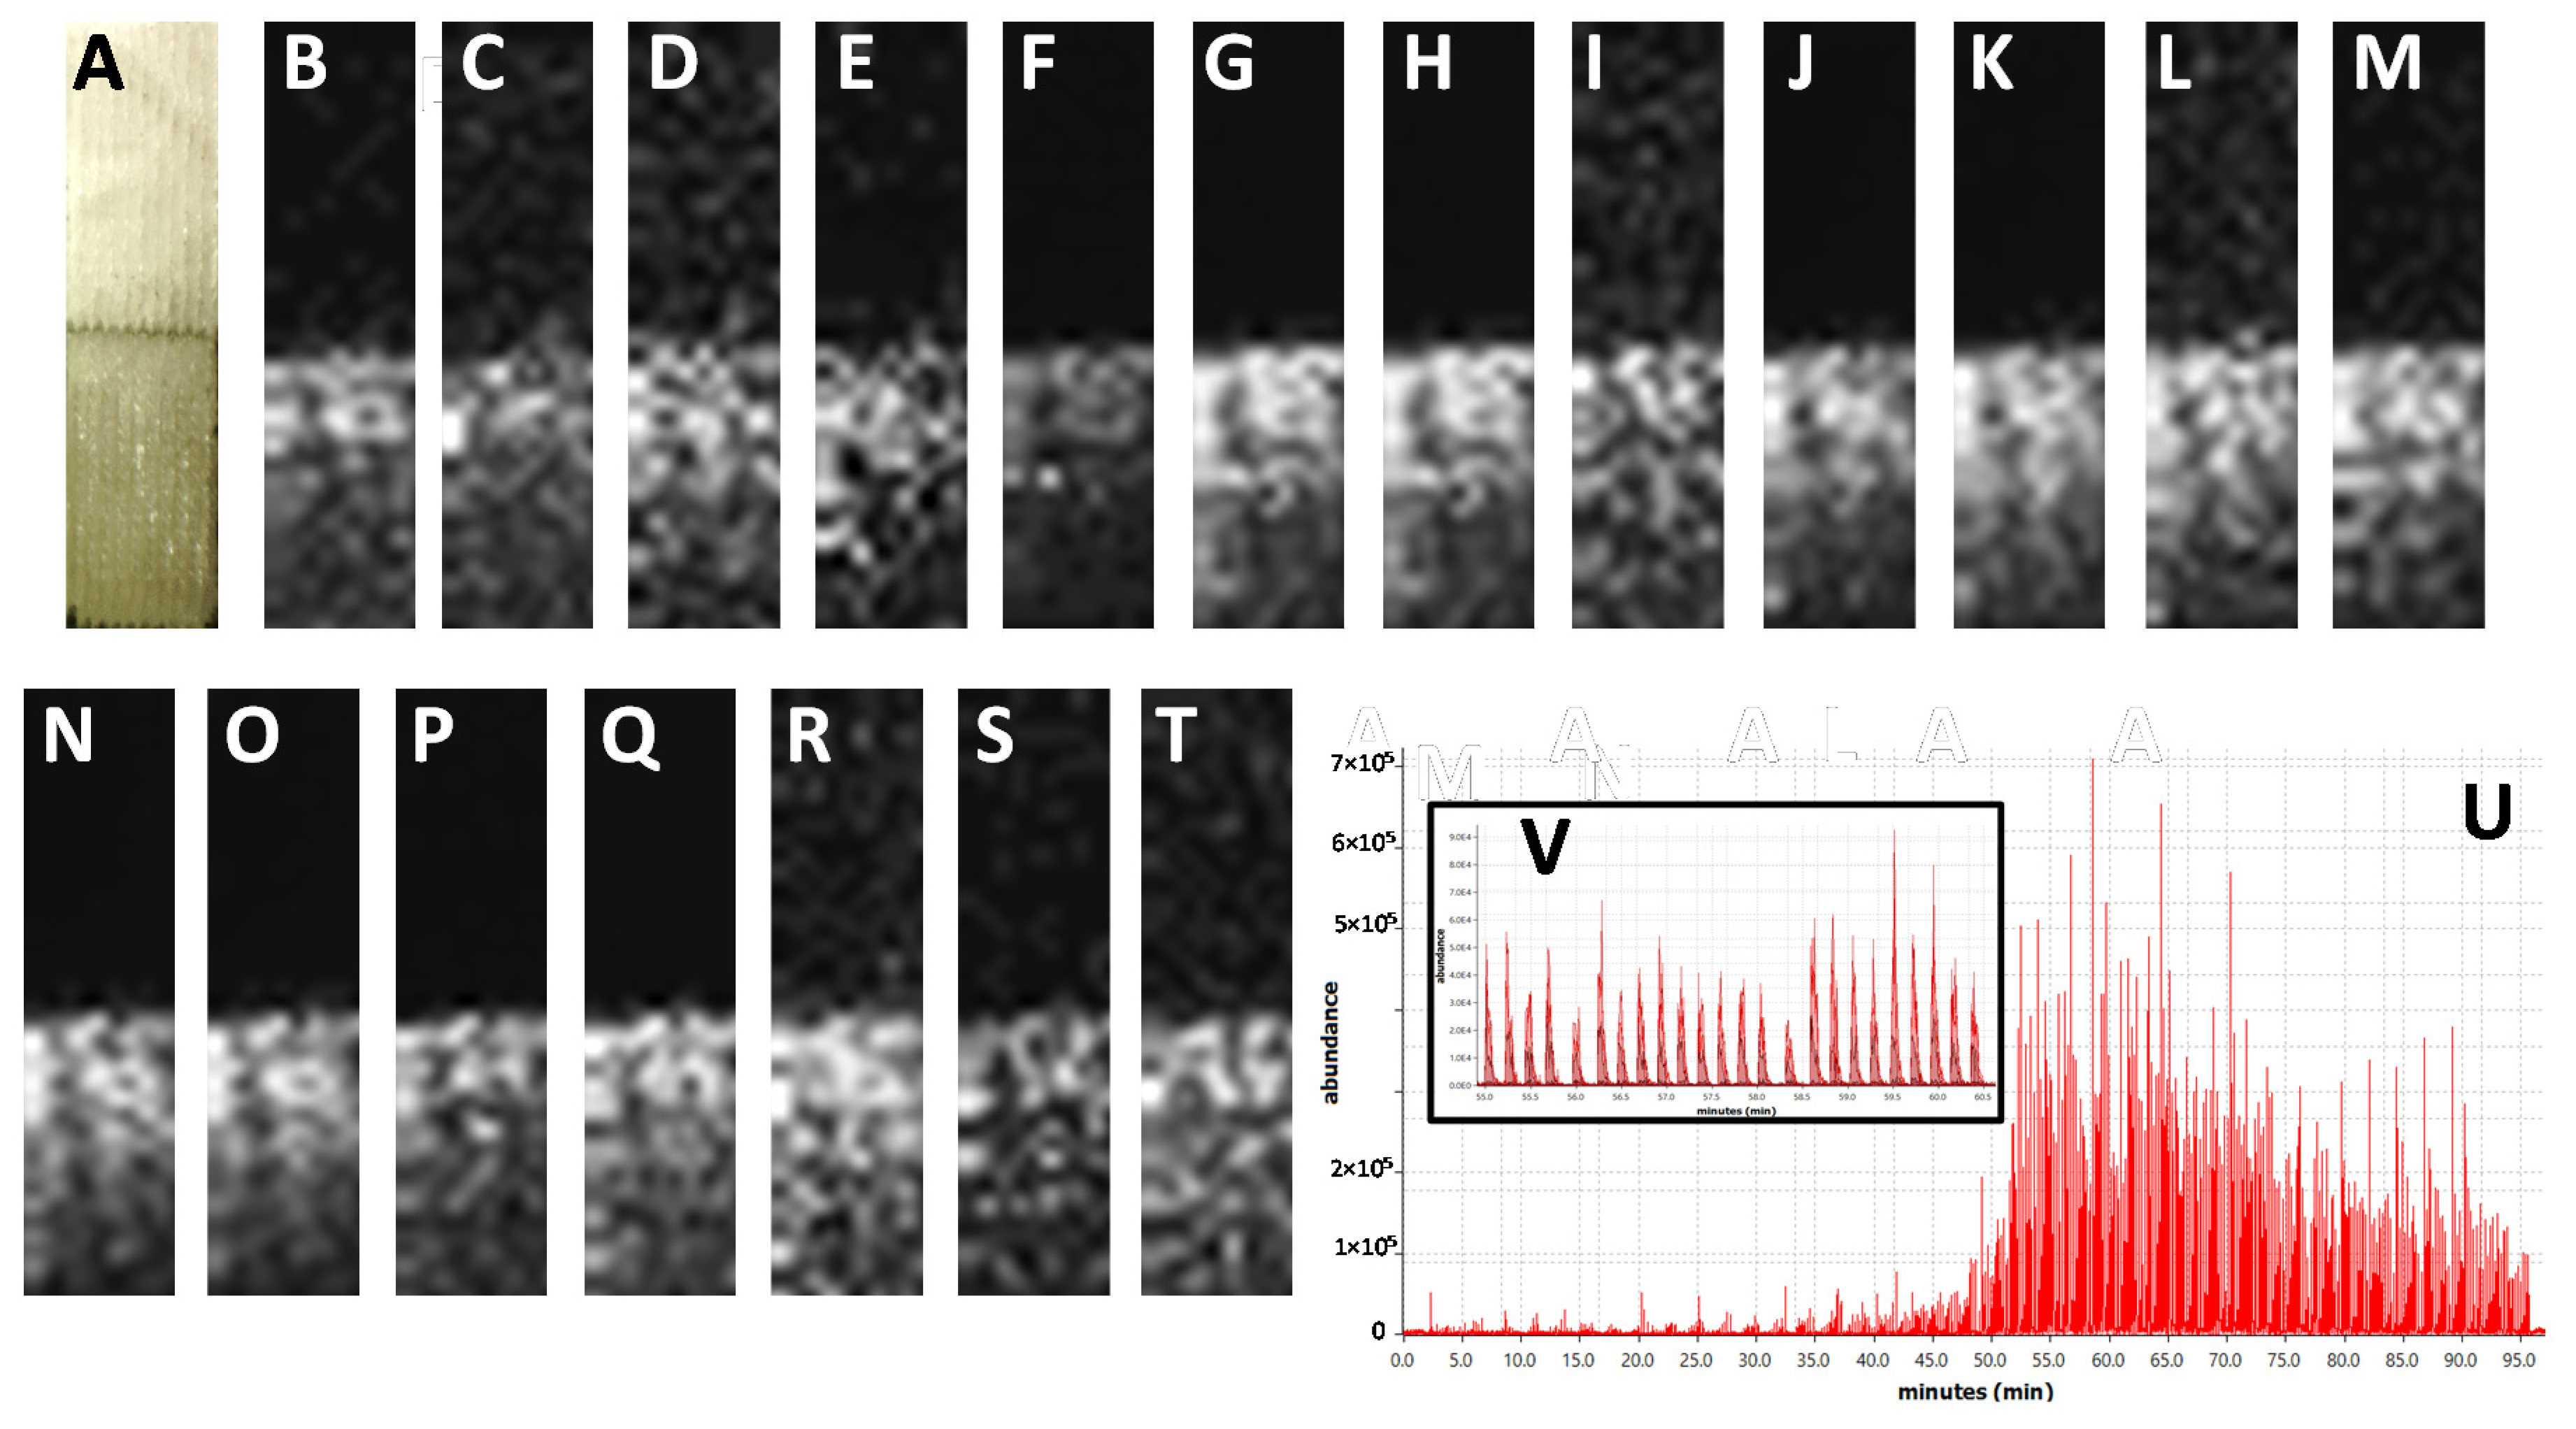
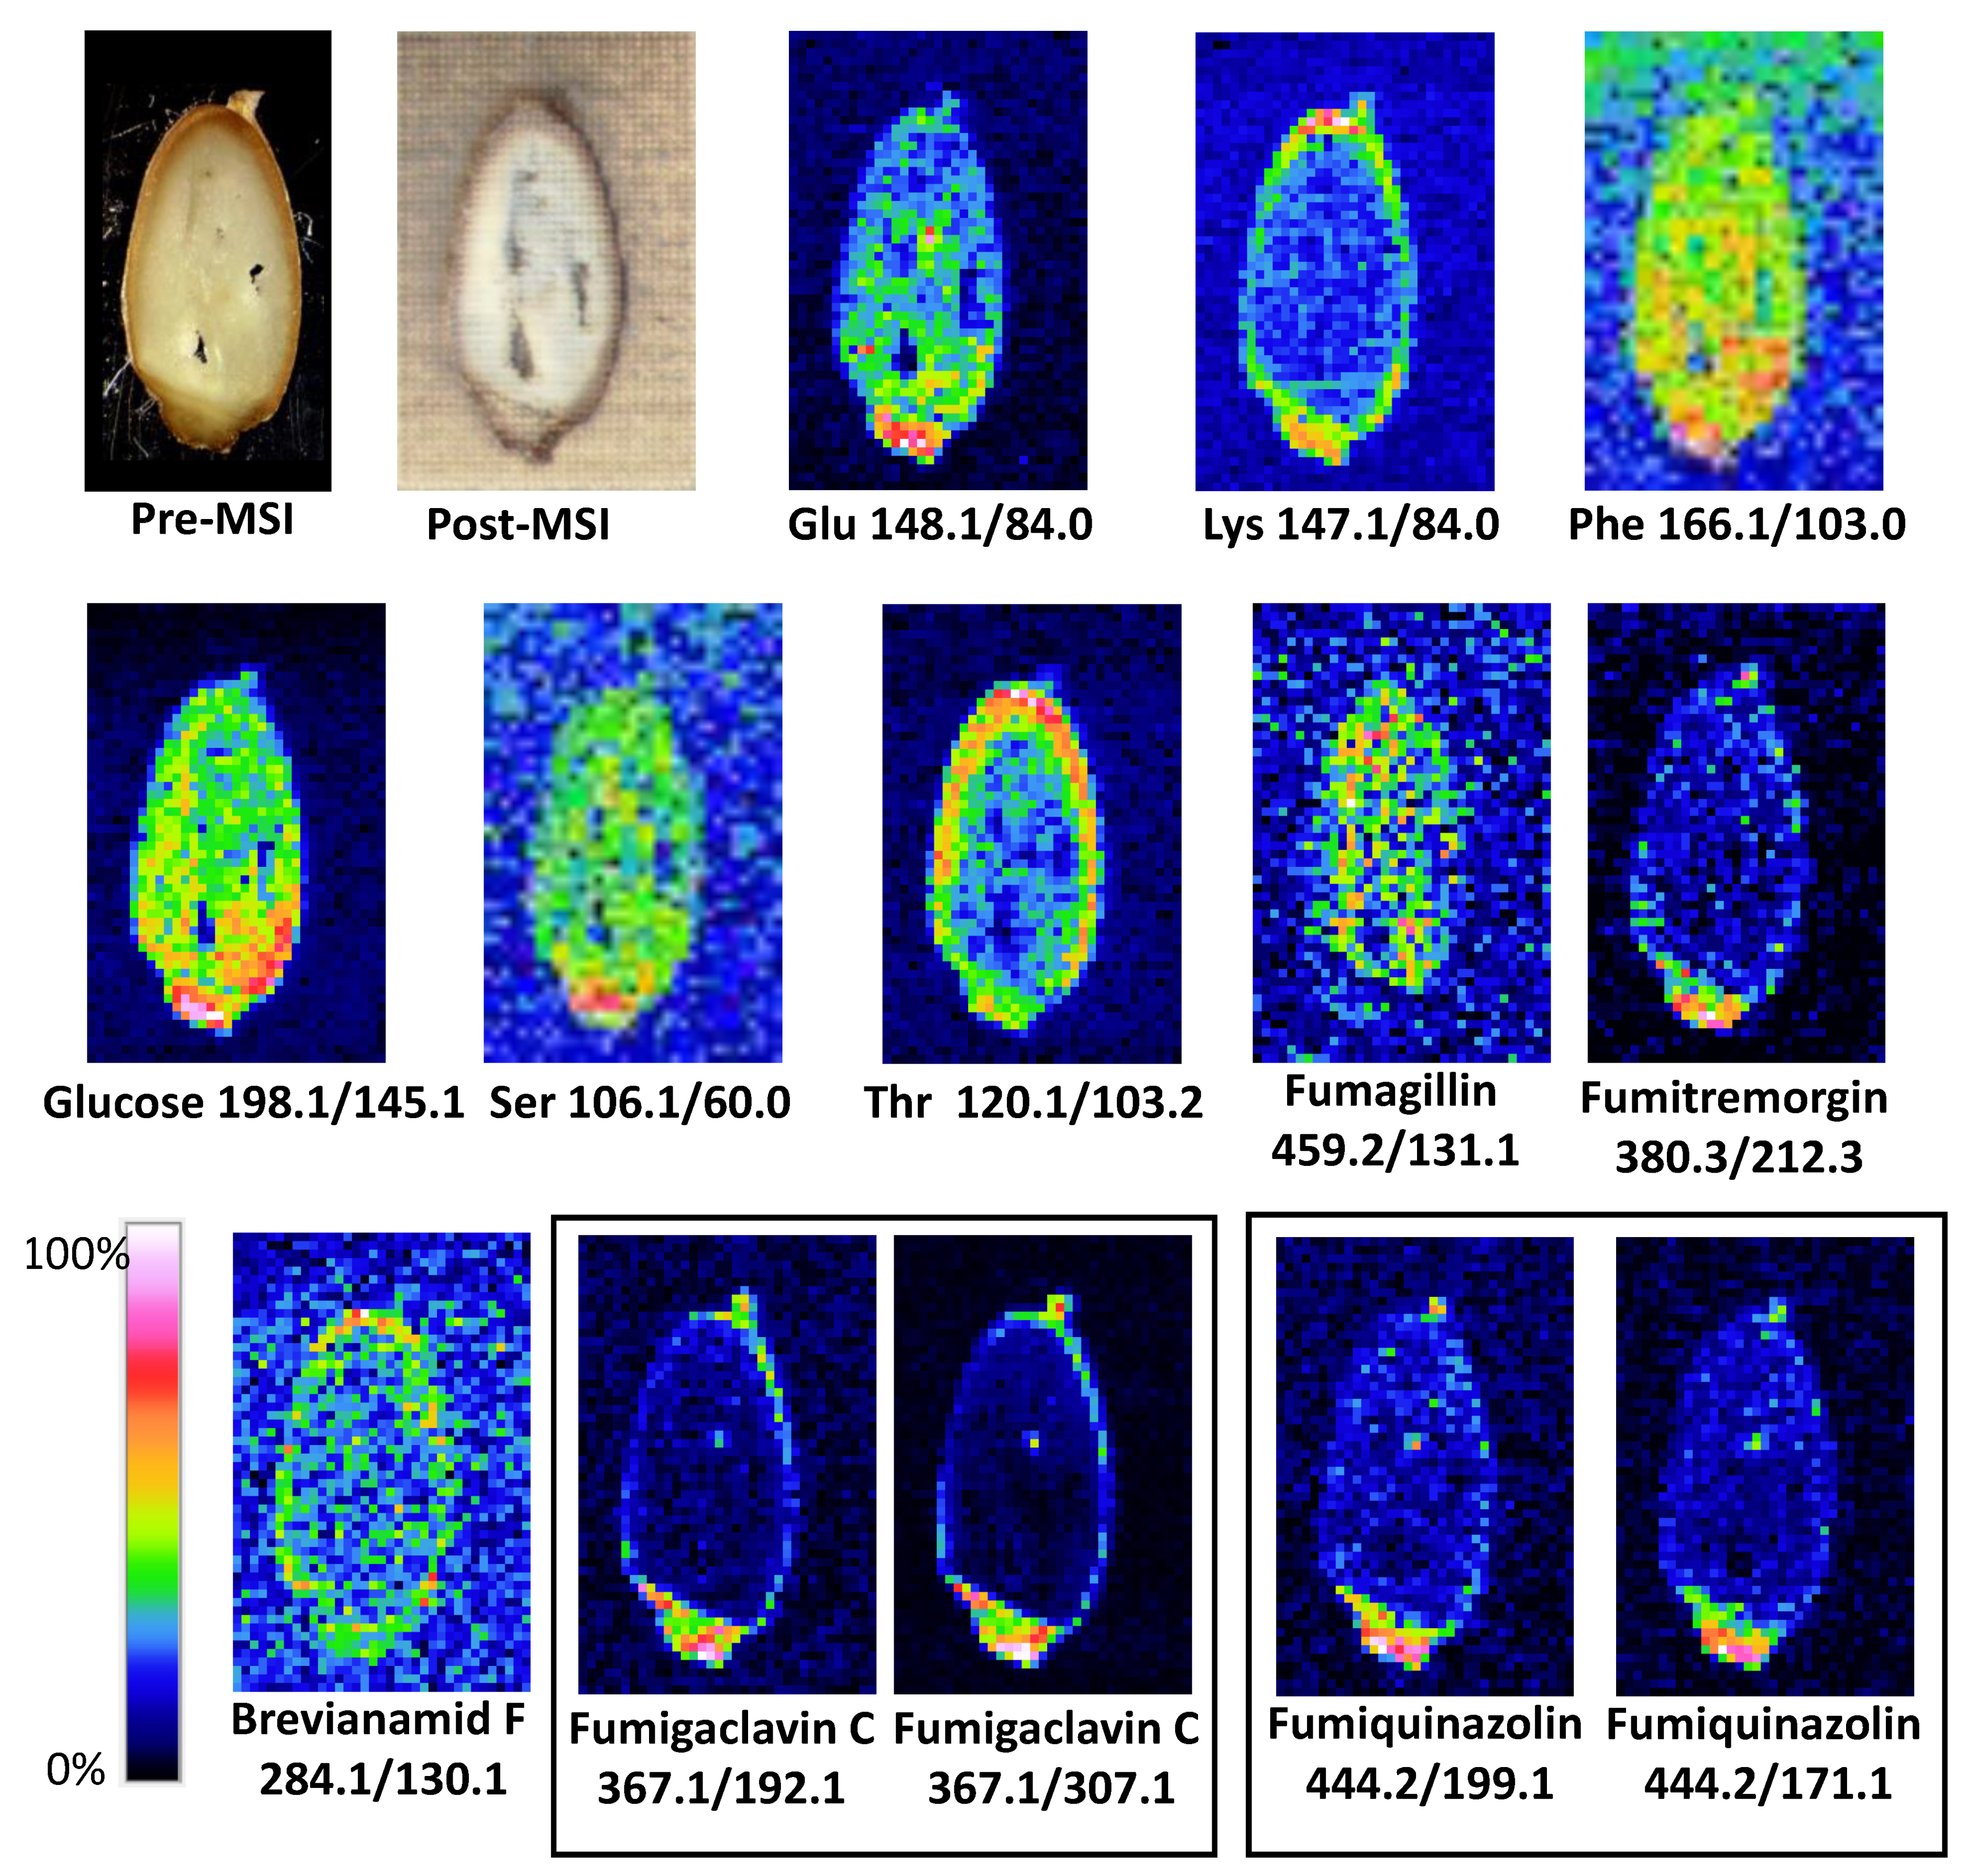
2. Results
3. Conclusions
4. Materials and Methods
4.1. Mould Culture
4.1.1. Culture on Agar Medium
4.1.2. Grain Contamination
4.2. LARESI SRM MSI Experiments
4.2.1. LARESI of Agar Medium Samples
4.2.2. LARESI of Spelt Section
4.2.3. Mass Spectrometer Parameters
Supplementary Materials
Author Contributions
Funding
Conflicts of Interest
References
- Sulyok, M.; Berthiller, F.; Krska, R.; Schuhmacher, R. Development and validation of a liquid chromatography/tandem mass spectrometric method for the determination of 39 mycotoxins in wheat and maize. Rapid Commun. Mass Spectrom. 2006, 20, 2649–2659. [Google Scholar] [CrossRef] [PubMed]
- Capriotti, A.L.; Caruso, G.; Cavaliere, C.; Foglia, P.; Samperi, R.; Laganà, A. Multiclass mycotoxin analysis in food, environmental and biological matrices with chromatography/mass spectrometry. Mass Spectrom. Rev. 2011, 31, 466–503. [Google Scholar] [CrossRef]
- Bennett, J.W.; Klich, M. Mycotoxins. Clin. Microbiol. Rev. 2003, 16, 497–516. [Google Scholar] [CrossRef]
- Zöllner, P.; Mayer-Helm, B. Trace mycotoxin analysis in complex biological and food matrices by liquid chromatography–atmospheric pressure ionisation mass spectrometry. J. Chromatogr. A 2006, 1136, 123–169. [Google Scholar] [CrossRef] [PubMed]
- Shanakhat, H.; Sorrentino, A.; Raiola, A.; Romano, A.; Masi, P.; Cavella, S. Current methods for mycotoxins analysis and innovative strategies for their reduction in cereals: An overview. J. Sci. Food Agric. 2018, 98, 4003–4013. [Google Scholar] [CrossRef] [PubMed]
- Anfossi, L.; Giovannoli, C.; Baggiani, C. Mycotoxin detection. Curr. Opin. Biotechnol. 2016, 37, 120–126. [Google Scholar] [CrossRef] [PubMed]
- Hussein, H.S.; Brasel, J.M. Toxicity, metabolism, and impact of mycotoxins on humans and animals. Toxicology 2001, 167, 101–134. [Google Scholar] [CrossRef]
- Sulyok, M.; Krska, R.; Schuhmacher, R. A liquid chromatography/tandem mass spectrometric multi-mycotoxin method for the quantification of 87 analytes and its application to semi-quantitative screening of moldy food samples. Anal. Bioanal. Chem. 2007, 389, 1505–1523. [Google Scholar] [CrossRef]
- Malachová, A.; Sulyok, M.; Beltrán, E.; Berthiller, F.; Krska, R. Optimization and validation of a quantitative liquid chromatography–tandem mass spectrometric method covering 295 bacterial and fungal metabolites including all regulated mycotoxins in four model food matrices. J. Chromatogr. A 2014, 1362, 145–156. [Google Scholar] [CrossRef]
- Lacina, O.; Zachariasova, M.; Urbanova, J.; Vaclavikova, M.; Cajka, T.; Hajslova, J. Critical assessment of extraction methods for the simultaneous determination of pesticide residues and mycotoxins in fruits, cereals, spices and oil seeds employing ultra-high performance liquid chromatography–tandem mass spectrometry. J. Chromatogr. A 2012, 1262, 8–18. [Google Scholar] [CrossRef]
- Beltrán, E.; Sirtori, C.; Portolés, T.; Ripollés, C.; Sancho, J.V.; Yusà, V.; Marín, S.; Hernández, F. Development of sensitive and rapid analytical methodology for food analysis of 18 mycotoxins included in a total diet study. Anal. Chim. Acta 2013, 783, 39–48. [Google Scholar] [CrossRef]
- Stroka, J.; Spanjer, M.; Buechler, S.; Barel, S.; Kos, G.; Anklam, E. Novel sampling methods for the analysis of mycotoxins and the combination with spectroscopic methods for the rapid evaluation of deoxynivalenol contamination. Toxicol. Lett. 2004, 153, 99–107. [Google Scholar] [CrossRef]
- Casado, M.R.; Hubatova, M.; Weightman, R.; Magan, N.; Origgi, S. Geostatistical analysis of the spatial distribution of mycotoxin concentration in bulk cereals. Food Addit. Contam. Part A 2009, 26, 867–873. [Google Scholar] [CrossRef] [PubMed]
- Schmale, D.G.; Shah, D.A.; Bergstrom, G.C. Spatial Patterns of Viable Spore Deposition of Gibberella zeae in Wheat Fields. Phytopathology 2005, 95, 472–479. [Google Scholar] [CrossRef] [PubMed]
- Wilhelm, K.P.; Jones, R.K. Meso- and Microscale Patterns of Fusarium Head Blight in Spring Wheat Fields in Minnesota. Plant Dis. 2005, 89, 474–479. [Google Scholar] [CrossRef][Green Version]
- Caprioli, R.M.; Farmer, T.B.; Gile, J. Molecular Imaging of Biological Samples: Localization of Peptides and Proteins Using MALDI-TOF MS. Anal. Chem. 1997, 69, 4751–4760. [Google Scholar] [CrossRef] [PubMed]
- Seeley, E.H.; Oppenheimer, S.R.; Mi, D.; Chaurand, P.; Caprioli, R.M. Enhancement of protein sensitivity for MALDI imaging mass spectrometry after chemical treatment of tissue sections. J. Am. Soc. Mass Spectrom. 2008, 19, 1069–1077. [Google Scholar] [CrossRef]
- Lippincott-Schwartz, J.; Snapp, E.L.; Kenworthy, A.K. Studying protein dynamics in living cells. Nat. Rev. Mol. Cell Biol. 2001, 2, 444–456. [Google Scholar] [CrossRef]
- Hájek, R.; Lísa, M.; Khalikova, M.; Jirásko, R.; Cífková, E.; Študent, V.; Vrána, D.; Opálka, L.; Vávrová, K.; Matzenauer, M.; et al. HILIC/ESI-MS determination of gangliosides and other polar lipid classes in renal cell carcinoma and surrounding normal tissues. Anal. Bioanal. Chem. 2018, 410, 6585–6594. [Google Scholar] [CrossRef]
- Nizioł, J.; Rode, W.; Laskowska, B.; Ruman, T. Novel Monoisotopic 109AgNPET for Laser Desorption/Ionization Mass Spectrometry. Anal. Chem. 2013, 85, 1926–1931. [Google Scholar] [CrossRef]
- Nizioł, J.; Ossoliński, K.; Ossoliński, T.; Ossolińska, A.; Bonifay, V.; Sekuła, J.; Dobrowolski, Z.; Sunner, J.; Beech, I.B.; Ruman, T. Surface-Transfer Mass Spectrometry Imaging of Renal Tissue on Gold Nanoparticle Enhanced Target. Anal. Chem. 2016, 88, 7365–7371. [Google Scholar] [CrossRef] [PubMed]
- Dill, A.L.; Eberlin, L.S.; Zheng, C.; Costa, A.; Ifa, D.R.; Cheng, L.; Masterson, T.A.; Koch, M.O.; Vitek, O.; Cooks, R.G. Multivariate statistical differentiation of renal cell carcinomas based on lipidomic analysis by ambient ionization imaging mass spectrometry. Anal. Bioanal. Chem. 2010, 398, 2969–2978. [Google Scholar] [CrossRef] [PubMed]
- Alfaro, C.M.; Jarmusch, A.K.; Pirro, V.; Kerian, K.S.; Masterson, T.A.; Cheng, L.; Cooks, R.G. Ambient ionization mass spectrometric analysis of human surgical specimens to distinguish renal cell carcinoma from healthy renal tissue. Anal. Bioanal. Chem. 2016, 408, 5407–5414. [Google Scholar] [CrossRef] [PubMed]
- Tamura, K.; Horikawa, M.; Sato, S.; Miyake, H.; Setou, M. Discovery of lipid biomarkers correlated with disease progression in clear cell renal cell carcinoma using desorption electrospray ionization imaging mass spectrometry. Oncotarget 2019, 10, 1688–1703. [Google Scholar] [CrossRef] [PubMed]
- Takáts, Z.; Wiseman, J.M.; Gologan, B.; Cooks, R.G. Mass Spectrometry Sampling Under Ambient Conditions with Desorption Electrospray Ionization. Science 2004, 306, 471–473. [Google Scholar] [CrossRef] [PubMed]
- Nizioł, J.; Sunner, J.; Beech, I.B.; Ossoliński, K.; Ossolińska, A.; Ossoliński, T.; Płaza, A.; Ruman, T. Localization of Metabolites of Human Kidney Tissue with Infrared Laser-Based Selected Reaction Monitoring Mass Spectrometry Imaging and Silver-109 Nanoparticle-Based Surface Assisted Laser Desorption/Ionization Mass Spectrometry Imaging. Anal. Chem. 2020, 92, 4251–4258. [Google Scholar] [CrossRef]
- Kovarik, P.; Grivet, C.; Bourgogne, E.; Hopfgartner, G. Method development aspects for the quantitation of pharmaceutical compounds in human plasma with a matrix-assisted laser desorption/ionization source in the multiple reaction monitoring mode. Rapid Commun. Mass Spectrom. 2007, 21, 911–919. [Google Scholar] [CrossRef]
- Gutarowska, B.; Skora, J.; Stępień, Ł.; Twarużek, M.; Błajet-Kosicka, A.; Otlewska, A.; Grajewski, J. Estimation of fungal contamination and mycotoxin production at workplaces in composting plants, tanneries, archives and libraries. World Mycotoxin J. 2014, 7, 345–355. [Google Scholar] [CrossRef]
- Dreisewerd, K.; Draude, F.; Kruppe, S.; Rohlfing, A.; Berkenkamp, S.; Pohlentz, G. Molecular Analysis of Native Tissue and Whole Oils by Infrared Laser Mass Spectrometry. Anal. Chem. 2007, 79, 4514–4520. [Google Scholar] [CrossRef]
- Barton-Wright, E.C.; Moran, T. The microbiological assay of amino acids. II. The distribution of amino acids in the wheat grain. Analyst 1946, 71, 278. [Google Scholar] [CrossRef]
- Chełkowski, J. Cereal Grain—Fungi, Mycotoxins and Quality in Drying and Storage; Elsevier: Amsterdam, The Netherlands, 1991. [Google Scholar]
- Bullerman, L.B.; Bianchini, A. Stability of mycotoxins during food processing. Int. J. Food Microbiol. 2007, 119, 140–146. [Google Scholar] [CrossRef] [PubMed]
- Sydenham, E.W.; Van Der Westhuizen, L.; Stockenström, S.; Shephard, G.S.; Thiel, P.G. Fumonisin-contaminated maise: Physical treatment for the partial decontamination of bulk shipments. Food Addit. Contam. 1994, 11, 25–32. [Google Scholar] [CrossRef] [PubMed]
- Abbas, H.K.; Mirocha, C.J.; Pawlosky, R.J.; Pusch, D.J. Effect of cleaning, milling, and baking on deoxynivalenol in wheat. Appl. Environ. Microbiol. 1985, 50, 482–486. [Google Scholar] [CrossRef] [PubMed]
- Scudamore, K.A.; Banks, J.; Macdonald, S.J. Fate of ochratoxin A in the processing of whole wheat grains during milling and bread production. Food Addit. Contam. 2003, 20, 1153–1163. [Google Scholar] [CrossRef]
- Park, D.L. Effect of processing on aflatoxin. In Mycotoxins and Food Safety; De Vries, J.W., Trucksess, M.W., Jackson, L.S., Eds.; Advances in Experimental Medicine and Biology; Springer: Boston, MA, USA, 2002; Volume 504, pp. 173–179. [Google Scholar] [CrossRef]
- Imai, T.; Tanabe, K.; Kato, T.; Fukushima, K. Localization of ferruginol, a diterpene phenol, in Cryptomeria japonica heartwood by time-of-flight secondary ion mass spectrometry. Planta 2005, 221, 549–556. [Google Scholar] [CrossRef]
- Mullen, A.K.; Clench, M.R.; Crosland, S.; Sharples, K.R. Determination of agrochemical compounds in soya plants by imaging matrix-assisted laser desorption/ionisation mass spectrometry. Rapid Commun. Mass Spectrom. 2005, 19, 2507–2516. [Google Scholar] [CrossRef]
- Lee, Y.J.; Perdian, D.C.; Song, Z.; Yeung, E.S.; Nikolau, B.J. Use of mass spectrometry for imaging metabolites in plants. Plant J. 2012, 70, 81–95. [Google Scholar] [CrossRef]
- Matros, A.; Mock, H.-P. Mass Spectrometry Based Imaging Techniques for Spatially Resolved Analysis of Molecules. Front. Plant Sci. 2013, 4, 89. [Google Scholar] [CrossRef]
- Dong, Y.; Li, B.; Malitsky, S.; Rogachev, I.; Aharoni, A.; Kaftan, F.; Svatoš, A.; Franceschi, P. Sample Preparation for Mass Spectrometry Imaging of Plant Tissues: A Review. Front. Plant Sci. 2016, 7, 60. [Google Scholar] [CrossRef]
- Wisman, A.P.; Tamada, Y.; Hirohata, S.; Gomi, K.; Fukusaki, E.; Shimma, S. Mapping haze-komi on rice koji grains using β-glucuronidase expressing Aspergillus oryzae and mass spectrometry imaging. J. Biosci. Bioeng. 2020, 129, 296–301. [Google Scholar] [CrossRef]
- Szulc, J.; Ruman, T.; Karbowska-Berent, J.; Kozielec, T.; Gutarowska, B. Analyses of microorganisms and metabolites diversity on historic photographs using innovative methods. J. Cult. Heritage 2020, 45, 101–113. [Google Scholar] [CrossRef]


| No | Compound Name | Q1 [m/z] | Q3 [m/z] | Scan Time [ms] | DP [V] | EP [V] | CE [V] | CXP [V] |
|---|---|---|---|---|---|---|---|---|
| 1 | Serine | 106.1 | 60.0 | 30 | 6 | 10 | 16 | 7 |
| 2 | Threonine | 120.1 | 102.1 | 30 | 20 | 14 | 27 | 10 |
| 3 | Lysine | 147.1 | 84.0 | 30 | 15 | 14 | 23 | 10 |
| 4 | Glutamic acid | 148.1 | 84.0 | 30 | 21 | 14 | 21 | 10 |
| 5 | Phenylalanine | 166.1 | 103.0 | 30 | 11 | 14 | 37 | 12 |
| 6 | Glucose | 198.1 | 145.1 | 30 | 90 | 10 | 20 | 10 |
| 7 | Brevianamide F | 284.1 | 130.1 | 20 | 86 | 10 | 31 | 8 |
| 8 | Fumagillin | 459.2 | 131.1 | 20 | 101 | 10 | 43 | 22 |
| 9 | Fumiquinazolin D | 444.2 | 171.1 | 20 | 71 | 10 | 49 | 10 |
| 10 | 444.2 | 199.1 | 71 | 10 | 25 | 10 | ||
| 11 | Fumigaclavin C | 367.1 | 192.1 | 20 | 91 | 10 | 51 | 10 |
| 12 | 367.1 | 307.1 | 91 | 10 | 33 | 10 | ||
| Fumitremorgin C | 380.3 | 212.3 | 20 | 91 | 10 | 45 | 12 |
Publisher’s Note: MDPI stays neutral with regard to jurisdictional claims in published maps and institutional affiliations. |
© 2020 by the authors. Licensee MDPI, Basel, Switzerland. This article is an open access article distributed under the terms and conditions of the Creative Commons Attribution (CC BY) license (http://creativecommons.org/licenses/by/4.0/).
Share and Cite
Szulc, J.; Ruman, T. Laser Ablation Remote-Electrospray Ionisation Mass Spectrometry (LARESI MSI) Imaging—New Method for Detection and Spatial Localization of Metabolites and Mycotoxins Produced by Moulds. Toxins 2020, 12, 720. https://doi.org/10.3390/toxins12110720
Szulc J, Ruman T. Laser Ablation Remote-Electrospray Ionisation Mass Spectrometry (LARESI MSI) Imaging—New Method for Detection and Spatial Localization of Metabolites and Mycotoxins Produced by Moulds. Toxins. 2020; 12(11):720. https://doi.org/10.3390/toxins12110720
Chicago/Turabian StyleSzulc, Justyna, and Tomasz Ruman. 2020. "Laser Ablation Remote-Electrospray Ionisation Mass Spectrometry (LARESI MSI) Imaging—New Method for Detection and Spatial Localization of Metabolites and Mycotoxins Produced by Moulds" Toxins 12, no. 11: 720. https://doi.org/10.3390/toxins12110720
APA StyleSzulc, J., & Ruman, T. (2020). Laser Ablation Remote-Electrospray Ionisation Mass Spectrometry (LARESI MSI) Imaging—New Method for Detection and Spatial Localization of Metabolites and Mycotoxins Produced by Moulds. Toxins, 12(11), 720. https://doi.org/10.3390/toxins12110720