1. Introduction
Deoxynivalenol (DON) is along with aflatoxins, fumonisins, ochratoxin A, and zearalenone, one of the main mycotoxins of significance for human disease [
1]. DON frequently contaminates cereals and cereal-based products [
2]. The population of the European Union (EU) is frequently exposed to DON mainly due to the consumption of bread and other bakery wares [
2]. Therefore, the European Commission (EC) has set maximum levels for DON in milling products and bread/bakery wares of 750 µg/kg and 500 µg/kg, respectively [
3]. This legislation follows the rationale that it is feasible to reduce DON from flour during the production of bakery products by 33%. This assumption is supported by the recent report on the risk associated with DON in food by the European Food Safety Authority (EFSA) [
2]. From 2007 to 2014, EFSA gathered occurrence data for the concentration of DON present in different food groups. For milling products, bread and rolls, and fine bakery wares, 4609, 2837, and 975 data points, respectively, were collected from the EU member states. The mean and 95th percentile concentrations of DON were 20–30% lower in bread and bakery wares (bread and rolls, fine bakery wares) than in flour (milling products).
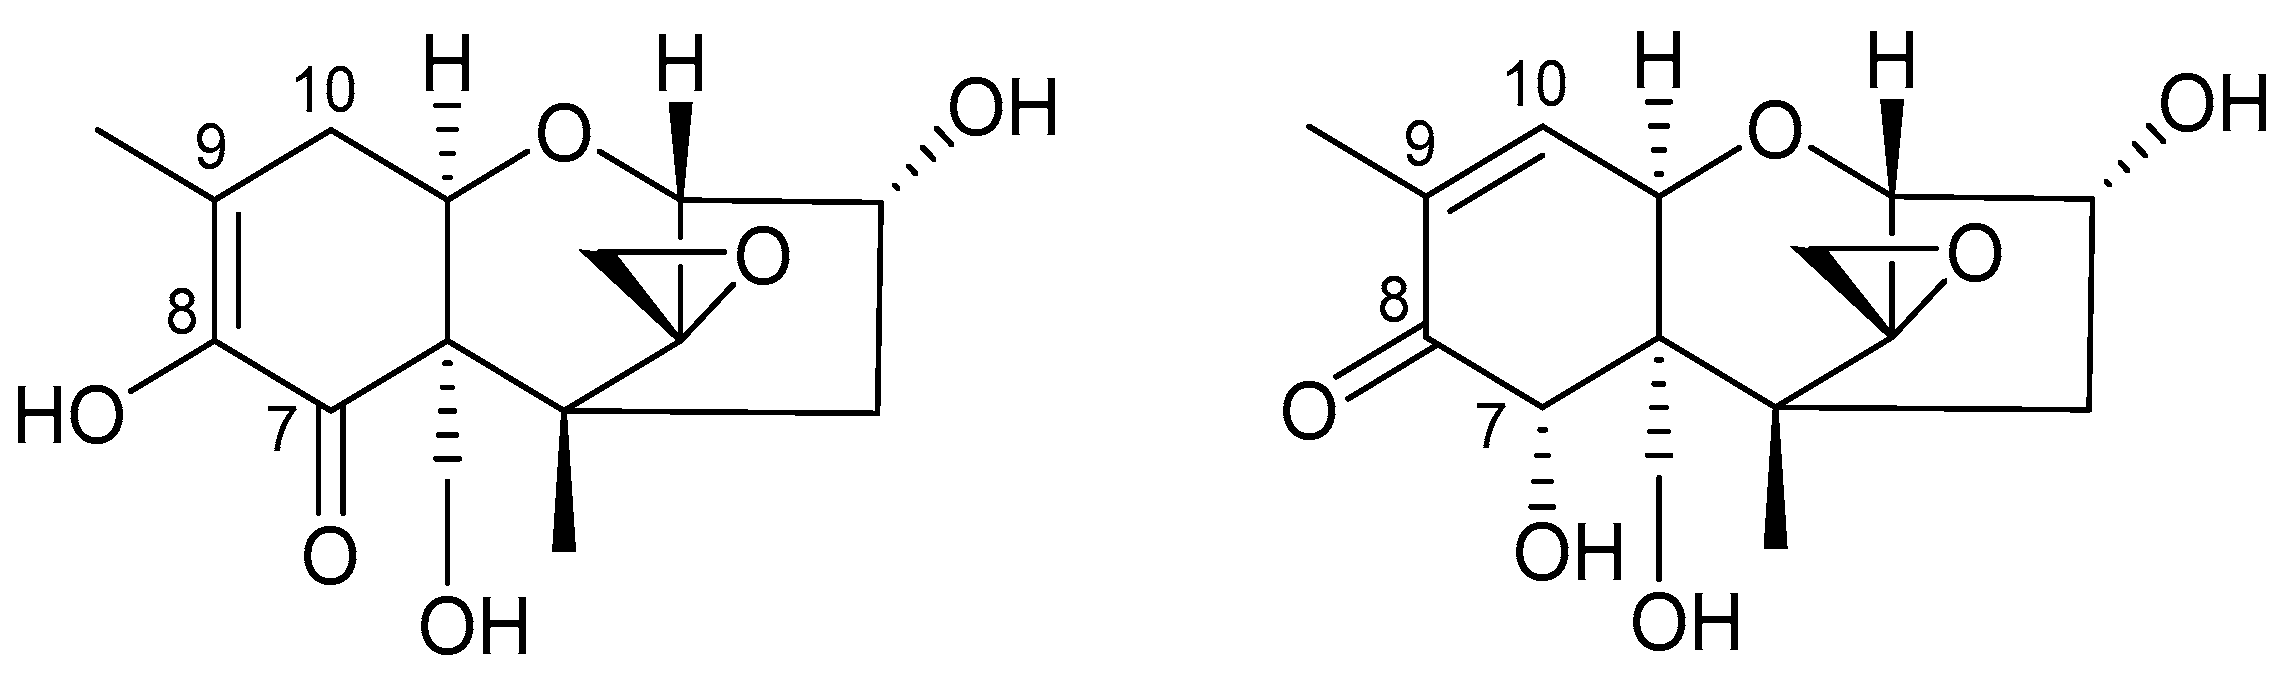
During baking, DON was found to degrade mainly to isoDON, but also to norDON B and norDON C [
4,
5,
6]. norDON B and norDON C were found to be considerably less cytotoxic than DON [
5]. isoDON was found to have much lower inhibitory potency on the ribosome than DON, which is strongly indicative of its overall lower toxicity [
6].
The reduction of the DON concentration during baking can be due to formulation (i.e., the dilution effect due to mixing contaminated flour with non-contaminated ingredients) or due to degradation of DON. The reduction due to formulation can be easily calculated from the percentage of flour of the finished bakery product, assuming no additional sources of DON. The extent of the DON degradation during baking, however, was reported to be very variable [
2,
7,
8]. This high variation can be explained by errors in the calculation of the amount of DON that was degraded (e.g., by not considering the dilution with other ingredients) and by not performing baking trials with a suitable number of replicates. Recently, we identified all degradation products of DON, formed during baking of crackers, biscuits, and bread, using a stable isotope labelling approach combined with high resolution mass spectrometry analysis. After quantifying DON and all of its formed degradation products, we were able to provide the first comprehensive mass balance for those commodities [
6].
In this current study, DON degradation during the production of crackers, biscuits, and bread from flour fortified with DON was determined to be 6%, 5%, and 2%, respectively, based on the increase of degradation products. As this study was aimed at the elucidation of the degradation products that are formed during baking, the experiments were carried out under standard baking conditions. As a step forward, the influence of the processing conditions should be evaluated. Furthermore, experiments with naturally contaminated flour need to be conducted in order to reproduce the actual industrial starting conditions in place during the large-scale production of bakery products.
The influence of different processing parameters on DON degradation during the production of crackers, biscuits, bread, and rusks was determined in previous studies [
9,
10,
11,
12]. Statistical evaluation of the DON concentration showed that baking temperature, baking time, and the concentration of the raising agent NaHCO
3 influence the amount of DON in the final products. However, the statistical models as well as the determination of the DON degradation may have suffered from the high analytical variability of the determination of the DON concentration.
We hypothesized that DON degradation during industrial baking is influenced by the choice of processing parameter (i.e., ingredients, leavening, and baking conditions). Hence, the objectives of this study were to: (i) Produce bakery products (crackers, biscuits, and bread) from naturally contaminated flour using different processing conditions, (ii) determine DON degradation by LC-MS/MS based quantification of the DON degradation products and iii) develop a statistical model which shows the influence of the processing parameters on the DON degradation. Due to the comprehensive baking trials in combination with the highly sensitive LC-MS/MS analysis and the consideration of all formed degradation products, this study presents the most accurate report on the effect of industrial baking on DON degradation to date. Moreover, a first characterization of the cytotoxicity of isoDON, compared to DON, is presented.
2. Results
To study the main processing factors affecting the mitigation of DON during industrial baking, crackers, biscuits, and bread were chosen as representative commodities of the main bakery categories produced with very different technologies. A Design of Experiments (DoE) approach was applied to set up the experimental trials. In agreement with results previously obtained by our research group [
9,
10,
12], the main technological parameters monitored were: (i) Baking conditions (i.e., time and temperature), (ii) pH modifying agents (NaHCO
3, NH
4HCO
3, and other minor ingredients) and (iii) leavening conditions (time, temperature, presence, and type of leavening agents). Each factor was modified within a range according to technological feasibility. Some conditions stressed the process over the organoleptic acceptability of the final product. These processing conditions were chosen to promote significant changes of the DON concentration in order to understand the impact of the applied processing conditions. In the present work, all the food commodities were produced at a pilot plant level. As a starting point of the DoE approach, the same processing parameters as those on common industrial processing lines were chosen.
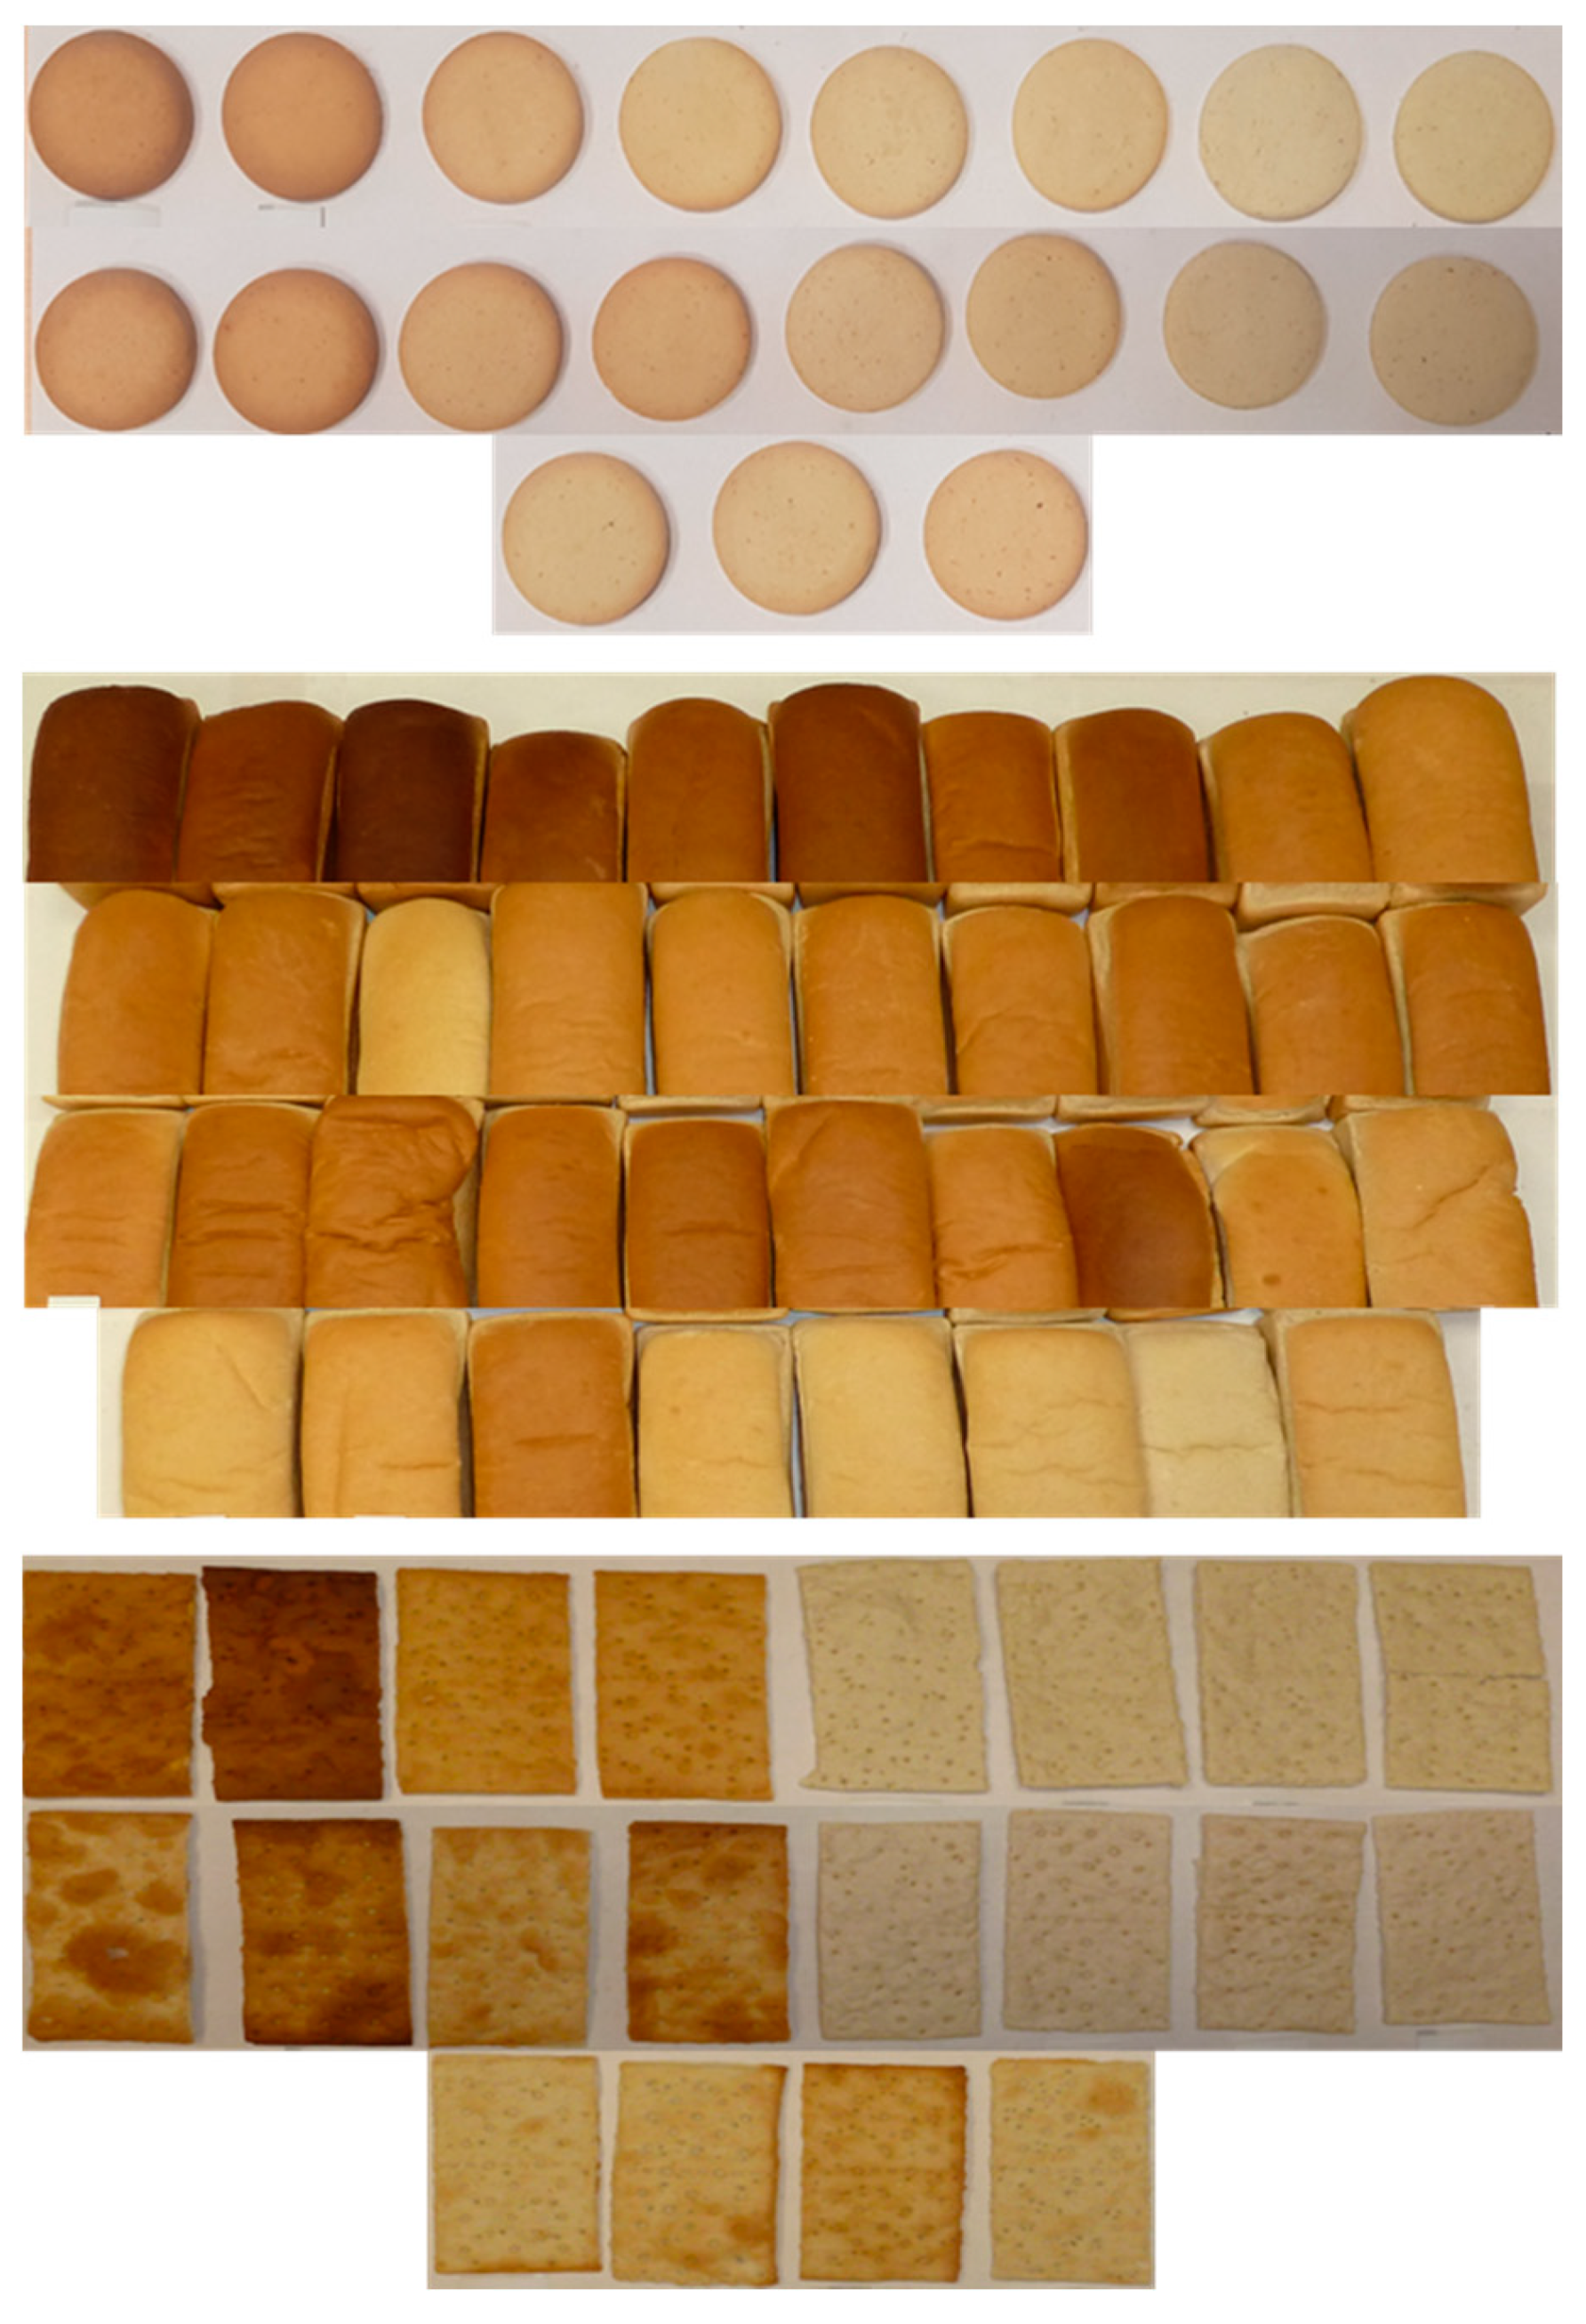
Figure 1 exemplifies the influence of the baking conditions on the final appearance of biscuits, bread and crackers.
2.1. Incluence of Processing Parameters on DON Degradation during the Production of Bakery Products
For all three baking commodities, the results of the experimental trials were evaluated and presented in two sub-chapters. First, the sum of the DON degradation products, which is the measure for DON degradation, was shown as a bar graph. The individual experiments were listed according to the processing parameters that were found to be important for DON degradation based on a visual assessment. In this way, Figures 2, 4, and 6 show the DON degradation that was achieved under the specified processing conditions ranked from high to low DON degradation. These bar graphs give a first impression of the DON degradation and the influence of the processing parameter for the individual commodities. Second, to confirm and refine the conclusions of the visual assessment, a DoE model was built using the MODDE software tool. The outcome of this statistical analysis is visualized by an effects plot which displays the change of the sum of the DON degradation products when a processing factor is varied from its lowest to its highest value (Figures 3, 5, and 7, top). The data set obtained from the DoE model was used to build a prediction model for the influence of the process parameter that led to a statistically significant increase of DON degradation. These predictive factor plots show how DON degradation can be enhanced by the design of the production process (Figures 3, 5, and 9, bottom). To allow for the easy comparability of the results between the three baking commodities, the same scaling was chosen for the individual graphs.
2.1.1. Biscuits
Biscuits, from the technological point of view, represent a quite simple bakery preparation characterized by a baking step and the use of raising agents. In order to monitor the impact of these two factors on the DON content in the final products, a very basic recipe was chosen, containing only flour, oil, sugar, and water, with the addition of NaHCO
3 and NH
4HCO
3 as leavening agents. Several batches of biscuits were prepared at different conditions according to the DoE inputs based on the Screening Interaction model. In the present study, the processing parameters NaHCO
3 concentration, NH
4HCO
3 concentration, baking time, baking temperature, and sugar content were varied (
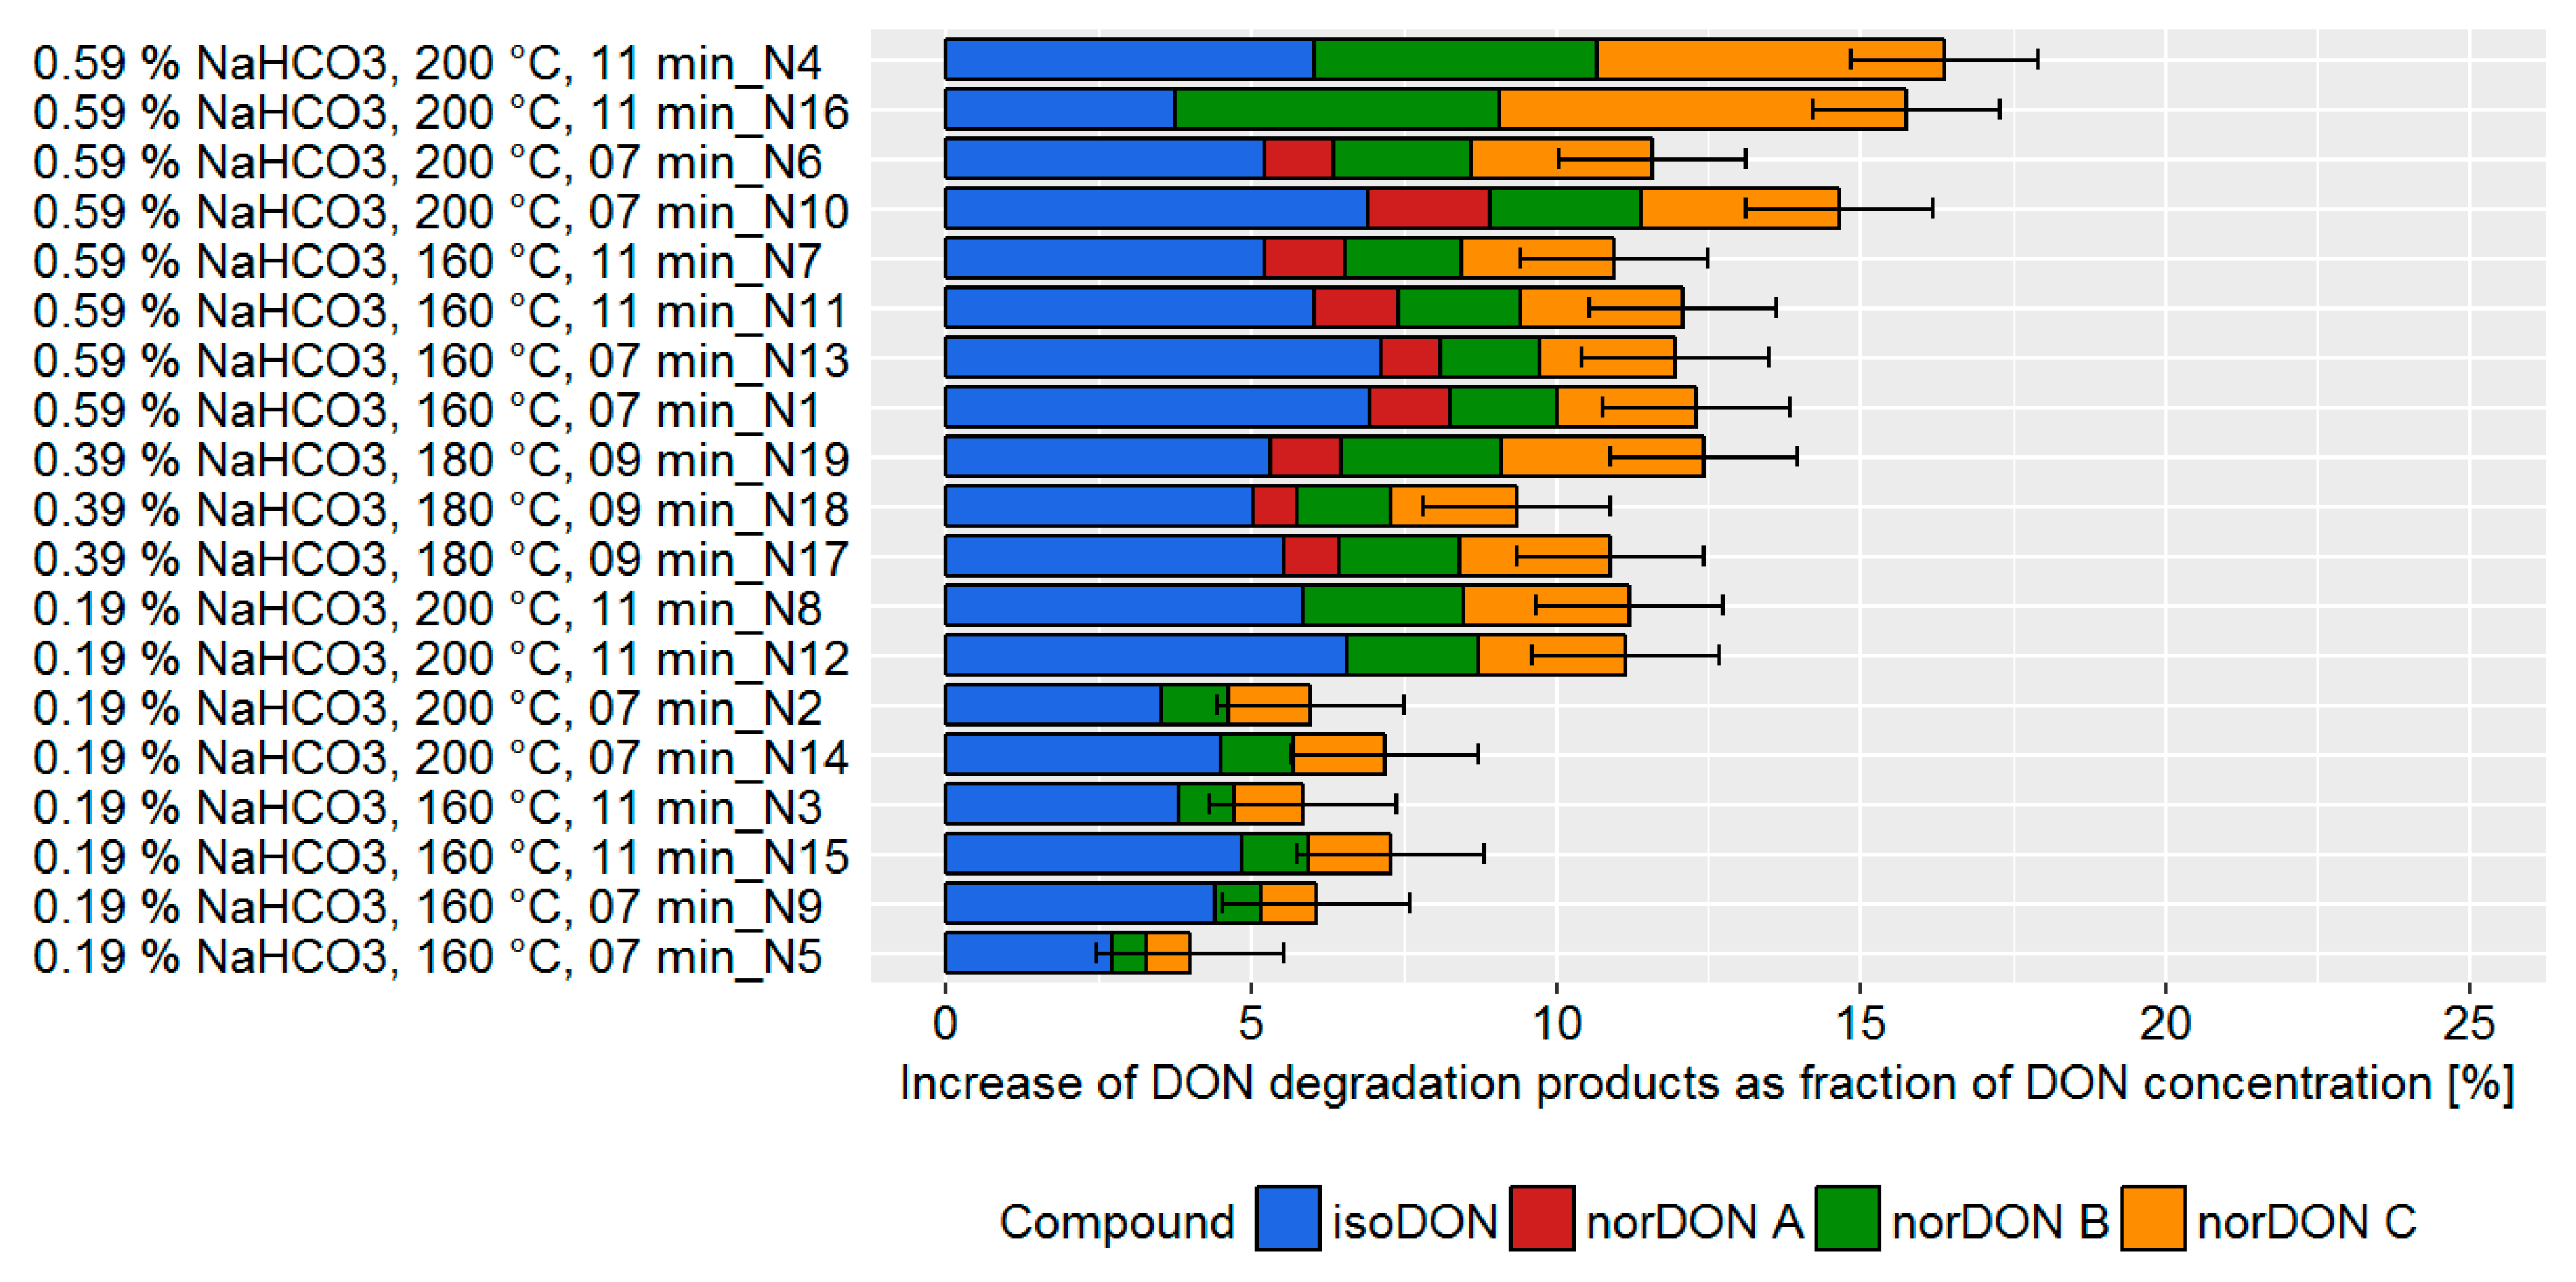
Table S1). Due to the different production conditions, DON degradation varied between 4–16% (
Figure 2).
A higher DON degradation was observed in batches with a higher concentration of NaHCO
3, baking temperature, and baking time. The variation of the processing parameter also led to a changed ratio of the degradation products with the main degradation products being norDON B and C, instead of isoDON, for experiments with a higher baking temperature and baking time. norDON A, which was not found to be a degradation product in our previous study [
6], was found only at processing conditions that lead to higher DON degradation.
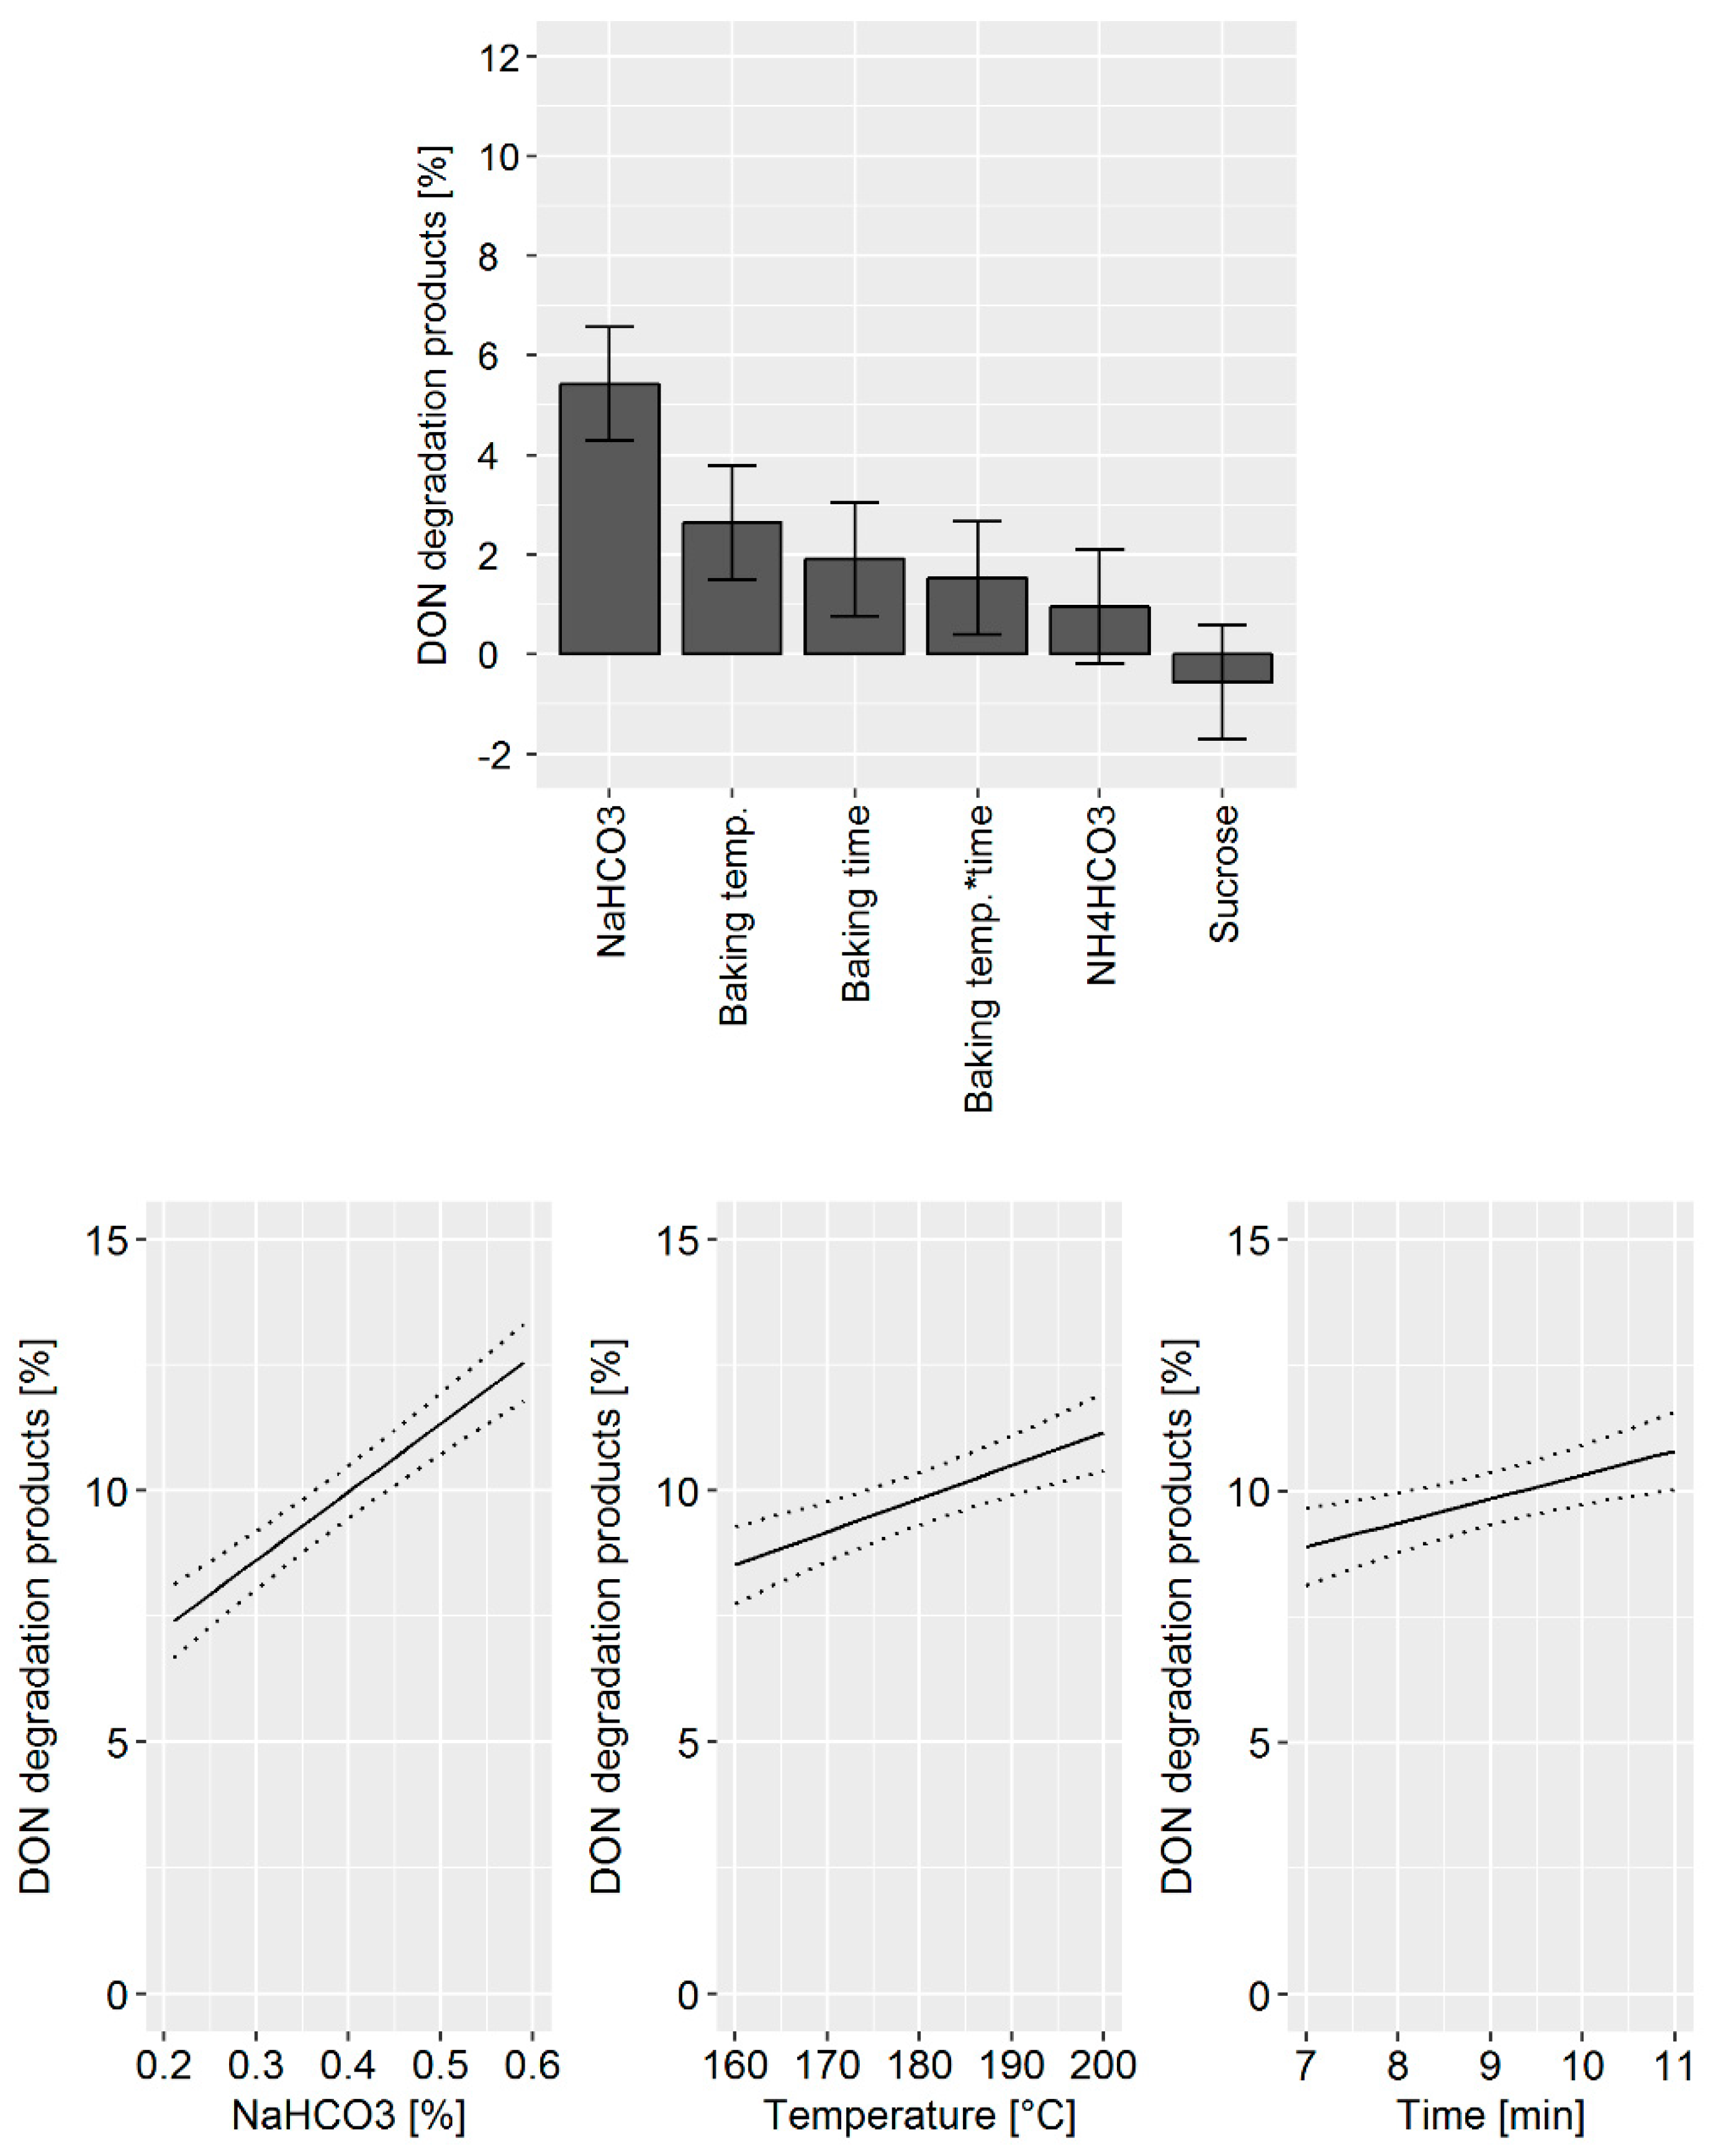
The DoE model confirmed that the main factors affecting DON degradation were: (i) The quantity of NaHCO
3 used, (ii) the baking temperature, and (iii) the baking time (
Figure 3, top). In addition, the statistical model indicates that a synergistic effect of baking temperature and time exists. Changes in NH
4HCO
3 and sucrose concentration did not significantly influence DON degradation products. The prediction model for the influence of the processing parameter on DON degradation revealed that by increasing the NaHCO
3 concentration from 0.2 to 0.6%, DON degradation is increased by 5% (
Figure 3, bottom). An increase in baking temperature and time is predicted to enhance DON degradation by about 2%.
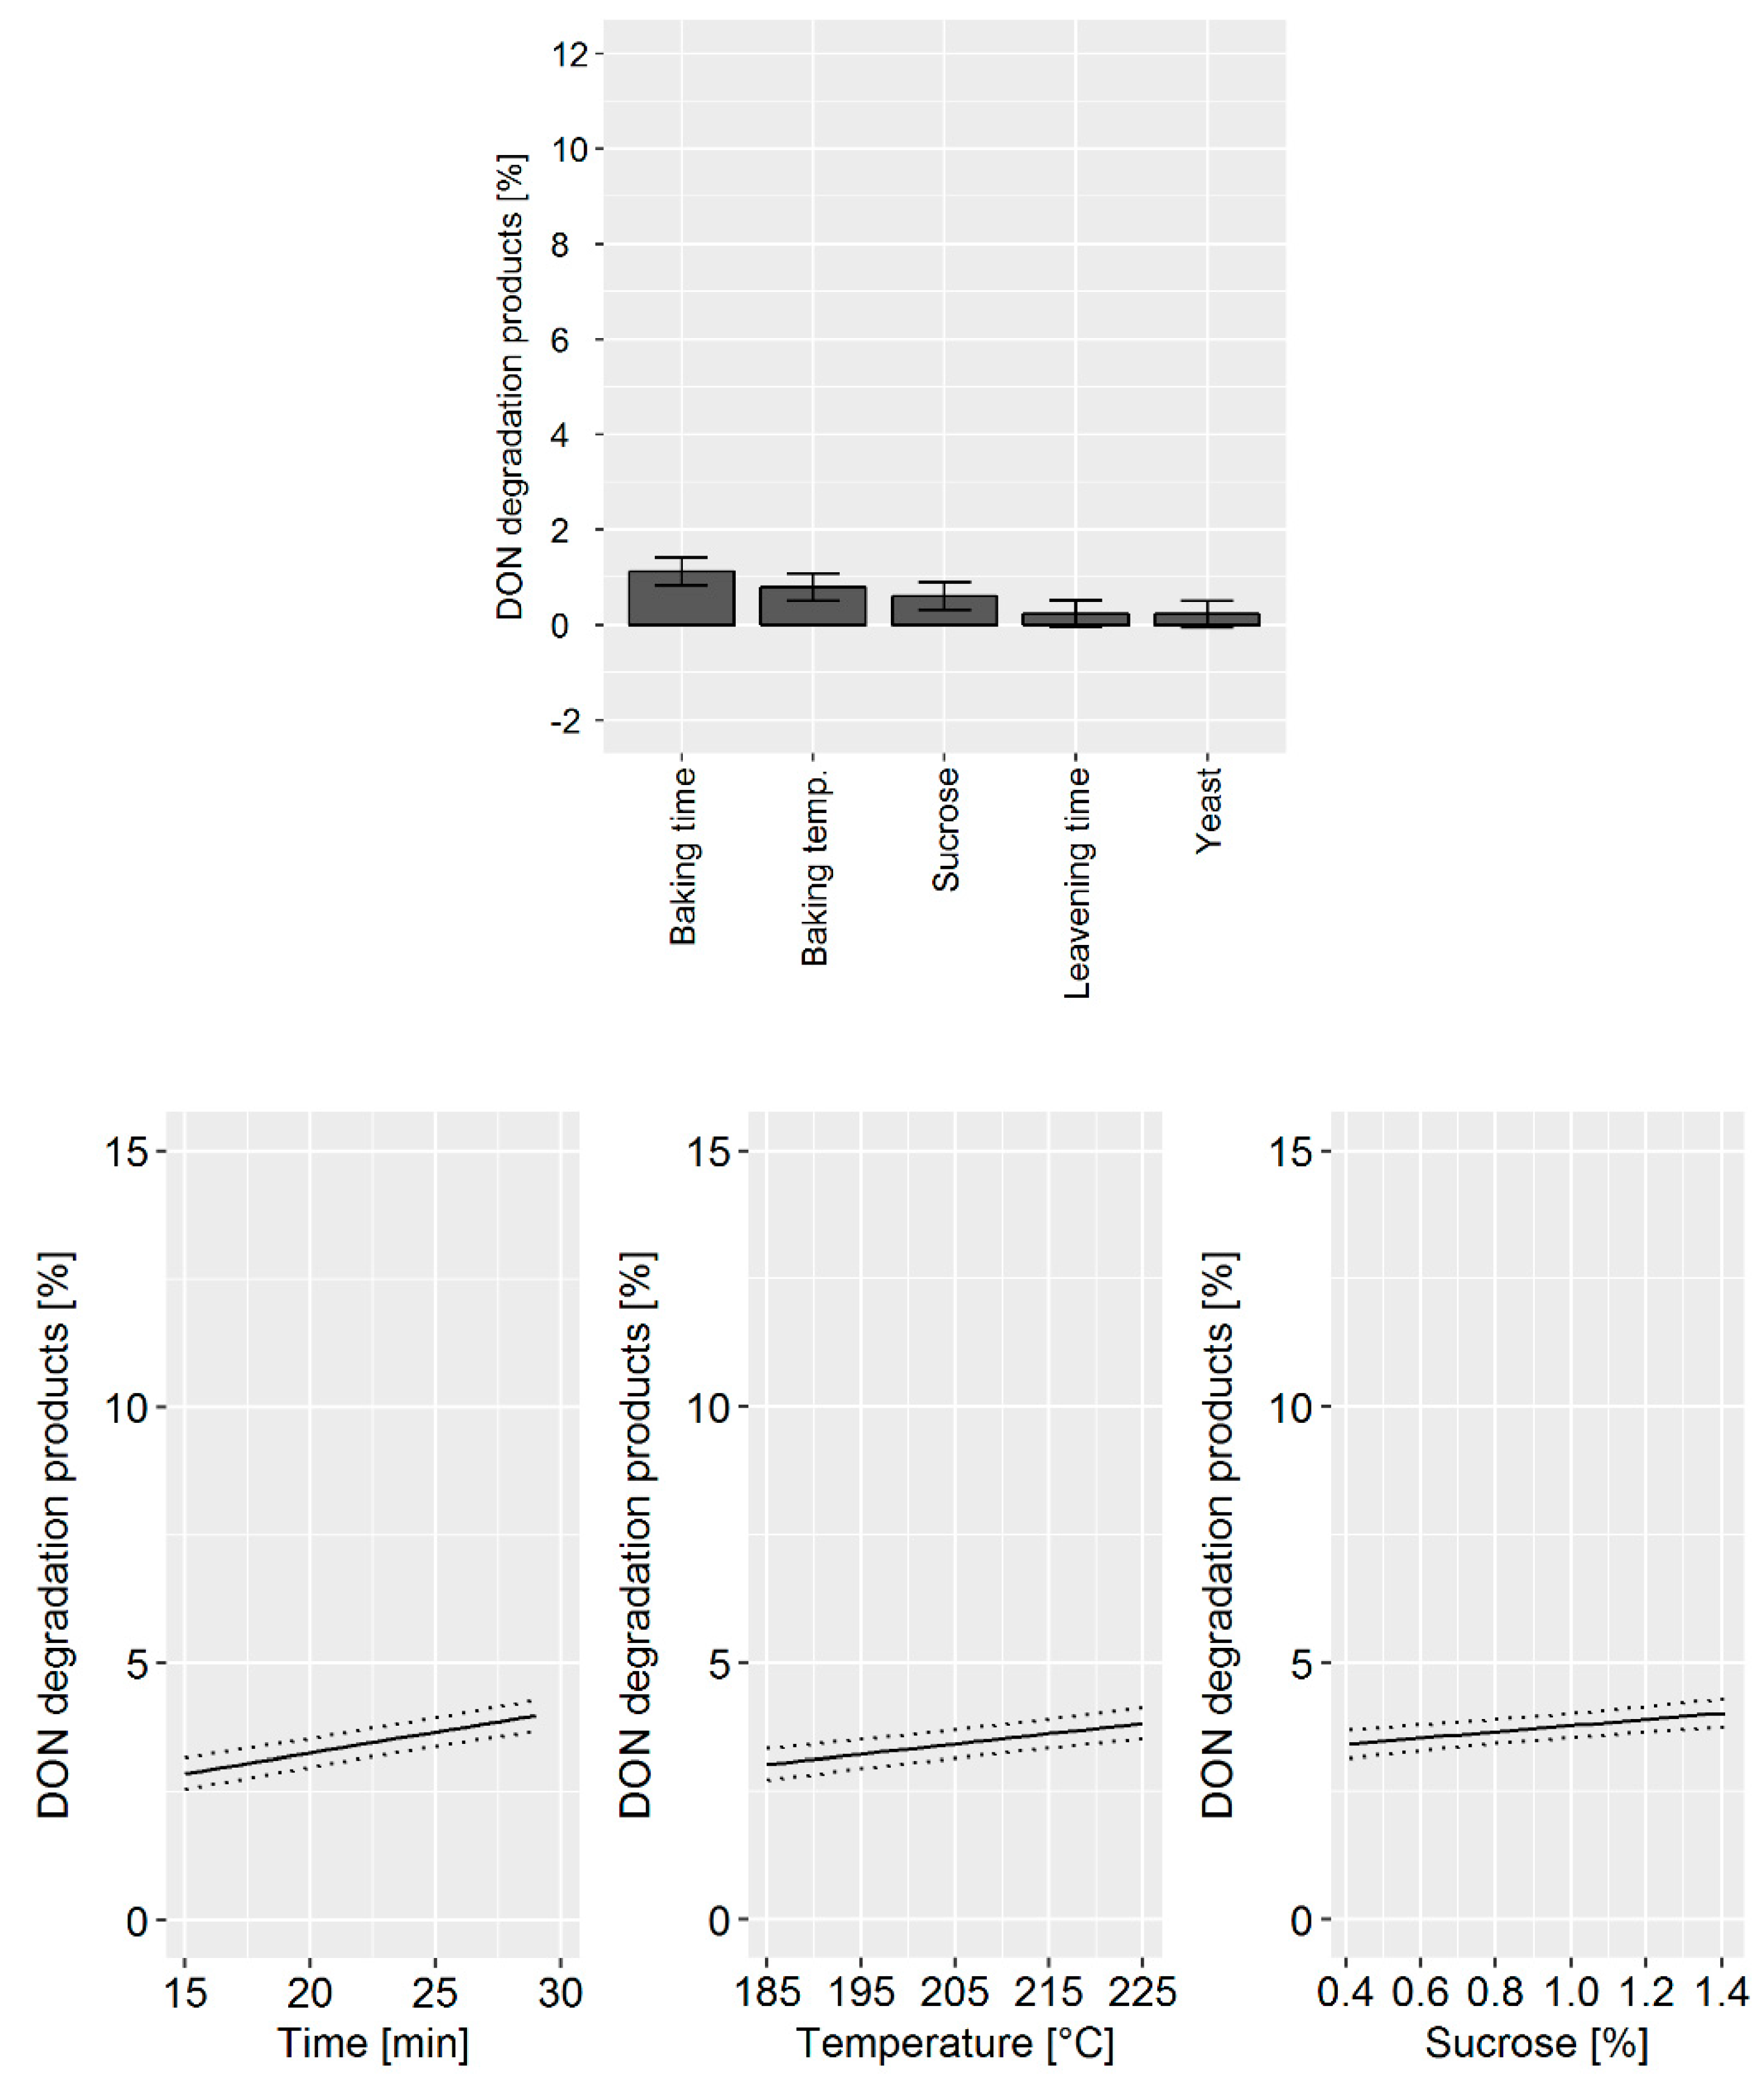
2.1.2. Bread
Bread is surely the most representative and most studied commodity of soft bakery products. Its production workflow implies dough fermentation before baking. Both fermentation and subsequent baking can be managed for time and temperature. The fermentation phase can also be modulated for relative humidity conditions, yeast, bakery improvers, raising agents, and pH. As a consequence, the number of factors to investigate for assessing potential DON mitigation effects was quite high. Therefore, in comparison to biscuits and crackers, more pilot plant trials had to be carried out. Based on literature data and our experience, the following variables were taken into account for the DoE approach: Baking temperature, baking time, leavening time, yeast, sucrose, and cider vinegar concentration. Each factor was varied within a range defined according to technological feasibility (
Table S4). Depending on the processing parameter, DON degradation varied from 2–5% (
Figure 4).
During the bread production, the achievable DON degradation was found to be low compared to the biscuit and cracker production. Although the influence was small, we found that the baking time and temperature as well as the sucrose concentration impacted the DON concentrations. The DoE model confirmed that the main factors influencing DON degradation were: (i) Baking time, (ii) baking temperature, and (iii) sucrose concentration (
Figure 5, top). Changes in cider vinegar and yeast concentration as well as the leavening time did not influence DON degradation. The prediction model confirmed that changes in the processing parameter have only a minor effect of approximately 2% on DON degradation (
Figure 5, bottom).
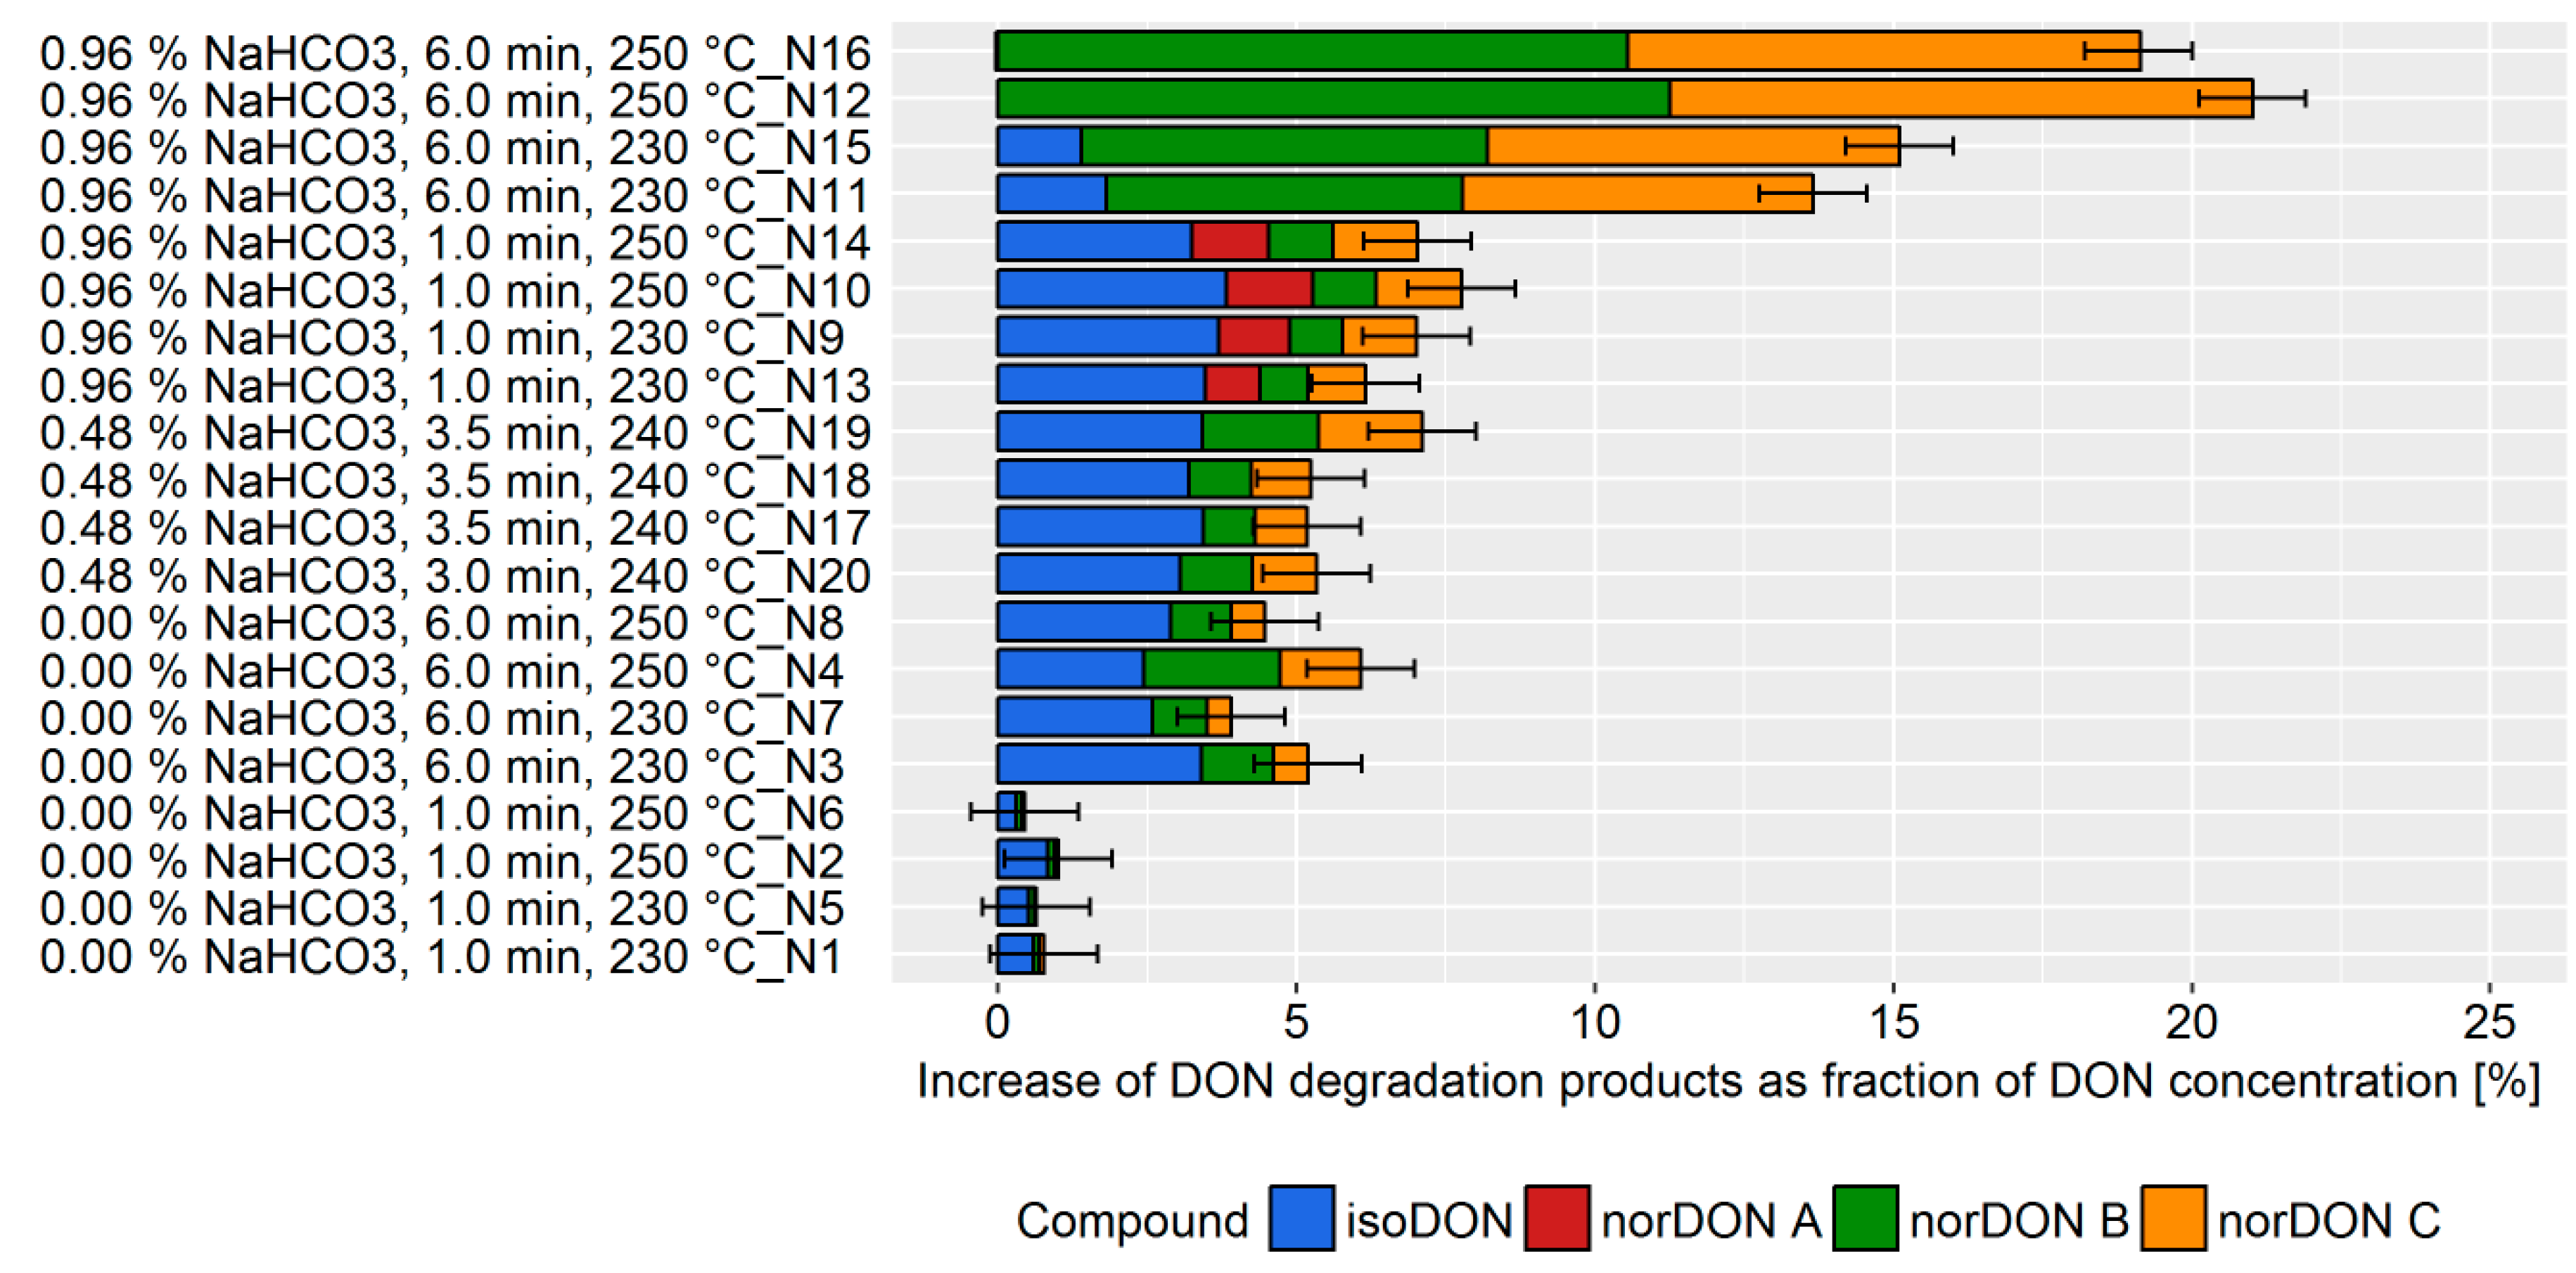
2.1.3. Crackers
Crackers were chosen as being representative of a complex baking commodity involving different technological aspects and combining several factors which were demonstrated to affect DON mitigation in the previous experiments carried out on biscuits and bread. Among the cracker making parameters, the following conditions were considered as factors in the experimental design: Baking time, baking temperature, acidic mother content, and NaHCO
3 concentration. For this trial, each factor was varied within a range defined according to technological feasibility (
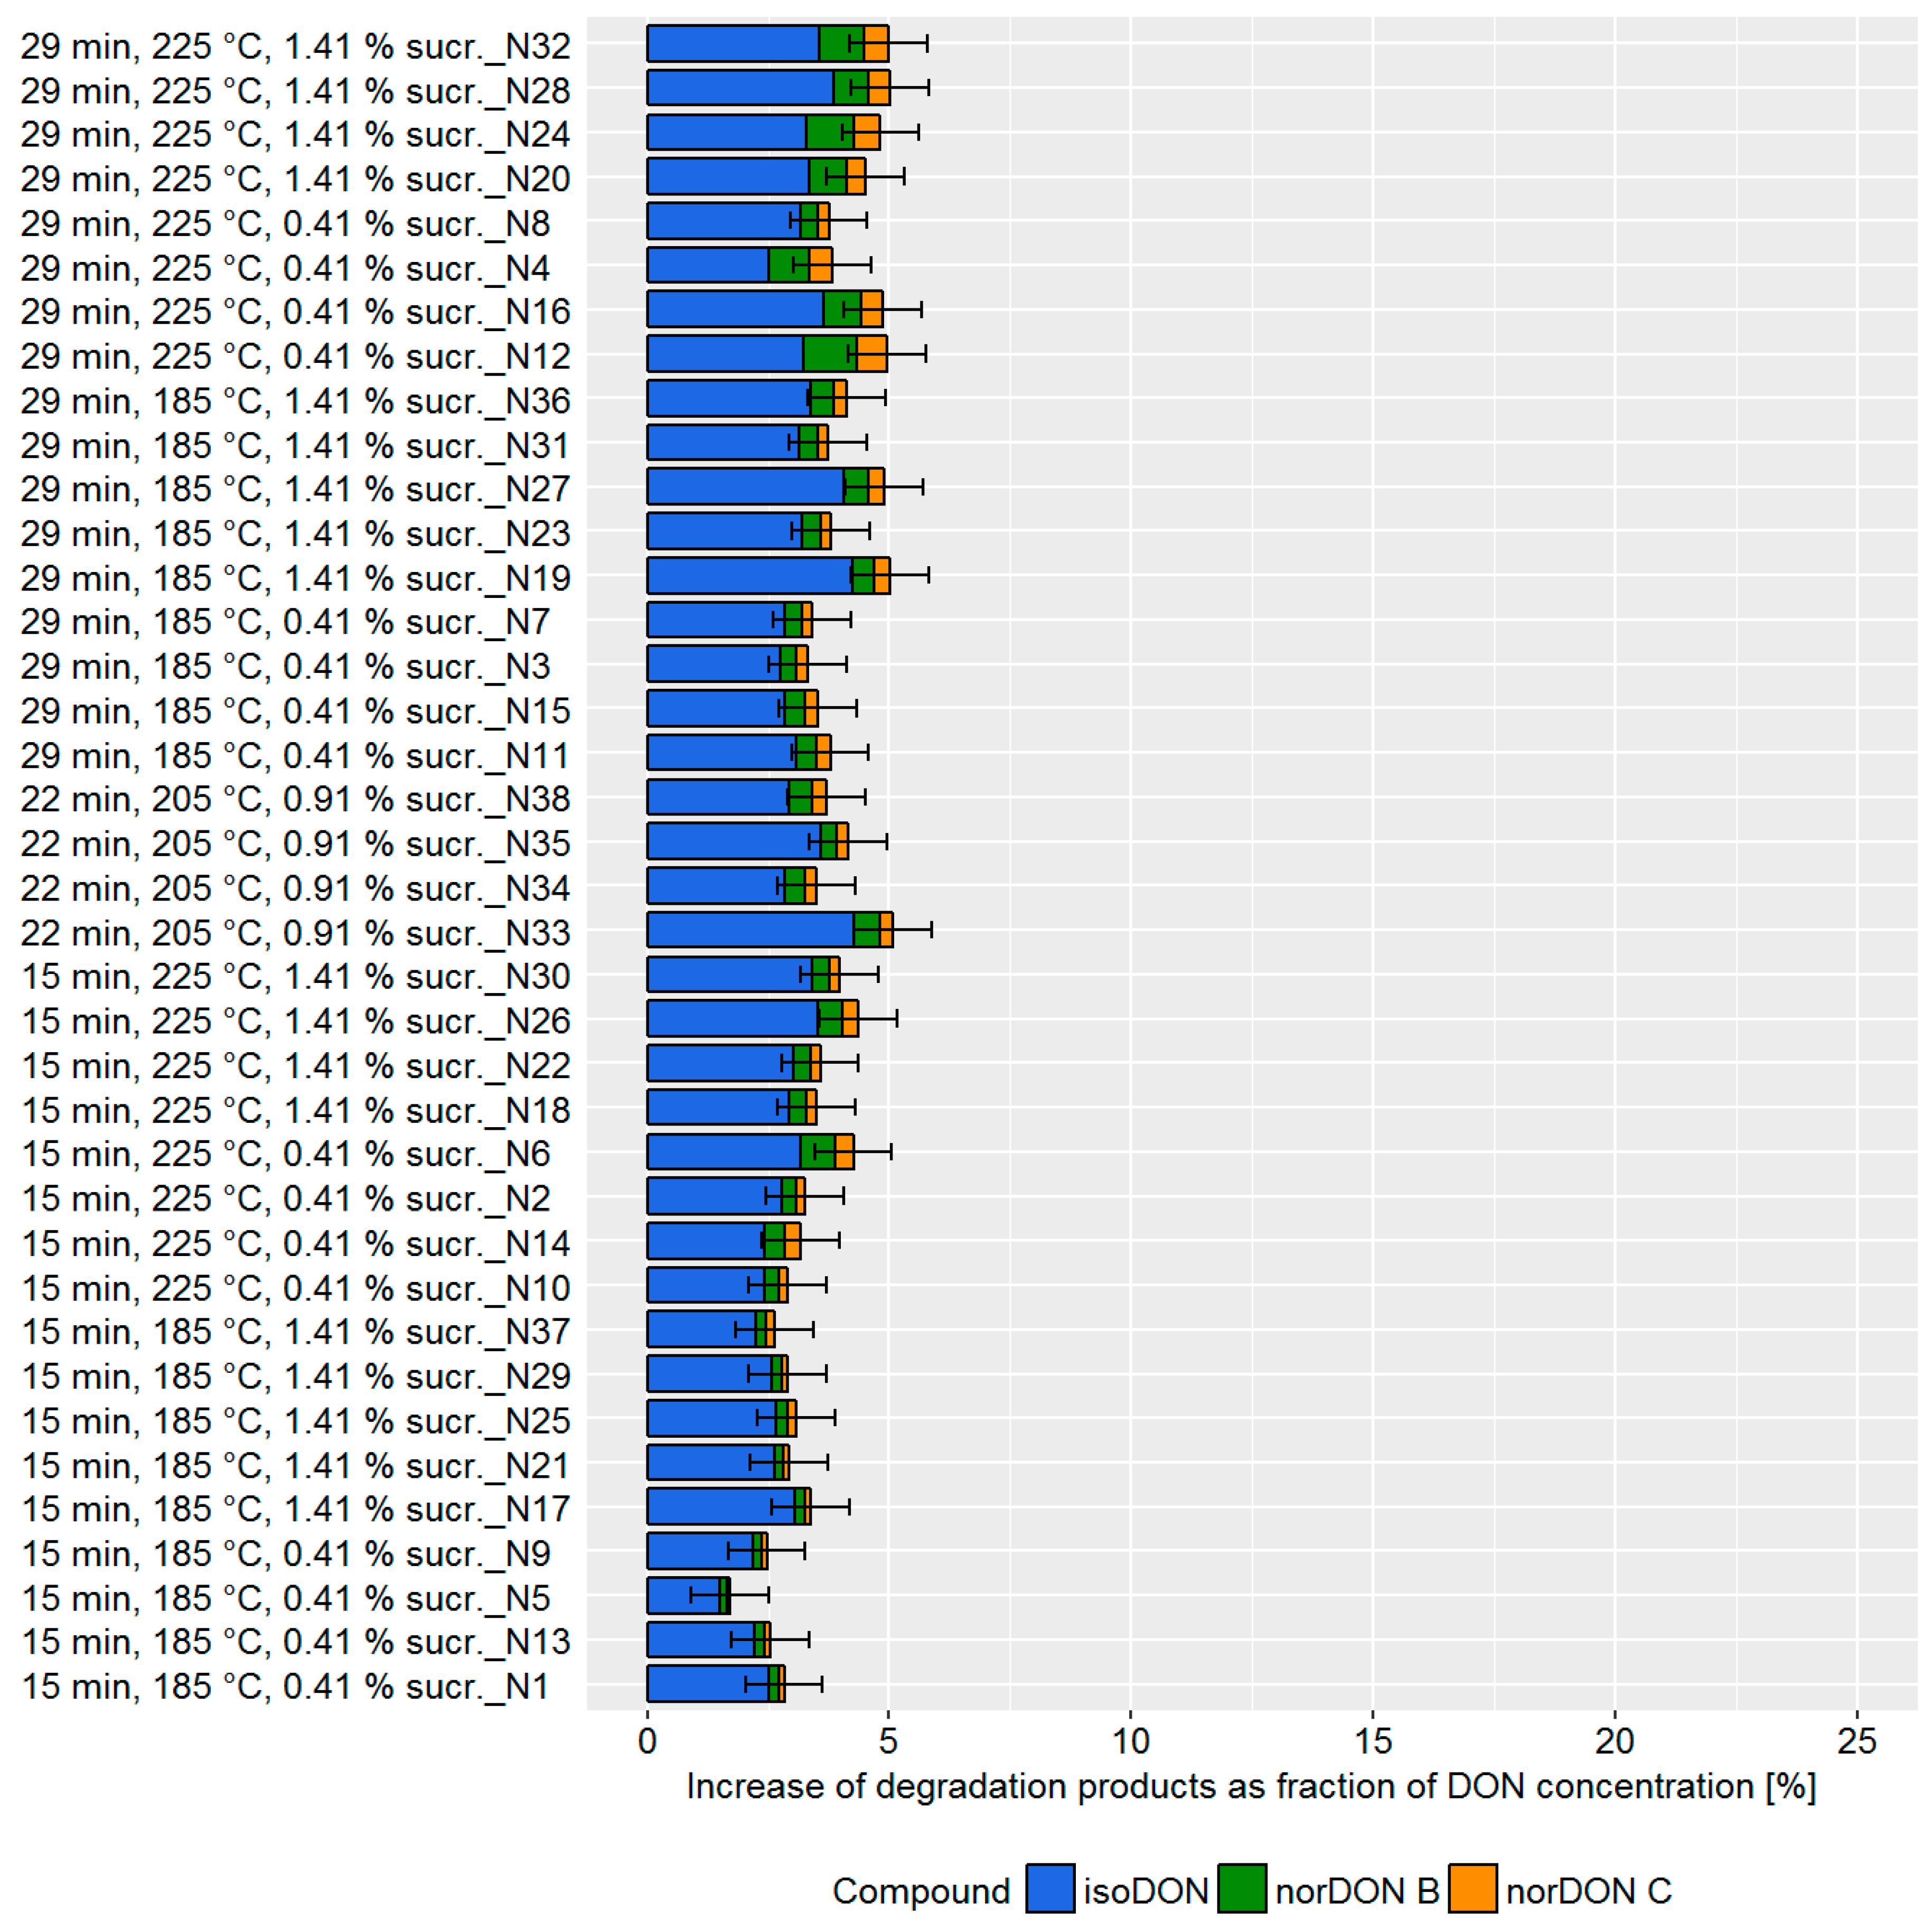
Table S7). During the cracker production, the DON degradation varied from 0–21%, depending on the choice of processing parameters (
Figure 6).
A high DON degradation was observed in experiments with a high NaHCO
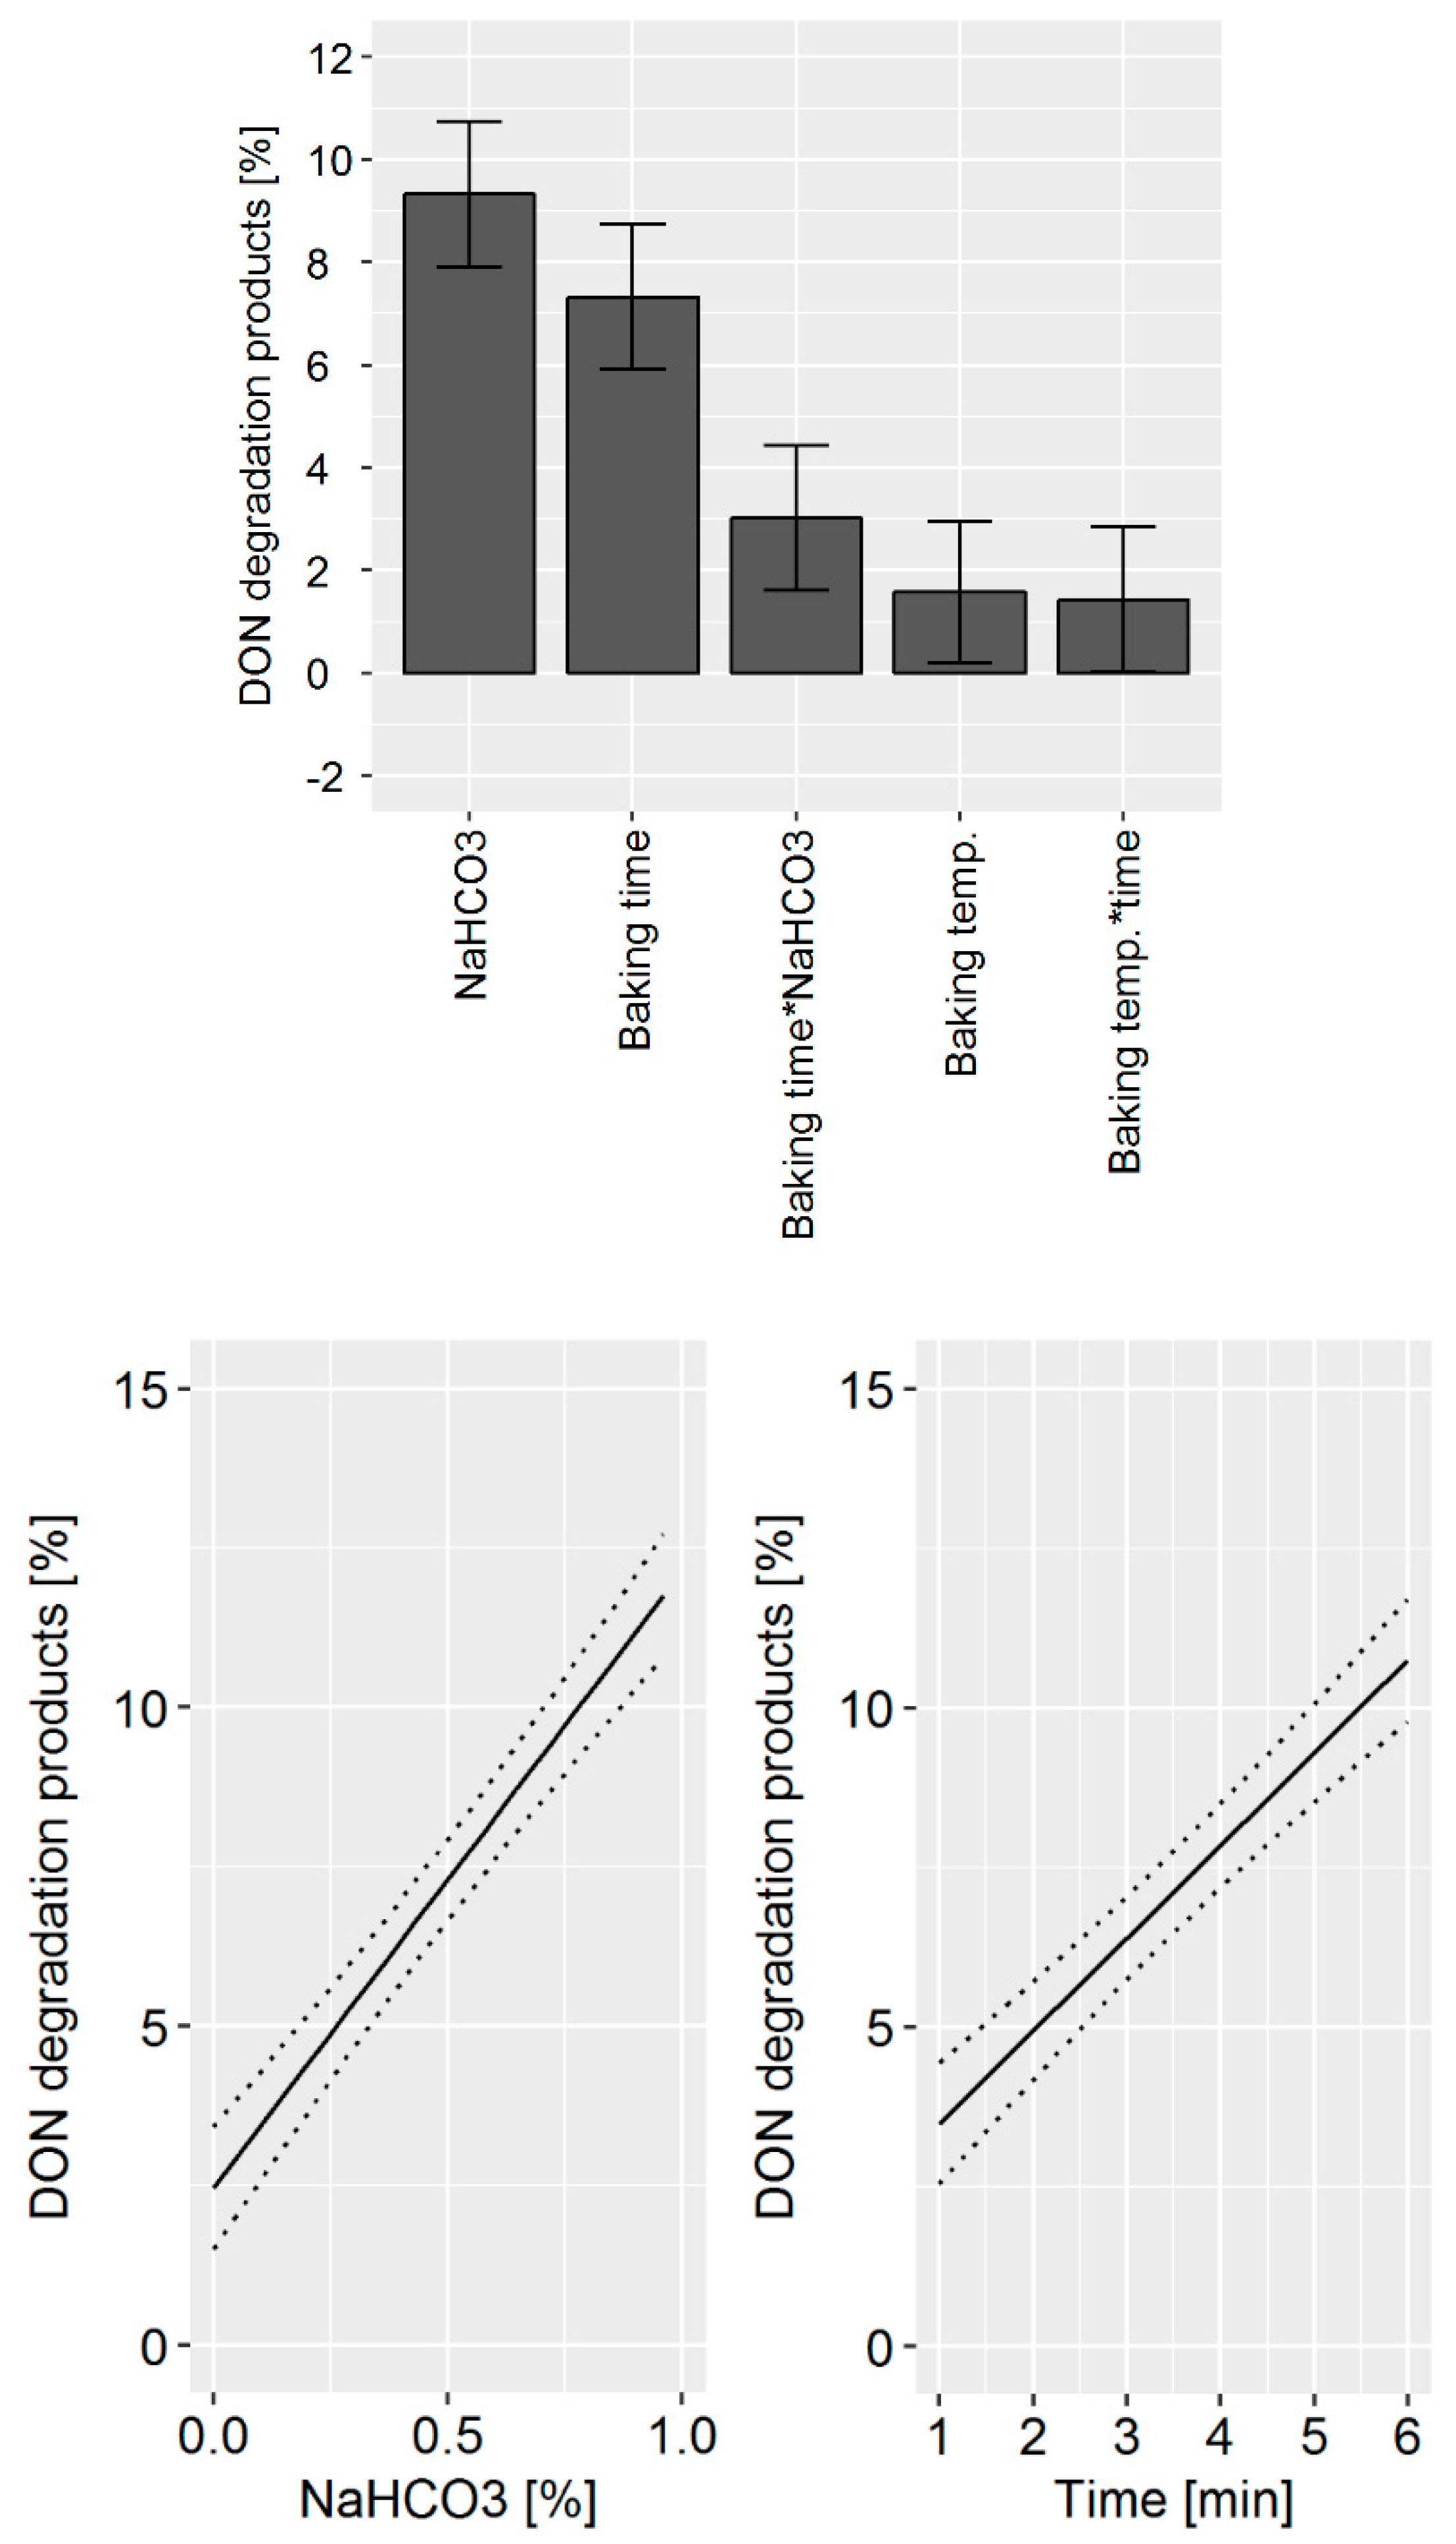
3 concentration, baking time, and baking temperature. Similar to the biscuit production, the variation of the processing parameter caused a change in the ratio of the degradation products. The DoE model revealed that NaHCO
3 concentration and baking time were the main factors affecting DON degradation (
Figure 7, top). In addition, the statistical model indicated that a synergistic effect of baking time and NaHCO
3 concentration exists. The acidic mother concentration, leavening time, and baking temperature did not affect DON degradation. The prediction model revealed the potential DON reduction that can be achieved by process management (
Figure 7, bottom). An increase of the NaHCO
3 concentration from 0 to 1% is predicted to increase DON degradation by 10%. Similarly, the increase of baking time from 1 to 6 min is predicted to increase DON degradation by 10%.
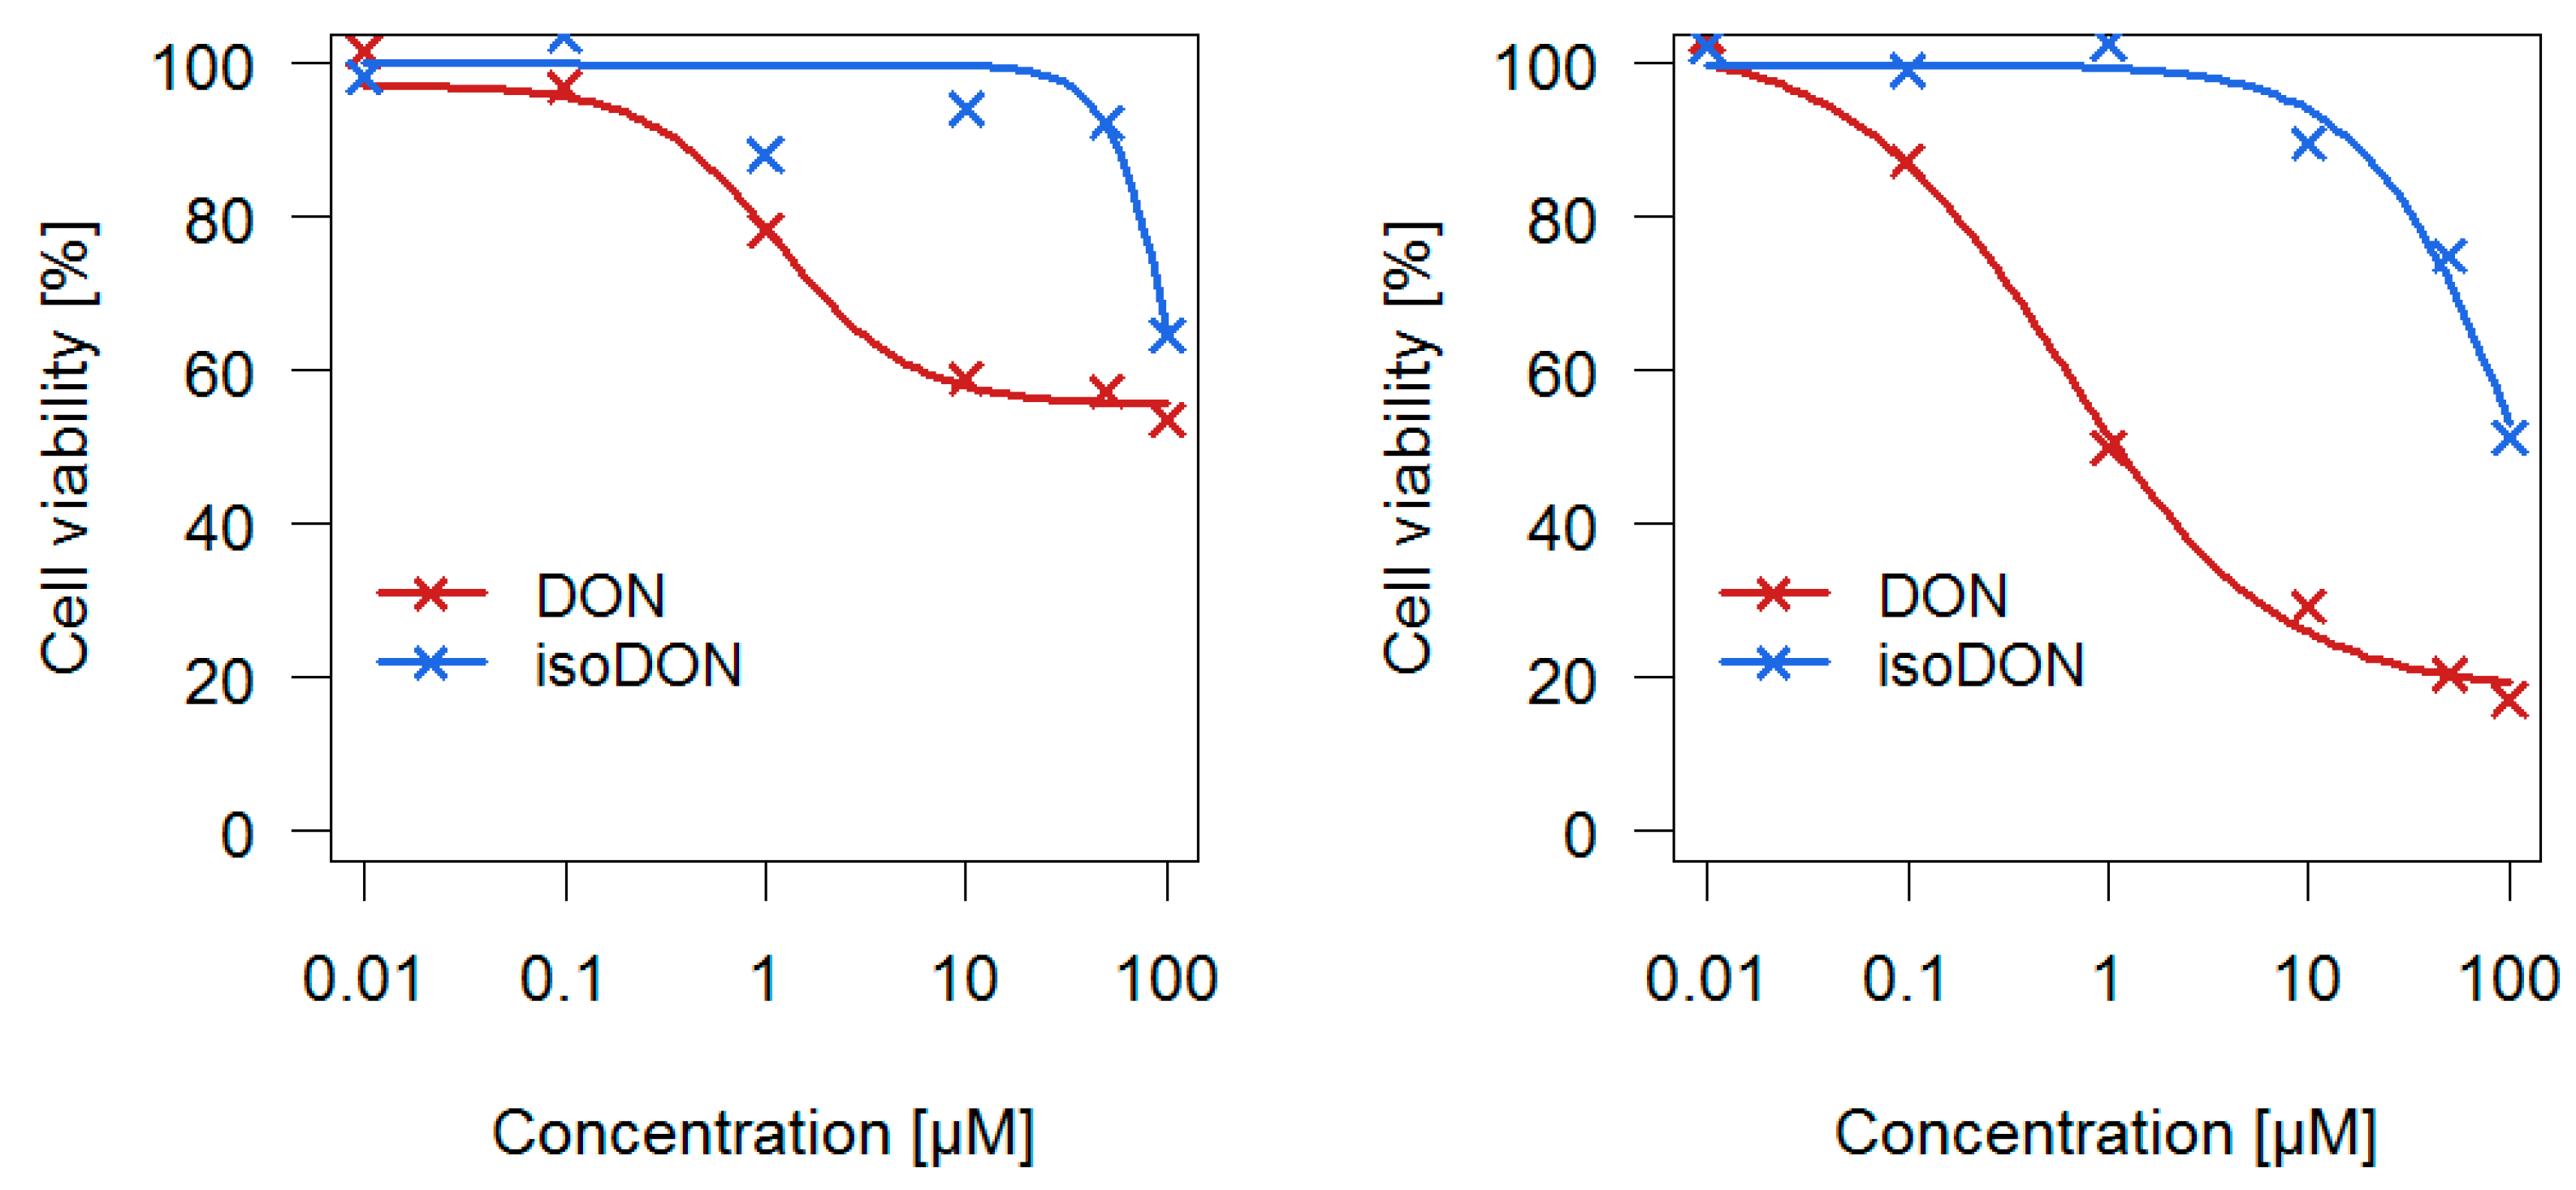
2.2. Cytotoxic Effects of isoDON
The cytotoxic potential of isoDON in direct comparison to DON was evaluated in two different human colon cell lines (
Figure 8).
Usually, the half maximal inhibitory concentration (IC50) is used to compare the potency of two substances. As the highest tested isoDON concentrations did not reduce cell viability by 50% under all tested conditions, IC30 values where cell viability was reduced by 30% were used instead. For the human colorectal adenocarcinoma cell line HT-29 the following IC30 values were determined: 1.9 µM (DON) and 91 µM (isoDON), whereas for the non-tumorigenic human colon epithelial cells (HCEC) the following IC30 values were identified: 0.4 µM (DON) and 53 µM (isoDON). In both cell viability assays, isoDON was much less potent (factor 48 and 133 for HT-29 and HCEC, respectively) in reducing cellular viability compared to DON.
4. Conclusions
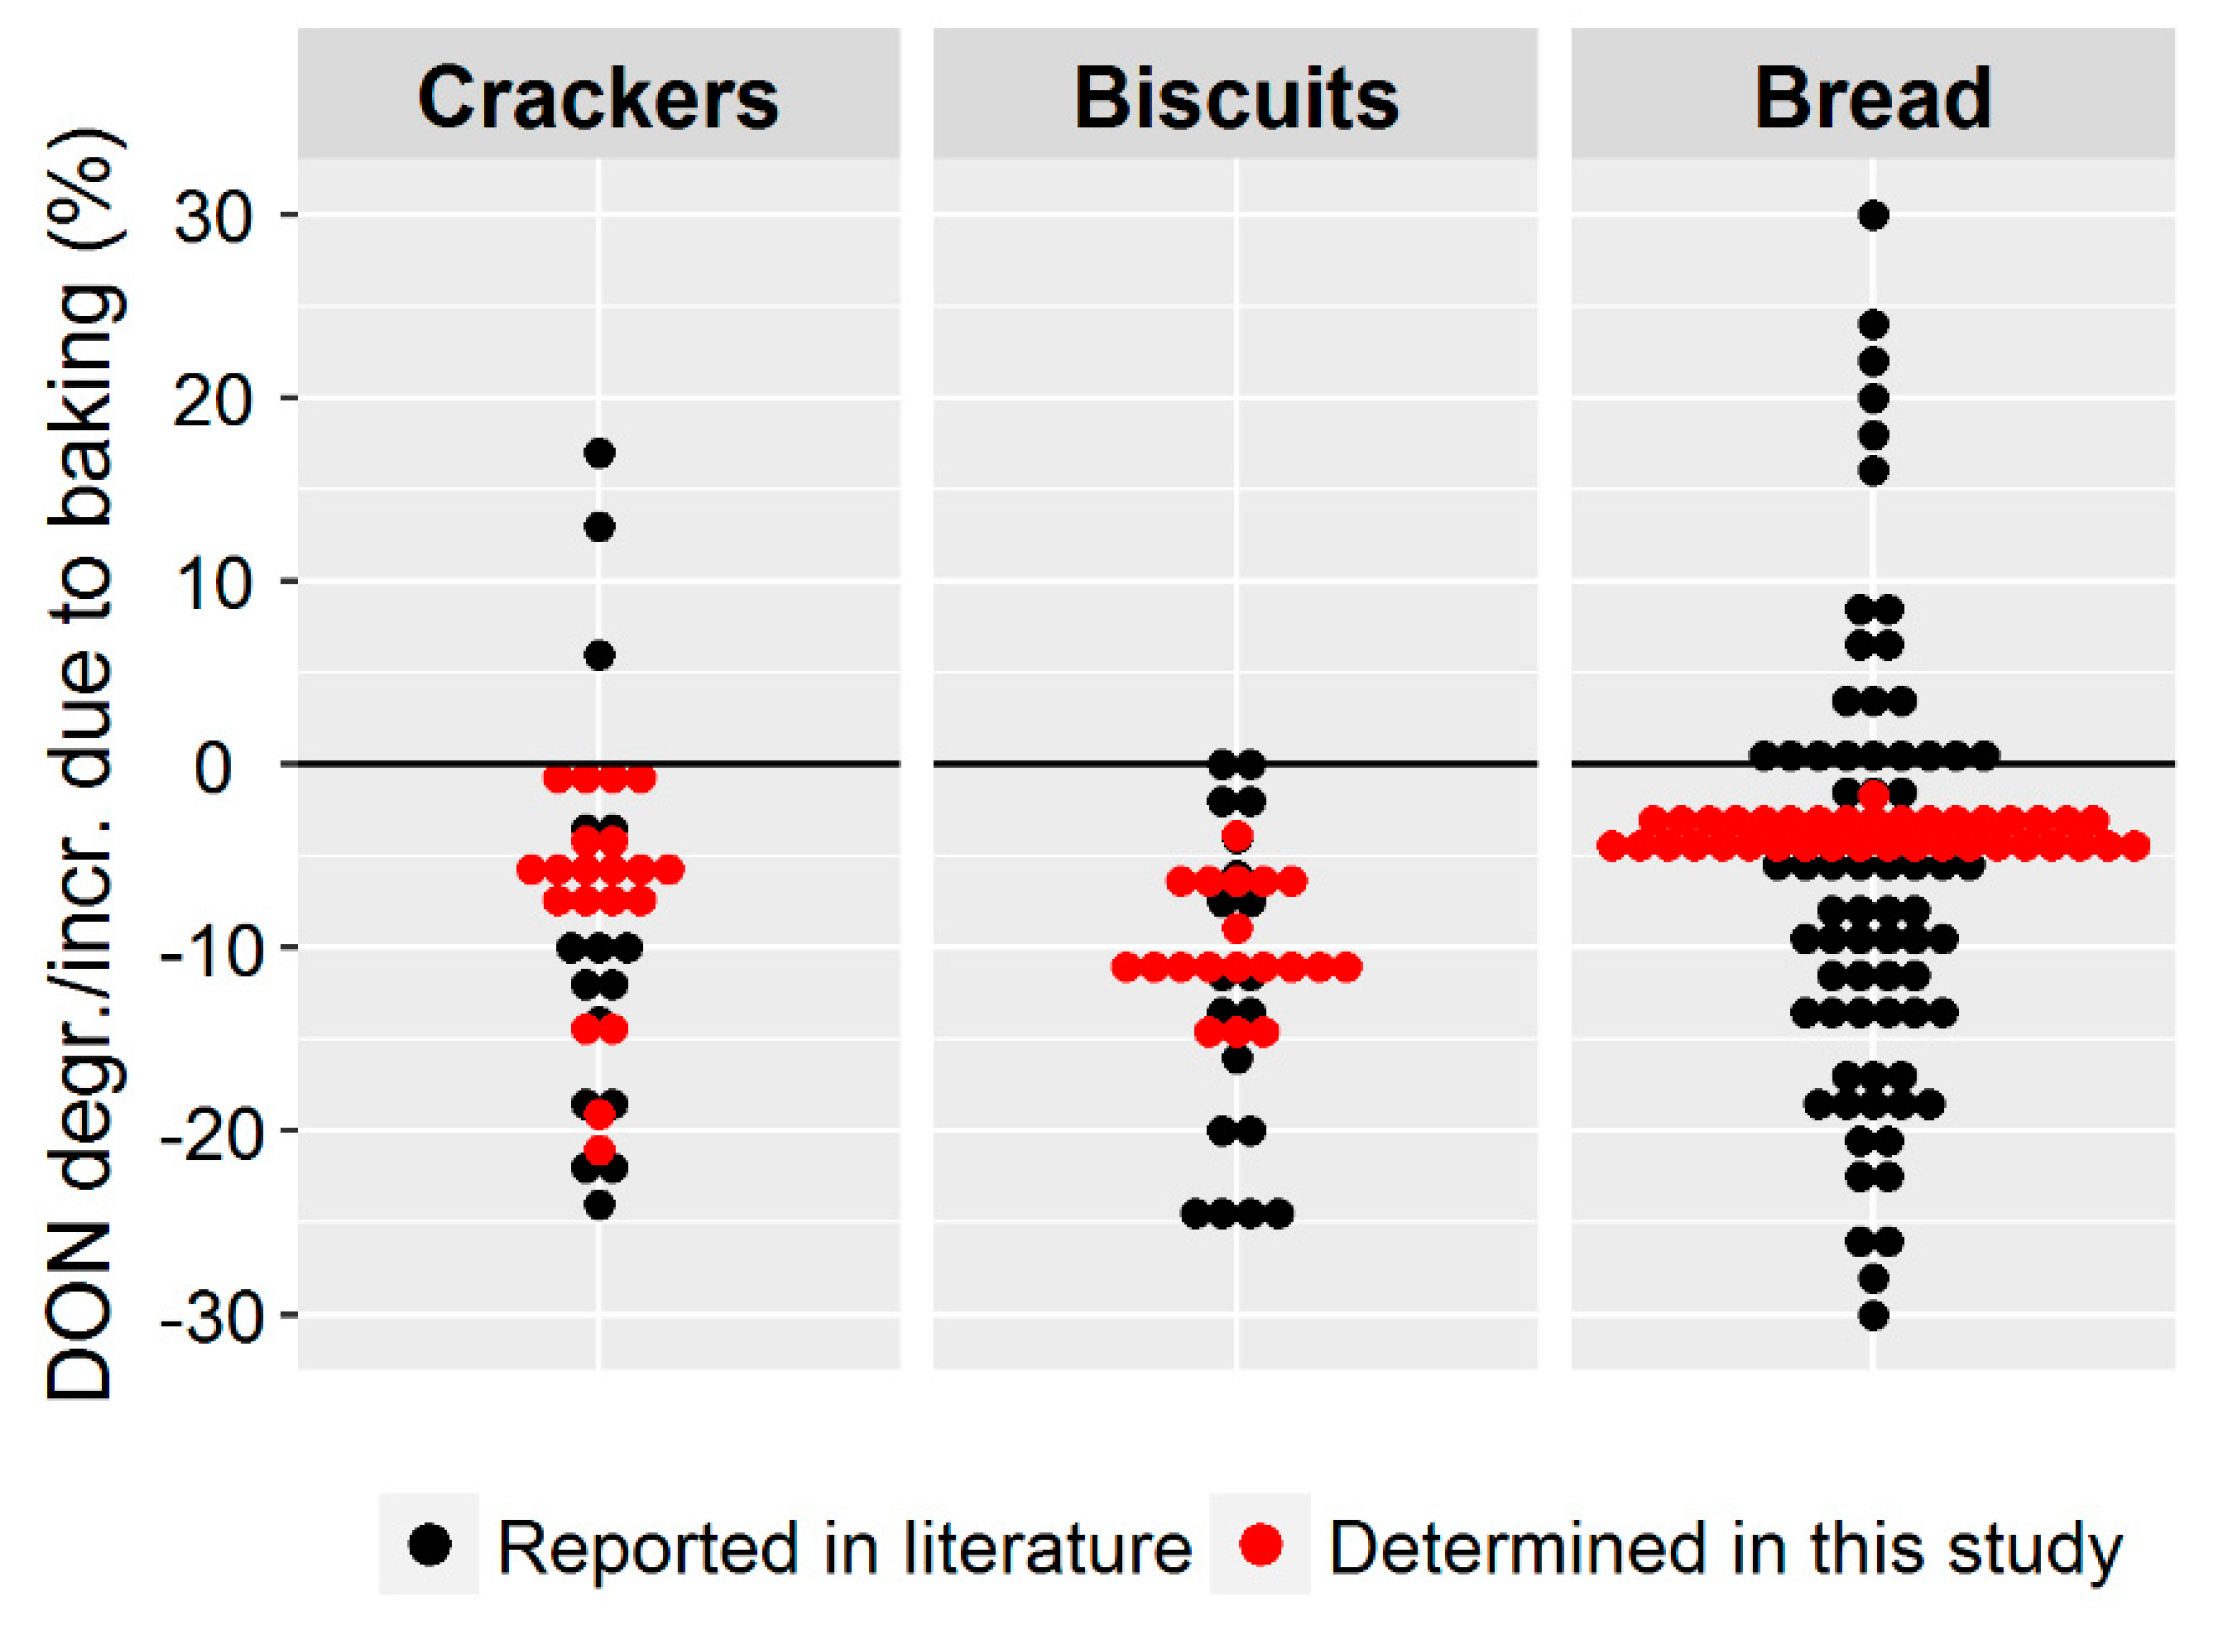
Depending on the processing conditions, 0–21%, 4–16%, and 2–5% of DON were degraded during the production of crackers, biscuits, and bread, respectively. For biscuits and crackers, DON degradation can be increased by 10–20% by process management. For bread, process management can lead to a minor increase in DON degradation of about 3%. DON degradation was enhanced by a high NaHCO3 concentration, baking time, and temperature. The processing parameters NH4HCO3, yeast, cider vinegar, acidic mother content, and sucrose concentration as well as leavening time did not influence DON concentration.
To put our findings in context to the results reported in recent literature, a graphical summary is presented in
Figure 10.
Compared to previous studies found in the literature, we achieved a much narrower range of DON degradation, which was most pronounced for bread. The reason for that is most likely that we applied the currently most accurate analytical methodology to determine DON degradation [
6].
To gain further knowledge about the toxicity of DON degradation products, the cytotoxicity of isoDON was evaluated by performing in vitro cell viability assays. isoDON was found to be considerably less cytotoxic (factor 48 and 133 for HT-29 and HCEC cells, respectively) compared to DON. As all DON degradation products are considerably less cytotoxic than DON, we conclude that DON degradation during baking results in a lower toxicity. Thus, for the first time, we have presented proof that baking under real industrial conditions can lead to a partial detoxification of DON.
5. Materials and Methods
5.1. Chemicals and Reagents
Acetonitrile (ACN, gradient grade) was purchased from VWR International GmbH (Vienna, Austria). Acetic acid (LC–MS gradient grade) was obtained from Sigma Aldrich (Vienna, Austria). In all experiments, ultra-pure water (purified by a Purelab Ultra system ELGA LabWater, Celle, Germany) was used. Liquid calibrant solutions of DOM-1, DON-3-Glc, DON, and U-[
13C
15]-DON were supplied by Romer Labs GmbH (Tulln, Austria). Reference standards of the DON degradation products isoDON and norDONs A, B and C were synthesized according to published procedures [
5,
6,
21,
30].
5.2. Preparation of Bakery Products
The food commodities used in the present study were produced from naturally contaminated flour according to the procedure previously described by our group by applying a suitable scaling up factor of the starting ingredients that fits with the production under pilot plant facilities [
6].
Biscuits: The final dough (3000 g, 14% moisture content (MC)) was used to form the individual biscuits (approximately 11 g each) which consisted of 56 wt % flour, 40 wt % fat and sugar, and 4 wt % water.
Bread: The final dough (8000 g, 14% MC) was used to form the individual loafs of 450 g each (40% MC), that reached a final weight of 400 g and consisted of 65 wt % flour, yeast, oil, and salt and 35 wt % water after baking.
Crackers were shaped (approximately 10 g each) from the final dough (4127 g, 26% MC) and they consisted of 97 wt % flour, yeast, and malt extract and 3 wt % water.
5.3. Design of Experiment (DoE) Setup and Statistical Evaluation
Design of Experiments (DoE) was used to determine the influence of processing parameters on the degradation of DON and the increase of its degradation products during the baking of crackers, biscuits, and bread from naturally contaminated flour. The screening interaction model was chosen and processing parameters that we hypothesized to influence DON degradation were used as model quantitative factors.
Table 1 provides a list of the processing parameters that were investigated in our study. For more detailed information on the processing parameters used in the individual experiments, the reader is referred to
Tables S1, S4, and S7.
To focus the attention on the increase of DON degradation products during baking, multivariate data analysis was performed on the concentration (µg/kg) obtained by LC/MS-MS analysis in the finished products of the sum of DON degradation products. DoE set up and data elaboration were carried out by using MODDE software 11 (Umetrics, Umea, Sweden).
5.4. Analysis of the Samples
To determine DON degradation during the industrial baking process, the concentrations of DON and its degradation products (i.e., isoDON, norDON B, and norDON C) were analyzed in naturally contaminated flour and the products made thereof. Additionally, the concentration of the suspected DON degradation and conversion products DON-3-glucoside, DOM-1 and norDON A was monitored. Sample preparation and analysis are discussed in detail elsewhere [
6]. In brief, 5.00 ± 0.01 g of ground and homogenized sample was extracted with 20.0 mL of ACN:H
2O, 84:16,
v:
v. A total of 200 µL of sample extract were dried down and reconstituted in 100 µL of water. Subsequently, the concentrated sample extracts were centrifuged at 10 °C and 4500 rpm for 10 min. Four µL aliquots of the concentrated sample extract were injected together with 0.4 µL of internal standard into the HPLC system. Each sample was worked-up once and injected in duplicate. The analytical method used for the analysis was based on LC-MS/MS and was validated for recovery, repeatability, LOD, and LOQ. All results were corrected for the recovery factor determined in the validation study [
6]. The concentration of the analytes that was found in naturally contaminated flour and in the finished bakery products can be found in
Table S2 and S3 (biscuits),
Table S5 and S6 (bread), and
Table S8 and S9 (crackers) of the
Supplementary Material, respectively.
5.5. Calculation of the DON Degradation
The sum of the DON degradation products was shown to be a much more accurate measure of the DON degradation than the change of the DON content itself [
6]. Therefore, the DON degradation was calculated based on the increase of its degradation products isoDON and norDONs A–C. As the flour used for the production of the bakery products was naturally contaminated with the degradation products at different concentration levels, the increase of the degradation products was calculated separately before being summed up to obtain the final DON degradation.
5.6. Calculation of the Increase of the DON Degradation Products Due to Baking
For the production of bakery products from naturally contaminated flour, the increase of the degradation products was calculated according to:
First, the dilution factor, which describes the mass ratio of naturally contaminated flour present in the finished bakery product, was determined. The dilution factor was 0.97 (crackers), 0.56 (biscuits), and 0.65 (bread), respectively. Second, the theoretical molal concentration b (mol/kg) of the analyte resulting from the dilution of the flour by the addition of other ingredients () was determined. Finally, the molal concentration of an analyte resulting from the natural contamination of the flour was subtracted from the molal concentration of the analyte in the bakery product () and expressed as a fraction of the molal concentration of DON resulting from the natural contamination of the flour. The result was the fraction of DON that is converted to DON degradation products during the production of bakery products.
5.7. Estimation of the Process Standard Deviation
In each DoE, three center points were set, which means that three experiments were carried out under identical processing conditions: Experiment number 17, 18 and 19 (crackers), 17, 18 and 19 (biscuits) and 33, 34, 35 (bread), respectively. The process standard deviation was calculated for the sum of the change of the degradation products of the three replicates which were produced using the same processing parameter. The process standard deviation was 0.9%, 1.4%, and 0.8% for crackers, biscuits, and bread, respectively, and thus considerably higher than the analytical standard deviation for the determination of the sum of the DON degradation products which was in the range of 0.2–0.4% [
6].
5.8. Human Cell Culture
Human colorectal adenocarcinoma cells, HT-29, were purchased from the German Collection of Microorganisms and Cell Cultures (DSMZ, Braunschweig, Germany). For cell culture Dulbecco’s Modified Eagle’s Medium (DMEM) supplemented with 10% (
v/
v) heat inactivated fetal calf serum and 50 U/mL penicillin and 50 µg/mL streptomycin was used. The non-tumorigenic human colon epithelial cell line, HCEC [
31], was kindly provided by Prof. Jerry W. Shay (UT Southwestern Medical Center, Dallas, TX, USA). HCEC cells were cultivated in DMEM (high glucose) supplemented with 2% (
v/
v) Medium 199 (10×), 2% (
v/
v) cosmic calf serum, 20 mM 4-(2-hydroxyethyl)-1-piperazineethanesulfonic acid (HEPES), 50 µg/mL gentamicin, insulin-transferrin-selenium-G (10 µg/mL; 5.5 µg/mL; 6.7 µg/mL), recombinant human epidermal growth factor (18.66 ng/mL), and hydrocortisone (1 µg/mL). Both cell lines were cultivated in humidified incubators at 37 °C and 5% CO
2. Media, supplements, and further material for cell culture were purchased from GIBCO Invitrogen (Karlsruhe, Germany), Lonza Group Ltd. (Basel, Switzerland), Sigma-Aldrich Chemie GmbH (Munich, Germany), Sarstedt AG & Co. (Nuembrecht, Germany), and Fisher Scientific GmbH (Vienna, Austria).
5.9. Cytotoxicity of isoDON
Per well, 1500 HCEC or 5500 HT-29 cells were seeded in a 200 μL culture medium in 96-well plates and allowed to grow for 48 h. Then, the culture medium was withdrawn and cells were treated with different concentrations of isoDON and DON in the respective cell culture medium for 24 h. As a solvent control, 1% water (LC–MS grade) was incubated and 1% (v/v) Triton X-100 served as a positive control. After the treatment period, the medium was withdrawn and cells were rinsed once with phosphate buffered saline (100 μL/well) and incubated with DMEM containing 10% (v/v) alamarBlue® reagent (Invitrogen™ Life Technologies, Karlsruhe, Germany) for 75 min. Subsequently, fluorescence intensity was measured (excitation: 530 nm; emission: 600 nm) on a Cytation 3 Imaging Multi Mode Reader (BioTek, Bad Friedrichshall, Germany). For quantification, blank-values were subtracted and measured data were referred to solvent control. Data are presented as a mean of at least five independent experiments, each performed in technical triplicates.

 ,
, 


