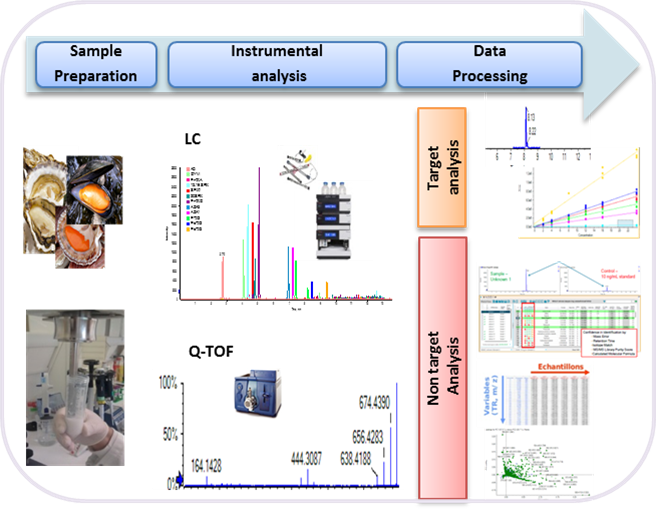
Extended Targeted and Non-Targeted Strategies for the Analysis of Marine Toxins in Mussels and Oysters by (LC-HRMS)

Abstract
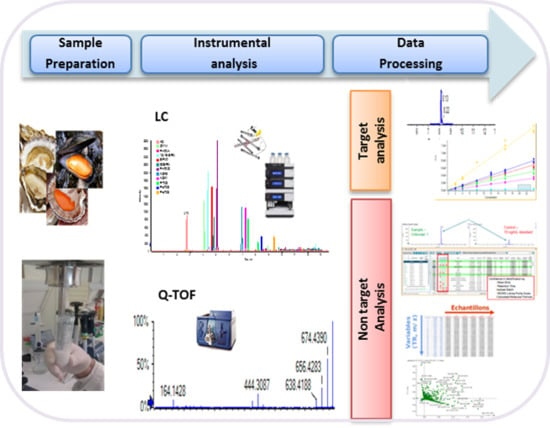
1. Introduction
2. Results
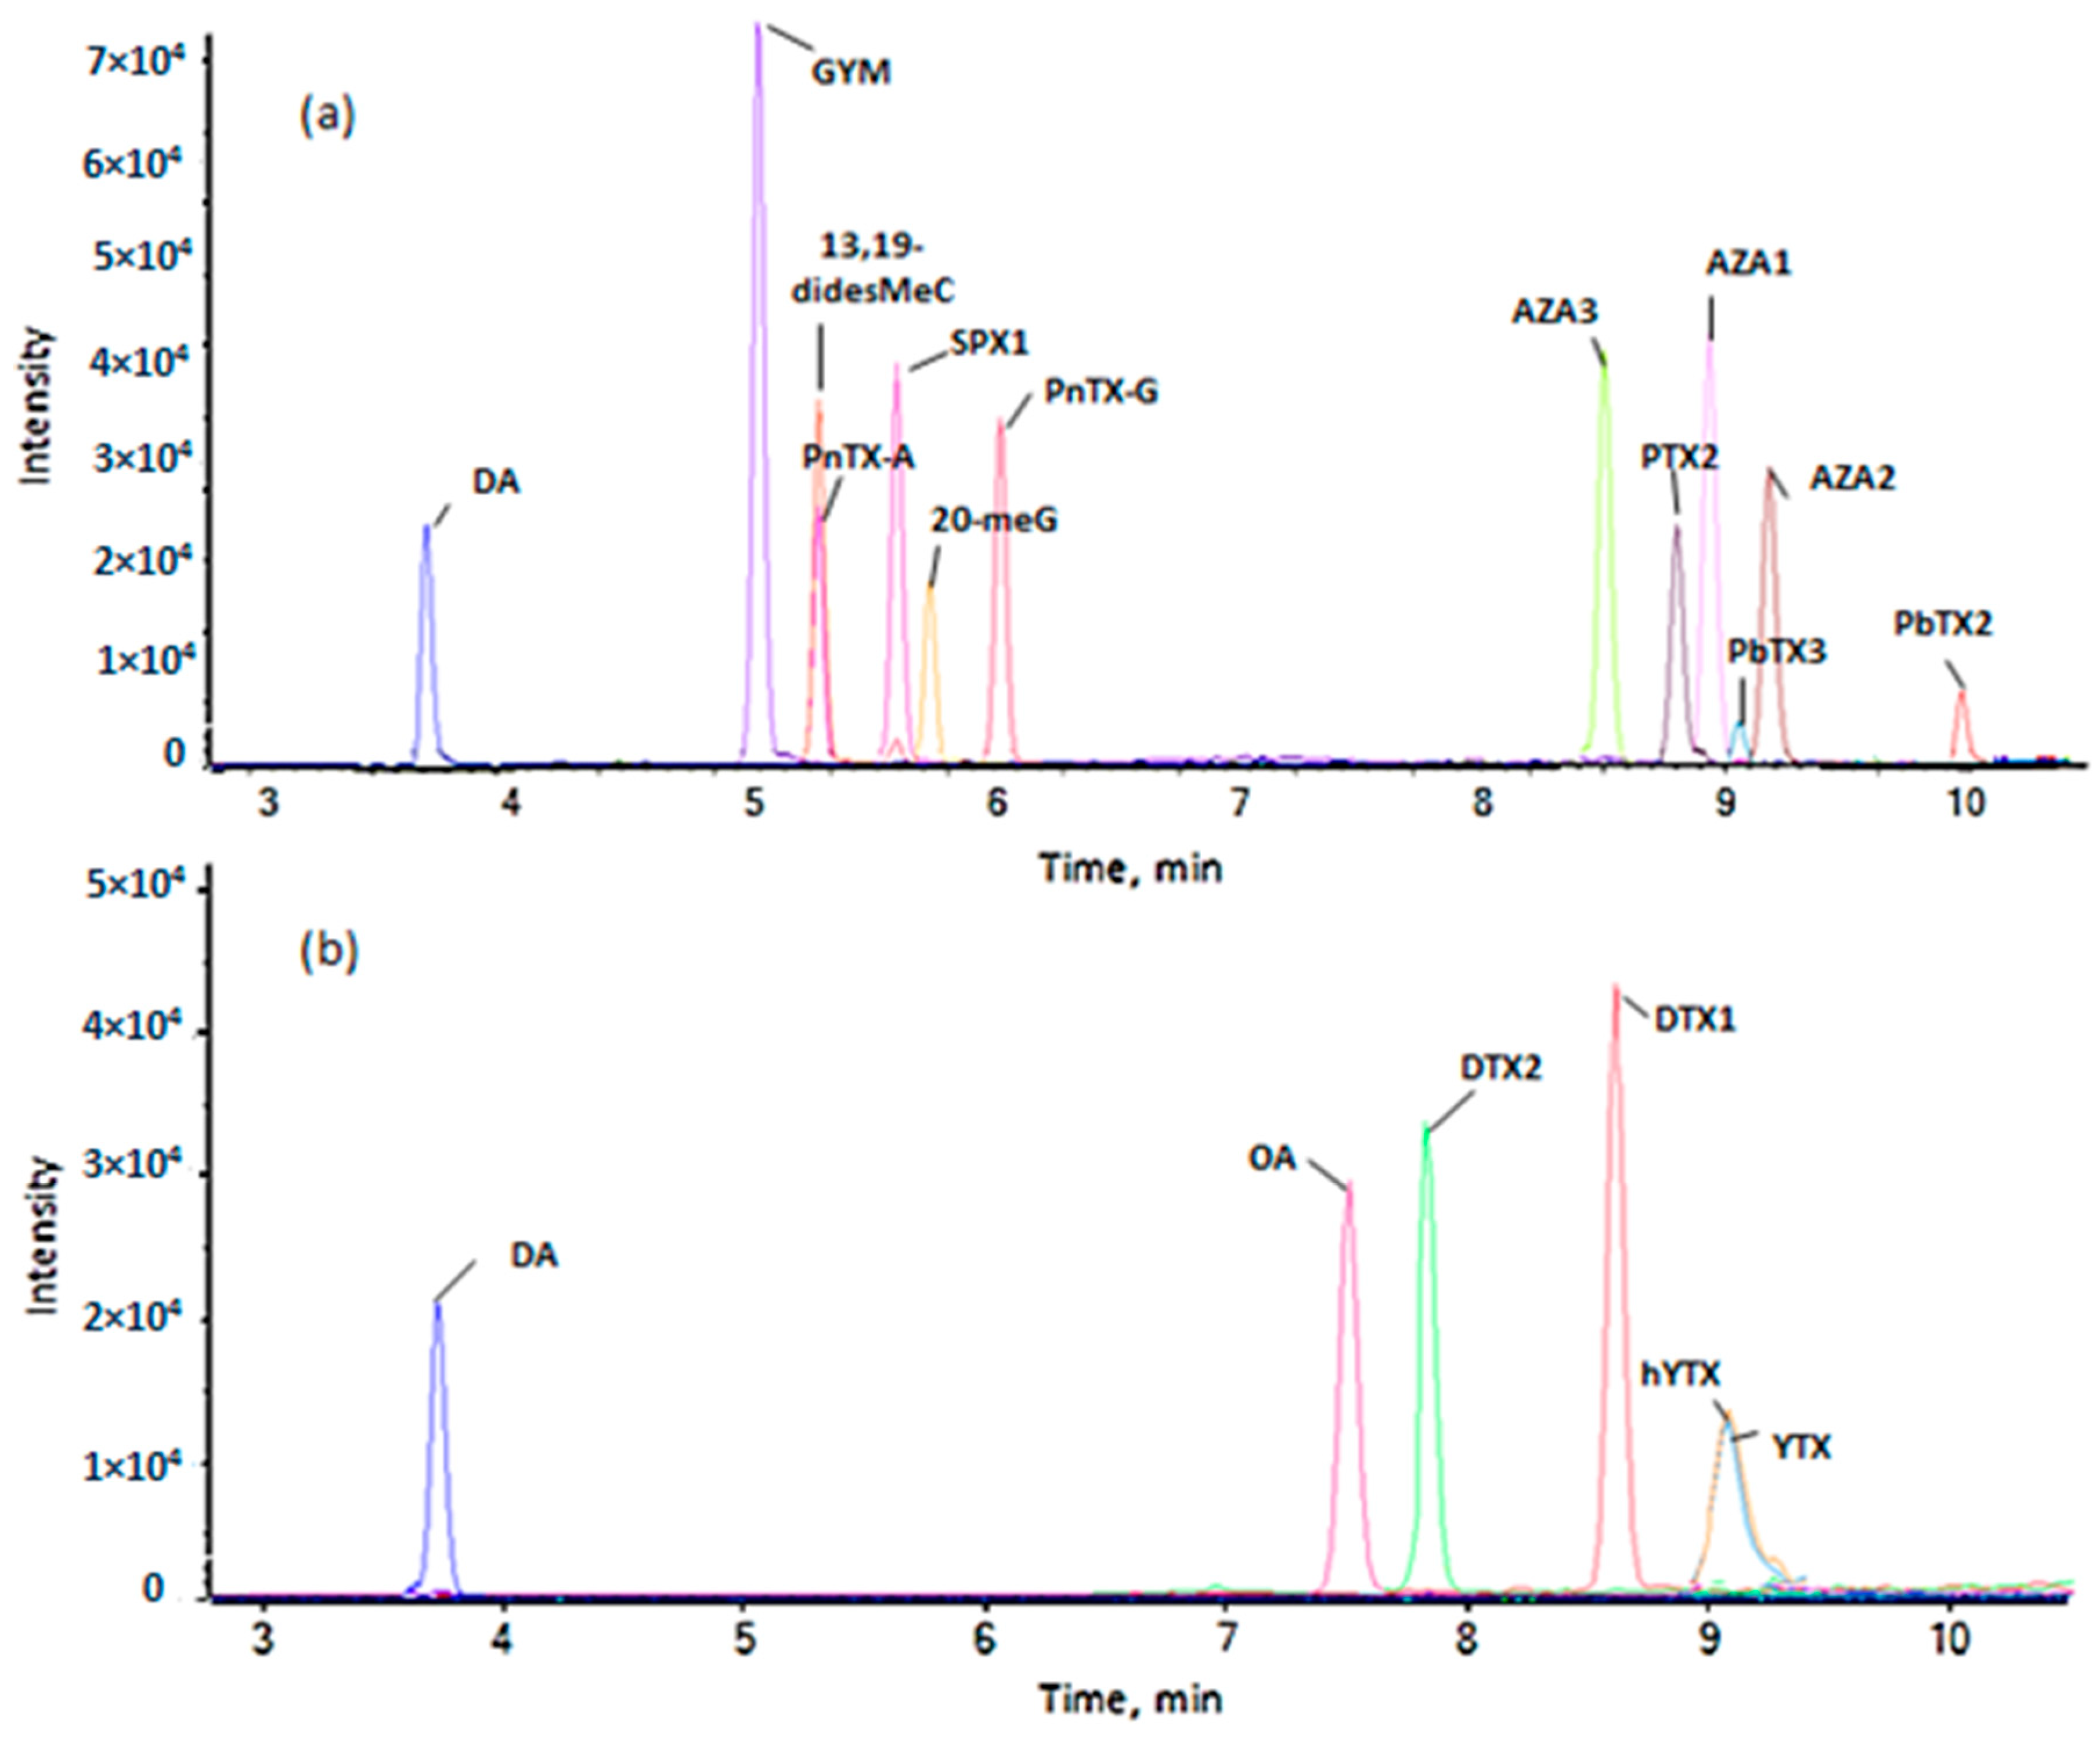
2.1. Targeted Analysis
2.1.1. Method Development
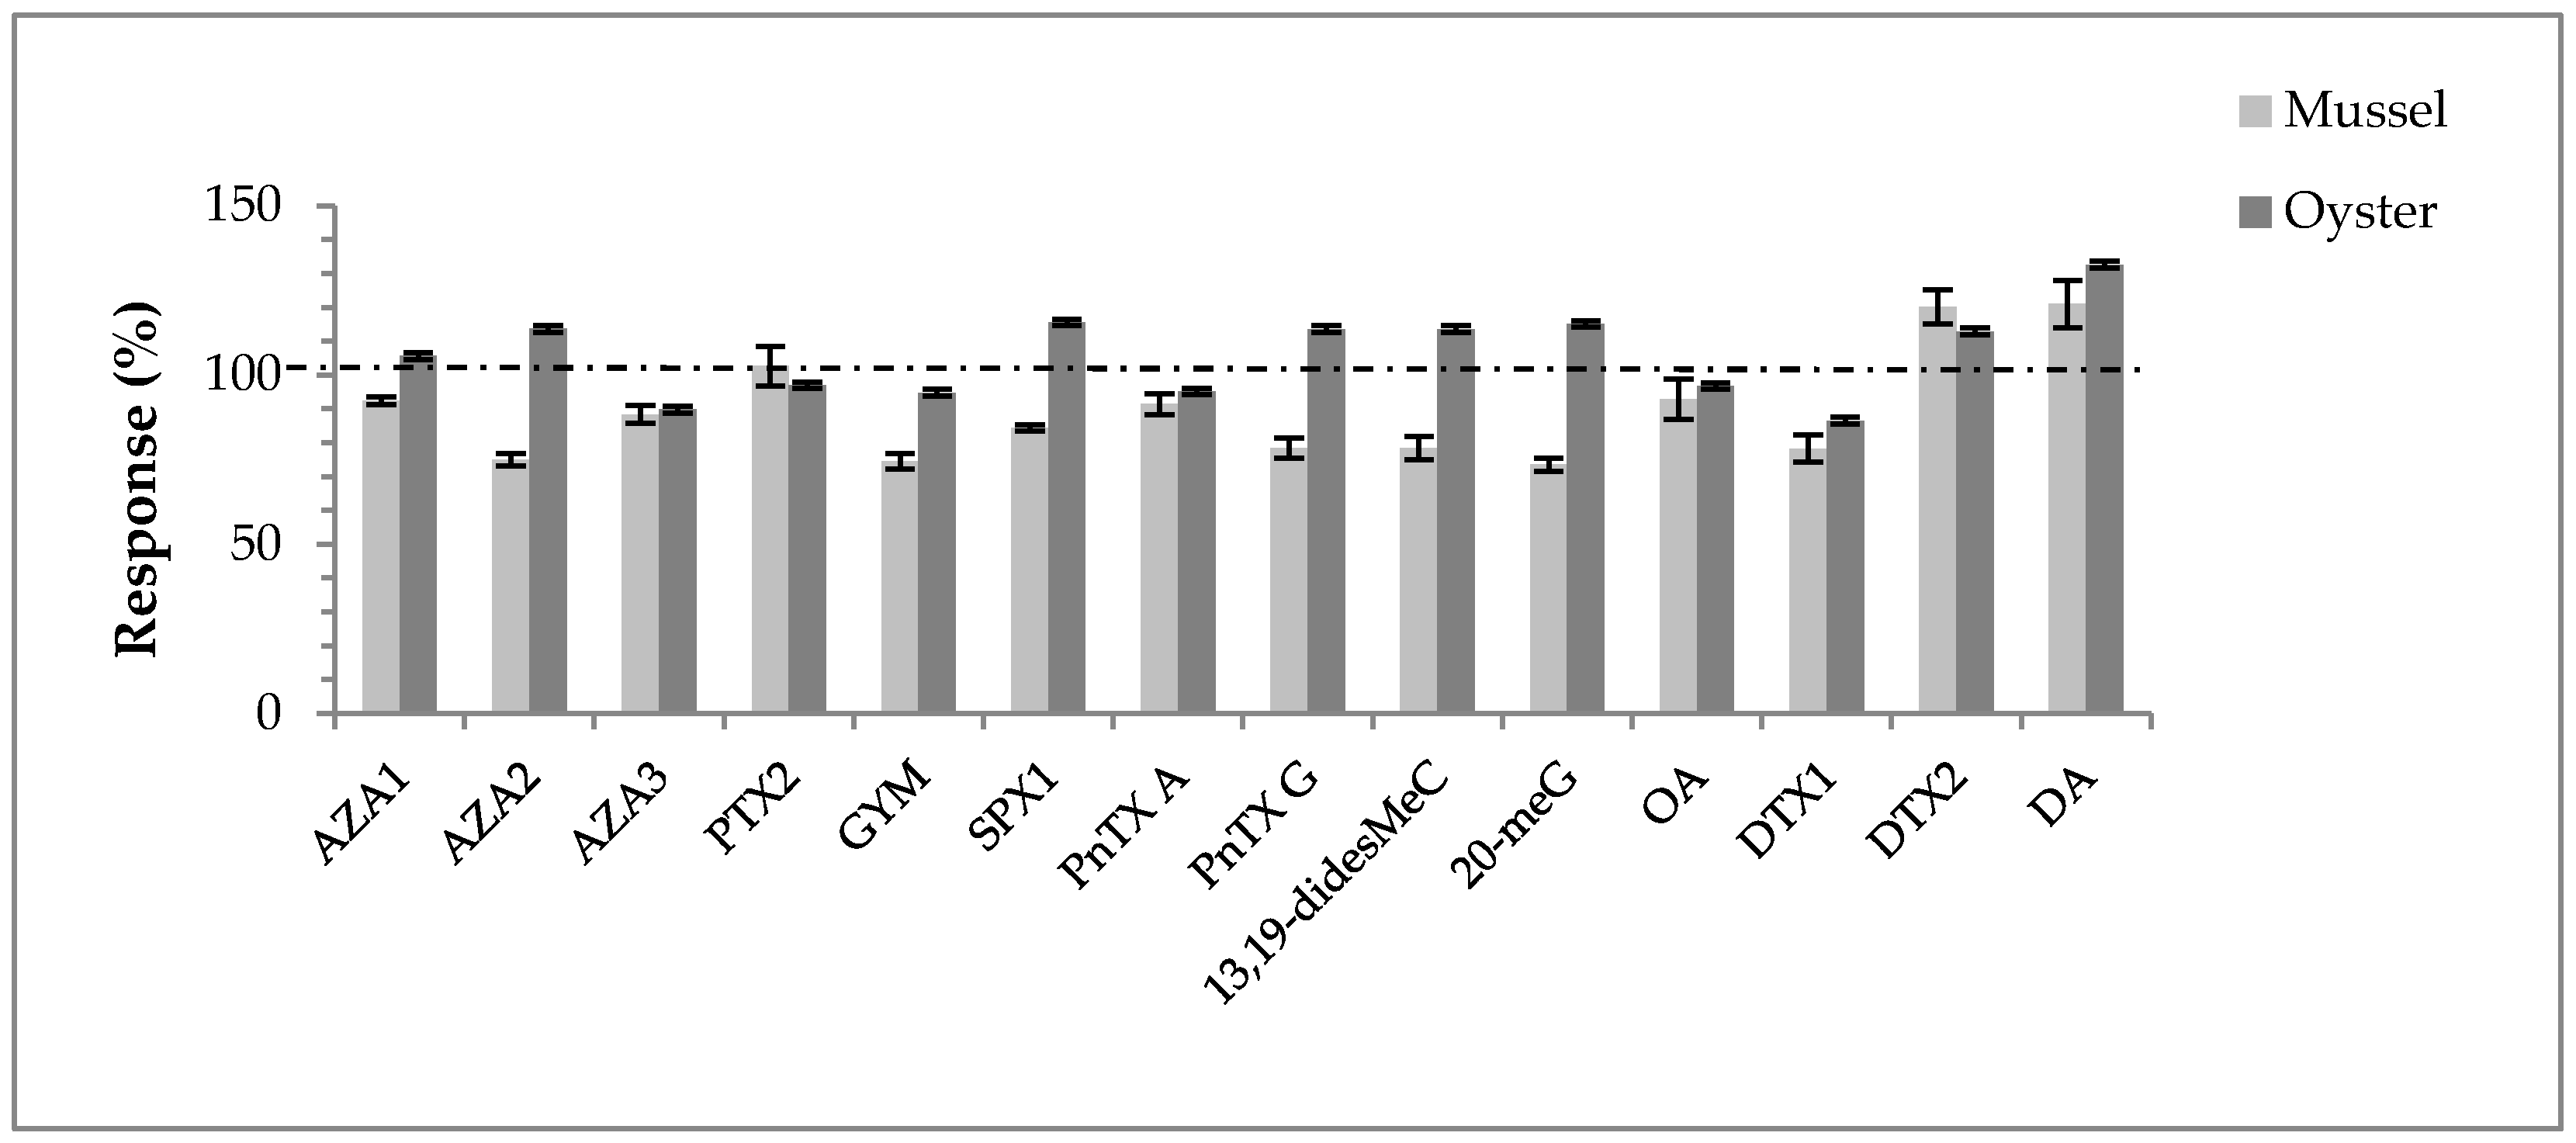
2.1.2. Characterization Study of the Quantitative Method
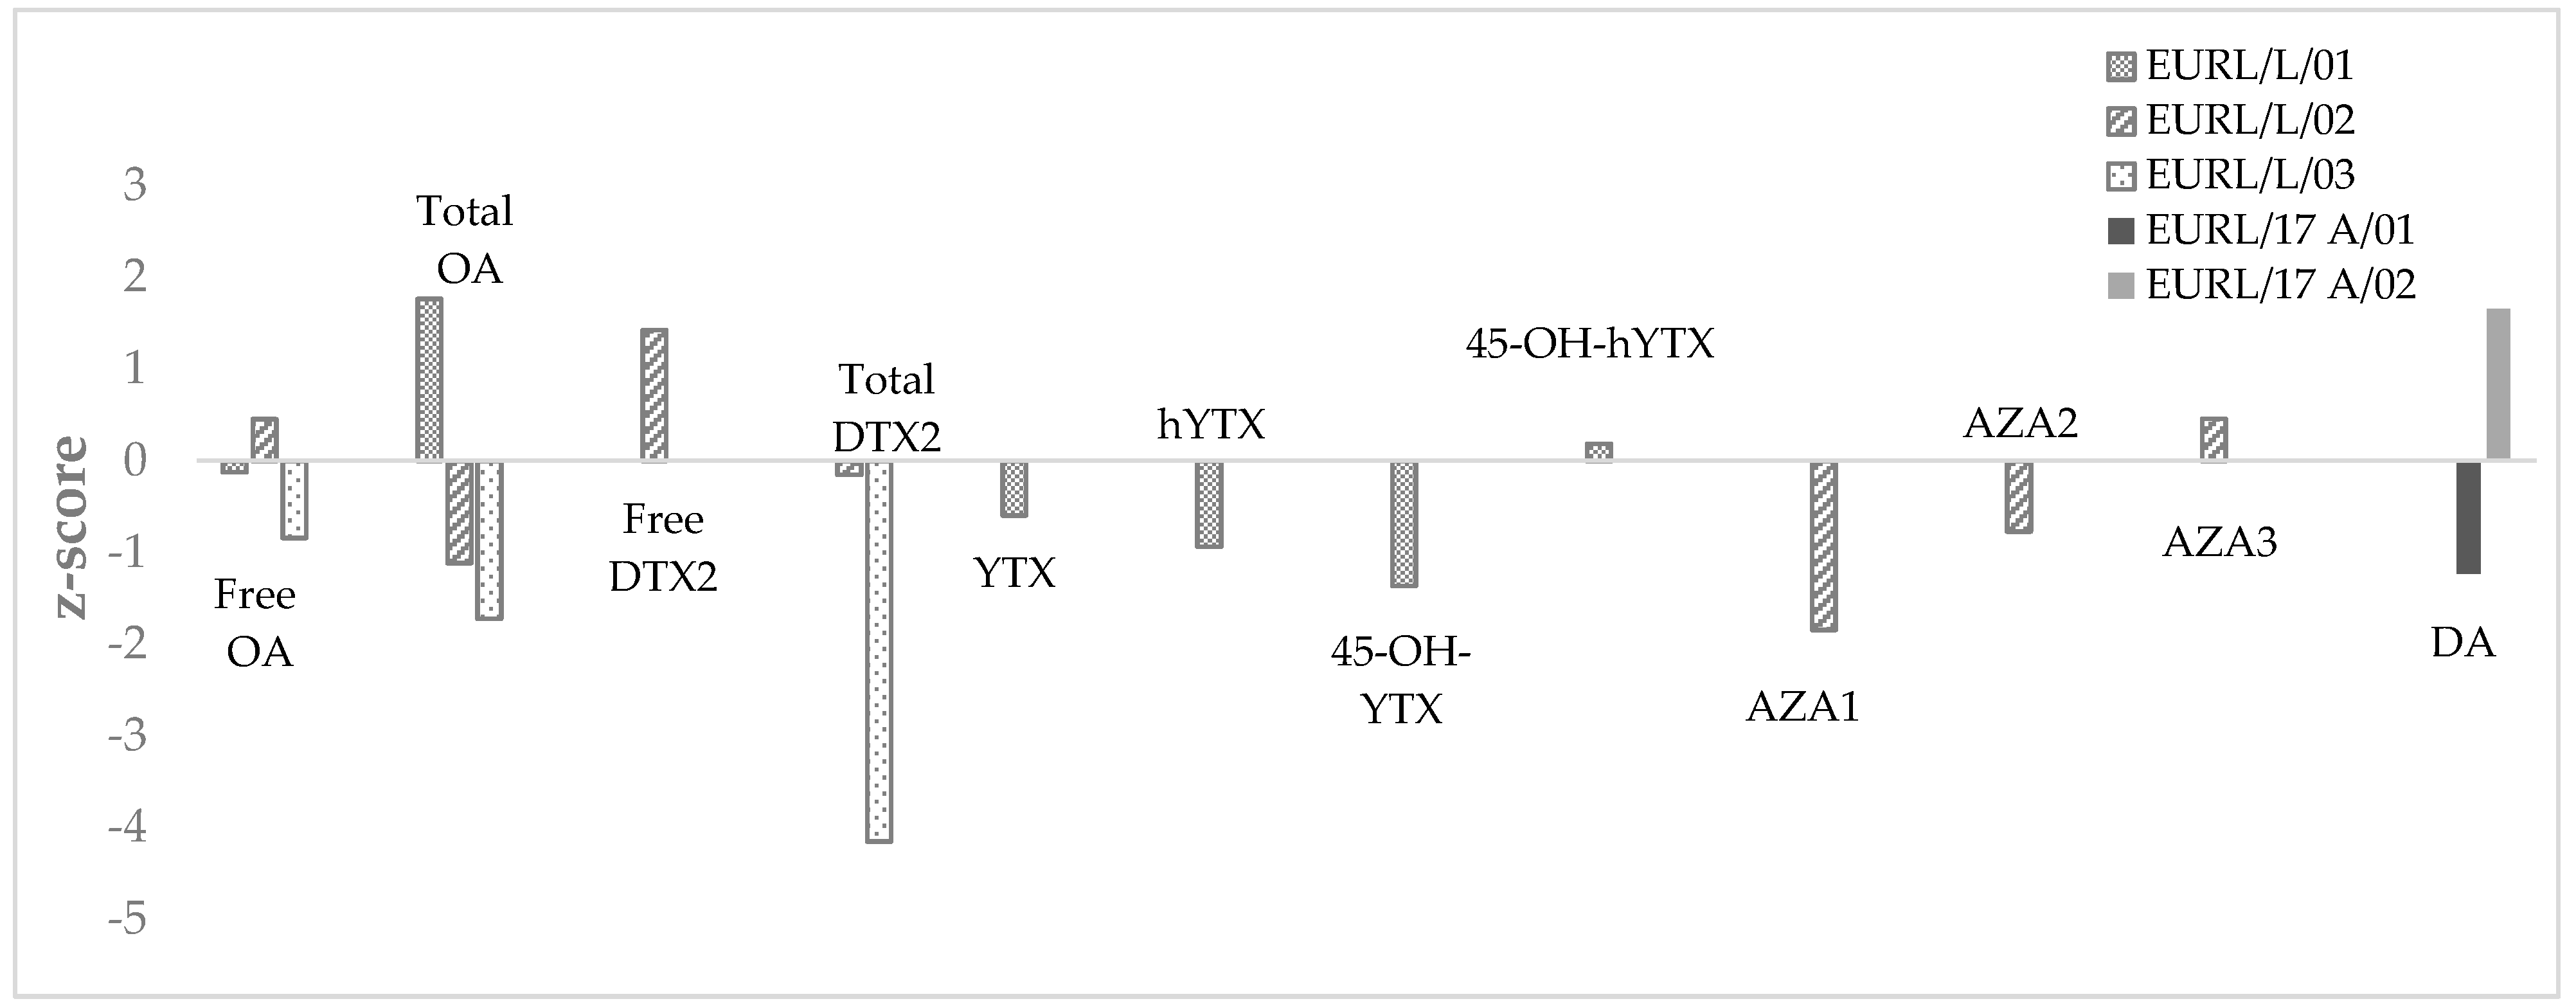
2.1.3. Application
2.2. Non-Targeted Analysis
2.2.1. Evaluation of the Suspect Screening Approach
2.2.2. Evaluation of the Non-Targeted Screening Approach
Pairwise Comparison: t-Test Results
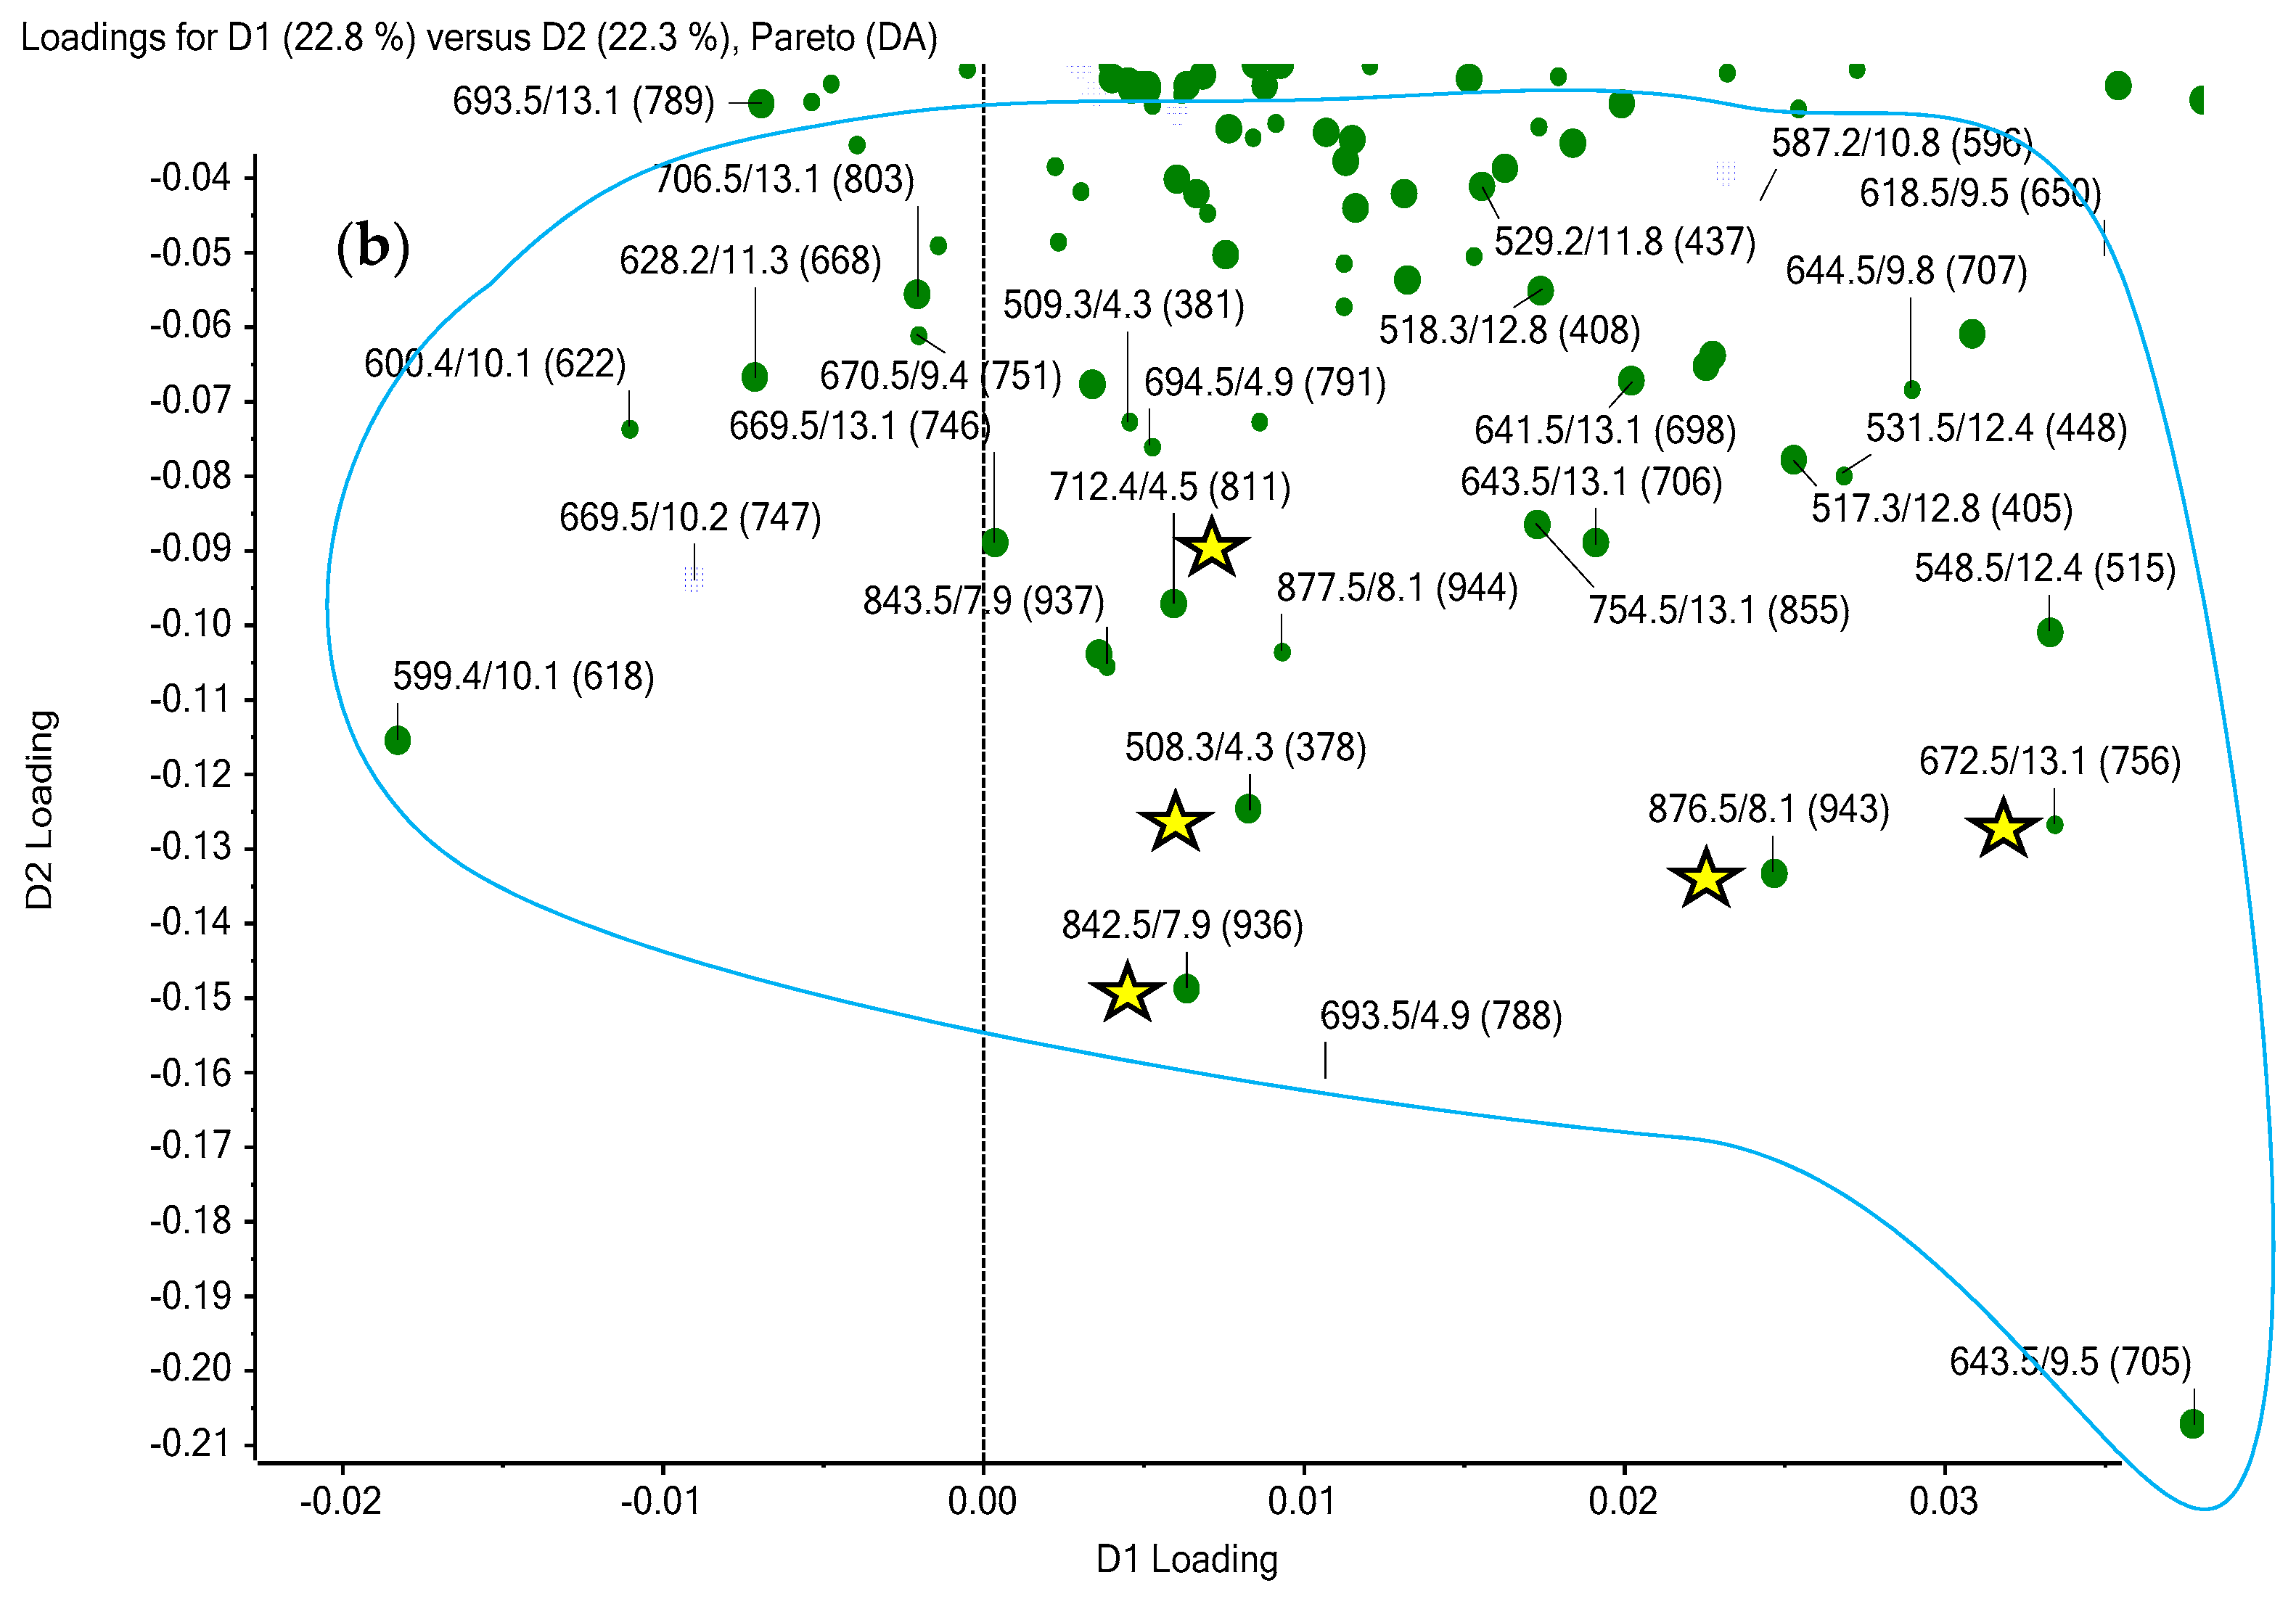
Multivariate Analysis: PCA and PCA-DA Results
3. Discussion
3.1. Targeted Analysis
3.2. Non-Targeted Analysis
4. Conclusions
5. Materials and Methods
5.1. Standards and Reagents
5.2. Sample Preparation
5.3. Preparation of Standards and Matrix-Matched Calibration Solutions
5.4. LC-HRMS Analysis
5.5. Post-Acquisition Data Processing
5.6. Method Performance Characteristics for Target Quantitation
- x = analytical result
- X = assigned value as determined by the EURLMB
- σ = standard deviation
- |z|<2: results are satisfactory
- 2<|z|<3: results are questionable
- |z|>3: results are unsatisfactory
5.7. Non-Targeted Screening of Marine Toxins
Supplementary Materials
Author Contributions
Funding
Acknowledgments
Conflicts of Interest
References
- Frémy, J.-M.; Lassus, P. Toxines d’Algues dans l’Alimentation; Ifremer: Issy-les-Moulineaux, France, 2001. [Google Scholar]
- UNESCO. Report of the Joint FAO/IOC/WHO ad hoc Expert Consultation on Biotoxins in Bivalve Molluscs; Technical Report for UNESCO; UNESCO: Oslo, Norway, 2005. [Google Scholar]
- Asakawa, M. Marine Biotoxins: Occurrence, Toxicity, and Detection Methods. Mater. Sci. Eng. 2017. [Google Scholar] [CrossRef]
- Morabito, S.; Silvestro, S.; Faggio, C. How the marine biotoxins affect human health. Nat. Prod. Res. 2018, 32, 621–631. [Google Scholar] [CrossRef] [PubMed]
- European Commission. Commission Regulation No 786/2013 of 16th August 2013 amending Annex III to Regulation (EC) No 853/2004 of the European Parliament and of the Council as regards the permitted limits of yessotoxins in live bivalve molluscs Text with EEA relevance. Off. J. Eur. Union 2013, 220, 14. [Google Scholar]
- European Commission. Regulation (EC) No 853/2004 of the European Parliament and of the Council of 29 April 2004 laying down specific hygiene rules for on the hygiene of foodstuffs. Off. J. Eur. Union 2004, 139, 151. [Google Scholar]
- Hess, P.; Grune, B.; Anderson, D.B.; Aune, T.; Botana, L.; Caricato, P.; Egmond, H.; Halder, M.; Hall, S.; Lawrence, J.F.; et al. Three Rs Approaches in Marine Biotoxin Testing. The Report and Recommendations of a joint ECVAM/DG SANCO Workshop (ECVAM Workshop 54). Altern. Lab. Anim. 2006, 34, 193–224. [Google Scholar] [PubMed]
- European Commission. Commission regulation (EU) No 15/2011 of 10 January 2011 amending Regulation (EC) No 2074/2005 as regards recognised testing methods for detecting marine biotoxins in live bivalve molluscs. Off. J. Eur. Union 2011, 6, 4. [Google Scholar]
- European Commission. Commission regulation (EC) No 1664/2006 of 6 November 2006 amending Regulation (EC) No 2074/2005 as regards implementing measures for certain products of animal origin intended for human consumption and repealing certain implementing measures. Off. J. Eur. Union 2006, 320, 33. [Google Scholar]
- Fux, E.; McMillan, D.; Bire, R.; Hess, P. Development of an ultra-performance liquid chromatography-mass spectrometry method for the detection of lipophilic marine toxins. J. Chromatogr. A 2007, 1157, 273–280. [Google Scholar] [CrossRef] [PubMed]
- Gerssen, A.; van Olst, E.H.W.; Mulder, P.P.J.; de Boer, J. In-house validation of a liquid chromatography tandem mass spectrometry method for the analysis of lipophilic marine toxins in shellfish using matrix-matched calibration. Anal. Bioanal. Chem. 2010, 397, 3079–3088. [Google Scholar] [CrossRef] [PubMed]
- MacKenzie, L.; Holland, P.; McNabb, P.; Beuzenberg, V.; Selwood, A.; Suzuki, T. Complex toxin profiles in phytoplankton and Greenshell mussels (Perna canaliculus), revealed by LC-MS/MS analysis. Toxicon 2002, 40, 1321–1330. [Google Scholar] [CrossRef]
- Quilliam, M.A. Analysis of diarrhetic shellfish poisoning toxins in shellfish tissue by liquid chromatography with fluorometric and mass spectrometric detection. J. AOAC Int. 1995, 78, 555–570. [Google Scholar] [PubMed]
- Yogi, K.; Oshiro, N.; Inafuku, Y.; Hirama, M.; Yasumoto, T. Detailed LC-MS/MS Analysis of Ciguatoxins Revealing Distinct Regional and Species Characteristics in Fish and Causative Alga from the Pacific. Anal. Chem. 2011, 83, 8886–8891. [Google Scholar] [CrossRef] [PubMed]
- Ciminiello, P.; Dell’Aversano, C.; Iacovo, E.D.; Fattorusso, E.; Forino, M.; Tartaglione, L. LC-MS of palytoxin and its analogues: State of the art and future perspectives. Toxicon 2011, 57, 376–389. [Google Scholar] [CrossRef] [PubMed]
- Domènech, A.; Cortés-Francisco, N.; Palacios, O.; Franco, J.M.; Riobó, P.; Llerena, J.J.; Vichi, S.; Caixach, J. Determination of lipophilic marine toxins in mussels. Quantification and confirmation criteria using high resolution mass spectrometry. J. Chromatogr. A 2014, 1328, 16–25. [Google Scholar] [CrossRef] [PubMed]
- Gerssen, A.; Mulder, P.P.J.; de Boer, J. Screening of lipophilic marine toxins in shellfish and algae: Development of a library using liquid chromatography coupled to orbitrap mass spectrometry. Anal. Chim. Acta 2011, 685, 176–185. [Google Scholar] [CrossRef] [PubMed]
- Blay, P.; Hui, J.P.M.; Chang, J.M.; Melanson, J.E. Screening for multiple classes of marine biotoxins by liquid chromatography-high-resolution mass spectrometry. Anal. Bioanal. Chem. 2011, 400, 577–585. [Google Scholar] [CrossRef] [PubMed]
- Dzuman, Z.; Zachariasova, M.; Veprikova, Z.; Godula, M.; Hajslova, J. Multi-analyte high performance liquid chromatography coupled to high resolution tandem mass spectrometry method for control of pesticide residues, mycotoxins, and pyrrolizidine alkaloids. Anal. Chim. Acta 2015, 863, 29–40. [Google Scholar] [CrossRef] [PubMed]
- Gago-Martinez, A.; Hungerford, J.M. Comment on “the effect of uncontrolled factors in a validated liquid chromatography-tandem mass spectrometry method question its use as reference method for marine toxins: Major causes for concern”. Anal. Chem. 2012, 84, 475. [Google Scholar] [CrossRef] [PubMed]
- Gerssen, A.; Van Den Top, H.J.; Van Egmond, H.P. Comment on “effect of uncontrolled factors in a validated liquid chromatography-tandem mass spectrometry method question its use as a reference method for marine toxins: Major causes for concern”. Anal. Chem. 2012, 84, 476–477. [Google Scholar] [CrossRef] [PubMed]
- Boundy, M.J.; Selwood, A.I.; Harwood, D.T.; McNabb, P.S.; Turner, A.D. Development of a sensitive and selective liquid chromatography-mass spectrometry method for high throughput analysis of paralytic shellfish toxins using graphitised carbon solid phase extraction. J. Chromatogr. A 2015, 1387, 1–12. [Google Scholar] [CrossRef] [PubMed]
- Turner, A.D.; McNabb, P.S.; Harwood, D.T.; Selwood, A.I.; Boundy, M.J. Single-laboratory validation of a multitoxin ultra-performance LC-hydrophilic interaction LC-MS/MS method for quantitation of paralytic shellfish toxins in bivalve shellfish. J. AOAC Int. 2015, 98, 609–621. [Google Scholar] [CrossRef] [PubMed]
- Wu, H.; Guo, M.; Tan, Z.; Cheng, H.; Li, Z.; Zhai, Y. Liquid chromatography quadrupole linear ion trap mass spectrometry for multiclass screening and identification of lipophilic marine biotoxins in bivalve mollusks. J. Chromatogr. A 2014, 1358, 172–180. [Google Scholar] [CrossRef] [PubMed]
- Orellana, G.; Vanden Bussche, J.; Van Meulebroek, L.; Vandegehuchte, M.; Janssen, C.; Vanhaecke, L. Validation of a confirmatory method for lipophilic marine toxins in shellfish using UHPLC-HR-Orbitrap MS. Anal. Bioanal. Chem. 2014, 406, 5303–5312. [Google Scholar] [CrossRef] [PubMed]
- Krauss, M.; Singer, H.; Hollender, J. LC–high resolution MS in environmental analysis: from target screening to the identification of unknowns. Anal. Bioanal. Chem. 2010, 397, 943–951. [Google Scholar] [CrossRef] [PubMed]
- Martínez Bueno, M.J.; Ulaszewska, M.M.; Gomez, M.J.; Hernando, M.D.; Fernández-Alba, A.R. Simultaneous measurement in mass and mass/mass mode for accurate qualitative and quantitative screening analysis of pharmaceuticals in river water. J. Chromatogr. A 2012, 1256, 80–88. [Google Scholar] [CrossRef] [PubMed]
- Nürenberg, G.; Schulz, M.; Kunkel, U.; Ternes, T.A. Development and validation of a generic nontarget method based on liquid chromatography—High resolution mass spectrometry analysis for the evaluation of different wastewater treatment options. J. Chromatogr. A 2015, 1426, 77–90. [Google Scholar] [CrossRef] [PubMed]
- Schymanski, E.L.; Singer, H.P.; Slobodnik, J.; Ipolyi, I.M.; Oswald, P.; Krauss, M.; Schulze, T.; Haglund, P.; Letzel, T.; Grosse, S.; et al. Non-target screening with high-resolution mass spectrometry: critical review using a collaborative trial on water analysis. Anal. Bioanal. Chem. 2015, 407, 6237–6255. [Google Scholar] [CrossRef] [PubMed]
- Vergeynst, L.; Van Langenhove, H.; Joos, P.; Demeestere, K. High-resolution time-of-flight mass spectrometry for suspect screening and target quantification of pharmaceuticals in river water. Commun. Agric. Appl. Biol. Sci. 2013, 78, 9–14. [Google Scholar] [PubMed]
- Vergeynst, L.; Van Langenhove, H.; Joos, P.; Demeestere, K. Suspect screening and target quantification of multi-class pharmaceuticals in surface water based on large-volume injection liquid chromatography and time-of-flight mass spectrometry. Anal. Bioanal. Chem. 2014, 406, 2533–2547. [Google Scholar] [CrossRef] [PubMed]
- McNabb, P.S.; Selwood, A.I.; Van Ginkel, R.; Boundy, M.; Holland, P.T. Determination of brevetoxins in shellfish by LC/MS/MS: Single-laboratory validation. J. AOAC Int. 2012, 95, 1097–1105. [Google Scholar] [CrossRef] [PubMed]
- Zendong, Z.; Bertrand, S.; Herrenknecht, C.; Abadie, E.; Jauzein, C.; Lemée, R.; Gouriou, J.; Amzil, Z.; Hess, P. Passive Sampling and High Resolution Mass Spectrometry for Chemical Profiling of French Coastal Areas with a Focus on Marine Biotoxins. Environ. Sci. Technol. 2016, 50, 8522–8529. [Google Scholar] [CrossRef] [PubMed]
- Zendong, Z.; McCarron, P.; Herrenknecht, C.; Sibat, M.; Amzil, Z.; Cole, R.B.; Hess, P. High resolution mass spectrometry for quantitative analysis and untargeted screening of algal toxins in mussels and passive samplers. J. Chromatogr. A 2015, 1416, 10–21. [Google Scholar] [CrossRef] [PubMed]
- Mondeguer, F.; Antignac, J.-P.; Guitton, Y.; Monteau, F.; Le Borgne, S.; Hess, P. Nouvelle stratégie de caractérisation non ciblée de type métabolomique au service de l’identification de composés bioactifs accumulés dans les mollusques bivalves: Couplage chromatographie liquide-spectrométrie de masse haute résolution (LC-HRMS). Spectra Anal. 2012, 284, 10. [Google Scholar]
- Naz, S.; Vallejo, M.; Garcia, A.; Barbas, C. Method validation strategies involved in non-targeted metabolomics. J. Chromatogr. A 2014, 1353, 99–105. [Google Scholar] [CrossRef] [PubMed]
- Heffernan, A.L.; Gomez-Ramos, M.M.; Gaus, C.; Vijayasarathy, S.; Bell, I.; Hof, C.; Mueller, J.F.; Gomez-Ramos, M.J. Non-targeted, high resolution mass spectrometry strategy for simultaneous monitoring of xenobiotics and endogenous compounds in green sea turtles on the Great Barrier Reef. Sci. Total Environ. 2017, 599–600, 1251–1262. [Google Scholar] [CrossRef] [PubMed]
- European Commission. Commission Decision of 12 August 2002 implementing Council Directive 96/23/EC concerning the performance of analytical methods and the interpretation of results. Off. J. Eur. Commun. 2002, 221, 29. [Google Scholar]
- McCarron, P.; Wright, E.; Quilliam, M.A. Liquid chromatography/mass spectrometry of domoic acid and lipophilic shellfish toxins with selected reaction monitoring and optional confirmation by library searching of product ion spectra. J. AOAC Int. 2014, 97, 316–324. [Google Scholar] [CrossRef] [PubMed]
- Beach, D.G.; Walsh, C.M.; McCarron, P. High-throughput quantitative analysis of domoic acid directly from mussel tissue using Laser Ablation Electrospray Ionization—Tandem mass spectrometry. Toxicon 2014, 92, 75–80. [Google Scholar] [CrossRef] [PubMed]
- James, K.J.; Gillman, M.; Amandi, M.F.; López-Rivera, A.; Puente, P.F.; Lehane, M.; Mitrovic, S.; Furey, A. Amnesic shellfish poisoning toxins in bivalve molluscs in Ireland. Toxicon 2005, 46, 852–858. [Google Scholar] [CrossRef] [PubMed]
- Wang, Z.; Maucher-Fuquay, J.; Fire, S.E.; Mikulski, C.M.; Haynes, B.; Doucette, G.J.; Ramsdell, J.S. Optimization of solid-phase extraction and liquid chromatography-tandem mass spectrometry for the determination of domoic acid in seawater, phytoplankton, and mammalian fluids and tissues. Anal. Chim. Acta 2012, 715, 71–79. [Google Scholar] [CrossRef] [PubMed]
- Zhang, Y.; Chen, D.; Hong, Z. A rapid LC-HRMS method for the determination of domoic acid in urine using a self-assembly pipette tip solid-phase extraction. Toxins 2015, 8, 10. [Google Scholar] [CrossRef] [PubMed]
- Ciminiello, P.; Dell′Aversano, C.; Fattorusso, E.; Forino, M.; Magno, G.S.; Tartaglione, L.; Quilliam, M.A.; Tubaro, A.; Poletti, R. Hydrophilic interaction liquid chromatography/mass spectrometry for determination of domoic acid in Adriatic shellfish. Rapid Commun. Mass Spectrom. 2005, 19, 2030–2038. [Google Scholar] [CrossRef] [PubMed]
- Zendong, S.Z. Développement de Méthodes de Spectrométrie de Masse Haute Résolution (SMHR) Pour le Criblage des Phycotoxines dans les Echantillons Biologiques et Environnementaux. Ph.D. Thesis, Nantes University, Nantes, France, 2015. [Google Scholar]
- Zhuo, L.; Fu, W.; Yang, Y.; Qiu, B.; Lin, Z.; Shan, L.; Zheng, L.; Li, J.; Chen, G. Simultaneous determination of biotoxins DSP and AZAs in bivalve molluscs and fish by liquid chromatography/tandem mass spectrometry. Rapid Commun. Mass Spectrom. 2014, 28, 1479–1488. [Google Scholar] [CrossRef] [PubMed]
- Ishida, H.; Nozawa, A.; Nukaya, H.; Tsuji, K. Comparative concentrations of brevetoxins PbTx-2, PbTx-3, BTX-B1 and BTX-B5 in cockle, Austrovenus stutchburyi, greenshell mussel, Perna canaliculus, and Pacific oyster, Crassostrea gigas, involved neurotoxic shellfish poisoning in New Zealand. Toxicon 2004, 43, 779–789. [Google Scholar] [CrossRef] [PubMed]
- Kilcoyne, J.; Fux, E. Strategies for the elimination of matrix effects in the liquid chromatography tandem mass spectrometry analysis of the lipophilic toxins okadaic acid and azaspiracid-1 in molluscan shellfish. J. Chromatogr. A. 2010, 1217, 7123–7130. [Google Scholar] [CrossRef] [PubMed]
- Botana, L.M.; Alfonso, A.; Rodríguez, I.; Botana, A.M.; Louzao, M.C.; Vieytes, M.R. How safe is safe for marine toxins monitoring? Toxins 2016, 8, 208. [Google Scholar] [CrossRef] [PubMed]
- Campbell, K.; Vilariño, N.; Botana, L.M.; Elliott, C.T. A European perspective on progress in moving away from the mouse bioassay for marine-toxin analysis. TrAC Trends Anal. Chem. 2011, 30, 239–253. [Google Scholar] [CrossRef]
- Otero, P.; Alfonso, A.; Alfonso, C.; Rodríguez, P.; Vieytes, M.R.; Botana, L.M. Effect of uncontrolled factors in a validated liquid chromatography-tandem mass spectrometry method question its use as a reference method for marine toxins: Major causes for concern. Anal. Chem. 2011, 83, 5903–5911. [Google Scholar] [CrossRef] [PubMed]
- Otero, P.; Alfonso, C. Analysis of marine toxins: gaps on food safety control for marine toxins by chemical methods. In Phycotoxins: Chemistry and Biochemistry, 2nd ed.; Botana, L.M., Alfonso, A., Eds.; John Wiley and Sons: Hoboken, NJ, USA, 2015; p. 22. [Google Scholar]
- Molecular Components Map of Representative Matrices of Commodity Groups in document SANTE/11813/2017. Available online: http://www.eurl-pesticides.eu/userfiles/file//EURL-FV(2018-M23)%20Molecular%20component%20map.pdf (accessed on the 12 September 2018).
- Schymanski, E.L.; Jeon, J.; Gulde, R.; Fenner, K.; Ruff, M.; Singer, H.P.; Hollender, J. Identifying small molecules via high resolution mass spectrometry: communicating confidence. Environ. Sci. Technol. 2014, 48, 2097–2098. [Google Scholar] [CrossRef] [PubMed]
- Pisapia, F.; Sibat, M.; Herrenknecht, C.; Lhaute, K.; Gaiani, G.; Ferron, P.J.; Fessard, V.; Fraga, S.; Nascimento, S.M.; Litaker, R.W.; et al. Maitotoxin-4, a Novel MTX Analog Produced by Gambierdiscus excentricus. Mar. Drugs 2017, 15, 220. [Google Scholar] [CrossRef] [PubMed]
- EU-Harmonised Standard Operating Procedure for Determination of Lipophilic Marine Biotoxins in Molluscs by LC-MS/MS. Available online: www.aecosan.msssi.gob.es/AECOSAN/docs/documentos/laboratorios/LNRBM/ARCHIVO2EU-Harmonised-SOP-LIPO-LCMSMS_Version5.pdf (accessed on the 12 September 2018).
- Mountfort, D.O.; Suzuki, T.; Truman, P. Protein phosphatase inhibition assay adapted for determination of total DSP in contaminated mussels. Toxicon 2001, 39, 383–390. [Google Scholar] [CrossRef]
- Sanagi, M.M.; Ling, S.L.; Nasir, Z.; Hermawan, D.; Ibrahim, W.A.; Abu Naim, A. Comparison of signal-to-noise, blank determination, and linear regression methods for the estimation of detection and quantification limits for volatile organic compounds by gas chromatography. J. AOAC Int. 2009, 92, 1833–1838. [Google Scholar] [PubMed]
- Vial, J.; Jardy, A. Experimental comparison of the different approaches to estimate LOD and LOQ of an HPLC method. Anal. Chem. 1999, 71, 2672–2677. [Google Scholar] [CrossRef]
- ISO 13528:2015. Statistical Methods for Use in Proficiency Testing by Interlaboratory Comparison. Available online: https://www.iso.org/obp/ui/#iso:std:iso:13528:ed-2:v2:en (accessed on the 12 September 2018).


| LOQ (µg/kg) | |||
|---|---|---|---|
| MeOH | Mussel | Oyster | |
| AZA1 | 4.3 | 4.6 | 4.5 |
| AZA2 | 2.7 | 4.4 | 3.2 |
| AZA3 | 5.6 | 7.6 | 6.5 |
| PTX2 | 6.7 | 8.7 | 8.4 |
| GYM-A | 1.1 | 2.0 | 1.6 |
| SPX1 | 1.7 | 3.1 | 2.2 |
| PnTX-A | 4.4 | 5.1 | 4.6 |
| PnTX-G | 5.0 | 4.4 | 4.6 |
| 13,19-didesMeC | 3.3 | 4.7 | 4.1 |
| 20-meG | 3.5 | 5.0 | 4.0 |
| OA | 6.0 | 8.9 | 5.6 |
| DTX1 | 3.6 | 4.4 | 5.6 |
| DTX2 | 4.2 | 5.4 | 5.0 |
| DA | 26 | 30 | 31 |
| YTX * | 87 | 119 | 132 |
| hYTX * | 84 | 121 | 128 |
| PbTx-2 * | 280 | 312 | 324 |
| PbTx-3 * | 300 | 321 | 337 |
| Toxins | Spike Level (µg/kg) | Recovery (%) | RSDr (%) | RSDR (%) |
|---|---|---|---|---|
| AZA1 | 10 | 96 | 13.7 | 17.1 |
| 120 | 105 | 3.4 | 5.8 | |
| AZA2 | 10 | 86 | 8.2 | 11.3 |
| 120 | 100 | 1.3 | 4.2 | |
| AZA3 | 10 | 103 | 12.9 | 19.8 |
| 120 | 104 | 2.9 | 6.9 | |
| PTX2 | 20 | 110 | 9.4 | 11.0 |
| 240 | 101 | 4.2 | 4.2 | |
| GYM | 10 | 97 | 6.1 | 6.1 |
| 120 | 100 | 7.3 | 7.3 | |
| SPX1 | 10 | 94 | 3.9 | 9.1 |
| 120 | 103 | 1.6 | 1.7 | |
| PnTX-A | 10 | 90 | 8.0 | 8.9 |
| 120 | 97 | 4.8 | 6.2 | |
| PnTX-G | 10 | 103 | 11.4 | 14.7 |
| 120 | 95 | 11.4 | 14.7 | |
| 13,19-didesMeC | 10 | 91 | 8.7 | 12.1 |
| 120 | 105 | 4.1 | 4.1 | |
| 20-meG | 10 | 88 | 9.1 | 14.1 |
| 20 | 102 | 1.7 | 1.9 | |
| OA | 20 | 106 | 5.9 | 8.7 |
| 240 | 103 | 8.0 | 9.2 | |
| DTX1 | 20 | 108 | 11.9 | 11.9 |
| 240 | 106 | 3.0 | 3.2 | |
| DTX2 | 20 | 106 | 6.9 | 7.1 |
| 240 | 104 | 7.6 | 8.3 | |
| DA | 60 | 99 | 12.2 | 12.2 |
| 720 | 99 | 1.4 | 2.7 |
| Spike Levels | SPX1 | GYM | AZA1 | PnTX A | PTX2 |
|---|---|---|---|---|---|
| L0/L1 | <0.01 | >0.05 | >0.05 | >0.05 | >0.05 |
| L0/L2 | <0.01 | <0.01 | >0.05 | >0.05 | >0.05 |
| L0/L3 | <0.01 | <0.05 | <0.01 | <0.01 | >0.05 |
| L0/L4 | <0.01 | <0.01 | <0.01 | <0.01 | <0.05 |
| L0/L5 | <0.01 | <0.01 | <0.01 | <0.01 | <0.01 |
| L0/L6 | <0.01 | <0.01 | <0.01 | <0.01 | <0.01 |
© 2018 by the authors. Licensee MDPI, Basel, Switzerland. This article is an open access article distributed under the terms and conditions of the Creative Commons Attribution (CC BY) license (http://creativecommons.org/licenses/by/4.0/).
Share and Cite
Dom, I.; Biré, R.; Hort, V.; Lavison-Bompard, G.; Nicolas, M.; Guérin, T. Extended Targeted and Non-Targeted Strategies for the Analysis of Marine Toxins in Mussels and Oysters by (LC-HRMS). Toxins 2018, 10, 375. https://doi.org/10.3390/toxins10090375
Dom I, Biré R, Hort V, Lavison-Bompard G, Nicolas M, Guérin T. Extended Targeted and Non-Targeted Strategies for the Analysis of Marine Toxins in Mussels and Oysters by (LC-HRMS). Toxins. 2018; 10(9):375. https://doi.org/10.3390/toxins10090375
Chicago/Turabian StyleDom, Inès, Ronel Biré, Vincent Hort, Gwenaëlle Lavison-Bompard, Marina Nicolas, and Thierry Guérin. 2018. "Extended Targeted and Non-Targeted Strategies for the Analysis of Marine Toxins in Mussels and Oysters by (LC-HRMS)" Toxins 10, no. 9: 375. https://doi.org/10.3390/toxins10090375
APA StyleDom, I., Biré, R., Hort, V., Lavison-Bompard, G., Nicolas, M., & Guérin, T. (2018). Extended Targeted and Non-Targeted Strategies for the Analysis of Marine Toxins in Mussels and Oysters by (LC-HRMS). Toxins, 10(9), 375. https://doi.org/10.3390/toxins10090375