Impact of Biological Feedback and Incentives on Blood Fatty Acid Concentrations, Including Omega-3 Index, in an Employer-Based Wellness Program


Abstract
:1. Introduction
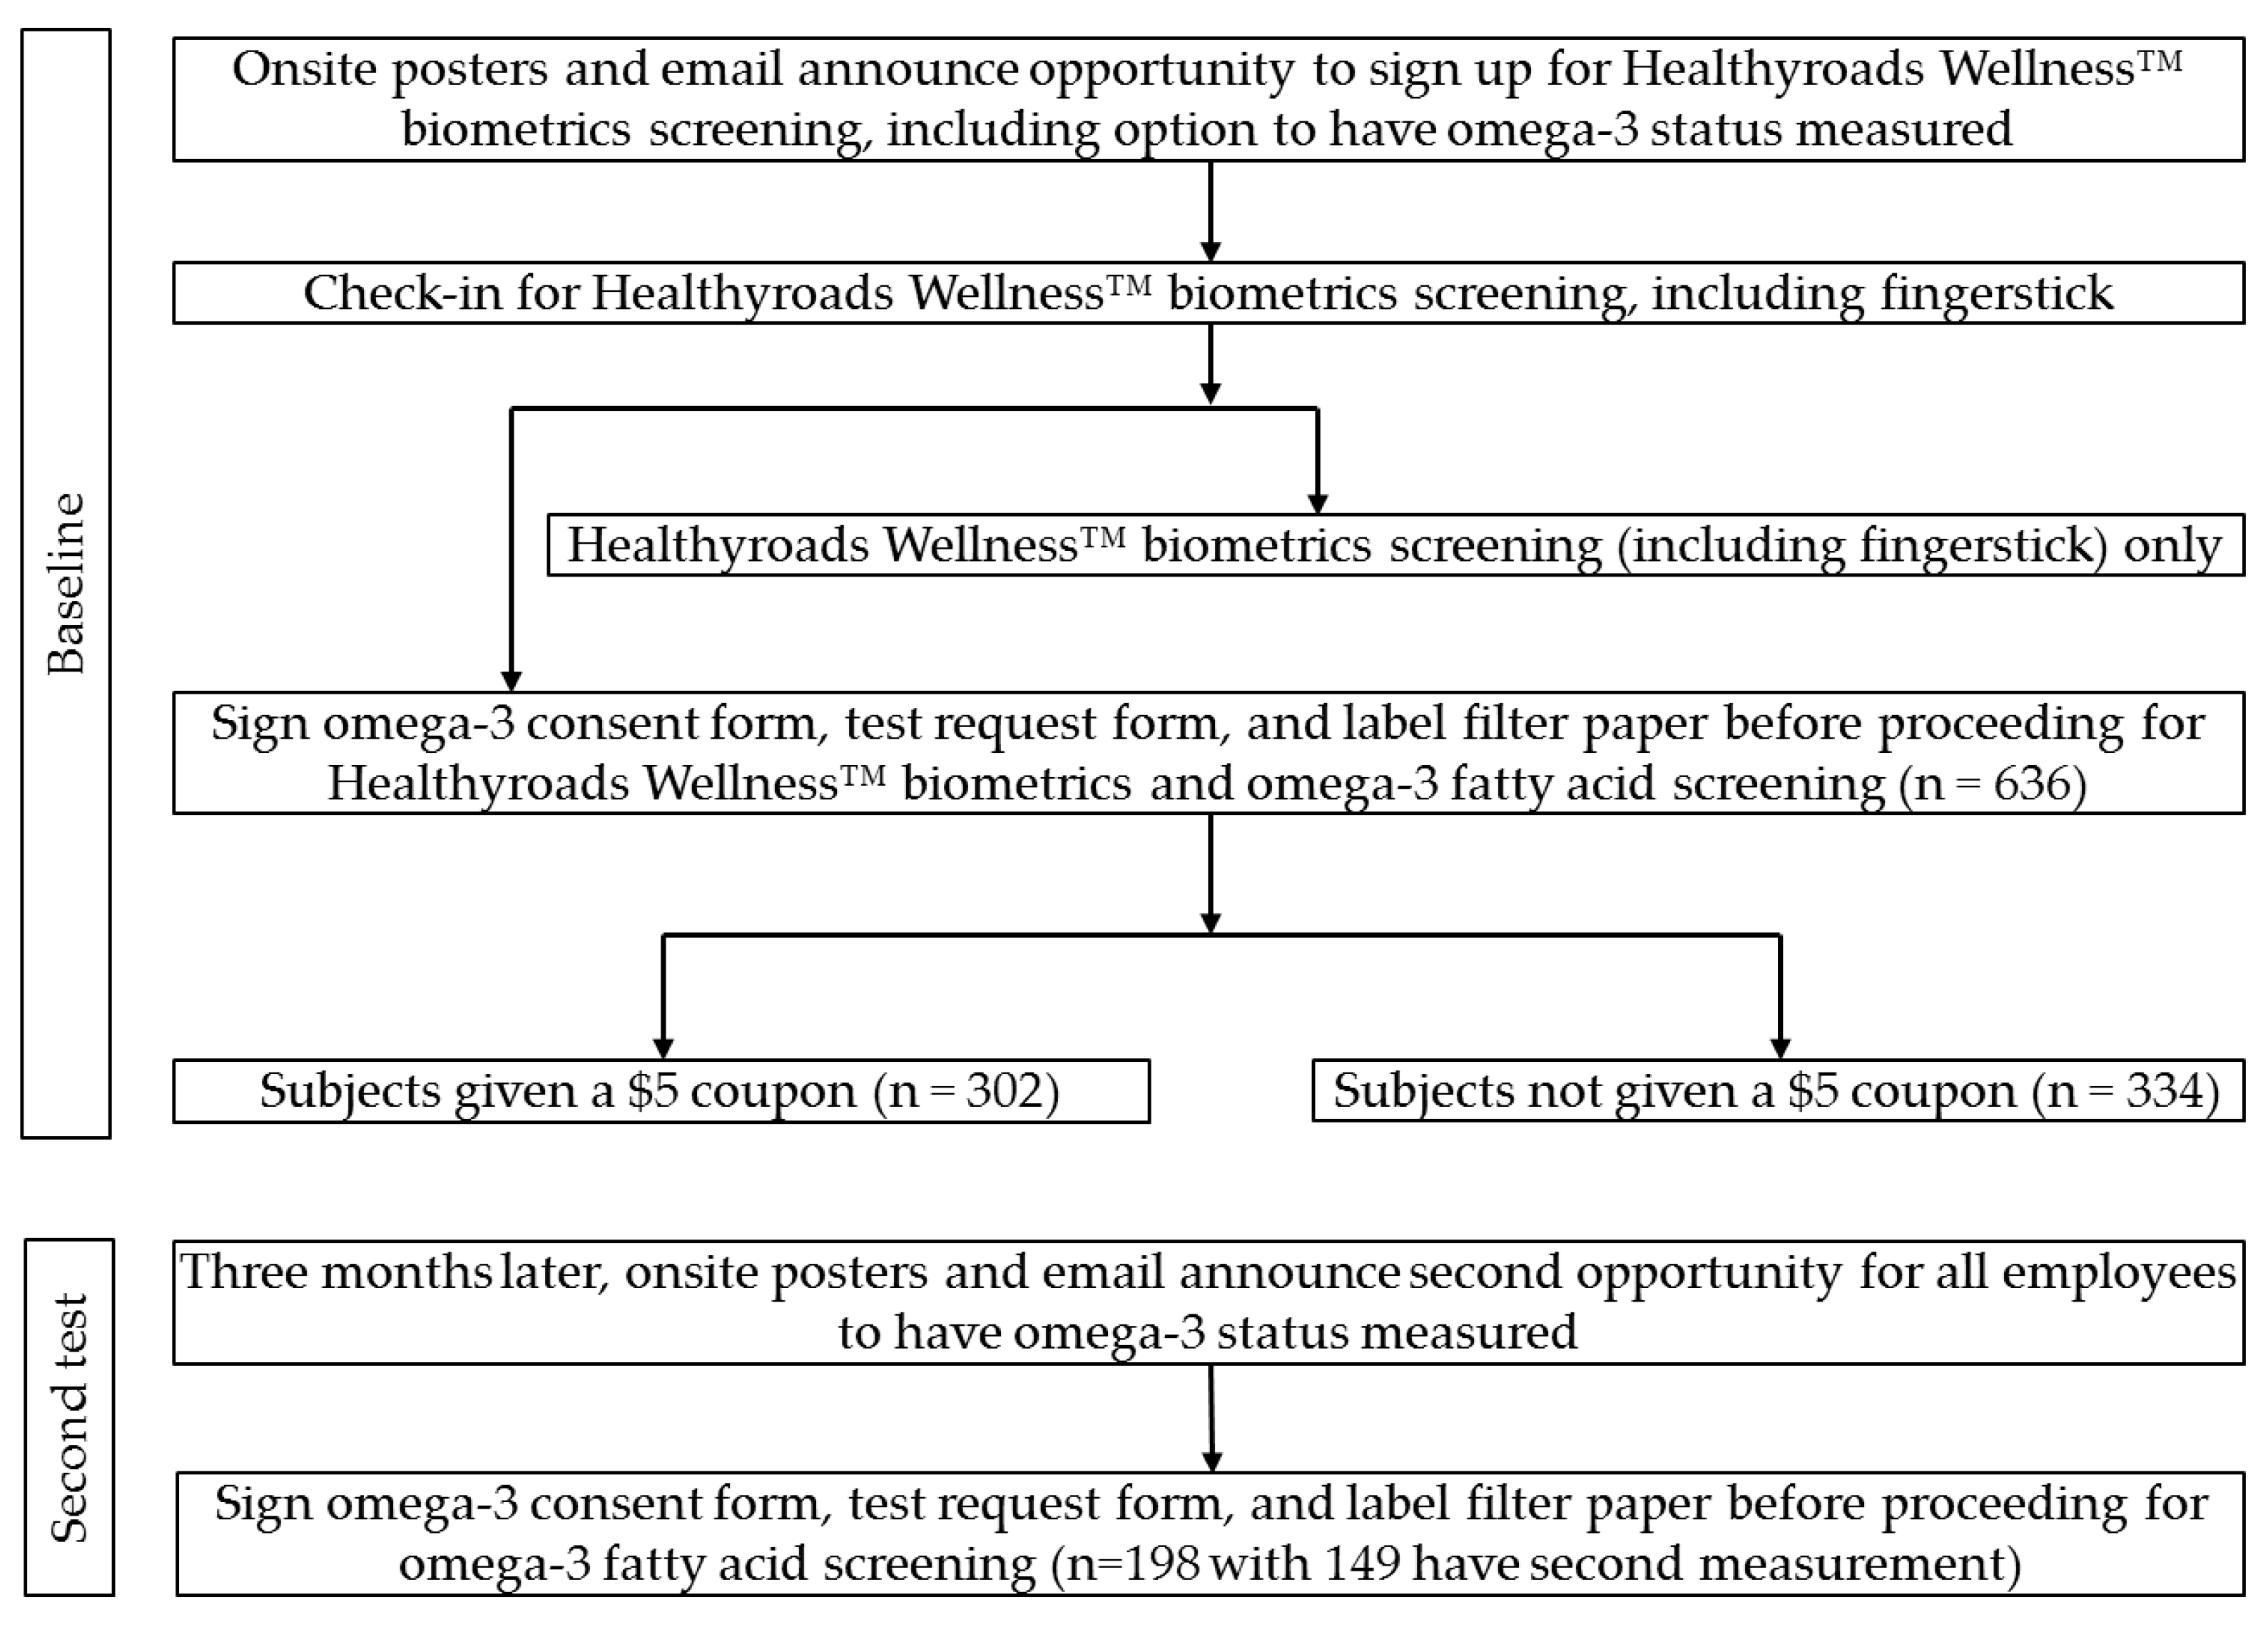
2. Materials and Methods
3. Results
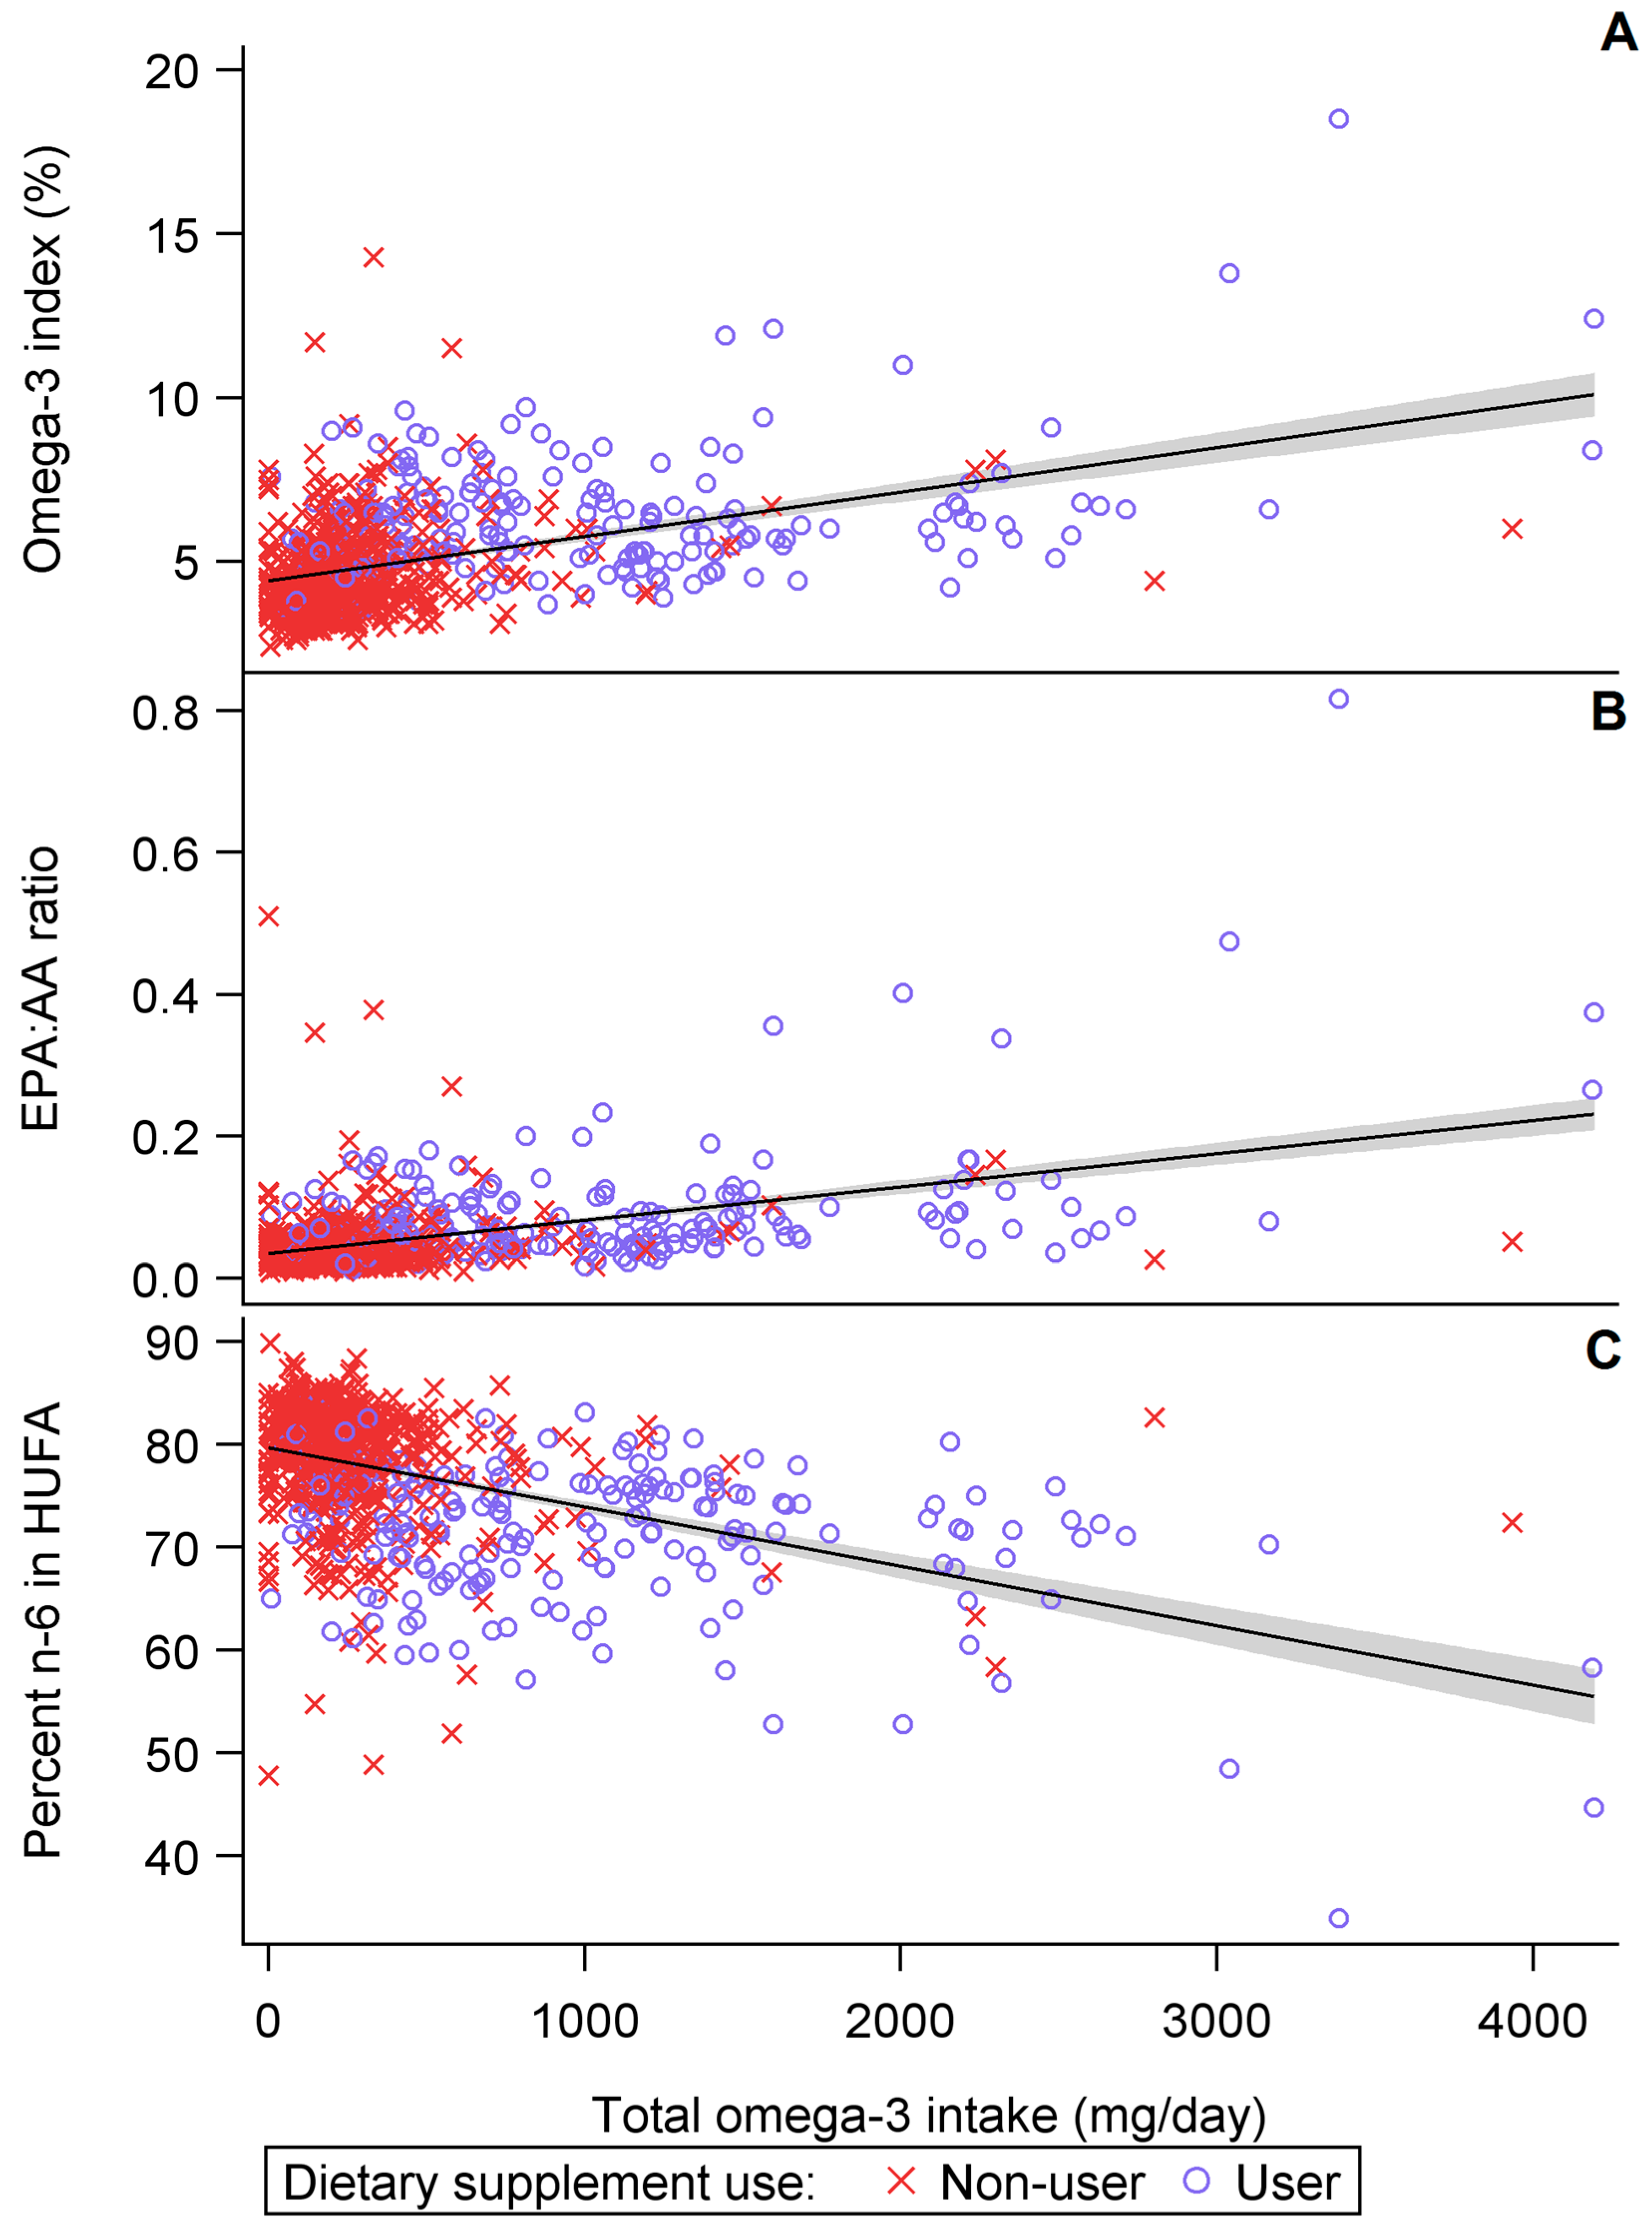
3.1. Cross-Sectional Results
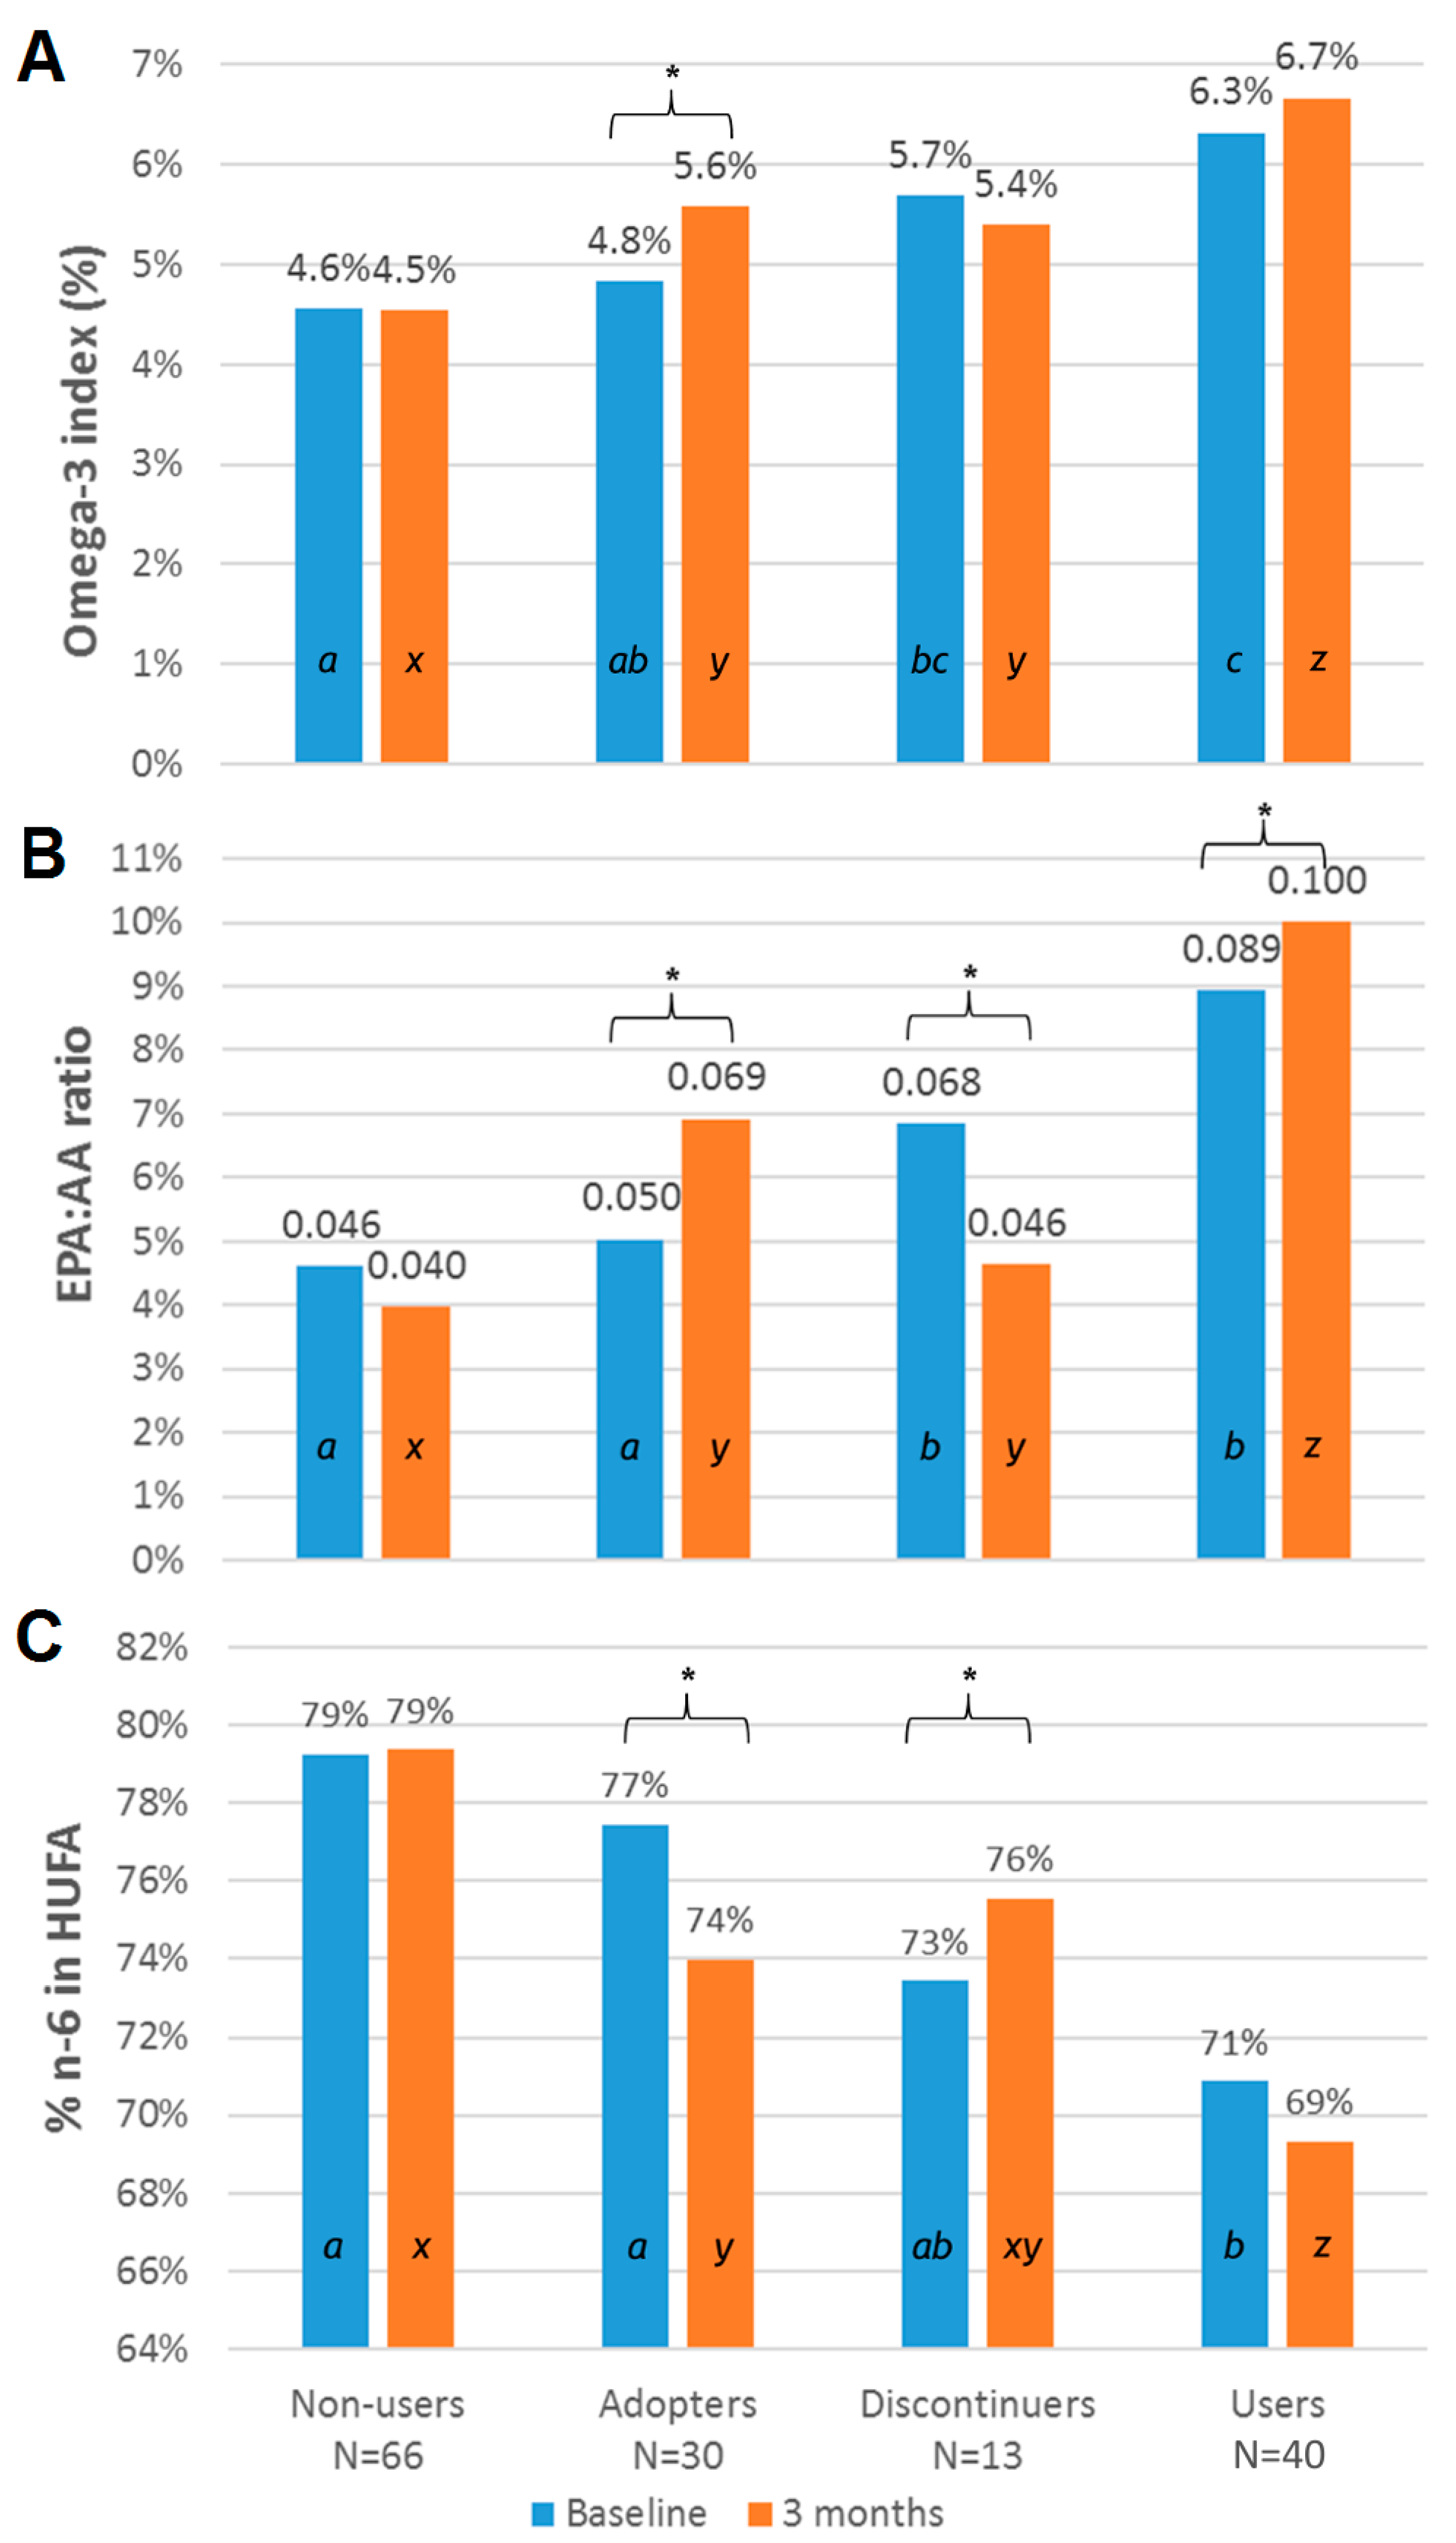
3.2. Subgroup Analysis of Baseline and Second Test Results
3.3. Subgroup Analysis Categorized by Omega-3 Supplement Use
4. Discussion
5. Conclusions
Supplementary Materials
Acknowledgments
Author Contributions
Conflicts of Interest
References
- Raatz, S.K.; Conrad, Z.; Johnson, L.K.; Picklo, M.J.; Jahns, L. Relationship of the Reported Intakes of Fat and Fatty Acids to Body Weight in US Adults. Nutrients 2017, 9, 438. [Google Scholar] [CrossRef] [PubMed]
- Dietary Reference Intakes for Energy, Carbohydrate, Fiber, Fat, Fatty Acids, Cholesterol, Protein, and Amino Acids; U.S. Institute of Medicine (Ed.) National Academies Press: Washington, DC, USA, 2005; ISBN 978-0-309-08525-0. [Google Scholar]
- Kris-Etherton, P.M.; Grieger, J.A.; Etherton, T.D. Dietary reference intakes for DHA and EPA. Prostaglandins Leukot. Essent. Fatty Acids 2009, 81, 99–104. [Google Scholar] [CrossRef] [PubMed]
- Pace-Asciak, C.R.; Smith, W.L. 16 Enzymes in the Biosynthesis and Catabolism of the Eicosanoids: Prostaglandins, Thromboxanes, Leukotrienes and Hydroxy Fatty Acids. In The Enzymes; Boyer, P.D., Ed.; Academic Press: New York, NY, USA, 1983; Volume 16, pp. 543–603. [Google Scholar]
- Burdge, G.C.; Calder, P.C. Conversion of alpha-linolenic acid to longer-chain polyunsaturated fatty acids in human adults. Reprod. Nutr. Dev. 2005, 45, 581–597. [Google Scholar] [CrossRef] [PubMed]
- Goyens, P.L.; Spilker, M.E.; Zock, P.L.; Katan, M.B.; Mensink, R.P. Conversion of α-linolenic acid in humans is influenced by the absolute amounts of α-linolenic acid and linoleic acid in the diet and not by their ratio. Am. J. Clin. Nutr. 2006, 84, 44–53. [Google Scholar] [PubMed]
- Lands, B.; Bibus, D.; Stark, K.D. Dynamic interactions of n-3 and n-6 fatty acid nutrients. Prostaglandins Leukot. Essent. Fatty Acids 2017, S0952-3278(16)30152-1. [Google Scholar] [CrossRef] [PubMed]
- Bibus, D.; Lands, B. Balancing proportions of competing omega-3 and omega-6 highly unsaturated fatty acids (HUFA) in tissue lipids. Prostaglandins Leukot. Essent. Fatty Acids 2015, 99, 19–23. [Google Scholar] [CrossRef] [PubMed]
- Lands, B.; Lamoreaux, E. Using 3–6 differences in essential fatty acids rather than 3/6 ratios gives useful food balance scores. Nutr. Metab. 2012, 9, 46. [Google Scholar] [CrossRef] [PubMed]
- Choque, B.; Catheline, D.; Rioux, V.; Legrand, P. Linoleic acid: Between doubts and certainties. Biochimie 2014, 96, 14–21. [Google Scholar] [CrossRef] [PubMed]
- Simopoulos, A.P.; DiNicolantonio, J.J. The importance of a balanced ω-6 to ω-3 ratio in the prevention and management of obesity. Open Heart 2016, 3, e000385. [Google Scholar] [CrossRef] [PubMed]
- Blasbalg, T.L.; Hibbeln, J.R.; Ramsden, C.E.; Majchrzak, S.F.; Rawlings, R.R. Changes in consumption of omega-3 and omega-6 fatty acids in the United States during the 20th century. Am. J. Clin. Nutr. 2011, 93, 950–962. [Google Scholar] [CrossRef] [PubMed]
- Nagahara, Y.; Motoyama, S.; Sarai, M.; Ito, H.; Kawai, H.; Takakuwa, Y.; Miyagi, M.; Shibata, D.; Takahashi, H.; Naruse, H.; et al. Eicosapentaenoic acid to arachidonic acid (EPA/AA) ratio as an associated factor of high risk plaque on coronary computed tomography in patients without coronary artery disease. Atherosclerosis 2016, 250, 30–37. [Google Scholar] [CrossRef] [PubMed]
- Hishikari, K.; Kimura, S.; Yamakami, Y.; Kojima, K.; Sagawa, Y.; Otani, H.; Sugiyama, T.; Kuwahara, T.; Hikita, H.; Takahashi, A.; et al. The prognostic value of the serum eicosapentaenoic acid to arachidonic acid ratio in relation to clinical outcomes after endovascular therapy in patients with peripheral artery disease caused by femoropopliteal artery lesions. Atherosclerosis 2015, 239, 583–588. [Google Scholar] [CrossRef] [PubMed]
- Ninomiya, T.; Nagata, M.; Hata, J.; Hirakawa, Y.; Ozawa, M.; Yoshida, D.; Ohara, T.; Kishimoto, H.; Mukai, N.; Fukuhara, M.; et al. Association between ratio of serum eicosapentaenoic acid to arachidonic acid and risk of cardiovascular disease: The Hisayama Study. Atherosclerosis 2013, 231, 261–267. [Google Scholar] [CrossRef] [PubMed]
- Allaire, J.; Couture, P.; Leclerc, M.; Charest, A.; Marin, J.; Lépine, M.-C.; Talbot, D.; Tchernof, A.; Lamarche, B. Randomized, crossover, head-to-head comparison of EPA and DHA supplementation to reduce inflammation markers in men and women: The Comparing EPA to DHA Study. Am. J. Clin. Nutr. 2016, 104, 280–287. [Google Scholar] [CrossRef] [PubMed]
- Flock, M.R.; Skulas-Ray, A.C.; Harris, W.S.; Etherton, T.D.; Fleming, J.A.; Kris-Etherton, P.M. Determinants of Erythrocyte Omega-3 Fatty Acid Content in Response to Fish Oil Supplementation: A Dose-Response Randomized Controlled Trial. J. Am. Heart Assoc. 2013, 2, e000513. [Google Scholar] [CrossRef] [PubMed]
- Leslie, C.C. Regulation of the specific release of arachidonic acid by cytosolic phospholipase A2. Prostaglandins Leukot. Essent. Fatty Acids 2004, 70, 373–376. [Google Scholar] [CrossRef] [PubMed]
- Richard, C.; Calder, P.C. Docosahexaenoic Acid. Adv. Nutr. Int. Rev. J. 2016, 7, 1139–1141. [Google Scholar] [CrossRef] [PubMed]
- Celis-Morales, C.; Livingstone, K.M.; Marsaux, C.F.M.; Macready, A.L.; Fallaize, R.; O’Donovan, C.B.; Woolhead, C.; Forster, H.; Walsh, M.C.; Navas-Carretero, S.; et al. Effect of personalized nutrition on health-related behaviour change: Evidence from the Food4Me European randomized controlled trial. Int. J. Epidemiol. 2016, 46, 578–588. [Google Scholar] [CrossRef] [PubMed]
- Murphy, R.; Yu, E.; Ciappio, E.; Mehta, S.; McBurney, M. Suboptimal Plasma Long Chain n-3 Concentrations are Common among Adults in the United States, NHANES 2003–2004. Nutrients 2015, 7, 10282–10289. [Google Scholar] [CrossRef] [PubMed]
- Kuratko, C. Food-frequency questionnaire for assessing long-chain ω-3 fatty-acid intake. Nutrition 2013, 29, 807–808. [Google Scholar] [CrossRef] [PubMed]
- Harris, W.S.; Polreis, J. Measurement of the Omega-3 Index in Dried Blood Spots. Ann. Clin. Lab. Res. 2016, 4, 137–143. [Google Scholar] [CrossRef]
- Harris, W.S.; von Schacky, C. The Omega-3 Index: A new risk factor for death from coronary heart disease? Prev. Med. 2004, 39, 212–220. [Google Scholar] [CrossRef] [PubMed]
- Patterson, A.C.; Chalil, A.; Aristizabal Henao, J.J.; Streit, I.T.; Stark, K.D. Omega-3 polyunsaturated fatty acid blood biomarkers increase linearly in men and women after tightly controlled intakes of 0.25, 0.5, and 1 g/d of EPA + DHA. Nutr. Res. 2015, 35, 1040–1051. [Google Scholar] [CrossRef] [PubMed]
- Micha, R.; Peñalvo, J.L.; Cudhea, F.; Imamura, F.; Rehm, C.D.; Mozaffarian, D. Association Between Dietary Factors and Mortality From Heart Disease, Stroke, and Type 2 Diabetes in the United States. JAMA 2017, 317, 912–924. [Google Scholar] [CrossRef] [PubMed]
- Langlois, K.; Ratnayake, W.M. Omega-3 Index of Canadian adults. Health Rep. 2015, 26, 3–11. [Google Scholar] [PubMed]
- Flock, M.R.; Harris, W.S.; Kris-Etherton, P.M. Long-chain omega-3 fatty acids: Time to establish a dietary reference intake. Nutr. Rev. 2013, 71, 692–707. [Google Scholar] [CrossRef] [PubMed]
- Plourde, M.; Chouinard-Watkins, R.; Rioux-Perreault, C.; Fortier, M.; Dang, M.T.M.; Allard, M.-J.; Tremblay-Mercier, J.; Zhang, Y.; Lawrence, P.; Vohl, M.-C.; et al. Kinetics of 13C-DHA before and during fish-oil supplementation in healthy older individuals. Am. J. Clin. Nutr. 2014, 100, 105–112. [Google Scholar] [CrossRef] [PubMed]
- West, A.L.; Burdge, G.C.; Calder, P.C. Lipid structure does not modify incorporation of EPA and DHA into blood lipids in healthy adults: A randomised-controlled trial. Br. J. Nutr. 2016, 116, 788–797. [Google Scholar] [CrossRef] [PubMed]
- Shikano, M.; Masuzawa, Y.; Yazawa, K.; Takayama, K.; Kudo, I.; Inoue, K. Complete discrimination of docosahexaenoate from arachidonate by 85 kDa cytosolic phospholipase A2 during the hydrolysis of diacyl- and alkenylacylglycerophosphoethanolamine. Biochim. Biophys. Acta BBA Lipids Lipid Metab. 1994, 1212, 211–216. [Google Scholar] [CrossRef]
- Allaire, J.; Harris, W.S.; Vors, C.; Charest, A.; Marin, J.; Jackson, K.H.; Tchernof, A.; Couture, P.; Lamarche, B. Supplementation with high-dose docosahexaenoic acid increases the Omega-3 Index more than high-dose eicosapentaenoic acid. Prostaglandins Leukot. Essent. Fat. Acids PLEFA 2017, 120, 8–14. [Google Scholar] [CrossRef] [PubMed]
- Dickinson, A.; MacKay, D. Health habits and other characteristics of dietary supplement users: A review. Nutr. J. 2014, 13, 14. [Google Scholar] [CrossRef] [PubMed]


| Parameter | All Participants | Participants Undergoing Retest | Participants Not Undergoing Retest |
|---|---|---|---|
| N | 834 | 149 | 685 |
| Sex (male), N (%) | 490 (59%) | 81 (54%) | 409 (59%) |
| Age (year), mean (SE) | 45 (0.4) | 45 (0.4) | 45 (0.9) |
| Omega-3 index, mean (SE) | 5.0% (0.1%) | 5.2% (0.1%) | 4.9% (0.1%) |
| Percent n-6 in HUFA, mean (SE) | 77.2% (0.2%) | 76.1% (0.3%) | 77.5% (0.5%) |
| EPA to AA ratio | 0.054 (0.001) | 0.060 (0.004) | 0.053 (0.002) |
| Baseline omega-3 index category, N (%) | |||
| <4% | 223 (27%) | 32 (21%) | 191 (28%) |
| 4–8% | 576 (69%) | 109 (73%) | 467 (68%) |
| >8% | 35 (4.2%) | 8 (5.4%) | 27 (3.9%) |
| Dietary supplement use, N (%) | 205 (25%) | 53 (36%) | 152 (22%) |
| All Participants | Dietary Supplement Users | Non-Users | Male | Female | |
|---|---|---|---|---|---|
| N | 834 | 205 | 628 | 490 | 344 |
| Food | 254 ± 9.4 | 271 ± 14 | 248 ± 12 | 256 ± 13 | 250 ± 14 |
| Supplement | 180 ± 17 | 867 ± 56 | 0 ± 0 | 187 ± 21 | 170 ± 29 |
| Total | 424 ± 19 | 965 * ± 53 | 248 ± 12 | 434 ± 23 | 410 ± 31 |
| Fatty Acid | All Participants | Men | Women | p-Value * |
|---|---|---|---|---|
| N | 834 | 490 | 344 | - |
| Omega-3 index | 5.0 ± 0.06 | 4.8 ± 0.07 | 5.2 ± 0.10 | 0.0005 |
| EPA:AA ratio | 0.054 ± 0.00 | 0.052 ± 0.00 | 0.057 ± 0.00 | 0.13 |
| n-6 in HUFA (%) | 77 ± 0.2 | 78 ± 0.3 | 77 ± 0.4 | 0.03 |
| C14:0 (%) | 0.63 ± 0.01 | 0.66 ± 0.01 | 0.60 ± 0.01 | 0.0025 |
| C16:0 (%) | 21.9 ± 0.1 | 22.0 ± 0.07 | 21.8 ± 0.1 | 0.09 |
| C16:1n7t (%) | 0.12 ± 0.00 | 0.12 ± 0.00 | 0.12 ± 0.00 | 0.8 |
| C16:1n7 (%) | 0.94 ± 0.02 | 0.90 ± 0.02 | 0.98 ± 0.03 | 0.029 |
| C18:0 (%) | 11.7 ± 0.04 | 11.7 ± 0.05 | 11.5 ± 0.06 | 0.027 |
| C18:1t (%) | 0.61 ± 0.01 | 0.62 ± 0.01 | 0.58 ± 0.01 | 0.0091 |
| C18:1n9 (%) | 18.6 ± 0.1 | 19.0 ± 0.1 | 18.1 ± 0.1 | 0.0001 |
| C18:2n6t (%) | 0.24 ± 0.00 | 0.23 ± 0.01 | 0.25 ± 0.01 | 0.0305 |
| C18:2n6 (%) | 22.9 ± 0.1 | 22.6 ± 0.1 | 23.4 ± 0.1 | 0.0001 |
| C20:0 (%) | 0.22 ± 0.00 | 0.21 ± 0.00 | 0.23 ± 0.00 | 0.0001 |
| C18:3n6 (%) | 0.29 ± 0.00 | 0.30 ± 0.01 | 0.28 ± 0.01 | 0.019 |
| C20:1n9 (%) | 0.28 ± 0.00 | 0.28 ± 0.01 | 0.29 ± 0.01 | 0.14 |
| C18:3n3 (%) | 0.40 ± 0.01 | 0.41 ± 0.01 | 0.39 ± 0.01 | 0.23 |
| C20:2n6 (%) | 0.24 ± 0.00 | 0.23 ± 0.00 | 0.26 ± 0.00 | 0.0001 |
| C22:0 (%) | 0.49 ± 0.01 | 0.47 ± 0.01 | 0.51 ± 0.01 | 0.0001 |
| C20:3n6 (%) | 1.6 ± 0.01 | 1.5 ± 0.01 | 1.6 ± 0.02 | 0.068 |
| C20:4n6 (%) | 11.0 ± 0.1 | 11.0 ± 0.08 | 11.0 ± 0.1 | 0.71 |
| C24:0 (%) | 0.7 ± 0.0 | 0.7 ± 0.0 | 0.7 ± 0.0 | 0.61 |
| C20:5n3 (%) | 0.58 ± 0.02 | 0.55 ± 0.02 | 0.61 ± 0.03 | 0.11 |
| C24:1n9 (%) | 0.61 ± 0.01 | 0.58 ± 0.01 | 0.65 ± 0.02 | 0.0004 |
| C22:4n6 (%) | 1.6 ± 0.01 | 1.6 ± 0.02 | 1.5 ± 0.02 | 0.004 |
| C22:5n6 (%) | 0.36 ± 0.01 | 0.36 ± 0.01 | 0.37 ± 0.01 | 0.27 |
| C22:5n3 (%) | 1.2 ± 0.01 | 1.2 ± 0.01 | 1.1 ± 0.01 | 0.0001 |
| C22:6n3 (%) | 2.6 ± 0.04 | 2.5 ± 0.04 | 2.8 ± 0.06 | 0.0001 |
| N | Food | Dietary Supplements | Total | |
|---|---|---|---|---|
| All | ||||
| Baseline | 149 | 263 ± 17 | 258 ± 42 | 508 ± 45 |
| Retest | 149 | 253 ± 15 | 445 ± 69 | 650 ± 65 |
| p-value 1 | >0.05 | 0.0136 | 0.0185 | |
| Men | ||||
| Baseline | 81 | 276 ± 195 | 385 ± 609 | 638 ± 611 |
| Retest | 81 | 273 ± 199 | 640 ± 965 | 850 ± 946 |
| p-value 2 | >0.05 | 0.039 | 0.039 | |
| Women | ||||
| Baseline | 68 | 248 ± 222 | 110 ± 275 | 354 ± 408 |
| Retest | 68 | 228 ± 164 | 208 ± 434 | 412 ± 481 |
| p-value 2 | >0.05 | >0.05 | >0.05 | |
| All | p-Value 1 | Men | Women | p-Value 2 | |
|---|---|---|---|---|---|
| N | 149 | - | 81 | 68 | - |
| Omega-3 index | 0.21 ± 0.11 | 0.02 | 0.26 ± 0.13 | 0.15 ± 0.12 | >0.05 |
| EPA:AA ratio | 0.002 ± 0.003 | >0.05 | 0.007 ± 0.005 | −0.004 ± 0.005 | >0.05 |
| Percent n-6 in HUFA | −0.884 ± 0.301 | <0.004 | −0.012 ± 0.004 | 0.009 ± 0.003 | >0.05 |
| Baseline | Second Test | |||||||||
|---|---|---|---|---|---|---|---|---|---|---|
| Fatty Acid | Non-Users | Adopters | Discontinuers | Users | p-Value 1 | Non-Users | Adopters | Discontinuers | Users | p-Value 2 |
| N | 66 | 30 | 13 | 40 | - | 66 | 30 | 13 | 40 | |
| Omega-3 index | 4.6 ± 0.2 | 4.8 ± 0.2 | 5.7 ± −0.4 | 6.3 ± 0.2 | 0.0005 | 4.5 ± −0.1 | 5.6 ± 0.2 | 5.4 ± 0.4 | 6.7 ± 0.2 | <0.0001 |
| EPA:AA ratio | 0.05 ± 0.01 | 0.05 ± 0.00 | 0.07 ± 0.01 | 0.09 ± 0.01 | 0.79 | 0.04 ± 0.00 | 0.07 ± 0.01 | 0.05 ± 0.01 | 0.10 ± 0.01 | <0.0001 |
| n-6 in HUFA (%) | 79 ± 0.7 | 79 ± 0.8 | 73 ± 1.6 | 71 ± 0.9 | 0.03 | 79 ± 0.5 | 74 ± 0.9 | 76 ± 1.7 | 69 ± 1.0 | <0.0001 |
| C14:0 (%) | 0.64 ± 0.03 | 0.70 ± 0.06 | 0.60 ± 0.08 | 0.62 ± 0.04 | 0.0025 | 0.60 ± 0.04 | 0.66 ± 0.09 | 0.52 ± 0.06 | 0.65 ± 0.05 | 0.54 |
| C16:0 (%) | 22.0 ± 0.2 | 22.1 ± 0.3 | 22.1 ± 0.5 | 21.7 ± 0.2 | 0.09 | 22.0 ± 0.2 | 22.0 ± 0.4 | 21.6 ± 0.4 | 21.8 ± 0.3 | 0.84 |
| C16:1n7t (%) | 0.13 ± 0.01 | 0.13 ± 0.01 | 0.09 ± 0.01 | 0.12 ± 0.01 | 0.8 | 0.12 ± 0.00 | 0.11 ± 0.01 | 0.10 ± 0.00 | 0.12 ± 0.01 | 0.28 |
| C16:1n7 (%) | 0.98 ± 0.1 | 1.10 ± 0.1 | 0.89 ± 0.1 | 0.92 ± −0.1 | 0.029 | 0.93 ± 0.1 | 0.92 ± 0.1 | 0.81 ± 0.1 | 0.87 ± 0.1 | 0.90 |
| C18:0 (%) | 11.5 ± 0.1 | 11.4 ± 0.2 | 11.4 ± 0.4 | 11.5 ± 0.1 | 0.027 | 12.2 ± 0.2 | 11.9 ± 0.3 | 12.2 ± 0.4 | 12.2 ± 0.2 | 0.82 |
| C18:1t (%) | 0.64 ± 0.02 | 0.53 ± 0.03 | 0.49 ± 0.06 | 0.56 ± 0.02 | 0.0091 | 0.59 ± 0.03 | 0.59 ± 0.04 | 0.49 ± 0.06 | 0.55 ± 0.03 | 0.29 |
| C18:1n9 (%) | 18.4 ± 0.3 | 19.1 ± 0.3 | 18.7 ± 0.6 | 18.4 ± 0.4 | <0.0001 | 18.5 ± 0.3 | 19.3 ± 0.5 | 19.5 ± 0.6 | 18.9 ± 0.4 | 0.42 |
| C18:2n6t (%) | 0.26 ± 0.02 | 0.26 ± 0.03 | 0.22 ± 0.02 | 0.21 ± 0.01 | 0.0305 | 0.21 ± 0.01 | 0.19 ± 0.01 | 0.21 ± 0.02 | 0.18 ± 0.01 | 0.22 |
| C18:2n6 (%) | 23.3 ± 0.3 | 22.9 ± 0.5 | 24.1 ± 0.6 | 23.1 ± 0.4 | <0.0001 | 22.3 ± 0.3 | 22.4 ± 0.5 | 22.2 ± 1.1 | 22.4 ± 0.5 | 0.99 |
| C20:0 (%) | 0.22 ± 0.01 | 0.24 ± 0.01 | 0.22 ± 0.02 | 0.23 ± 0.01 | <0.0001 | 0.21 ± 0.01 | 0.20 ± 0.01 | 0.21 ± 0.02 | 0.19 ± 0.01 | 0.50 |
| C18:3n6 (%) | 0.32 ± 0.02 | 0.34 ± 0.02 | 0.27 ± 0.03 | 0.29 ± 0.01 | 0.0191 | 0.31 ± 0.02 | 0.26 ± 0.02 | 0.27 ± 0.04 | 0.25 ± 0.02 | 0.13 |
| C20:1n9 (%) | 0.34 ± 0.02 | 0.33 ± 0.03 | 0.25 ± 0.02 | 0.29 ± 0.02 | 0.14 | 0.25 ± 0.01 | 0.24 ± 0.01 | 0.28 ± 0.02 | 0.23 ± 0.01 | 0.10 |
| C18:3n3 (%) | 0.41 ± 0.02 | 0.39 ± 0.03 | 0.39 ± 0.03 | 0.39 ± 0.02 | 0.23 | 0.37 ± 0.02 | 0.41 ± 0.03 | 0.36 ± 0.05 | 0.41 ± 0.04 | 0.62 |
| C20:2n6 (%) | 0.24 ± 0.01 | 0.26 ± 0.01 | 0.26 ± 0.02 | 0.23 ± 0.01 | <0.0001 | 0.25 ± 0.01 | 0.22 ± 0.01 | 0.24 ± 0.01 | 0.22 ± 0.01 | 0.037 |
| C22:0 (%) | 0.49 ± 0.02 | 0.50 ± 0.03 | 0.49 ± 0.04 | 0.53 ± 0.02 | <0.0001 | 0.49 ± 0.02 | 0.44 ± 0.03 | 0.48 ± 0.04 | 0.42 ± 0.02 | 0.19 |
| C20:3n6 (%) | 1.6 ± 0.05 | 1.6 ± 0.06 | 1.5 ± 0.08 | 1.5 ± 0.06 | 0.068 | 1.6 ± 0.04 | 1.5 ± 0.06 | 1.5 ± 0.07 | 1.5 ± 0.06 | 0.15 |
| C20:4n6 (%) | 11.4 ± 0.2 | 10.8 ± 0.4 | 10.5 ± 0.5 | 10.8 ± 0.3 | 0.71 | 11.7 ± 0.2 | 10.9 ± 0.4 | 11.4 ± 0.6 | 10.7 ± 0.3 | 0.06 |
| C24:0 (%) | 0.63 ± 0.03 | 0.64 ± 0.05 | 0.66 ± 0.08 | 0.76 ± 0.05 | 0.61 | 0.68 ± 0.05 | 0.53 ± 0.05 | 0.59 ± 0.07 | 0.52 ± 0.04 | 0.06 |
| C20:5n3 (%) | 0.519 ± 0.1 | 0.53 ± 0.0 | 0.72 ± 0.1 | 0.91 ± 0.1 | 0.11 | 0.46 ± 0.0 | 0.73 ± 0.1 | 0.52 ± 0.1 | 1.04 ± 0.1 | <0.0001 |
| C24:1n9 (%) | 0.58 ± 0.03 | 0.61 ± 0.06 | 0.61 ± 0.09 | 0.69 ± 0.04 | 0.0004 | 0.59 ± 0.04 | 0.47 ± 0.04 | 0.55 ± 0.04 | 0.46 ± 0.03 | 0.0377 |
| C22:4n6 (%) | 1.63 ± 0.05 | 1.49 ± 0.06 | 1.21 ± 0.08 | 1.26 ± 0.06 | 0.0038 | 1.75 ± 0.05 | 1.48 ± 0.08 | 1.45 ± 0.09 | 1.27 ± 0.07 | <0.0001 |
| C22:5n6 (%) | 0.37 ± 0.01 | 0.35 ± 0.02 | 0.30 ± 0.02 | 0.35 ± 0.03 | 0.27 | 0.37 ± 0.01 | 0.31 ± 0.02 | 0.30 ± 0.02 | 0.29 ± 0.03 | 0.008 |
| C22:5n3 (%) | 1.13 ± 0.03 | 1.11 ± 0.04 | 1.13 ± 0.09 | 1.29 ± 0.04 | <0.0001 | 1.20 ± 0.04 | 1.26 ± 0.06 | 1.22 ± 0.10 | 1.36 ± 0.06 | 0.09 |
| C22:6n3 (%) | 2.32 ± 0.1 | 2.54 ± 0.2 | 3.12 ± 0.3 | 3.48 ± 0.1 | <0.0001 | 2.37 ± 0.1 | 3.01 ± 0.2 | 3.07 ± 0.3 | 3.65 ± 0.2 | <0.0001 |
© 2017 by the authors. Licensee MDPI, Basel, Switzerland. This article is an open access article distributed under the terms and conditions of the Creative Commons Attribution (CC BY) license (http://creativecommons.org/licenses/by/4.0/).
Share and Cite
McBurney, M.I.; Bird, J.K. Impact of Biological Feedback and Incentives on Blood Fatty Acid Concentrations, Including Omega-3 Index, in an Employer-Based Wellness Program. Nutrients 2017, 9, 842. https://doi.org/10.3390/nu9080842
McBurney MI, Bird JK. Impact of Biological Feedback and Incentives on Blood Fatty Acid Concentrations, Including Omega-3 Index, in an Employer-Based Wellness Program. Nutrients. 2017; 9(8):842. https://doi.org/10.3390/nu9080842
Chicago/Turabian StyleMcBurney, Michael I., and Julia K. Bird. 2017. "Impact of Biological Feedback and Incentives on Blood Fatty Acid Concentrations, Including Omega-3 Index, in an Employer-Based Wellness Program" Nutrients 9, no. 8: 842. https://doi.org/10.3390/nu9080842
APA StyleMcBurney, M. I., & Bird, J. K. (2017). Impact of Biological Feedback and Incentives on Blood Fatty Acid Concentrations, Including Omega-3 Index, in an Employer-Based Wellness Program. Nutrients, 9(8), 842. https://doi.org/10.3390/nu9080842