Effects of an Encapsulated Fruit and Vegetable Juice Concentrate on Obesity-Induced Systemic Inflammation: A Randomised Controlled Trial


Abstract
:1. Introduction
2. Materials and Methods
2.1. Study Design
2.2. Randomization
2.3. Study Supplement
2.4. Ethics
2.5. Anthropometric Measures and Quality of Life
2.6. Blood Pressure
2.7. Dual Energy X-ray Absorptiometry
2.8. Peripheral Blood Biomarkers
2.9. Plasma Antioxidant Levels
2.10. Dietary Analysis
2.11. Microarray Analysis
2.12. PCR Analysis
2.13. Sample Size and Statistical Analysis
3. Results
3.1. Part 1: Analysis of Full Cohort
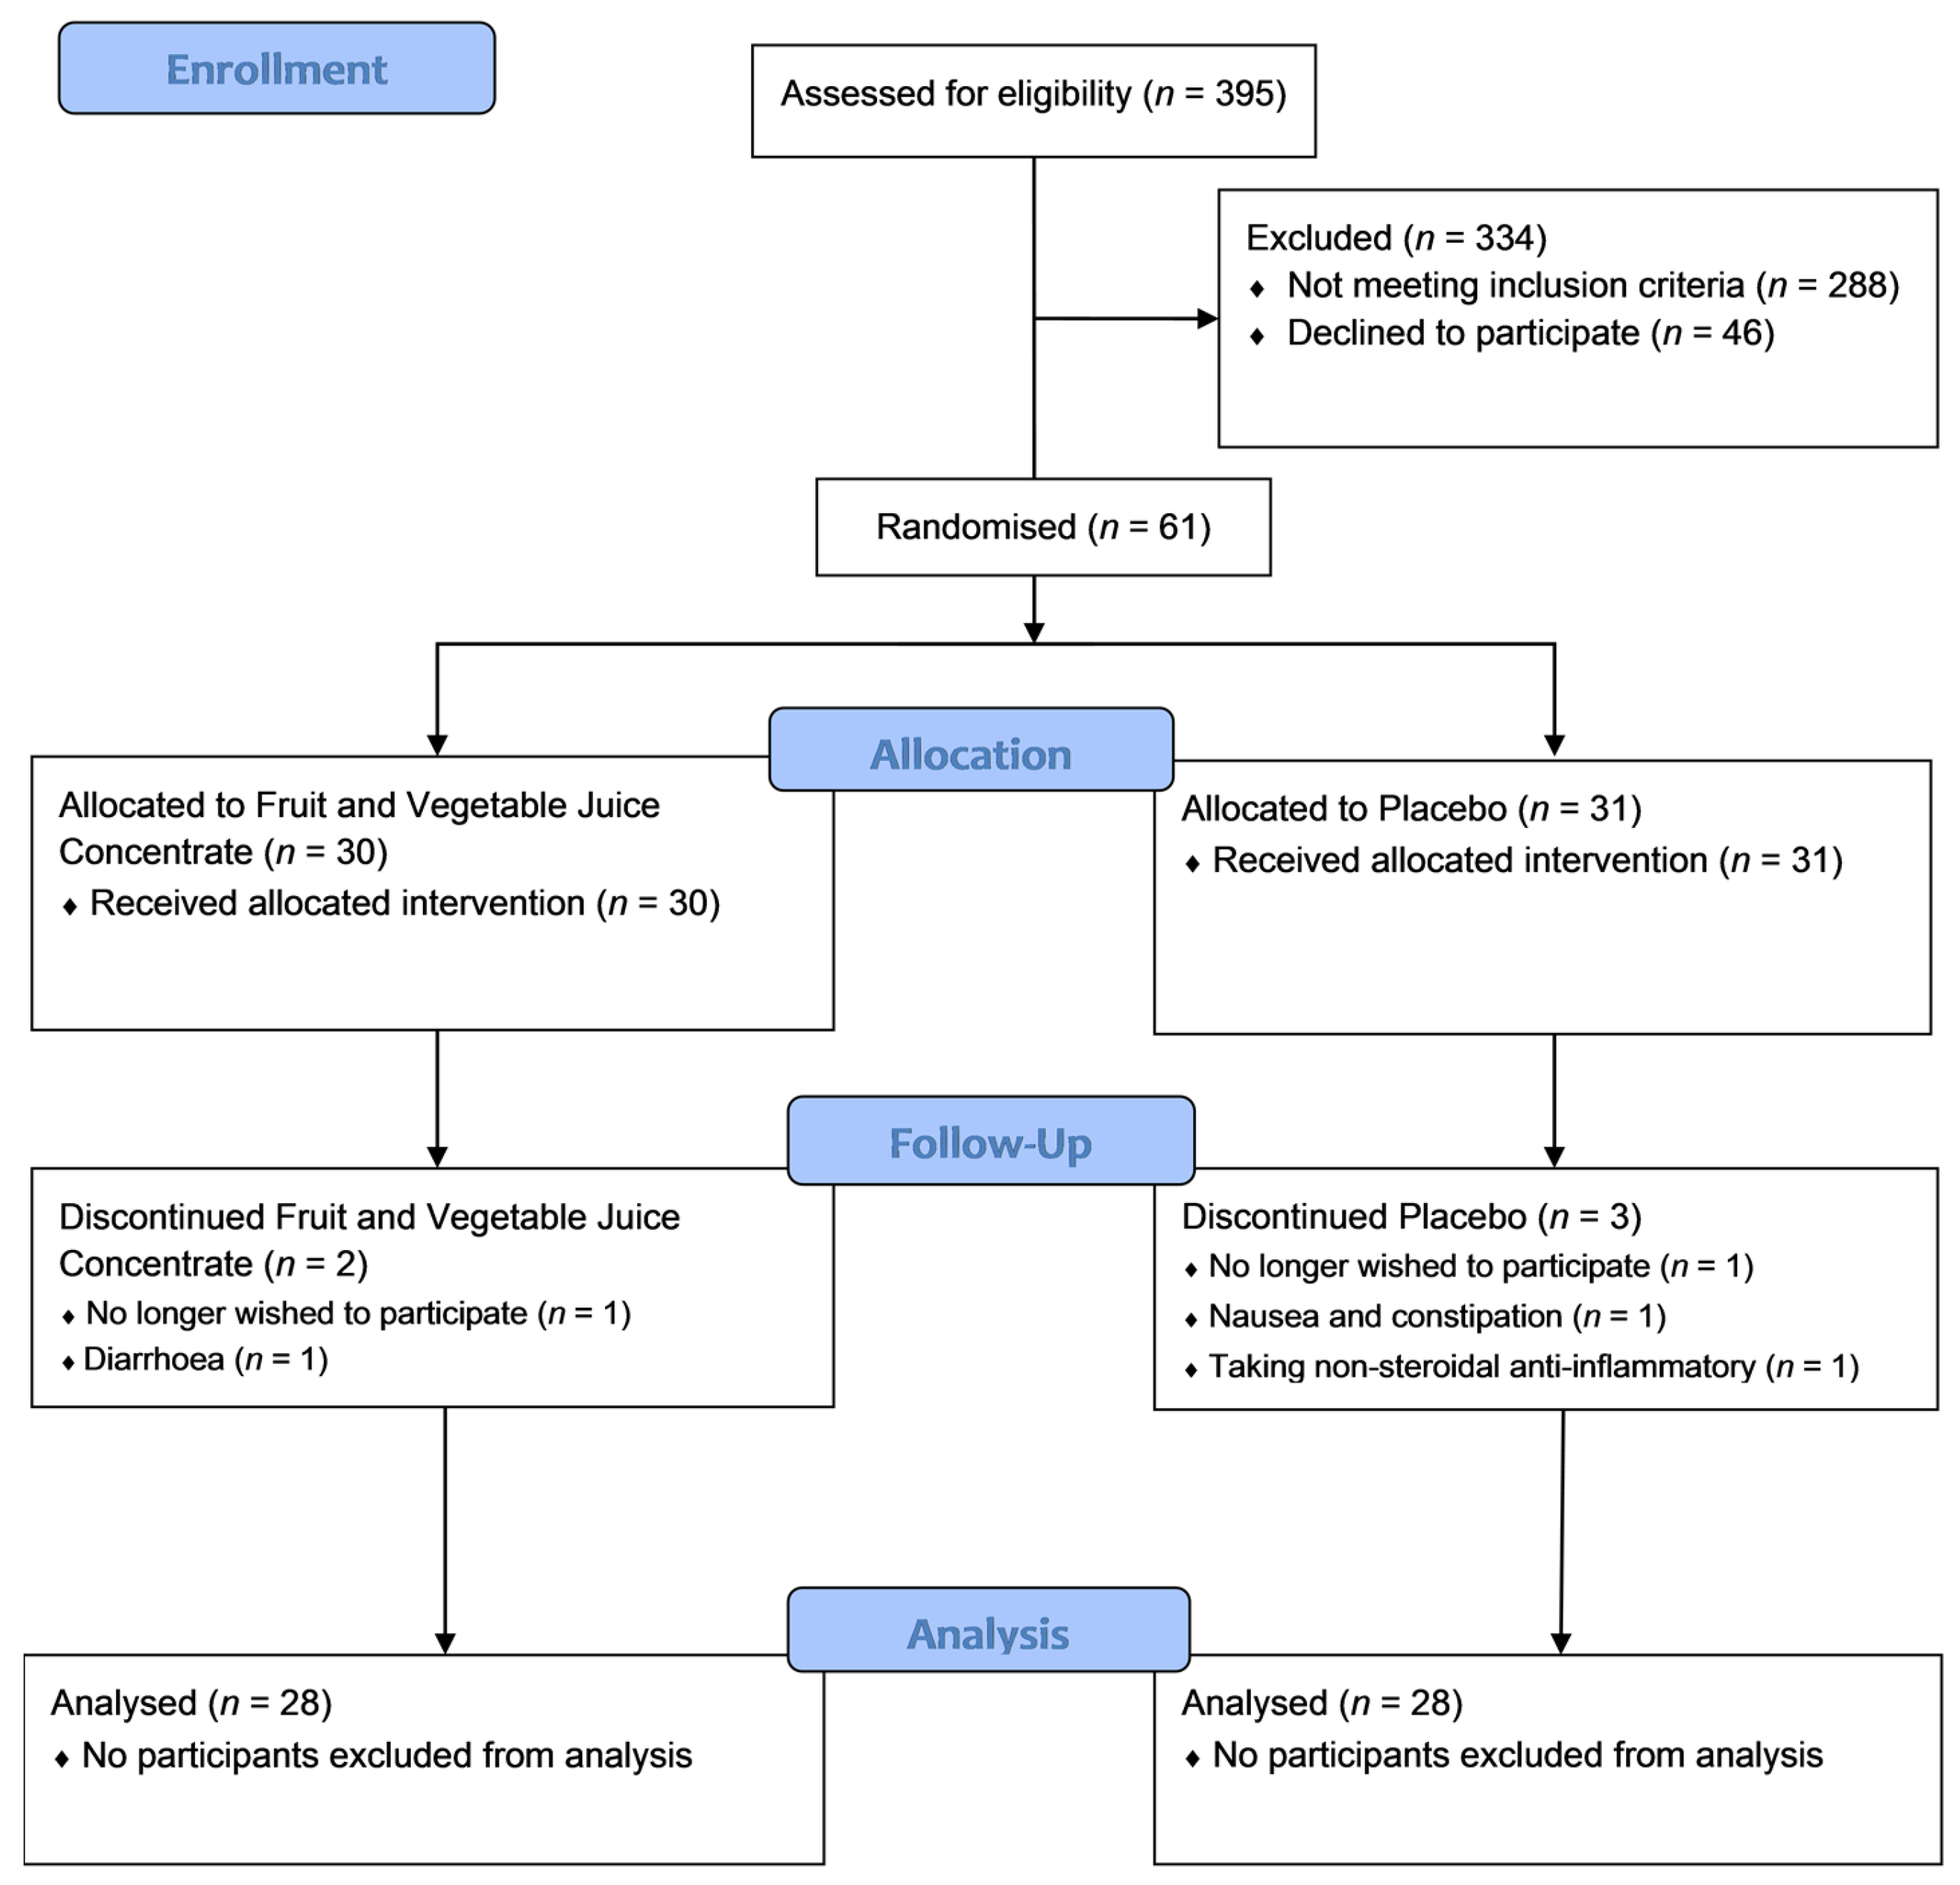
3.1.1. Participant Flow
3.1.2. Subject Demographics, Dietary Intake and Plasma Nutrient Levels
3.1.3. Lipid Profile, Glycated Haemoglobin and Systemic Inflammatory Markers
3.1.4. Body Composition, Blood Pressure and Quality of Life before and after the Intervention
3.2. Part 2: Analysis of a Subgroup with High Baseline CRP (≥3.0 mg/mL)
3.2.1. Subject Demographics, Dietary Intake and Plasma Nutrient Levels
3.2.2. Blood Lipids, Glycated Haemoglobin and Systemic Inflammatory Markers
3.2.3. Body Composition, Blood Pressure and Quality of Life Before and after the Intervention
3.2.4. Peripheral Blood Gene Expression
4. Discussion
5. Summary and Conclusions
Acknowledgments
Author Contributions
Conflicts of Interest
References
- WHO Global Database on Body Mass Index. Available online: http://apps.who.int/bmi/ (accessed on 11 July 2013).
- Ogden, C.L.; Carroll, M.D.; Kit, B.K.; Flegal, K.M. PRevalence of childhood and adult obesity in the United States, 2011–2012. JAMA 2014, 311, 806–814. [Google Scholar] [CrossRef] [PubMed]
- Australian Bureau of Statistics. Australian Health Survey: Updated Results; Australian Bureau of Statistics: Canberra, Australia, 2011–2012.
- Damcott, C.M.; Sack, P.; Shuldiner, A.R. The genetics of obesity. Endocrinol. Metab. Clin. N. Am. 2003, 32, 761–786. [Google Scholar] [CrossRef]
- Mraz, M.; Haluzik, M. The role of adipose tissue immune cells in obesity and low-grade inflammation. J. Endocrinol. 2014, 222, R113–R127. [Google Scholar] [CrossRef] [PubMed]
- Kalupahana, N.S.; Moustaid-Moussa, N.; Claycombe, K.J. Immunity as a link between obesity and insulin resistance. Mol. Aspects Med. 2012, 33, 26–34. [Google Scholar] [CrossRef] [PubMed]
- Lumeng, C.N.; Bodzin, J.L.; Saltiel, A.R. Obesity induces a phenotypic switch in adipose tissue macrophage polarization. J. Clin. Investig. 2007, 117, 175–184. [Google Scholar] [CrossRef] [PubMed]
- Siriwardhanaa, N.; Kalupahanab, N.S.; Cekanovac, M.; LeMieuxa, M.; Greerd, B.; Moustaid-Moussaa, N. Modulation of adipose tissue inflammation by bioactive food compounds. J. Nutr. Biochem. 2013, 24, 613–623. [Google Scholar] [CrossRef] [PubMed]
- Fantuzzi, G. Adipose tissue, adipokines, and inflammation. J. Allergy Clin. Immunol. 2005, 115, 911–919. [Google Scholar] [CrossRef] [PubMed]
- Bulló, M.; Casas-Agustench, P.; Amigó-Correig, P.; Aranceta, J.; Salas-Salvadó, J. Inflammation, obesity and comorbidities: The role of diet. Public Health Nutr. 2007, 10, 1164–1172. [Google Scholar] [CrossRef] [PubMed]
- Poulain, M.; Doucet, M.; Major, G.C.; Drapeau, V.; Sériès, F.; Boulet, L.-P.; Tremblay, A.; Maltais, F. The effect of obesity on chronic respiratory diseases: Pathophysiology and therapeutic strategies. CMAJ 2006, 174, 1293–1299. [Google Scholar] [CrossRef] [PubMed]
- Cawthorn, W.P.; Sethi, J.K. TNF-α and adipocyte biology. FEBS Lett. 2008, 582, 117–131. [Google Scholar] [CrossRef] [PubMed]
- Zarkesh-Esfahani, H.; Pockley, A.G.; Wu, Z.; Hellewell, P.G.; Weetman, A.P.; Ross, R.J. Leptin indirectly activates human neutrophils via induction of TNF-α. J. Immunol. 2004, 172, 1809–1814. [Google Scholar] [CrossRef] [PubMed]
- Das, U.N. Is Obesity an Inflammatory Condition? Nutrition 2001, 17, 953–966. [Google Scholar] [CrossRef]
- Vitseva, O.I.; Tanriverdi, K.; Tchkonia, T.T.; Kirkland, J.L.; McDonnell, M.E.; Apovian, C.M.; Freedman, J.; Gokce, N. Inducible Toll-like receptor and NF-kappaB regulatory pathway expression in human adipose tissue. Obesity (Silver Spring) 2008, 16, 932–937. [Google Scholar] [CrossRef] [PubMed]
- Bost, F.; Aouadi, M.; Caron, L.; Binetruy, B. The role of MAPKs in adipocyte differentiation and obesity. Biochimie 2005, 87, 51–56. [Google Scholar] [CrossRef] [PubMed]
- Gauthier, M.S.; O’Brien, E.L.; Bigornia, S.; Mott, M.; Cacicedo, J.M.; Xu, X.J.; Gokce, N.; Apovian, C.; Ruderman, N. Decreased AMP-activated protein kinase activity is associated with increased inflammation in visceral adipose tissue and with whole-body insulin resistance in morbidly obese humans. Biochem. Biophys. Res. Commun. 2011, 404, 382–387. [Google Scholar] [CrossRef] [PubMed]
- Moller, D.E.; Berger, J.P. Role of PPARs in the regulation of obesity-related insulin sensitivity and inflammation. Int. J. Obes. Relat. Metab. Disord. 2003, 27, S17–S21. [Google Scholar] [CrossRef] [PubMed]
- Dandona, P.; Aljada, A.; Bandyopadhyay, A. Inflammation: The link between insulin resistance, obesity and diabetes. Trends. Immunol. 2004, 25, 4–7. [Google Scholar] [CrossRef] [PubMed]
- Franks, P.W. Obesity, inflammatory markers and cardiovascular disease: Distinguishing causality from confounding. J. Hum. Hypertens 2006, 20, 837–840. [Google Scholar] [CrossRef] [PubMed]
- Nicklas, B.J.; Ambrosius, W.; Messier, S.P.; Miller, G.D.; Penninx, B.W.J.H.; Loeser, R.F.; Palla, S.; Bleecker, E.; Pahor, M. Diet-induced weight loss, exercise, and chronic inflammation in older, obese adults: A randomized controlled clinical trial. Am. J. Clin. Nutr. 2004, 79, 544–551. [Google Scholar] [PubMed]
- Forsythe, L.K.; Wallace, J.M.; Livingstone, M.B.E. Obesity and inflammation: The effects of weight loss. Nutr. Res. Rev. 2008, 21, 117–133. [Google Scholar] [CrossRef] [PubMed]
- Jung, S.H.; Park, H.S.; Kim, K.-S.; Choi, W.H.; Ahn, C.W.; Kim, B.T.; Kim, S.M.; Lee, S.Y.; Ahn, S.M.; Kim, Y.K.; et al. Effect of weight loss on some serum cytokines in human obesity: Increase in IL-10 after weight loss. J. Nutr. Biochem. 2008, 19, 371–375. [Google Scholar] [CrossRef] [PubMed]
- Barinas-Mitchell, E.; Kuller, L.H.; Sutton-Tyrrell, K.; Hegazi, R.; Harper, P.; Mancino, J.; Kelley, D.E. Effect of Weight Loss and Nutritional Intervention on Arterial Stiffness in Type 2 Diabetes. Diabetes Care 2006, 29, 2218–2222. [Google Scholar] [CrossRef] [PubMed]
- Marfella, R.; Esposito, K.; Siniscalchi, M.; Cacciapuoti, F.; Giugliano, F.; Labriloa, D.; Ciotola, M.; Di Palo, C.; Misso, L.; Giugliano, D. Effect of Weight Loss on Cardiac Synchronization and Proinflammatory Cytokines in Premenopausal Obese Women. Diabetes Care 2004, 27, 47–52. [Google Scholar] [CrossRef] [PubMed]
- Selvin, E.; Paynter, N.P.; Erlinger, T.P. The Effect of Weight Loss on C-Reactive Protein: A Systematic Review. Arch. Intern. Med. 2007, 167, 31–39. [Google Scholar] [CrossRef] [PubMed]
- Higami, Y.; Barger, J.L.; Page, G.P.; Allison, D.B.; Smith, S.R.; Prolla, T.A.; Weindruch, R. Energy restriction lowers the expression of genes linked to inflammation, the cytoskeleton, the extracellular matrix, and angiogenesis in mouse adipose tissue. J. Nutr. 2006, 136, 343–352. [Google Scholar] [PubMed]
- Larson-Meyer, D.E.; Heilbronn, L.K.; Redman, L.M.; Newcomer, B.R.; Frisard, M.I.; Anton, S.; Smith, S.R.; Alfonso, A.; Ravussin, E. Effect of calorie restriction with or without exercise on insulin sensitivity, beta-cell function, fat cell size, and ectopic lipid in overweight subjects. Diabetes Care 2006, 29, 1337–1344. [Google Scholar] [CrossRef] [PubMed]
- Jarvi, A.; Karlstrom, B.; Vessby, B.; Becker, W. Increased intake of fruits and vegetables in overweight subjects: Effects on body weight, body composition, metabolic risk factors and dietary intake. Br. J. Nutr. 2016, 115, 1760–1768. [Google Scholar] [CrossRef] [PubMed]
- Alvarez-Suarez, J.M.; Giampieri, F.; Tulipani, S.; Casoli, T.; Di Stefano, G.; González-Paramás, A.M.; Santos-Buelga, C.; Busco, F.; Quiles, J.L.; Cordero, M.D.; et al. One-month strawberry-rich anthocyanin supplementation ameliorates cardiovascular risk, oxidative stress markers and platelet activation in humans. J. Nutr. Biochem. 2014, 25, 289–294. [Google Scholar] [CrossRef] [PubMed]
- Esfahani, A.; Wong, J.M.; Truan, J.; Villa, C.R.; Mirrahimi, A.; Srichaikul, K.; Kendall, C.W. Health effects of mixed fruit and vegetable concentrates: A systematic review of the clinical interventions. J. Am. Coll. Nutr. 2011, 30, 285–294. [Google Scholar] [CrossRef] [PubMed]
- Heale, P.; Stockwell, T.; Dietze, P.; Chikritzhs, T.; Catalano, P. Patterns of Alcohol Consumption in Australia, 1998; National Alcohol Indicators Project, Bulletin No. 3. National Drug Research Institute; Curtin University of Technology: Perth, Australia, 2000. [Google Scholar]
- Lamprecht, M.; Obermayer, G.; Steinbauer, K.; Cvirn, G.; Hofmann, L.; Ledinski, G.; Greilberger, J.F.; Hallstroem, S. Supplementation with a juice powder concentrate and exercise decrease oxidation and inflammation, and improve the microcirculation in obese women: Randomised controlled trial data. Br. J. Nutr. 2013, 110, 1685–1695. [Google Scholar] [CrossRef] [PubMed]
- Bresciani, L.; Calani, L.; Cossu, M.; Mena, P.; Sayegh, M.; Ray, S.; Del Rio, D. (Poly)phenolic characterization of three food supplements containing 36 different fruits, vegetables and berries. PharmaNutrition 2015, 3, 11–19. [Google Scholar] [CrossRef]
- Ware, J.E., Jr.; Sherbourne, C.D. The MOS 36-item short-form health survey (SF-36). Conceptual framework and item selection. Med. Care 1992, 30, 473–483. [Google Scholar] [CrossRef] [PubMed]
- Wood, L.G.; Gibson, P.G. Reduced circulating antioxidant defences are associated with airway hyper-responsiveness, poor control and severe disease pattern in asthma. Br. J. Nutr. 2010, 103, 735–741. [Google Scholar] [CrossRef] [PubMed]
- Wood, L.G.; Garg, M.L.; Powell, H.; Gibson, P.G. Lycopene-rich treatments modify noneosinophilic airway inflammation in asthma: Proof of concept. Free Radic. Res. 2008, 42, 94–102. [Google Scholar] [CrossRef] [PubMed]
- Wood, L.G.; Garg, M.L.; Blake, R.J.; Garcia-Caraballo, S.; Gibson, P.G. Airway and circulating levels of carotenoids in asthma and healthy controls. J. Am. Coll. Nutr. 2005, 24, 448–455. [Google Scholar] [CrossRef] [PubMed]
- Giles, G.; Ireland, P. Dietary Questionnaire for Epidemiological Studies, version 2; The Cancer Council Victoria: Melbourne, Australia, 1996.
- National Health and Medical Research Council. Australian Dietary Guidelines; National Health and Medical Research Council: Canberra, Australia, 2013.
- National Center for Biotechnology Information. Gene Expression Omnibus (GEO). 2017. Available online: https://www.ncbi.nlm.nih.gov/geo/query/acc.cgi?acc=GSE87454 (accessed on 8 September 2016).
- Andersen, C.L.; Jensen, J.L.; Orntoft, T.F. Normalization of real-time quantitative reverse transcription-PCR data: A model-based variance estimation approach to identify genes suited for normalization, applied to bladder and colon cancer data sets. Cancer Res. 2004, 64, 5245–5250. [Google Scholar] [CrossRef] [PubMed]
- Dupont, W.D.; Plummer, W.D. Power and Sample Size Calculations for Studies Involving Linear Regression. Controll. Clin. Trials 1998, 19, 589–601. [Google Scholar] [CrossRef]
- Du, P.; Kibbe, W.A.; Lin, S.M. Lumi: A pipeline for processing Illumina microarray. Bioinformatics 2008, 24, 1547–1548. [Google Scholar] [CrossRef] [PubMed]
- Ritchie, M.E.; Phipson, B.; Wu, D.; Hu, Y.; Law, C.W.; Shi, W.; Smyth, G.K. Limma powers differential expression analyses for RNA-sequencing and microarray studies. Nucl. Acids Res. 2015, 43, e47. [Google Scholar] [CrossRef] [PubMed]
- Chang, J.T.; Nevins, J.R. GATHER: A systems approach to interpreting genomic signatures. Bioinformatics 2006, 22, 2926–2933. [Google Scholar] [CrossRef] [PubMed]
- Rees, K.; Dyakova, M.; Ward, K.; Thorogood, M.; Brunner, E. Dietary advice for reducing cardiovascular risk. Cochrane Database Syst. Rev. 2013. [Google Scholar] [CrossRef]
- Anderson, J.W.; Konz, E.C. Obesity and disease management: Effects of weight loss on comorbid conditions. Obes. Res. 2001, 9, 326S–334S. [Google Scholar] [CrossRef] [PubMed]
- Dattilo, A.M.; Kris-Etherton, P.M. Effects of weight reduction on blood lipids and lipoproteins: A meta-analysis. Am. J. Clin. Nutr. 1992, 56, 320–328. [Google Scholar] [PubMed]
- Canas, J.A.; Damaso, L.; Altomare, A.; Killen, K.; Hossain, J.; Balagopal, P. Insulin resistance and adiposity in relation to serum beta-carotene levels. J. Pediatr. 2012, 161, 58–64. [Google Scholar] [CrossRef] [PubMed]
- Annuzzi, G.; Bozzetto, L.; Costabile, G.; Giacco, R.; Mangione, A.; Anniballi, G.; Vitale, M.; Vetrani, C.; Cipriano, P.; Della Corte, G.; et al. Diets naturally rich in polyphenols improve fasting and postprandial dyslipidemia and reduce oxidative stress: A randomized controlled trial. Am. J. Clin. Nutr. 2014, 99, 463–471. [Google Scholar] [CrossRef] [PubMed]
- Olivier, L.M.; Chambliss, K.L.; Michael Gibson, K.; Krisans, S.K. Characterization of phosphomevalonate kinase: Chromosomal localization, regulation, and subcellular targeting. J. Lipid Res. 1999, 40, 672–679. [Google Scholar] [PubMed]
- Aripirala, S.; Gonzalez-Pacanowska, D.; Oldfield, E.; Kaiser, M.; Amzel, L.M.; Gabelli, S.B. Structural and thermodynamic basis of the inhibition of Leishmania major farnesyl diphosphate synthase by nitrogen-containing bisphosphonates. Acta Crystallogr. Sect. D Biol. Crystallogr. 2014, 70, 802–810. [Google Scholar] [CrossRef] [PubMed]
- Canas, J.A.; Damaso, L.; Hossain, J.; Balagopal, P.B. Fatty acid binding proteins 4 and 5 in overweight prepubertal boys: Effect of nutritional counselling and supplementation with an encapsulated fruit and vegetable juice concentrate. J. Nutr. Sci. 2015, 4, e39. [Google Scholar] [CrossRef] [PubMed]
- Esposito, K.; Marfella, R.; Ciotola, M.; Di Palo, C.; Giugliano, F.; Giugliano, G.; D’Armiento, M.; D’Andrea, F.; Giugliano, D. Effect of Mediterranean-Style diet on endothelial dysfunction and markers of vascular inflammation in the metabolic syndrome. JAMA 2004, 292, 1440–1446. [Google Scholar] [CrossRef] [PubMed]
- Watzl, B.; Kulling, S.E.; Moseneder, J.; Barth, S.W.; Bub, A. A 4-wk intervention with high intake of carotenoid-rich vegetables and fruit reduces plasma C-reactive protein in healthy, nonsmoking men. Am. J. Clin. Nutr. 2005, 82, 1052–1058. [Google Scholar] [PubMed]
- Jin, Y.; Cui, X.; Singh, U.P.; Chumanevich, A.A.; Harmon, B.; Cavicchia, P.; Hofseth, A.B.; Kotakadi, V.; Stroud, B.; Volate, S.R.; et al. Systemic inflammatory load in humans is suppressed by consumption of two formulations of dried, encapsulated juice concentrate. Mol. Nutr. Food Res. 2010, 54, 1506–1514. [Google Scholar] [CrossRef] [PubMed]
- Seif El-Din, S.H.; El-Lakkany, N.M.; El-Naggar, A.A.; Hammam, O.A.; Abd El-Latif, H.A.; Ain-Shoka, A.A.; Ebeid, F.A. Effects of rosuvastatin and/or beta-carotene on non-alcoholic fatty liver in rats. Res. Pharm. Sci. 2015, 10, 275–287. [Google Scholar] [PubMed]
- Bai, S.K.; Lee, S.J.; Na, H.J.; Ha, K.S.; Han, J.A.; Lee, H.; Kwon, Y.G.; Chung, C.K.; Kim, Y.M. beta-Carotene inhibits inflammatory gene expression in lipopolysaccharide-stimulated macrophages by suppressing redox-based NF-kappaB activation. Exp. Mol. Med. 2005, 37, 323–334. [Google Scholar] [CrossRef] [PubMed]
- Salminen, A.; Hyttinen, J.M.T.; Kaarniranta, K. AMP-activated protein kinase inhibits NF-κB signaling and inflammation: Impact on healthspan and lifespan. J. Mol. Med. 2011, 89, 667–676. [Google Scholar] [CrossRef] [PubMed]
- Lage, R.; Dieguez, C.; Vidal-Puig, A.; Lopez, M. AMPK: A metabolic gauge regulating whole-body energy homeostasis. Trends Mol. Med. 2008, 14, 539–549. [Google Scholar] [CrossRef] [PubMed]
- Ruderman, N.B.; Cacicedo, J.M.; Itani, S.; Yagihashi, N.; Saha, A.K.; Ye, J.M.; Chen, K.; Zou, M.; Carling, D.; Boden, G.; et al. Malonyl-CoA and AMP-activated protein kinase (AMPK): Possible links between insulin resistance in muscle and early endothelial cell damage in diabetes. Biochem. Soc. Trans. 2003, 31, 202–206. [Google Scholar] [CrossRef] [PubMed]
- Vinué, Á.; Andrés-Blasco, I.; Herrero-Cervera, A.; Piqueras, L.; Andrés, V.; Burks, D.J.; Sanz, M.J.; González-Navarro, H. Ink4/Arf locus restores glucose tolerance and insulin sensitivity by reducing hepatic steatosis and inflammation in mice with impaired IRS2-dependent signalling. Biochim. Biophys. Acta (BBA) Mol. Basis Dis. 2015, 1852, 1729–1742. [Google Scholar] [CrossRef] [PubMed]
- Hur, W.; Lee, J.H.; Kim, S.W.; Kim, J.H.; Bae, S.H.; Kim, M.; Hwang, D.; Kim, Y.S.; Park, T.; Um, S.J.; et al. Downregulation of microRNA-451 in non-alcoholic steatohepatitis inhibits fatty acid-induced proinflammatory cytokine production through the AMPK/AKT pathway. Int. J. Biochem. Cell Biol. 2015, 64, 265–276. [Google Scholar] [CrossRef] [PubMed]
- Yoshizaki, T.; Schenk, S.; Imamura, T.; Babendure, J.L.; Sonoda, N.; Bae, E.J.; Oh, D.Y.; Lu, M.; Milne, J.C.; Westphal, C.; et al. SIRT1 inhibits inflammatory pathways in macrophages and modulates insulin sensitivity. Am. J. Physiol. Endocrinol. Metab. 2010, 298, E419–E428. [Google Scholar] [CrossRef] [PubMed]
- Salminen, A.; Kauppinen, A.; Suuronen, T.; Kaarniranta, K. SIRT1 longevity factor suppresses NF-kappaB -driven immune responses: Regulation of aging via NF-kappaB acetylation? Bioessays 2008, 30, 939–942. [Google Scholar] [CrossRef] [PubMed]
- Yang, H.; Zhang, W.; Pan, H.; Feldser, H.G.; Lainez, E.; Miller, C.; Leung, S.; Zhong, Z.; Zhao, H.; Sweitzer, S.; et al. SIRT1 activators suppress inflammatory responses through promotion of p65 deacetylation and inhibition of NF-kappaB activity. PLoS ONE 2012, 7, e46364. [Google Scholar]
- Elton, L.; Carpentier, I.; Staal, J.; Driege, Y.; Haegman, M.; Beyaert, R. MALT1 cleaves the E3 ubiquitin ligase HOIL-1 in activated T cells, generating a dominant negative inhibitor of LUBAC-induced NF-kappaB signaling. FEBS J. 2016, 283, 403–412. [Google Scholar] [CrossRef] [PubMed]
- Ba, X.; Garg, N.J. Signaling mechanism of poly(ADP-ribose) polymerase-1 (PARP-1) in inflammatory diseases. Am. J. Pathol. 2011, 178, 946–955. [Google Scholar] [CrossRef] [PubMed]
- Piret, B.; Schoonbroodt, S.; Piette, J. The ATM protein is required for sustained activation of NF-kappaB following DNA damage. Oncogene 1999, 18, 2261–2271. [Google Scholar] [CrossRef] [PubMed]
- Macrae, K.; Stretton, C.; Lipina, C.; Blachnio-Zabielska, A.; Baranowski, M.; Gorski, J.; Marley, A.; Hundal, H.S. Defining the role of DAG, mitochondrial function, and lipid deposition in palmitate-induced proinflammatory signaling and its counter-modulation by palmitoleate. J. Lipid Res. 2013, 54, 2366–2378. [Google Scholar] [CrossRef] [PubMed]
- Kim, H.; Zamel, R.; Bai, X.-H.; Liu, M. PKC Activation Induces Inflammatory Response and Cell Death in Human Bronchial Epithelial Cells. PLoS ONE 2013, 8, e64182. [Google Scholar] [CrossRef] [PubMed]
- Hellmann, J.; Tang, Y.; Zhang, M.J.; Hai, T.; Bhatnagar, A.; Srivastava, S.; Spite, M. Atf3 negatively regulates Ptgs2/Cox2 expression during acute inflammation. Prostaglandins Other Lipid Mediat. 2015, 116–117, 49–56. [Google Scholar] [CrossRef] [PubMed]
- Badrichani, A.Z.; Stroka, D.M.; Bilbao, G.; Curiel, D.T.; Bach, F.H.; Ferran, C. Bcl-2 and Bcl-X(L) serve an anti-inflammatory function in endothelial cells through inhibition of NF-κB. J. Clin. Investig. 1999, 103, 543–553. [Google Scholar] [CrossRef] [PubMed]
- Zehavi, L.; Schayek, H.; Jacob-Hirsch, J.; Sidi, Y.; Leibowitz-Amit, R.; Avni, D. MiR-377 targets E2F3 and alters the NF-kB signaling pathway through MAP3K7 in malignant melanoma. Mol. Cancer 2015, 14, 68. [Google Scholar] [CrossRef] [PubMed]
- Guijarro-Munoz, I.; Compte, M.; Alvarez-Cienfuegos, A.; Alvarez-Vallina, L.; Sanz, L. Lipopolysaccharide activates Toll-like receptor 4 (TLR4)-mediated NF-kappaB signaling pathway and proinflammatory response in human pericytes. J. Biol. Chem. 2014, 289, 2457–2468. [Google Scholar] [CrossRef] [PubMed]
- Liu, J.; Zhu, L.; Xie, G.L.; Bao, J.F.; Yu, Q. Let-7 miRNAs Modulate the Activation of NF-kappaB by Targeting TNFAIP3 and Are Involved in the Pathogenesis of Lupus Nephritis. PLoS ONE 2015, 10, e0121256. [Google Scholar]
- Wullaert, A.; Heyninck, K.; Janssens, S.; Beyaert, R. Ubiquitin: Tool and target for intracellular NF-kappaB inhibitors. Trends Immunol. 2006, 27, 533–540. [Google Scholar] [CrossRef] [PubMed]
- Huang, J.; Teng, L.; Li, L.; Liu, T.; Li, L.; Chen, D.; Xu, L.G.; Zhai, Z.; Shu, H.B. ZNF216 Is an A20-like and IkappaB kinase gamma-interacting inhibitor of NFkappaB activation. J. Biol. Chem. 2004, 279, 16847–16853. [Google Scholar] [CrossRef] [PubMed]
- Sears, D.D.; Hsiao, G.; Hsiao, A.; Yu, J.G.; Courtney, C.H.; Ofrecio, J.M.; Chapman, J.; Subramaniam, S. Mechanisms of human insulin resistance and thiazolidinedione-mediated insulin sensitization. Proc. Natl. Acad. Sci. USA 2009, 106, 18745–18750. [Google Scholar] [CrossRef] [PubMed]
- Valverde, A.M.; Burks, D.J.; Fabregat, I.; Fisher, T.L.; Carretero, J.; White, M.F.; Benito, M. Molecular mechanisms of insulin resistance in IRS-2-deficient hepatocytes. Diabetes 2003, 52, 2239–2248. [Google Scholar] [CrossRef] [PubMed]
- Ahmad, F.; Lindh, R.; Tang, Y.; Ruishalme, I.; ÖSt, A.; Sahachartsiri, B.; StrÅLfors, P.; Degerman, E.; Manganiello, V.C. Differential regulation of adipocyte PDE3B in distinct membrane compartments by insulin and the β(3)-adrenergic receptor agonist CL316243: Effects of caveolin-1 knockdown on formation/maintenance of macromolecular signalling complexes. Biochem. J. 2009, 424, 399–410. [Google Scholar] [CrossRef] [PubMed]
- Terashima, M.; Fujita, Y.; Togashi, Y.; Sakai, K.; De Velasco, M.A.; Tomida, S.; Nishio, K. KIAA1199 interacts with glycogen phosphorylase kinase beta-subunit (PHKB) to promote glycogen breakdown and cancer cell survival. Oncotarget 2014, 5, 7040–7050. [Google Scholar] [CrossRef] [PubMed]
- Zhang, B.L.; Xu, R.L.; Zhang, J.; Zhao, X.X.; Wu, H.; Ma, L.P.; Hu, J.Q.; Zhang, J.L.; Ye, Z.; Zheng, X.; et al. Identification and functional analysis of a novel PRKAG2 mutation responsible for Chinese PRKAG2 cardiac syndrome reveal an important role of non-CBS domains in regulating the AMPK pathway. J. Cardiol. 2013, 62, 241–248. [Google Scholar] [CrossRef] [PubMed]
- Galic, S.; Hauser, C.; Kahn, B.B.; Haj, F.G.; Neel, B.G.; Tonks, N.K.; Tiganis, T. Coordinated Regulation of Insulin Signaling by the Protein Tyrosine Phosphatases PTP1B and TCPTP. Mol. Cell. Biol. 2005, 25, 819–829. [Google Scholar] [CrossRef] [PubMed]
- Saucedo, L.J.; Gao, X.; Chiarelli, D.A.; Li, L.; Pan, D.; Edgar, B.A. Rheb promotes cell growth as a component of the insulin/TOR signalling network. Nat. Cell Biol. 2003, 5, 566–571. [Google Scholar] [CrossRef] [PubMed]
- Chen, J.; He, J.; Hamm, L.; Batuman, V.; Whelton, P.K. Serum antioxidant vitamins and blood pressure in the United States population. Hypertension 2002, 40, 810–816. [Google Scholar] [CrossRef] [PubMed]
- John, J.H.; Ziebland, S.; Yudkin, P.; Roe, L.S.; Neil, H.A.W. Effects of fruit and vegetable consumption on plasma antioxidant concentrations and blood pressure: A randomised controlled trial. Lancet 2002, 359, 1969–1974. [Google Scholar] [CrossRef]
- Pickering, T. Blood pressure measurement and detection of hypertension. Lancet 1994, 344, 31–35. [Google Scholar] [CrossRef]
- Sevenoaks, M.J.; Stockley, R.A. Chronic obstructive pulmonary disease, inflammation and co-morbidity—A common inflammatory phenotype. Respir. Res. 2006, 7, 70. [Google Scholar] [CrossRef] [PubMed]


| F&V Concentrate (n = 28) | Placebo (n = 28) | p-Value | |
|---|---|---|---|
| Demographics | |||
| Gender (male/female) | 11/17 | 13/15 | 0.788 |
| Age (years) a | 61.4 ± 1.5 | 57.9 ± 1.4 | 0.091 |
| BMI (kg/m2) a | 34.6 ± 0.7 | 37.0 ± 1.3 | 0.271 |
| Smoking Status (never/ex) | 14/14 | 16/12 | 0.592 |
| Nutrient Intake | |||
| Total Energy (KJ/day) b | 7785 (6145, 10,371) | 6986 (5573, 8448) | 0.110 |
| Total fat (g/day) b | 78 (63, 107) | 70 (59, 87) | 0.229 |
| SFA (g/day) b | 32 (25, 45) | 28 (24, 37) | 0.205 |
| PUFA (g/day) a | 12 ± 1 | 12 ± 1 | 0.626 |
| MUFA (g/day) a | 31 ± 2 | 28 ± 2 | 0.286 |
| Protein (g/day) a | 101 ± 7 | 77 (73, 99) | 0.103 |
| Carbohydrates (g/day) a | 202 ± 15 | 177 ± 11 | 0.169 |
| Fibre (g/day) a | 23 ± 2 | 21 ± 1 | 0.285 |
| Calcium (mg/day) a | 965 ± 50 | 857 ± 50 | 0.134 |
| Folate (µg/day) a | 342 ± 17 | 238 ± 14 | 0.046 |
| Iron (mg/day) b | 14 (10, 21) | 11 (9, 14) | 0.103 |
| Magnesium (mg/day) a | 319 ± 21 | 270 ± 14 | 0.060 |
| Niacin (mg/day) b | 22 (17, 29) | 18 (14, 25) | 0.126 |
| Phosphorus (mg/day) a | 1732 ± 118 | 1459 ± 77 | 0.058 |
| Potassium (mg/day) b | 3078 (2312, 3534) | 2409 (2065, 3014) | 0.051 |
| Retinol (µg/day) b | 351 (303, 443) | 340 (277, 435) | 0.651 |
| Riboflavin (mg/day) a | 3 ± 0 | 2 ± 0 | 0.055 |
| Sodium (mg/day) a | 2647 ± 197 | 2476 ± 158 | 0.500 |
| Thiamine (mg/day) a | 2 ± 0 | 1 ± 0 | 0.064 |
| Vitamin C (mg/day) a | 105 ± 11 | 95 ± 8 | 0.417 |
| Vitamin E (mg/day) a | 7 ± 1 | 6 ± 0 | 0.273 |
| Zinc (mg/day) b | 13 (9, 18) | 10 (9, 12) | 0.114 |
| α-carotene (µg/day) b | 811 (416, 1244) | 643 (324, 830) | 0.122 |
| β-carotene (µg/day) a | 4068 ± 387 | 3255 ± 273 | 0.092 |
| β-cryptoxanthin (µg/day) b | 125 (48, 284) | 169 (85, 234) | 0.675 |
| Lutein/zeaxanthin (µg/day) a | 862 ± 78 | 723 ± 65 | 0.177 |
| Lycopene (µg/day) b | 3967 (2602, 6338) | 3807 (2324, 7564) | 0.950 |
| F&V Concentrate (n = 28) | Placebo (n = 28) | ||||||
|---|---|---|---|---|---|---|---|
| 0 | 8 Weeks | p-Value * | 0 | 8 Weeks | p-Value * | ANCOVA ǂ p-Value | |
| Fruit and Vegetable Intake (Servings/Day) | |||||||
| Fruit b | 1.00 (0.00, 1.88) | 0.75 (0.00, 1.00) | 0.517 | 1.00 (0.00, 1.00) | 0.50 (0.00, 1.00) | 0.149 | 0.222 |
| Vegetables a | 1.45 ± 0.19 | 1.52 ± 0.18 | 0.784 | 1.34 ± 0.20 | 1.46 ±. 023 | 0.683 | 0.945 |
| Total a | 2.38 ± 0.21 | 2.30 ± 0.16 | 0.788 | 2.14 ± 0.23 | 2.00 ± 0.23 | 0.665 | 0.383 |
| Plasma Carotenoids (mg/L) | |||||||
| Lutein b | 0.43 (0.36, 0.52) | 0.45 (0.34, 0.59) | 0.545 | 0.37 (0.30, 0.52) | 0.37 (0.28, 0.49) | 0.922 | 0.127 |
| β-cryptoxanthin b | 0.09 (0.05, 0.15) | 0.07 (0.05, 0.12) | 0.375 | 0.07 (0.04, 0.16) | 0.06 (0.03, 0.13) | 0.200 | 0.269 |
| Lycopene b | 0.10 (0.08, 0.14) | 0.12 (0.08, 0.18) | 0.213 | 0.11 (0.07, 0.17) | 0.08 (0.04, 0.11) | 0.007 | 0.005 |
| α-carotene b | 0.01 (0.00, 0.15) | 0.01 (0.00, 0.01) | 0.188 | 0.01 (0.00, 0.02) | 0.01 (0.00, 0.01) | 0.018 | 0.095 |
| β-carotene b | 0.11 (0.07, 0.15) | 0.16 (0.11, 0.26) | <0.001 | 0.07 (0.00, 0.16) | 0.06 (0.00, 0.11) | 0.127 | <0.001 |
| Total Carotenoids b | 0.73 (0.60, 1.05) | 0.85 (0.76, 0.99) | 0.017 | 0.72 (0.51, 1.01) | 0.59 (0.49, 0.80) | 0.019 | <0.001 |
| Plasma α-Tocopherol (mg/L) b | 13.6 (11.3, 15.9) | 14.2 (12.1, 15.4) | 0.849 | 14.3 (11.3, 25.6) | 14.4 (11.6, 17.7) | 0.360 | 0.568 |
| F&V Concentrate (n = 28) | Placebo (n = 28) | ||||||
|---|---|---|---|---|---|---|---|
| 0 | 8 Weeks | p-Value * | 0 | 8 Weeks | p-Value * | ANCOVA ǂ p-Value | |
| Total Cholesterol (mmol/L) | 5.70 (5.00, 6.30) | 5.50 (4.83, 6.15) | 0.015 | 5.90 (4.50, 6.70) | 5.60 (4.60, 6.20) | 0.532 | 0.359 |
| LDL Cholesterol (mmol/L) | 3.63 (3.17, 4.36) | 3.50 (2.95, 4.27) | 0.032 | 4.15 (3.03, 4.63) | 3.51 (2.89, 4.10) | 0.089 | 0.904 |
| HDL Cholesterol (mmol/L) | 1.20 (1.10, 1.40) | 1.20 (1.10, 1.30) | 0.815 | 1.20 (1.00, 1.40) | 1.20 (1.00, 1.40) | 0.941 | 0.308 |
| Total/HDL Cholesterol | 4.50 (4.00, 5.10) | 4.55 (4.05, 5.00) | 0.221 | 4.60 (3.90, 5.60) | 4.60 (3.90, 5.50) | 0.587 | 0.634 |
| Triglycerides (mmol/L) | 1.24 (0.86, 1.81) | 1.23 (1.01, 1.67) | 0.344 | 1.36 (0.97, 1.83) | 1.53 (1.06, 1.84) | 0.012 | 0.022 |
| HbA1c (%) | 5.40 (5.20, 5.60) | 5.30 (5.10, 5.50) | 0.570 | 5.40 (5.20, 5.70) | 5.30 (5.10, 5.50) | 0.149 | 0.407 |
| TNFα (pg/mL) | 1.04 (0.87, 1.41) | 1.02 (0.55, 1.41) | 0.037 | 1.07 (0.79, 1.22) | 0.94 (0.82, 1.26) | 0.797 | 0.071 |
| sTNFR1 (pg/mL) | 1140 (1017, 1382) | 1108 (992, 1335) | 0.829 | 1120 (967, 1319) | 1147 (953, 1383) | 0.378 | 0.668 |
| sTNFR2 (pg/mL) | 2479 (2257, 3034) | 2345 (2209, 3130) | 0.467 | 2332 (1986, 2677) | 2547 (2047, 2754) | 0.006 | 0.299 |
| Ox-LDL (mU/L) | 48,620 (41,249, 62,976) | 48,352 (41,937, 57,960) | 0.990 | 50,053 (41,262, 64,661) | 48,911 (43,400, 59,733) | 0.551 | 0.781 |
| CRP (mg/mL) | 3.1 (1.7, 5.1) | 3.9 (1.2, 5.9) | 0.536 | 3.2 (1.7, 5.2) | 2.5 (1.5, 5.4) | 0.769 | 0.301 |
| F&V Concentrate (n = 28) | Placebo (n =28) | ||||||
|---|---|---|---|---|---|---|---|
| 0 | 8 Weeks | p-Value * | 0 | 8 Weeks | p-Value * | ANCOVA ǂ p-Value | |
| BMI (kg/m2) a | 34.6 ± 0.7 | 34.6 ± 0.8 | 0.076 | 37.0 ± 1.3 | 36.1 ± 1.2 | 0.781 | 0.336 |
| Waist circumference (cm) a | 113.7 ± 2.2 | 112.5 ± 2.3 | 0.649 | 116.6 ± 2.8 | 116.0 ± 2.9 | 0.863 | 0.699 |
| Body Composition | |||||||
| Total Body Fat (kg) a | 42.6 ± 1.7 | 42.7 ± 1.7 | 0.728 | 45.1 ± 2.4 | 44.8 ± 2.5 | 0.231 | 0.618 |
| % Body Fat a | 46.7 ± 1.5 | 46.4 ± 1.5 | 0.168 | 45.0 ± 1.5 | 44.4 ± 1.6 | 0.384 | 0.134 |
| Total Lean Mass (kg) a | 49.3 ± 2.4 | 50.0 ± 2.4 | 0.018 | 54.4 ± 2.0 | 55.0 ± 2.1 | 0.836 | 0.057 |
| % Lean Mass a | 51.4 ± 1.4 | 51.9 ± 1.4 | 0.078 | 53.5 ± 1.5 | 54.0 ± 1.5 | 0.560 | 0.096 |
| Android: Gynoid Fat Ratio a | 1.2 ± 0.0 | 1.2 ± 0.0 | 0.499 | 1.1 ± 0.0 | 1.1 ± 0.0 | 0.270 | 0.649 |
| Systolic BP (mmHg) a | 131.7 ± 2.3 | 125.9 ± 1.9 | 0.005 | 136.7 ± 2.8 | 132.4 ± 2.3 | 0.037 | 0.110 |
| Diastolic BP (mmHg) a | 80.6 ± 1.2 | 79.0 ± 1.0 | 0.097 | 82.6 ± 1.0 | 82.3 ± 1.0 | 0.665 | 0.055 |
| Pulse (BPM) a | 66.1 ± 1.7 | 68.6 ± 1.7 | 0.175 | 67.8 ± 1.7 | 66.4 ± 1.6 | 0.709 | 0.178 |
| Quality of Life (SF-36) | |||||||
| Physical a | 47.2 ± 1.6 | 47.8 ± 1.5 | 0.788 | 46.6 ± 1.9 | 49.2 ± 1.6 | 0.678 | 0.682 |
| Mental b | 51.6 (43.6, 58.7) | 54.1 (48.3, 59.1) | 0.211 | 56.4 (40.1, 59.8) | 54.0 (45.3, 58.1) | 0.897 | 0.290 |
| F&V Concentrate (n = 16) | Placebo (n = 15) | p-Value | |
|---|---|---|---|
| Demographics | |||
| Gender (male/female) | 3/13 | 6/9 | 0.252 |
| BMI (kg/m2) a | 35.6 ± 1.1 | 40.2 ± 1.5 | 0.016 |
| Age (years) a | 60.8 ± 1.5 | 56.6 ± 2.0 | 0.097 |
| Smoking Status (never/ex) | 9/8 | 8/7 | 1.000 |
| Nutrient Intake | |||
| Total Energy (KJ/day) a | 7884 ± 792 | 7569 ± 625 | 0.758 |
| Total fat (g/day) a | 83 ± 9 | 81 ± 7 | 0.857 |
| SFA (g/day) b | 30 (24, 45) | 28 (24, 43) | 0.688 |
| PUFA (g/day) a | 11 ± 1 | 12 ± 1 | 0.609 |
| MUFA (g/day) a | 30 ± 3 | 30 ± 3 | >0.999 |
| Protein (g/day) b | 94 (67, 120) | 77 (73, 110) | 0.858 |
| Carbohydrates (g/day) a | 190 ± 20 | 181 ± 16 | 0.738 |
| Fibre (g/day) a | 22 ± 2 | 20 ± 2 | 0.429 |
| Calcium (mg/day) a | 926 ± 64 | 871 ± 67 | 0.559 |
| Folate (µg/day) b | 267 (194, 329) | 213 (189, 294) | 0.418 |
| Iron (mg/day) b | 12 (9, 20) | 10 (9, 14) | 0.509 |
| Magnesium (mg/day) a | 312 ± 31 | 271 ± 20 | 0.271 |
| Niacin (mg/day) b | 20 (14, 25) | 18 (14, 26) | 0.800 |
| Phosphorus (mg/day) b | 1500 (1250, 2002) | 1357 (1140, 1859) | 0.377 |
| Potassium (mg/day) b | 2847 (2090, 3609) | 2501 (2081, 2896) | 0.533 |
| Retinol (µg/day) b | 342 (254, 507) | 376 (311, 473) | 0.688 |
| Riboflavin (mg/day) b | 2 (2, 3) | 2 (2, 3) | 0.397 |
| Sodium (mg/day) b | 2177 (1797, 2738) | 2286 (1845, 3623) | 0.463 |
| Thiamine (mg/day) b | 2 (1, 2) | 1 (1, 2) | 0.558 |
| Vitamin C (mg/day) b | 88 (63, 111) | 90 (57, 111) | 0.883 |
| Vitamin E (mg/day) a | 7 ± 1 | 6 ± 1 | 0.702 |
| Zinc (mg/day) b | 13 (8, 16) | 10 (9, 14) | 0.716 |
| α-Carotene (µg/day) a | 916 ± 128 | 684 ± 121 | 0.198 |
| β-Carotene (µg/day) a | 351 ± 36 | 3350 ± 412 | 0.352 |
| β-Cryptoxanthin (µg/day) b | 105 (48, 193) | 164 (89, 225) | 0.222 |
| Lutein/zeaxanthin (µg/day) b | 803 (584, 903) | 744 (332, 1134) | 0.509 |
| Lycopene (µg/day) b | 3523 (2409, 4931) | 2829 (2040, 9169) | 0.887 |
| F&V Concentrate (n = 16) | Placebo (n = 15) | ||||||
|---|---|---|---|---|---|---|---|
| 0 | 8 Weeks | p-Value * | 0 | 8 Weeks | p-Value * | ANCOVA ǂ p-Value | |
| Fruit and Vegetable Intake (Servings/Day) | |||||||
| Fruit b | 1.00 (0.00, 1.00) | 0.75 (0.00, 2.00) | 0.899 | 0.75 (0.00, 1.38) | 0.50 (0.00, 1.00) | 0.475 | 0.283 |
| Vegetables b | 1.25 (0.63, 2.00) | 1.75 (1.00, 2.00) | 0.606 | 1.00 (0.13, 1.88) | 1.00 (0.50, 2.00) | 0.435 | 0.893 |
| Total a | 2.13 ± 0.26 | 2.38 ± 0.23 | 0.478 | 1.78 ± 0.25 | 2.00 ± 0.32 | 0.596 | 0.475 |
| Plasma Carotenoids (mg/L) | |||||||
| Lutein b | 0.41 (0.37, 0.47) | 0.45 (0.33, 0.55) | 0.519 | 0.36 (0.29, 0.42) | 0.35 (0.28, 0.40) | 0.855 | 0.204 |
| β-cryptoxanthin b | 0.08 (0.05, 0.13) | 0.07 (0.05, 0.12) | 0.900 | 0.07 (0.02, 0.13) | 0.06 (0.02, 0.13) | 0.500 | 0.491 |
| Lycopene b | 0.10 (0.08, 0.15) | 0.12 (0.08, 0.14) | 0.850 | 0.11 (0.09, 0.19) | 0.10 (0.03, 0.12) | 0.003 | 0.026 |
| α-carotene b | 0.01 (0.00, 0.02) | 0.01 (0.00, 0.01) | 0.148 | 0.01 (0.00, 0.02) | 0.00 (0.00, 0.02) | 0.059 | 0.410 |
| β-carotene b | 0.11 (0.06, 0.14) | 0.15 (0.10, 0.26) | 0.003 | 0.09 (0.00, 0.17) | 0.00 (0.00, 0.15) | 0.393 | 0.002 |
| Total Carotenoids b | 0.72 (0.60, 0.88) | 0.89 (0.61, 0.98) | 0.035 | 0.72 (0.44, 0.94) | 0.54 (0.48, 0.80) | 0.066 | <0.0001 |
| Plasma α-Tocopherol (mg/L) b | 14.1 (12.5, 16.3) | 14.8 (13.6, 16.7) | 0.677 | 14.5 (12.8, 17.2) | 14.5 (11.8, 17.3) | 0.761 | 0.826 |
| F&V Concentrate (n = 16) | Placebo (n = 15) | ||||||
|---|---|---|---|---|---|---|---|
| 0 | 8 Weeks | p-Value * | 0 | 8 Weeks | p-Value * | ANCOVA ǂ p-Value | |
| Total Cholesterol (mmol/L) | 6.10 (5.30, 6.45) | 5.65 (5.40, 6.20) | 0.016 | 6.30 (4.70, 6.70) | 5.95 (4.95, 6.43) | 0.538 | 0.549 |
| LDL Cholesterol (mmol/L) | 3.98 (3.37, 4.48) | 3.82 (3.34, 4.33) | 0.016 | 4.21 (2.87, 4.67) | 3.91 (3.22, 4.50) | 0.279 | 0.854 |
| HDL Cholesterol (mmol/L) | 1.30 (1.10, 1.40) | 1.20 (1.13, 1.38) | 0.656 | 1.20 (1.00, 1.40) | 1.20 (1.00, 1.40) | 0.941 | 0.804 |
| Total/HDL Cholesterol | 4.90 (3.95, 5.40) | 4.80 (4.40, 5.08) | 0.324 | 5.20 (4.30, 5.90) | 4.80 (3.95, 5.73) | 0.398 | 0.944 |
| Triglycerides (mmol/L) | 1.30 (0.98, 2.24) | 1.41 (1.17, 1.82) | 0.520 | 1.58 (1.16, 1.85) | 1.77 (1.09, 1.91) | 0.268 | 0.205 |
| HbA1c (mmol/mol) | 36.0 (32.5, 38.0) | 34.0 (33.0, 37.0) | 0.197 | 36.5 (33.8, 40.3) | 36.0 (33.0, 37.5) | 0.783 | 0.662 |
| HbA1c (%) | 5.40 (5.15, 5.60) | 5.30 (5.13, 5.48) | 0.128 | 5.45 (5.28, 5.83) | 5.40 (5.20, 5.55) | 0.629 | 0.284 |
| TNFα (pg/mL) | 1.13 (0.95, 1.52) | 0.95 (0.70, 1.40) | 0.007 | 1.07 (0.79, 1.30) | 0.96 (0.87, 1.26) | 0.632 | 0.035 |
| sTNFR1 (pg/mL) | 1140 (980, 1491) | 1143 (988, 1414) | 0.324 | 1294 (1047, 1371) | 1347 (1176, 1442) | 0.212 | 0.031 |
| sTNFR2 (pg/mL) | 2698 (2371, 3152) | 2389 (2205, 3005) | 0.198 | 2554 (2313, 2881) | 2711 (2532, 2998) | 0.002 | 0.009 |
| Ox-LDL (mU/L) | 48,833 (43,191, 63,536) | 50,719 (42,229, 61,437) | 0.357 | 52,683 (39,688, 64,661) | 45,559 (43,009, 62,543) | 0.536 | 0.852 |
| CRP (mg/mL) | 4.8 (3.6, 9.4) | 5.2 (3.8, 6.6) | 0.930 | 5.0 (4.1, 7.4) | 5.4 (3.8, 7.1) | 0.820 | 0.861 |
| F&V Concentrate (n = 16) | Placebo (n = 15) | ||||||
|---|---|---|---|---|---|---|---|
| 0 | 8 Weeks | p-Value * | 0 | 8 Weeks | p-Value * | ANCOVA ǂ p-Value | |
| BMI (kg/m2) a | 35.6 ± 1.1 | 35.5 ± 1.2 | 0.263 | 40.2 ± 1.5 | 40.3 ± 1.5 | 0.721 | 0.531 |
| Waist circumference (cm) a | 113.8 ± 3.4 | 113.5 ± 3.7 | 0.480 | 123.4 ± 3.9 | 124.3 ± 3.6 | 0.806 | 0.939 |
| Body Composition | |||||||
| Total Body Fat (kg) a | 45.5 ± 2.3 | 44.6 ± 2.4 | 0.362 | 52.9 ± 2.7 | 53.2 ± 2.8 | 0.345 | 0.421 |
| % Body Fat a | 49.9 ± 1.7 | 48.9 ± 1.8 | 0.062 | 47.7 ± 1.7 | 47.8 ± 1.7 | 0.615 | 0.069 |
| Total Lean Mass (kg) a | 46.1 ± 3.0 | 46.9 ± 3.2 | 0.049 | 58.1 ± 3.1 | 58.2 ± 3.2 | 0.919 | 0.221 |
| % Lean Mass a | 48.5 ± 1.6 | 49.5 ± 1.7 | 0.077 | 50.7 ± 1.6 | 50.7 ± 1.6 | 0.811 | 0.115 |
| Android: Gynoid Fat Ratio a | 1.1 ± 0.0 | 1.1 ± 0.0 | 0.892 | 1.1 ± 0.0 | 1.1 ± 0.0 | 0.951 | 0.996 |
| Systolic BP (mmHg) a | 131.8 ± 3.5 | 129.1 ± 2.8 | 0.243 | 140.1 ± 3.3 | 134.0 ± 3.4 | 0.052 | 0.953 |
| Diastolic BP (mmHg) a | 80.3 ± 1.8 | 80.0 ± 1.1 | 0.999 | 84.7 ± 1.6 | 83.5 ± 1.2 | 0.371 | 0.306 |
| Pulse (BPM) b | 67.0 (61.5, 71.8) | 71.0 (67.0, 78.0) | 0.021 | 68.0 (63.0, 71.0) | 69.0 (62.0, 72.0) | 0.988 | 0.138 |
| Quality of Life (SF-36) | |||||||
| Physical a | 45.9 ± 2.4 | 46.4 ± 2.0 | 0.862 | 44.4 ± 2.4 | 44.4 ± 2.1 | 0.843 | 0.665 |
| Mental a | 48.8 ± 3.3 | 53.7 ± 2.3 | 0.076 | 48.6 ± 3.4 | 49.6 ± 2.9 | 0.596 | 0.259 |
| Gene | Gene Name | Gene Function | Fold Change | p-Value |
|---|---|---|---|---|
| Lipogenesis | ||||
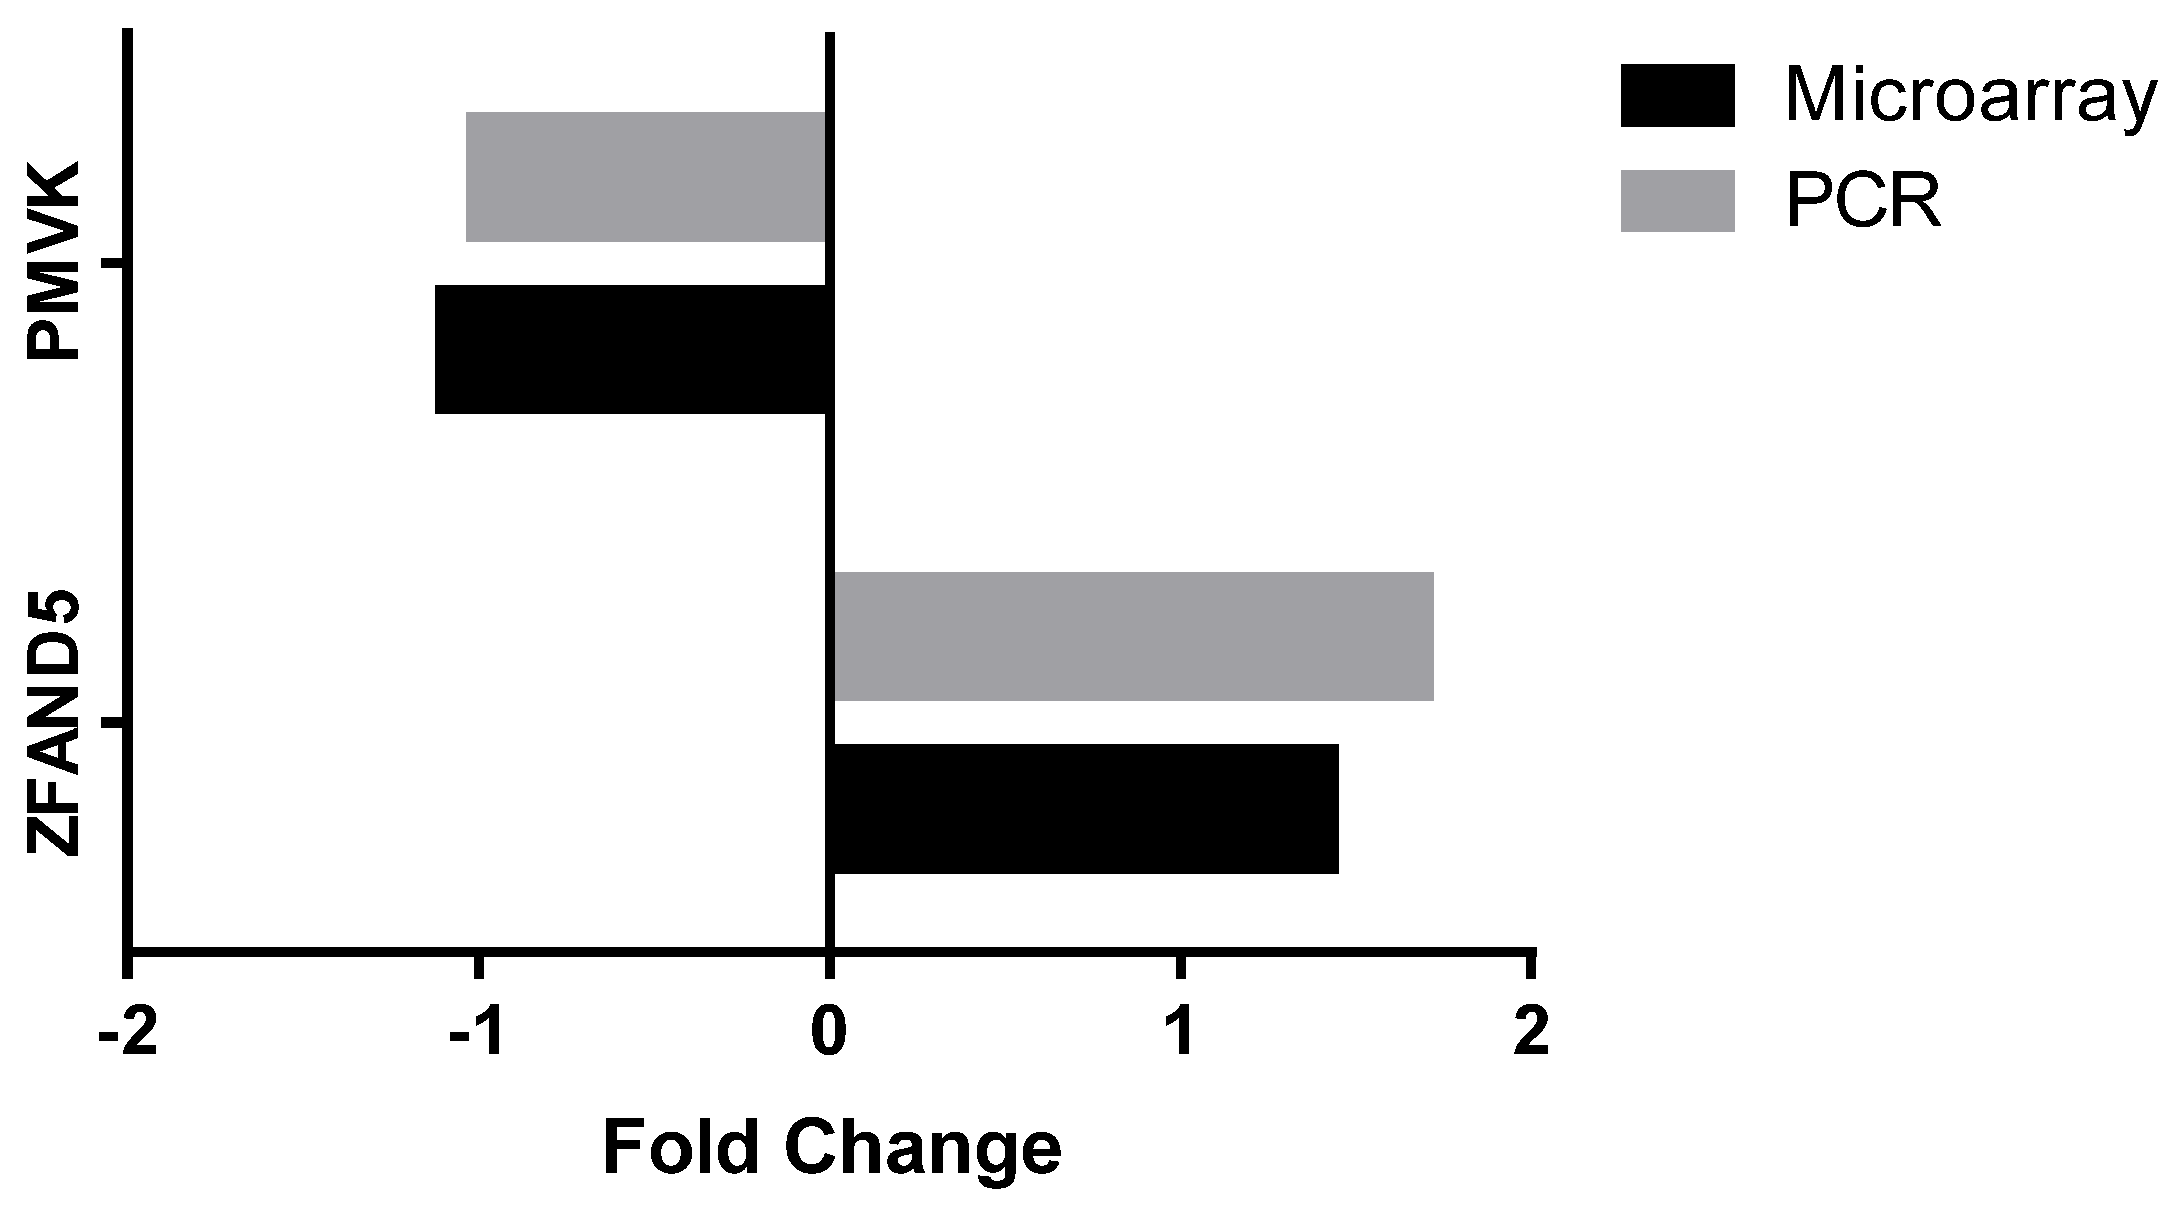
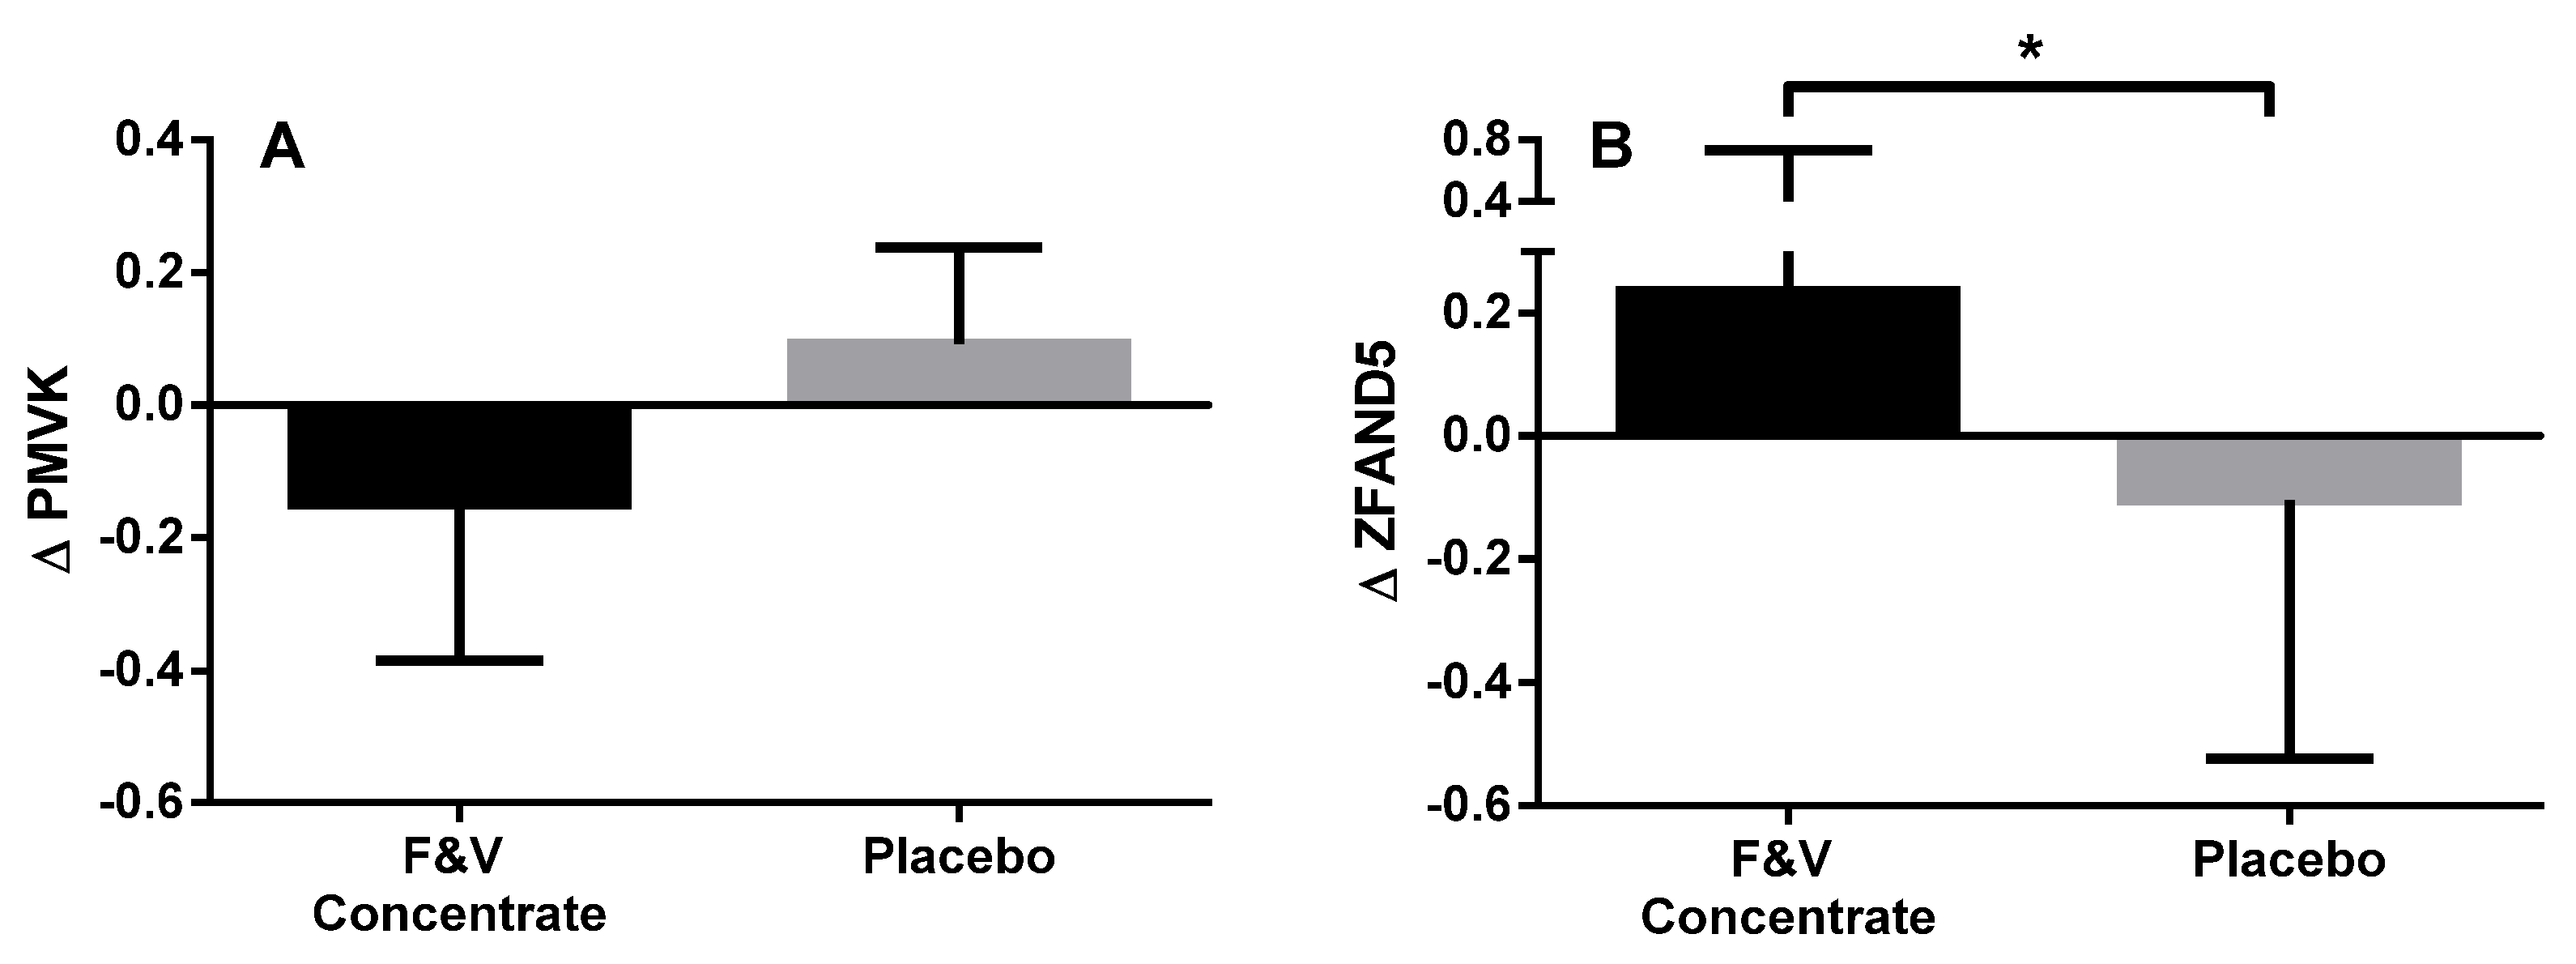
| PMVK | Phosphomevalonate kinase | Catalyses the conversion of mevalonate 5-phosphate into mevalonate 5-diphosphate, the fifth reaction of the cholesterol biosynthetic pathway | −1.102 | 0.005 |
| FDFT1 | Farnesyl-diphosphate farnesyltransferase 1 | First specific enzyme in cholesterol biosynthesis, catalyses dimerization farnesyl diphosphate to form squalene | 1.08 | 0.014 |
| FDPS | Farnesyl diphosphate synthase | Catalyses the production of intermediates in cholesterol biosynthesis | −1.06 | 0.034 |
| NF-κB | ||||
| ZFAND5 | Zinc finger, AN1-type domain 5 | Inhibits TNF, IL-1 and TLR-induced NF-κB activation | 1.438 | 0.005 |
| ATM | ATM serine/threonine kinase | Regulates tumour suppressor and DNA repair genes | 1.242 | 0.006 |
| PTGS2 | Prostaglandin-endoperoxide synthase 2 | Key enzyme in prostaglandin biosynthesis | 1.199 | 0.042 |
| PARP1 | Poly (adenosine diphosphate (ADP)-ribose) polymerase 1 | Differentiation, proliferation and tumour transformation | 1.194 | 0.008 |
| PLCG2 | Phospholipase C, gamma 2 (phosphatidylinositol-specific) | Catalyses the conversion of 1-phosphatidyl-1D-myo-inositol 4,5-bisphosphate to 1D-myo-inositol 1,4,5-trisphosphate (IP3) and diacylglycerol (DAG), important second messenger molecules | 1.161 | 0.019 |
| BCL2 | B-cell chronic lymphoid leukemia (CLL)/lymphoma 2 | Important anti-apoptotic protein, classified as an oncogene | 1.141 | 0.003 |
| TLR4 | Toll-like receptor 4 | Pattern recognition receptor implicated in LPS signal transduction | 1.118 | 0.017 |
| MAP3K7 | Mitogen-activated protein kinase kinase kinase 7 | Forms complex with Transforming growth factor beta activated kinase (TAB)-1 or TAB2 which is required for NF-κB | 1.112 | 0.042 |
| PRKCQ | Protein kinase C, theta | Important for T-cell activation and NF-κB transcription factor activation | 1.082 | 0.020 |
| PRKCB | Protein kinase C, beta | Phosphorylates protein targets involved in B cell activation, apoptosis, endothelial cell proliferation, intestinal sugar absorption | 1.072 | 0.048 |
| MALT1 | Mucosa-associated lymphoid tissue lymphoma translocation protein 1 | Proteolytic activity, many targets involved in regulation of inflammation | 1.067 | 0.028 |
| TNFAIP3 | Tumour necrosis factor-induced protein 3 | Induced by TNF, inhibits NF-κB and TNF-mediated apoptosis | 1.059 | 0.042 |
| AMPK | ||||
| CAB39 | Calcium binding protein 39 | Stimulates STK11 activity, which is an upstream kinase of AMPK | 1.418 | 0.004 |
| RAB10 | RAB10; RAS oncogene family | Regulates intracellular vesicle trafficking | 1.279 | 0.020 |
| SIRT1 | Sirtuin 1 | Involved in regulating AMPK expression | 1.152 | 0.019 |
| IRS2 | Insulin receptor substrate 2 | Mediates effects of insulin, insulin-like growth factor 1, and cytokines | 1.137 | 0.009 |
| RHEB | Ras homolog enriched in brain | involved in the mechanistic targeting of rapamycin (mTOR) pathway and the regulation of the cell cycle | 1.119 | 0.048 |
| MAP3K7 | Mitogen-activated protein kinase kinase kinase 7 | Forms complex with TAB1 or TAB2, which is required for NF-κB | 1.112 | 0.042 |
© 2017 by the authors. Licensee MDPI, Basel, Switzerland. This article is an open access article distributed under the terms and conditions of the Creative Commons Attribution (CC BY) license ( http://creativecommons.org/licenses/by/4.0/).
Share and Cite
Williams, E.J.; Baines, K.J.; Berthon, B.S.; Wood, L.G. Effects of an Encapsulated Fruit and Vegetable Juice Concentrate on Obesity-Induced Systemic Inflammation: A Randomised Controlled Trial. Nutrients 2017, 9, 116. https://doi.org/10.3390/nu9020116
Williams EJ, Baines KJ, Berthon BS, Wood LG. Effects of an Encapsulated Fruit and Vegetable Juice Concentrate on Obesity-Induced Systemic Inflammation: A Randomised Controlled Trial. Nutrients. 2017; 9(2):116. https://doi.org/10.3390/nu9020116
Chicago/Turabian StyleWilliams, Evan J., Katherine J. Baines, Bronwyn S. Berthon, and Lisa G. Wood. 2017. "Effects of an Encapsulated Fruit and Vegetable Juice Concentrate on Obesity-Induced Systemic Inflammation: A Randomised Controlled Trial" Nutrients 9, no. 2: 116. https://doi.org/10.3390/nu9020116
APA StyleWilliams, E. J., Baines, K. J., Berthon, B. S., & Wood, L. G. (2017). Effects of an Encapsulated Fruit and Vegetable Juice Concentrate on Obesity-Induced Systemic Inflammation: A Randomised Controlled Trial. Nutrients, 9(2), 116. https://doi.org/10.3390/nu9020116