Article

Prebiotic Dietary Fiber and Gut Health: Comparing the in Vitro Fermentations of Beta-Glucan, Inulin and Xylooligosaccharide

1
Department of Food Science and Nutrition, University of Minnesota, 1334 Eckles Ave, St. Paul, MN 55108, USA
2
Informatics Institute, University of Minnesota, 101 Pleasant St., Minneapolis, MN 55455, USA
*
Author to whom correspondence should be addressed.
Authors contributed equally to this work.
Nutrients 2017, 9(12), 1361; https://doi.org/10.3390/nu9121361
Submission received: 27 October 2017 / Revised: 9 December 2017 / Accepted: 13 December 2017 / Published: 15 December 2017
(This article belongs to the Special Issue Carbohydrate Metabolism in Health and Disease)

Abstract

:
Prebiotic dietary fiber supplements are commonly consumed to help meet fiber recommendations and improve gastrointestinal health by stimulating beneficial bacteria and the production of short-chain fatty acids (SCFAs), molecules beneficial to host health. The objective of this research project was to compare potential prebiotic effects and fermentability of five commonly consumed fibers using an in vitro fermentation system measuring changes in fecal microbiota, total gas production and formation of common SCFAs. Fecal donations were collected from three healthy volunteers. Materials analyzed included: pure beta-glucan, Oatwell (commercially available oat-bran containing 22% oat β-glucan), xylooligosaccharides (XOS), WholeFiber (dried chicory root containing inulin, pectin, and hemi/celluloses), and pure inulin. Oatwell had the highest production of propionate at 12 h (4.76 μmol/mL) compared to inulin, WholeFiber and XOS samples (p < 0.03). Oatwell’s effect was similar to those of the pure beta-glucan samples, both samples promoted the highest mean propionate production at 24 h. XOS resulted in a significant increase in the genus Bifidobacterium after 24 h of fermentation (0 h:0.67 OTUs (operational taxonomic unit); 24 h:5.22 OTUs; p = 0.038). Inulin and WholeFiber increased the beneficial genus Collinsella, consistent with findings in clinical studies. All analyzed compounds were fermentable and promoted the formation of beneficial SCFAs.

1. Introduction

Prebiotic definitions vary among different scientific and political arenas across the world [1]. Depending on the local definition, nearly all prebiotics can be classified as dietary fiber, but not all fibers are considered prebiotics [2]. The most recent definition describes a prebiotic as “a substrate that is selectively utilized by host microorganisms conferring a health benefit” [3]. Functional characteristics of prebiotics include the ability to: resist the low pH of the stomach, resist hydrolysis by mammalian enzymes, resist absorption in the upper gastrointestinal tract, the ability to be fermented by intestinal microbiota and selectively stimulate the growth and/or activity of intestinal bacteria associated with host health and overall well-being [4,5]. Inulin, beta-glucans, and xylooligosaccharides all provide health benefits to consumers that are related to the fermentation of these compounds in the distal gastrointestinal tract, and are also considered functional fibers with many other benefits [6]. As the definition of “prebiotic” broadens to include the overall impact from the metabolism from these compounds, the category of prebiotics will expand [7]. The importance of displaying direct health benefits due to bacterial fermentation is still the driving mechanism for all prebiotics.
As our awareness and understanding of the importance of the gut microbiome and gut microbiota increases, it is imperative for consumers to understand the key differences between different forms of prebiotics, and where they can be found in various foods and food products. XOS is an emerging prebiotic with well-displayed, consistent health benefits [8] and is composed of sugar oligomers composed of xylose units [9], found naturally in fruits, vegetables, milk, honey and bamboo shoots. XOS is commonly produced from xylan containing lignocellulosic materials through various chemical methods, direct enzymatic hydrolysis, or a combination of both treatments [10,11,12,13,14]. Inulin is a heterogeneous blend of fructose polymers (degree of polymerization, DP < 10) [15] which occurs naturally in thousands of plant species, including wheat, onion, bananas, garlic and chicory [16]. Beta-glucan is a polysaccharide composed of d-glucose monomers with beta-glycosidic linkages, present in either linear chains in grains, such as oat and barley (up to 7%), or in branched structures in fungi, yeast and certain bacteria [17]. These prebiotics, or prebiotic mixtures, each provide a unique carbon source for selective stimulation of different bacterial taxa and are important microbiota-shaping compounds.
Because no analytical method currently exists to measure the prebiotic capacity of foods in terms of their influence on gastrointestinal taxa, this field relies heavily on fecalbiotics (living or once living fecal microbial populations) to quantify the effects of these compounds. In vitro fermentation models allow for quantitative analysis of specific materials and are semi-representative models of colonic fermentation [18]. Although not a complete substitute for human studies, when paired with in vivo models, in vitro analysis can be an accurate systematic approach to analyzing different parameters and end points in colonic fermentation [19].
With the recent release of the International Scientific Association for Probiotics and Prebiotics consensus statement, XOS has been categorized as a prebiotic or prebiotic candidate [3]. The prebiotic effects of XOS have previously been summarized by Broekaert et al. [20]. While there is less evidence supporting the prebiotic effects of XOS compared to other types of prebiotics, studies have shown that XOS supplementation in humans can increase SCFA and bifidobacteria, as well as improve stool consistency and frequency [21,22,23]. This paper compares the fermentation effects of XOS to previously established prebiotics (inulin and beta-glucans) in a controlled in vitro model. To the authors’ knowledge, this is the first controlled in vitro study comparing the effects of XOS to these known prebiotics. The objective of this project was to compare currently available prebiotics by their ability to change specific taxa as well as compare differences in the production of gas and common short chain fatty acids (SCFA) between these products. Inulin, XOS and beta-glucan based products were chosen for this experiment because they are established and emerging prebiotics that are commonly consumed, and offer well-demonstrated health benefits to their consumers.

2. Materials and Methods

2.1. Prebiotic Dietary Fibers Analyzed

Five common prebiotic dietary fibers were chosen for this study (Table 1), including different types of beta-glucans, inulin and xylooligosaccharide supplements.

2.2. Donor Information

Fecal samples were collected from three healthy volunteers (2 males, 1 female) under anaerobic conditions. Donors included individuals (ages 22–28) consuming non-specific Western diets, who do not consume any supplements, including fiber supplements. Donors were non-smokers, did not receive any antibiotic treatments in the last year, and were not affected by any known gastrointestinal diseases (Table 2).

2.3. Fecal Collection

Fecal samples were anaerobically collected within 5 min of the start of the fermentation (Medline Specimen Collection Kit, Medline, Inc., Rogers, MN, USA), and homogenized immediately upon collection. All data and samples collected were done in accordance with University of Minnesota policies and procedures.

2.4. Fermentation

The fiber samples were fermented using in vitro methods to mimic the environment of the distal colon. These methods have been used in previous in vitro studies, including Koecher et al., who found complementary results between these in vitro methods and a human intervention study of the same fibers [24]. Fiber samples (0.5 g) were hydrated in 40 mL of prepared sterile trypticase peptone fermentation media in 100 mL serum bottles, capped, and incubated for 12 h at 4 °C to limit possibility of microbial growth [25]. Following incubation, serum bottles were transferred to a circulating water bath at 37 °C for 2 h to allow the samples to reach body temperature. Post-collection, fecal samples were mixed using a 6:1 ratio of phosphate buffer solution to fecal sample. After mixing, obtained fecal slurry was combined with prepared reducing solution (2.52 g cysteine hydrochloride, 16 mL 1 N NaOH, 2.56 g sodium sulfide nonanhydride, 380 mL DD H2O) at a 2:15 ratio. 10 mL of the prepared fecal inoculum was added to each of the serum bottles, 0.8 mL Oxyrase® was added, flushed with CO2, sealed, and then immediately placed in a 37 °C circulating water bath. Fecal inoculum control samples with no fiber added were prepared for SCFA and gas production comparison. Baseline pH of the fermentation media was measured, with a mean of 6.83 ± 0.04, to mimic the environment of the distal colon. Samples were prepared in triplicate and analyzed at 0, 12 and 24 h. Upon removal at each time point, total gas volume was measured. Then samples were divided into aliquots for analysis and 1 mL of copper sulfate (200 g/L) was added to cease fermentation. All samples were immediately frozen and stored at −80 °C for further analysis.

2.5. SCFA Analysis

SCFA samples were extracted according to Schneider et al. [26] with minor modifications, and analyzed with previously described methods [27].

2.6. DNA Extractions

Fecal bacteria DNA from the in vitro system were extracted using a PowerSoil DNA Isolation Kit (Mo Bio Laboratories, Inc., Carlsbad, CA, USA) following the provided operating instruction, including bead beating for 20 min.

2.6.1. Primary/Secondary Amplification

The V1-V3 region of the 16S rRNA was amplified using a two-step PCR protocol. The primary amplification was done using an ABI7900 qPCR machine (Applied Biosystems, Foster City, CA, USA). The following recipe was used: 3 μL template DNA, 0.48 μL nuclease-free water, 1.2 μL 5× KAPA HiFi buffer (Kapa Biosystems, Woburn, MA, USA), 0.18 μL 10 mM dNTPs (Kapa Biosystems, Woburn, MA, USA), 0.3 μL DMSO (Fisher Scientific, Waltham, MA, USA), 0.12 μL ROX (25 μM) (Life Technologies, Carlsbad, CA, USA), 0.003 μL 1000× SYBR Green, 0.12 μL KAPA HiFi Polymerase (Kapa Biosystems, Woburn, MA, USA), 0.3 μL forward primer (10 μM), 0.3 μL reverse primer (10 μM). Cycling conditions were: 95 °C for 5 min, followed by 20 cycles of 98 °C for 20 s, 55 °C for 15 s, and 72 °C for 1 min. The primers for the primary amplification contained both 16S-specific primers (V1_27F and V3_V34R), as well as adapter tails for adding indices and Illumina flow cell adapters in a secondary amplification. The following primers were used (16S-specific sequences in bold): Meta_V1_27F (TCGTCGGCAGCGTCAGATGTGTATAAGAGACAGAGAGTTTGATCMTGGCTCAG) and Meta_V3_534R (GTCTCGTGGGCTCGGAGATGTGTATAAGAGACAGATTACCGCGGCTGCTGG).
The amplicons from the primary PCR were diluted 1:100 in sterile, nuclease-free water, and a second PCR reaction was set up to add the Illumina flow cell adapters (Illumina Inc., San Diego, CA, USA) and indices. The secondary amplification was done on a fixed block BioRad Tetrad PCR machine (Bio-Rad Laboratories, Inc., Hercules, CA, USA) using the following recipe: 5 μL template DNA, 1 μL nuclease-free water, 2 μL 5× KAPA HiFi buffer (Kapa Biosystems, Woburn, MA, USA), 0.3 μL 10 mM dNTPs (Kapa Biosystems, Woburn, MA, USA), 0.5 μL DMSO (Fisher Scientific, Waltham, MA, USA) 0.2 μL KAPA HiFi Polymerase (Kapa Biosystems, Woburn, MA, USA), 0.5 μL forward primer (10 μM), 0.5 μL reverse primer (10 μM). Cycling conditions were: 95 °C for 5 min, followed by 10 cycles of 98 °C for 20 s, 55 °C for 15 s, 72 °C for 1 min, followed by a final extension at 72 °C for 10 min. The following indexing primers were used (X indicates the positions of the 8 bp indices): Forward indexing primer: AATGATACGGCGACCACCGAGATCTACACXXXXXXXXTCGTCGGCAGCGTC and Reverse indexing primer: CAAGCAGAAGACGGCATACGAGATXXXXXXXXGTCTCGTGGGCTCGG.

2.6.2. Normalization and Sequencing

The samples were normalized using a SequalPrep capture-resin bead plate (Life Technologies, Carlsbad, CA, USA) and pooled using equal volume. The final pools were quantified via PicoGreen dsDNA assay (Life Technologies, Carlsbad, CA, USA) and diluted to 2 nM. 10 μL of the 2 nM pool was denatured with 10 μL of 0.2 N NaOH, diluted to 8 pM in Illumina’s HT1 buffer, spiked with 15% phiX, heat denatured at 96 °C for 2 min, and sequenced using a MiSeq 600 cycle v3 kit (Illumina, San Diego, CA, USA).

2.6.3. Sequence Processing and Analysis

Generated sequence data was processed and analyzed using QIIME [28]. Fastq sequence data was processed with the University of Minnesota’s gopher-pipeline for metagenomics [29]. Sequence data had adapters removed and sliding quality trimming window by Trimmomatic [30]; primers removed and overlapping reads merged by Pandaseq [31]. Within QIIME, chimera checking done by chimera slayer, Open reference OTU picking completed with Usearch61, taxonomic identification using GreenGenes (Version 13.8) reference database, rarefied to 14,393 sequences per sample. Analysis was performed using R (R Development Core Team, Vienna, Austria, 2012).

2.7. Statistical Analysis

All statistical analysis was performed using R software (Version 3.2.2, R Development Core Team, Vienna, Austria, 2012). Differences in means were determined using the Kruskal-Wallis ANOVA test, testing the null hypothesis that the location parameter of the groups of abundancies for a given OTU is the same. Multiple comparisons were corrected using the Benjamini-Hochberg FDR (false discovery rate) procedure for multiple comparisons. For gas and SCFA data, ANOVA with Tukey HSD was used to compare means. Significance was set for p-values < 0.05 for all statistical tests.

2.8. Consent Ethics Approval Code

Voluntary informed consent was obtained from all fecal donors prior to this study according to University of Minnesota policies and procedures.

3. Results

3.1. Gas Production

At 12 h, the OatWell and the pure beta-glucan samples produced similar amounts of total gas (Figure 1). The XOS samples produced significantly more gas than the pure beta glucan samples (p < 0.01) or the OatWell samples (p < 0.01). The WholeFiber and pure inulin samples produced similar amounts of total gas (p = 0.102), and the total gas production for both of these prebiotic dietary fibers was significantly higher than the XOS samples, (p < 0.01 and p = 0.045), respectively. At 24 h, the OatWell samples had the lowest gas production (46.2 mL) and were similar to the pure beta-glucan samples (63.7 mL; p = 0.498). The 24 h XOS samples (74.0 mL) were also similar to the beta-glucan samples (p = 0.926). However, the 24 h WholeFiber (109.6 mL) and pure inulin (107.1 mL) samples produced significantly more gas than XOS, beta-glucan and Oatwell samples (p < 0.01). Individual variation in gas production can be seen in Table S1.

3.2. SCFA Production

For all SCFA analysis, analysis at 12 and 24 h shows production only, from baseline corrected samples. Acetate, propionate and butyrate production is shown as μmol/mL of fermentation media. Individual variation in SCFA production can be seen in Table S1.
Acetate production at 12 h was similar for the Oatwell, WholeFiber and beta-glucan samples (Figure 2). The XOS samples produced significantly more acetate at 12 h than the Oatwell, WholeFiber or beta-glucan samples (p < 0.05). The inulin samples had similar amounts of acetate compared to the WholeFiber and XOS samples, and significantly more than the Oatwell (p = 0.024) and beta-glucan (p = 0.013) samples at 12 h. After 24 h, the inulin samples contained less acetate than the XOS samples (p = 0.038), while the Oatwell, WholeFiber and beta-glucan samples were similar to both the XOS and inulin samples.
Propionate production at 12 h of fermentation was highest for the OatWell samples (4.76 μmol/mL) and was significantly greater than the WholeFiber (p = 0.029), XOS (p = 0.005) and inulin samples (p = 0.004), and similar to the beta-glucan samples (Figure 3). At 24 h of fermentation, the Oatwell samples had the highest mean production 5.05 μmol/mL, which was significantly greater than the XOS samples (2.58 μmol/mL; p = 0.021), and similar to WholeFiber, inulin and beta-glucan samples.
Butyrate production after 12 h of fermentation ranged from 7.30 μmol/mL for the beta-glucan samples to 16.76 μmol/mL for the inulin samples (Figure 4). The inulin samples had the highest average production, and were similar to the XOS (16.38 μmol/mL) and WholeFiber samples (12.89 μmol/mL). The XOS samples were significantly higher than the Oatwell (p = 0.035) and beta-glucan samples (p = 0.014). At 24 h of fermentation, all five prebiotic dietary fibers were statistically similar to one another, ranging from 7.93–14.08 μmol/mL due to a wide ranges in response differences between the three fecal donors used in this study.

3.3. Microbiota Analysis

Extracted DNA from in vitro samples were sequenced using the MiSeq Illumina platforms (Illumina Inc., San Diego, CA, USA) generating a total of 31,591,899 sequence reads. Sequencing parameters identified reads belonging to 11 bacterial phyla, 61 families and 97 genera.
For all three donors, the phyla Bacteroidetes and Firmicutes represented > 80% of all sequence reads (Figure S1) across 24 h of fermentation. At the family level, 13 families represented 85% of all sequence reads (Figure S2), while 11 genera represented >75% of all sequence reads (Figure S3). Six metrics measuring α-diversity for all donors showed various degrees of similarity by donors (Figure S4), and by treatment (Figure S5). Both Unifrac and Bray-Curtis β-diversity metrics (measuring pairwise dissimilarity between samples), showed similarity among technical replicates of treatment groups for each donor (Figure S6) as well as for all treatment groups for each respective donor (Figure S7).
After 24 h of fermentation, the Oatwell samples significantly decreased the population of SMB53 (0 h:9.11 OTUs; 24 h:2.11 OTUs; p = 0.008), Lachnospira and Faecalibacterium (0 h:26.56 OTUs; 24 h:4.44 OTUs; p = 0.008 and 0 h 136.44 OTUs; 24 h:66 OTUs; p = 0.022, respectively) (Table 3). No genera analyzed showed significant increases in 24 h for the Oatwell samples measured for the three fecal donors in this study. The WholeFiber samples (Table 4) significantly increased the genus Collinsella at 24 h compared to 0 h (0 h:68 OTUs; 24 h:299.78 OTUs; p = 0.011). Bifidobacterium populations were only significantly increased at 24 h compared to 0 h for the XOS samples (0 h:0.67 OTUs; 24 h:5.22 OTUs; p = 0.038), while the same samples showed a significant decrease in Lachnospira and Faecalibacterium (p = 0.038 and p = 0.03) (Table 5). The inulin samples (Table 6) increased Collinsella (0 h:55.11 OTUs; 24 h:291.44 OTUs; p = 0.016). The pure beta glucan samples significantly decreased Lachnospira and Faecalibacterium (p = 0.008) (Table 7).

4. Discussion

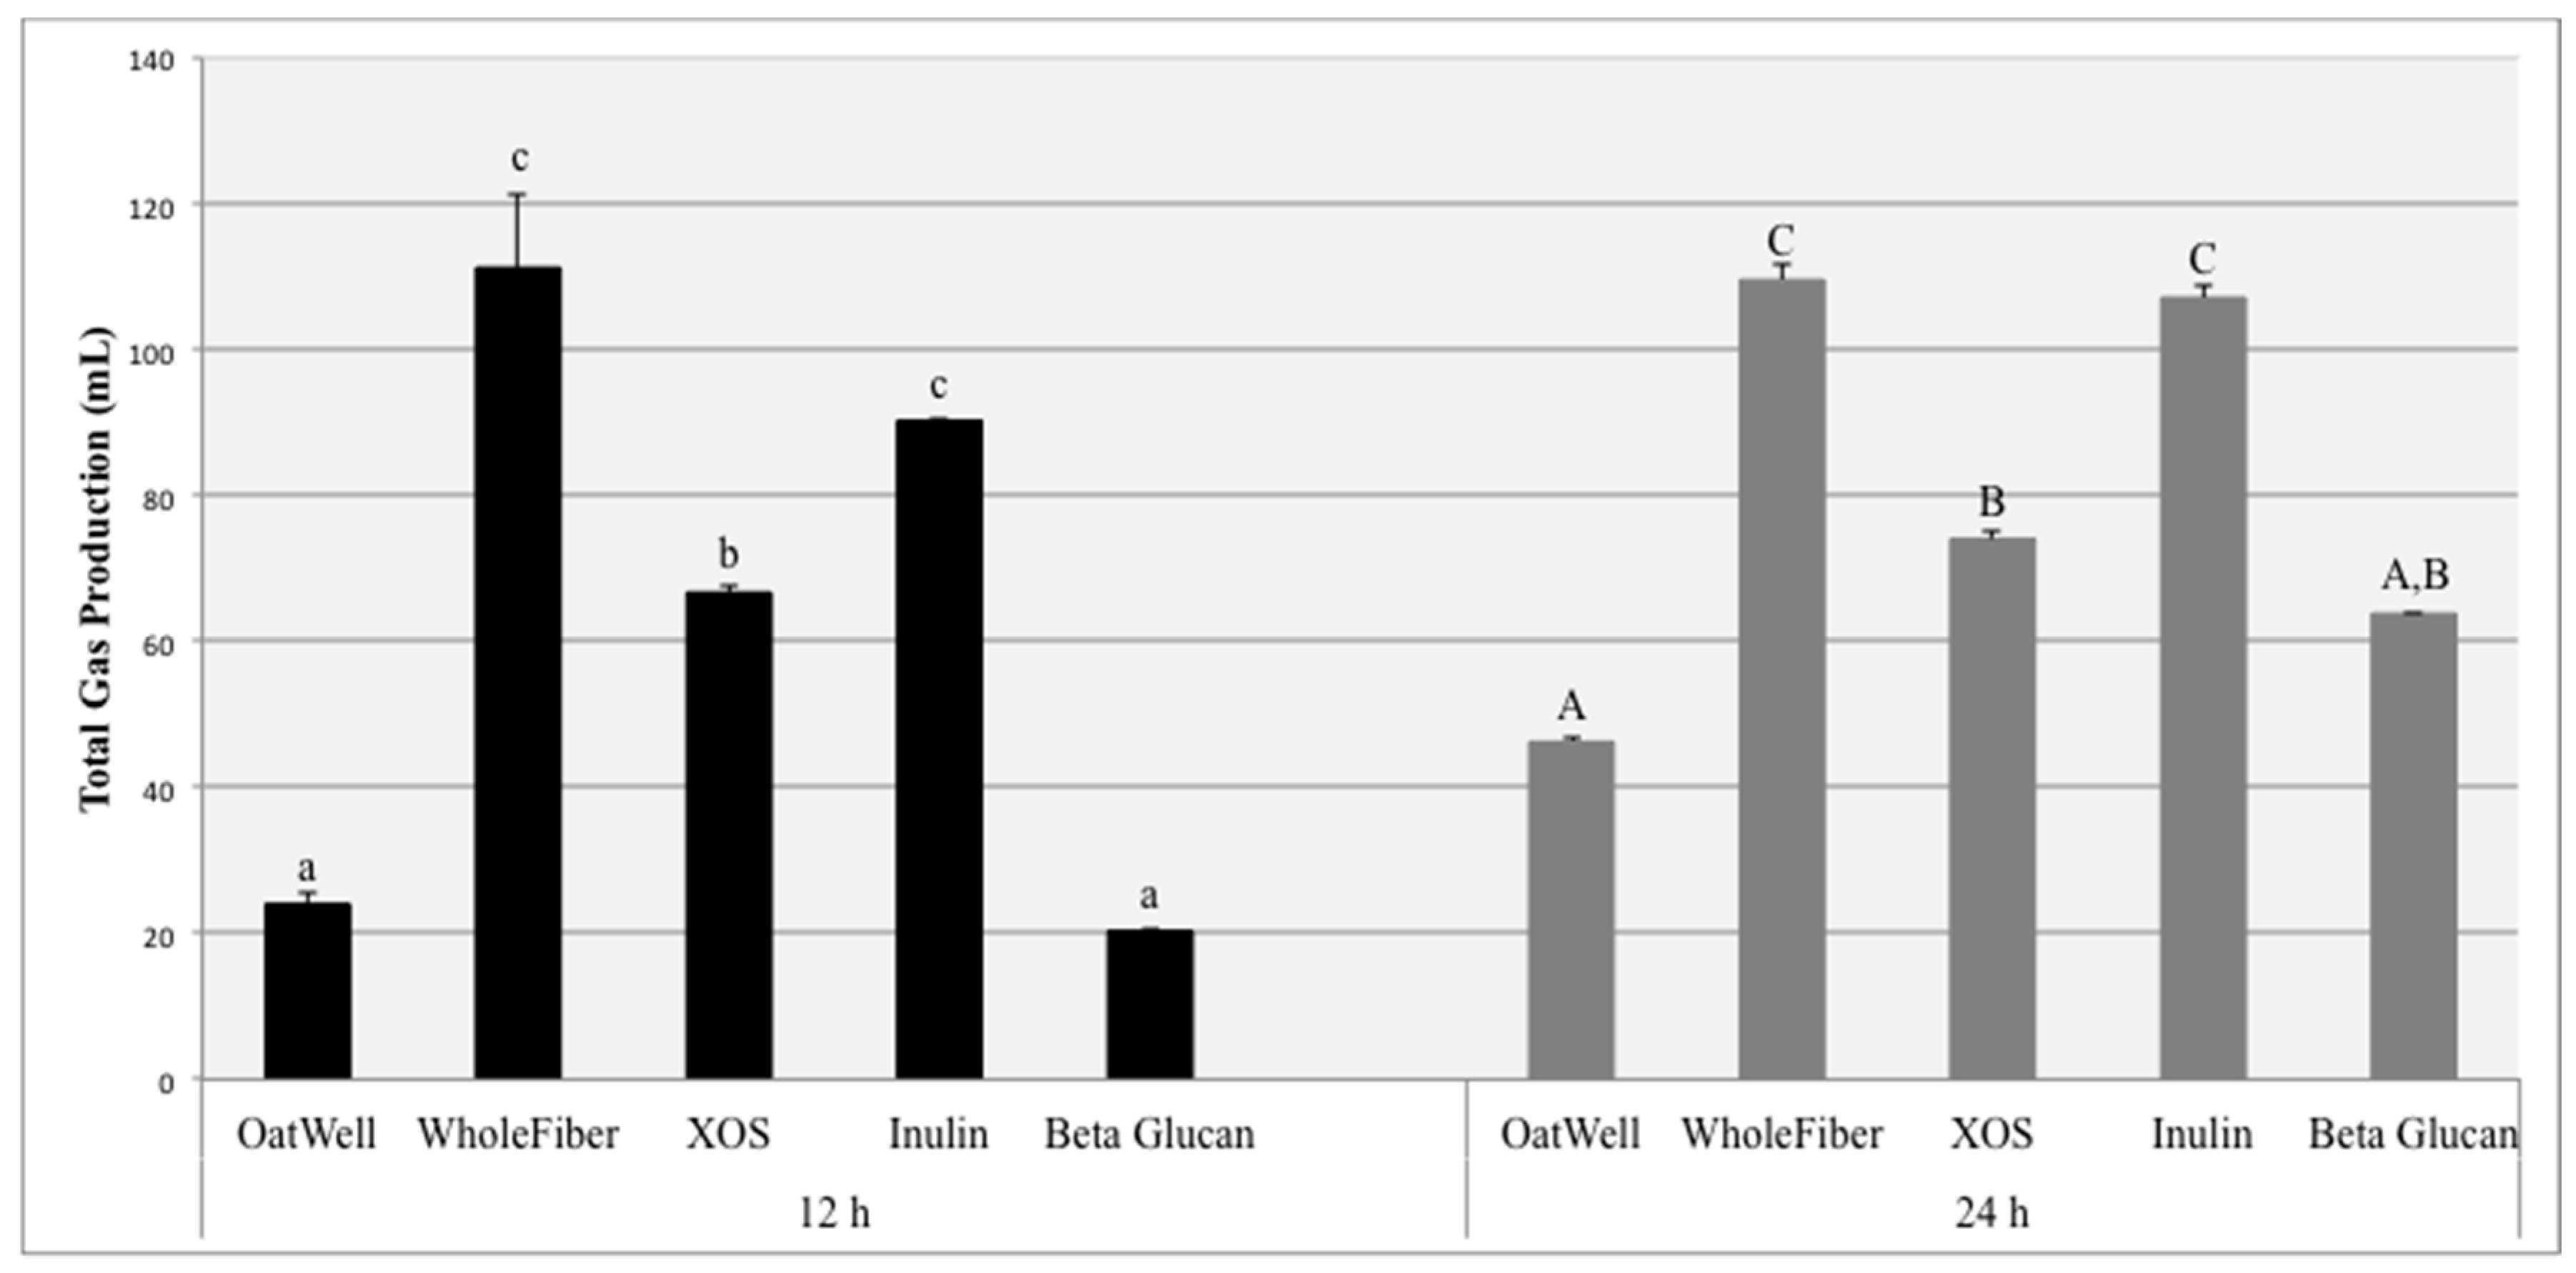
The aim of this study was to investigate the beneficial effects of commonly consumed prebiotic dietary fibers, including their ability to influence the growth of identified bacterial populations, form beneficial SCFAs, and the amount of gas they produce due to fermentation. Total gas production due to fiber fermentation depends on a wide range of factors. The inulin samples and the WholeFiber samples (mixture of dried chicory root inulin, pectin and hemi/cellulose) resulted in the highest gas production at both 12 and 24 h. These results are consistent with results from both clinical feeding studies and other in vitro experiments, in which fermentation of inulin products resulted in high amounts of gas production, sometimes resulting in mild negative gastrointestinal symptoms, depending on the dosage [32,33]. Similar in vitro studies have found inulin to be much more fermentable than beta-glucan products, for both barley and oat-derived beta-glucans [34]. XOS fermentation results in less gas production than the inulin products, and more gas than beta-glucan products. Because of these findings, previous studies based on digestive tolerance and parameters have established a tolerated daily dosage for XOS of approximately 12 g/day [35].
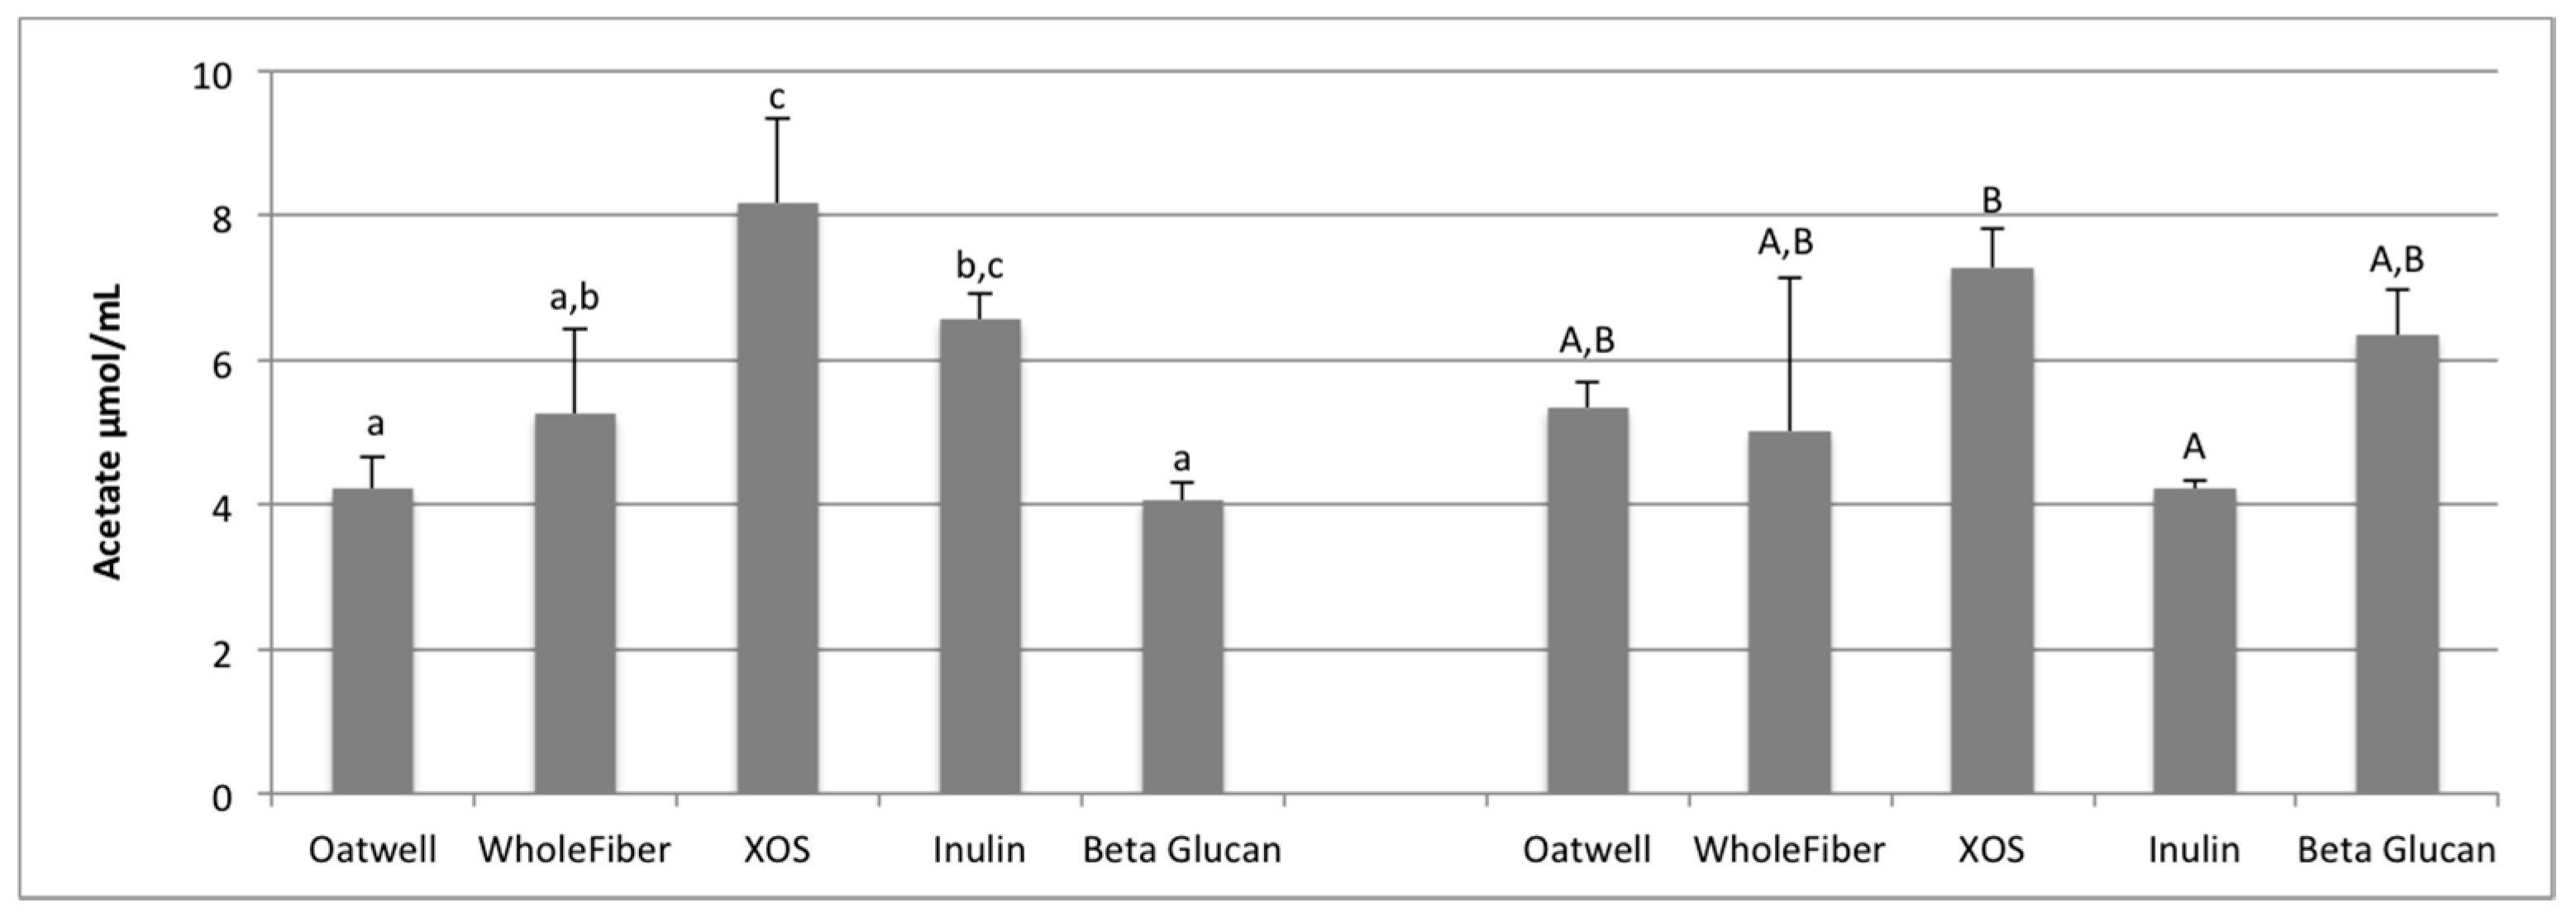
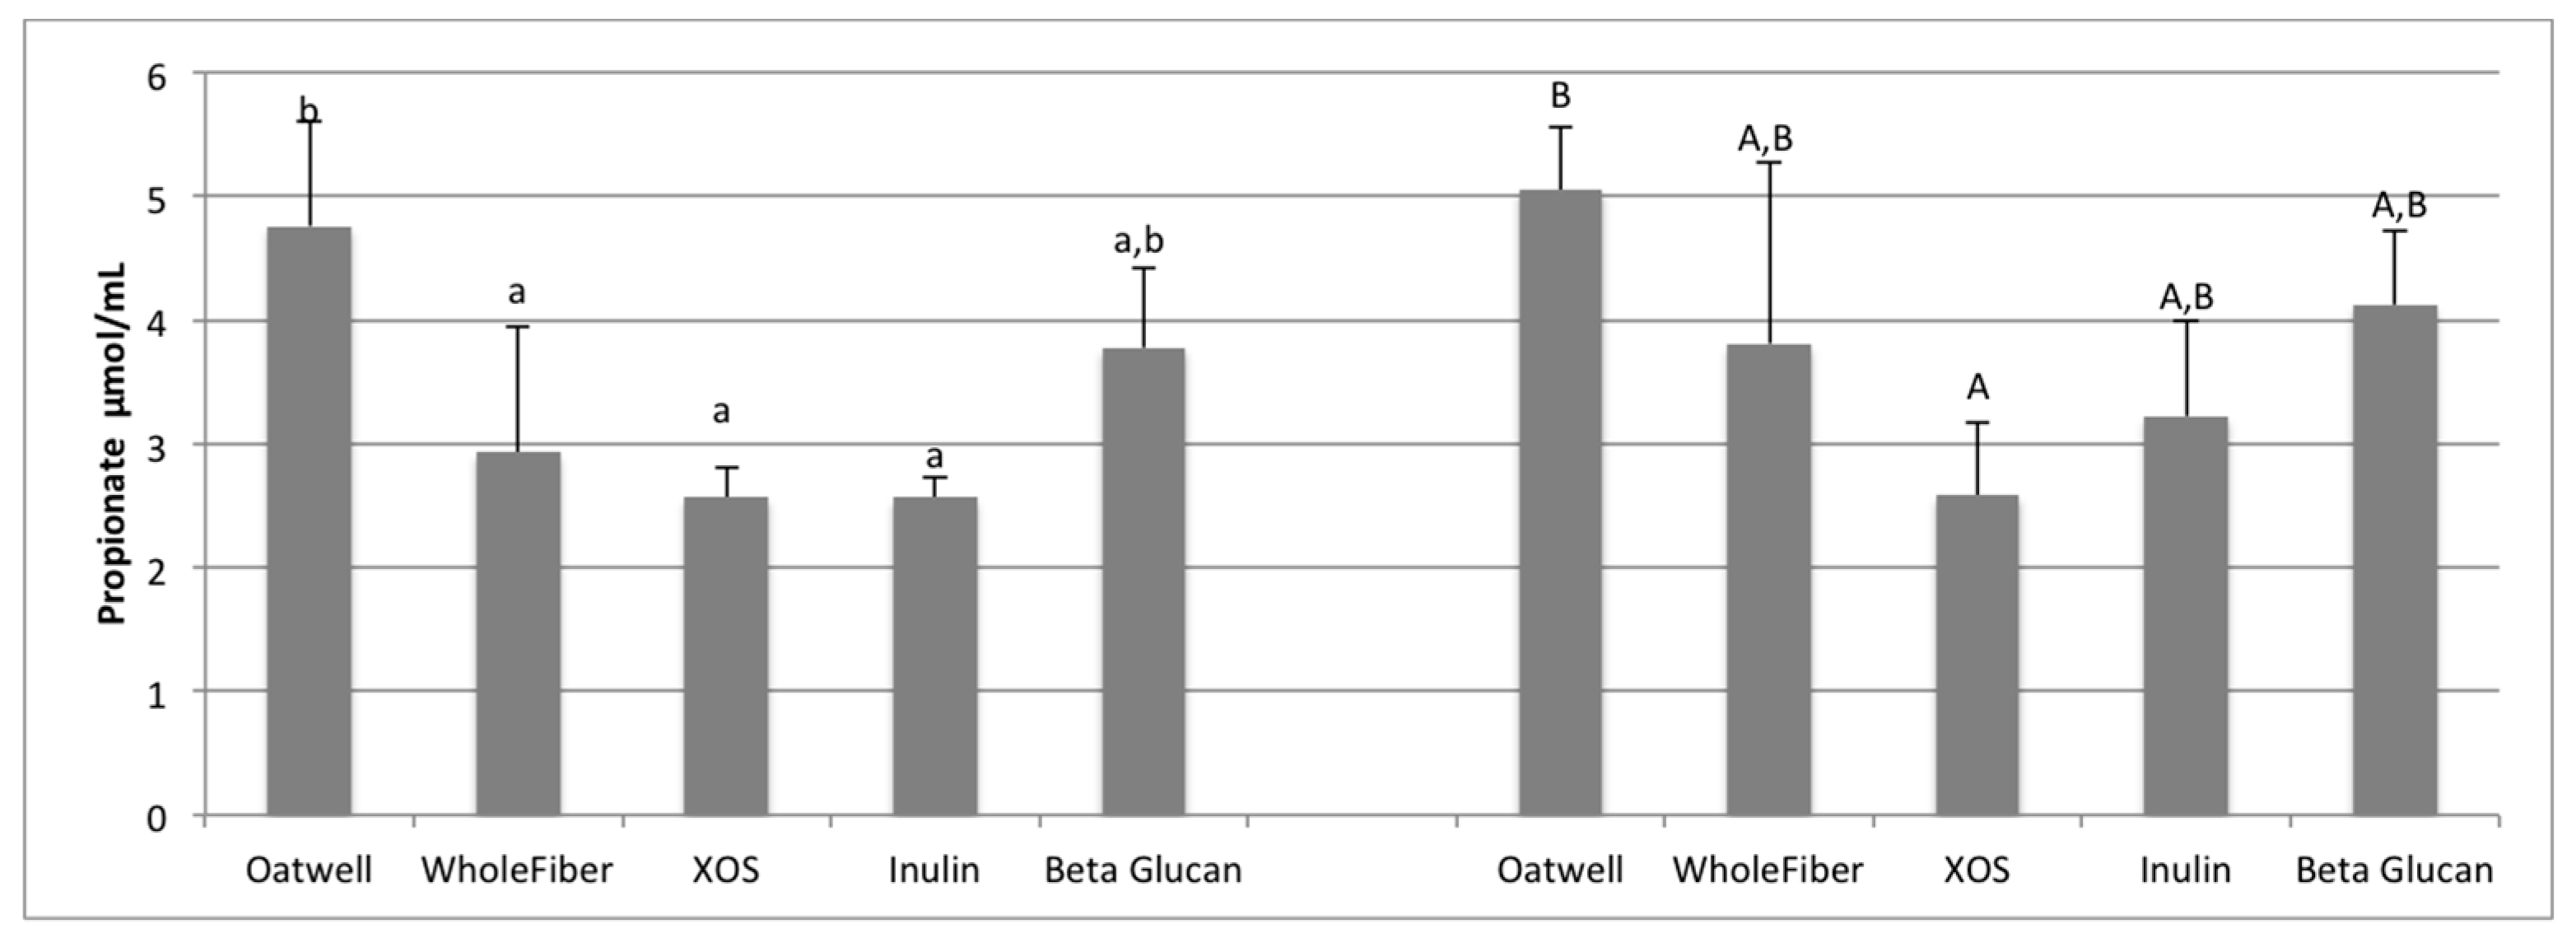
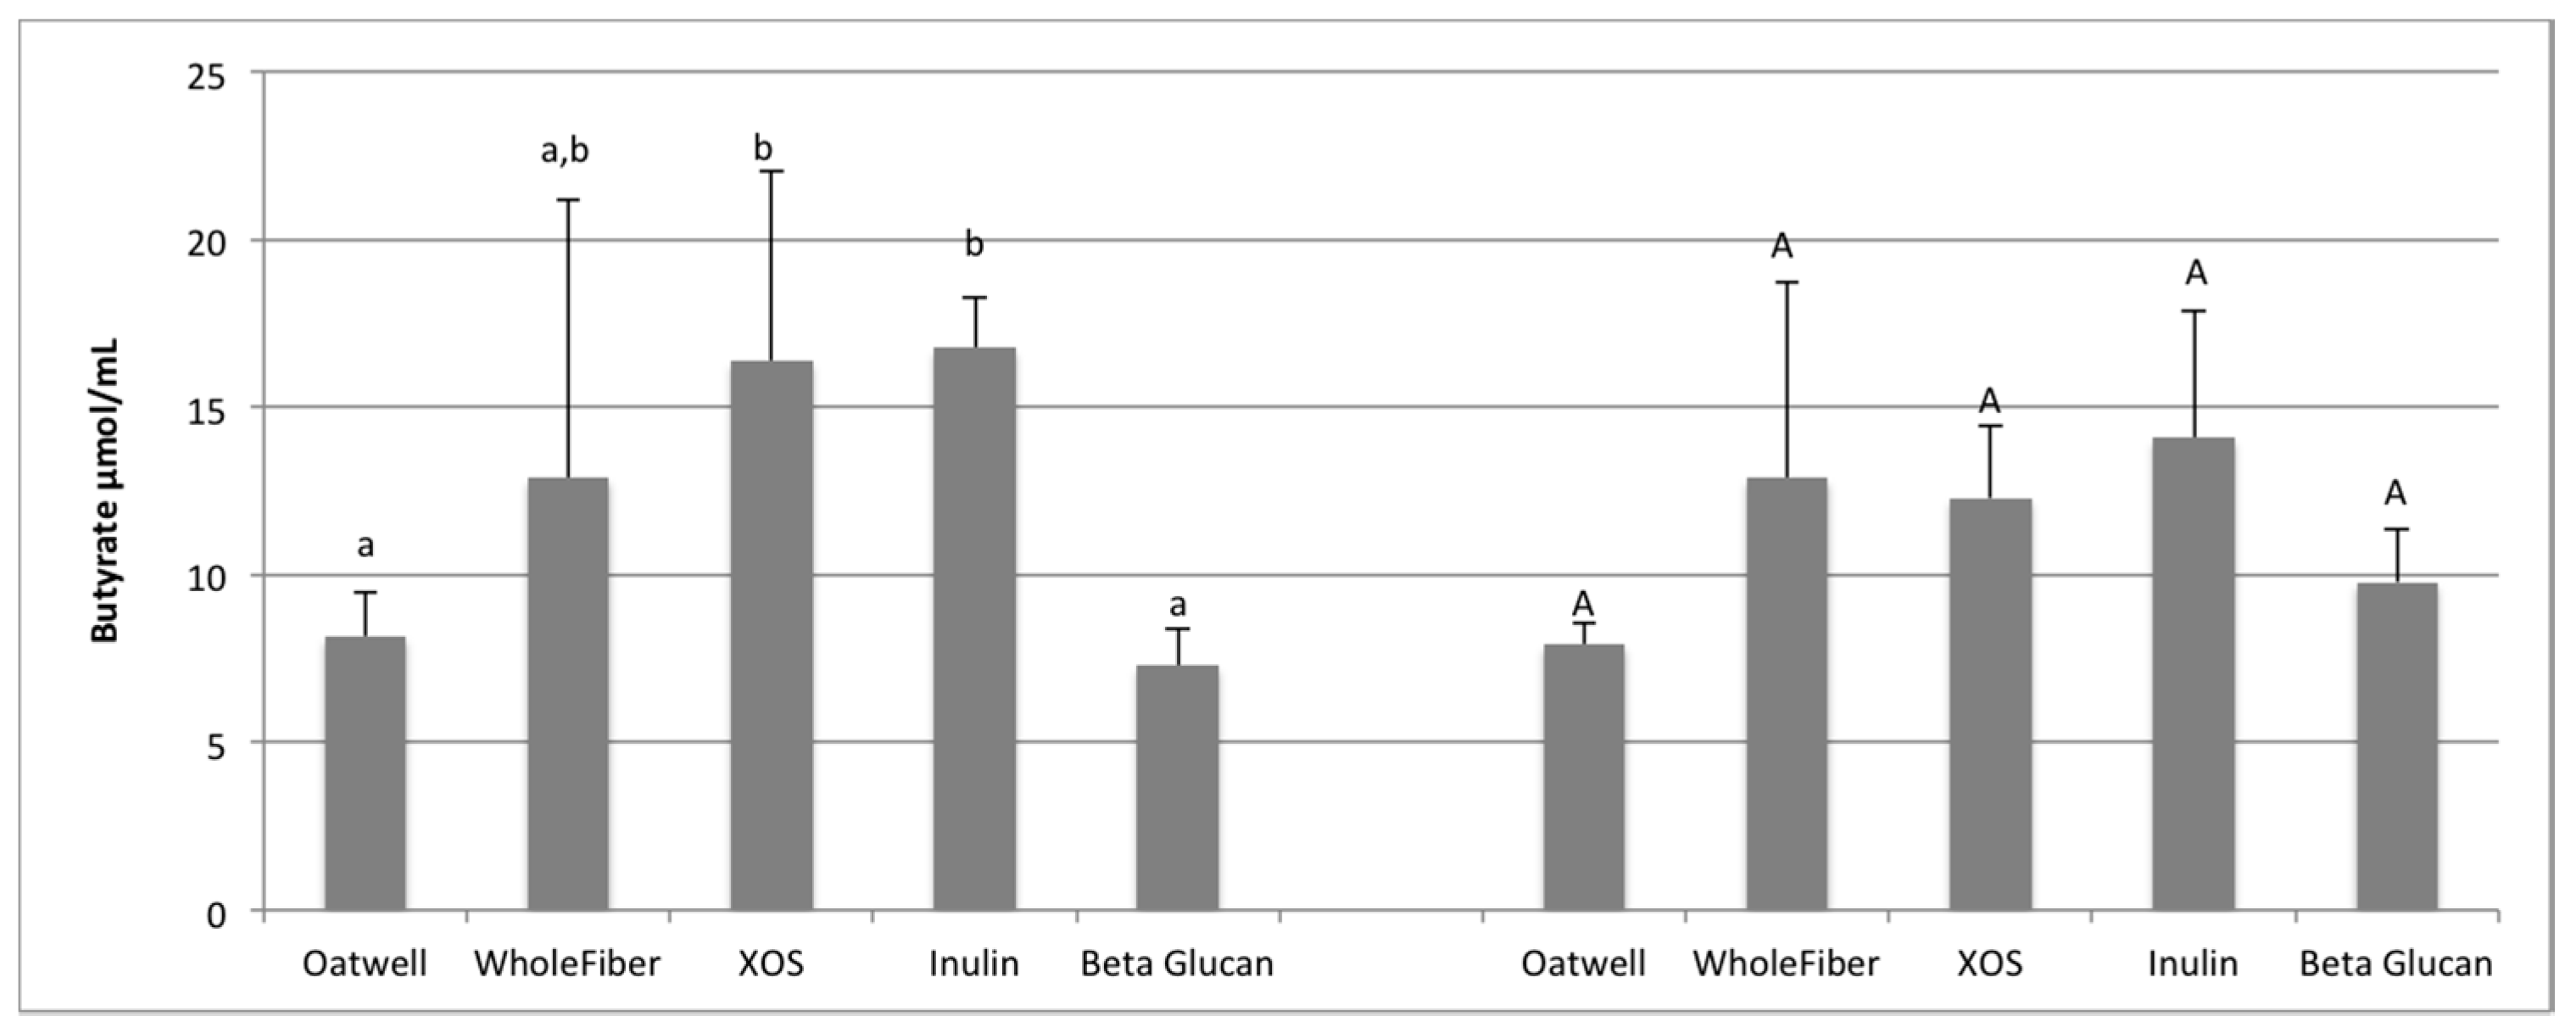
SCFA production due to the fermentation of prebiotic dietary fibers promotes many beneficial health outcomes to the host. SCFA production may contribute to up to 10% of the host’s metabolizable energy daily, with production of total SCFAs usually between 100–200 mmol/day, but is highly dependent on the donor and availability of substrates for fermentation [36,37]. At 12 h of fermentation, the OatWell and beta-glucan samples had significantly higher concentrations of propionate, and the highest mean concentration at 24 h, compared to the other prebiotic dietary fibers analyzed. Similar in vitro studies with beta-glucan based products have also shown similar preference for these products to result in propionate formation [34]. Although no mechanism has been identified, and studies show conflicting results [38], elevated serum propionate concentrations have been shown to have a hypocholesterolaemic effect [39]. Propionate may also play an influential role in satiety, although mechanisms still remain unclear [40,41]. Cholesterol-lowering properties of beta-glucans may be limited to effects from the upper-GI, although many propionate-producing bacteria have a preference to fermenting various types of beta-glucans (Bacteroides, Prevotella, Clostridium) based on the presence of genes responsible for endo-β-glucanase enzyme production [42].
Microbial diversity among fecal donors complicates the identification of trends among the five treatment groups (Supplemental Figures S8 and S9). In terms of taxonomic shift, the inulin-based products were fermented nearly identically by all three fecal donors. Both pure inulin and WholeFiber promoted the growth of Collinsella comparing the 24 h samples to the 0 h samples. Inulin-type fructans have been shown in clinical studies to promote substantial growth of Collinsella, paralleled with increased urinary hippurate levels [43]. Hippurate is a metabolite derived from various fermentation processes in the gut that has been found in decreased concentrations in obese individuals compared to lean individuals, and also between diabetics and non-diabetics [44,45,46]. The genus Collinsella has been found in lower concentrations in individuals with IBD compared to healthy controls [47], while Collinsella aerofaciens has been associated with low risk of colorectal cancer [48]. Increases in Collinsella and increased urinary hippurate levels are considered a beneficial effect of inulin consumption due to its prebiotic capacity [43]. In vivo studies with inulin, scFOS and resistant starch supplementation have found decreases in the SMB53 genus, consistent with the OatWell treatment in the present study [30,31].
A significant increase in the genus Bifidobacterium was observed only with the XOS treatment. Rycroft et al. found a similar affinity of Bifidobacterium toward XOS [49]. However, previous studies have shown inulin to also stimulate the growth of Bifidobacterium [49,50,51,52]. While there was an overall rise in Bifidobacterium with the inulin treatment group between 0 h and 24 h (1.33, 5.44 OTUs respectively), this study did not find that increase to be significant (p = 0.304). The small sample size and individual microbiome variability likely played a role in this result. Increases in Bifidobacterium have been heavily studied and reviewed, and are considered a beneficial effect due to their correlation with many positive health outcomes [1]. Bifidobacteria reside naturally in the gastrointestinal tract of healthy human adults and have a strong affinity to ferment oligosaccharides, making them a common marker for prebiotic capacity. Bifidobacterium is a unique genus of bacteria in that no gas is formed as an end product of metabolism [53]. Like Lactobacillus, these bacteria are saccharolytic, often considered a beneficial trait [54]. Bifidobacteria also do not produce any known carcinogenic substances in vivo. Bifidobacteria concentrations have been negatively associated with obesity and weight gain [55,56,57,58]. Increases in Bifidobacteria have also been correlated with a decrease in blood lipopolysaccharides (LPS), inflammatory reagents that play a role in the development of inflammatory metabolic disorders and conditions, and are primarily found in gram-negative bacteria [59]. LPS induce the activation of Toll-like receptor 4 (TLR4), which leads to inflammation due to release of pro-inflammatory cytokines and chemokines [60].
In vitro fermentations are semi-representative models of colonic fermentation, but have limitations [18]. This study did not include an in vitro digestion process, which would remove digestible contents from the samples prior to fermentation, and would be a more representative model. However, because the test substrates are primarily fiber, which is non-digestible, this should have minimal impact on the results of this study. In vivo, formed gases are continually absorbed and colonic absorption is rapid. Because SCFAs are rapidly absorbed and difficult to measure, in vitro models help to understand the kinetics of colonic fermentation. However, in vitro models must be paired with similar in vivo models to better understand the full mechanisms of action resulting from colonic fermentation of prebiotic dietary fibers. Because the SCFA are not absorbed in in vitro models, the SCFA produced can alter the pH of the fermentation media. While the fermentation media was designed to mimic the pH of the distal colon at baseline, the pH of the media in this study was not further controlled throughout the experiment. This is another limitation of this in vitro model. An additional limitation of this study was the small sample size. The present study was conducted using fecal inoculum from only three donors. Due to the individual variability between the donor’s microbiota (Figure S7), a larger sample size may be needed to achieve a more representative view of the effects of each of the fibers.

5. Conclusions

All five prebiotics measured in this study display fermentability and SCFA production that could have potential health benefits. Depending on their structure, each compound offers a specific carbon source for fermentation by different bacterial populations, yielding changes in beneficial taxa and production of various amounts of SCFAs and gas in vitro. For instance, while OatWell and beta-glucans promoted propionate production, XOS increased concentrations of Bifodobacterium, and WholeFiber and pure inulin promoted Collinsella growth. Findings in this study are consistent with other in vitro studies with similar prebiotic dietary fibers, as well as clinical feeding studies [34,43,49,61,62,63].

Supplementary Materials

The following are available online at www.mdpi.com/2072-6643/9/12/1361/s1. Table S1: Gas and SCFA Production Comparing Fermentation Differences of Five Prebiotic Dietary Fibers at 12 h and 24 h Post-Exposure to Fecal Microbiota from Three Individual Donors in an In Vitro Fermentation System, Figure S1: Identified phyla from three fecal donors microbiota at 0, 12 and 24 h of fermentation for five prebiotic dietary fibers analyzed based on percent of sequence reads, Figure S2: Identified abundant families for three fecal donors at 0, 12 and 24 h of fermentation for five prebiotic dietary fibers analyzed based on percent of sequence reads, Figure S3: Identified abundant genera for three fecal donors at 0, 12 and 24 h of fermentation for five prebiotic dietary fibers analyzed based on percent of sequence reads, Figure S4: Six metrics of analysis for alpha-diversity among samples at 0, 12 and 24 h of analysis, grouped by donor for all five prebiotic dietary fibers analyzed, Figure S5: Six metrics of analysis for alpha-diversity among samples at 0, 12 and 24 h of analysis, grouped by treatment for all three fecal donors, Figure S6: Bray-Curtis β-diversity principal component analysis of technical replicates among each treatment group between microbiota analysis of three fecal donors, Figure S7: Bray-Curtis β-diversity principal component analysis among microbiota of three fecal donors at 0, 12 and 24 h of analysis, Figure S8: Variations in abundant phyla among three donors analyzed, Figure S9: Variations in treatment groups and pooled donors analyzed.

Acknowledgments

This study was funded by DSM. The authors would like to thank Hannah Paruzynski for the laboratory assistance, the University of Minnesota Genomics Center for the analysis of the samples, The University of Minnesota Doctoral Dissertation Fellowship for financial research support, and the companies who donated time and resources to this project.

Author Contributions

Joanne L. Slavin and Justin L. Carlson conceived and designed the experiment; Justin L. Carlson, Jennifer M. Erickson and Julie M. Hess performed the experiments. Justin L. Carlson analyzed the data, Trevor J. Gould was responsible for analysis of sequencing data. Manuscript was prepared by Justin L. Carlson and Jennifer M. Erickson, and read and approved by all authors.

Conflicts of Interest

The authors declare no conflict of interest. The funding sponsors had no role in the design of the study; in the collection, analyses, or interpretation of data; in the writing of the manuscript, and in the decision to publish the results.

References

  1. Carlson, J.; Slavin, J. Health benefits of fibre, prebiotics and probiotics: A review of intestinal health and related health claims. Qual. Assur. Saf. Crop. Foods 2016, 6, 1–16. [Google Scholar] [CrossRef]
  2. Brownawell, A.M.; Caers, W.; Gibson, G.R.; Kendall, C.W.C.; Lewis, K.D.; Ringel, Y.; Slavin, J.L. Prebiotics and the Health Benefits of Fiber: Current Regulatory Status, Future Research, and Goals. J. Nutr. 2012, 142, 962–974. [Google Scholar] [CrossRef] [PubMed]
  3. Gibson, G.R.; Hutkins, R.; Sanders, M.E.; Prescott, S.L.; Reimer, R.A.; Salminen, S.J.; Scott, K.; Stanton, C.; Swanson, K.S.; Cani, P.D.; et al. Expert consensus document: The International Scientific Association for Probiotics and Prebiotics (ISAPP) consensus statement on the definition and scope of prebiotics. Nat. Rev. Gastroenterol. Hepatol. 2017. [Google Scholar] [CrossRef] [PubMed]
  4. Gibson, G.R.; Roberfroid, M.B. Dietary modulation of the human colonic microbiota: Introducing the concept of prebiotics. J. Nutr. 1995, 125, 1401–1412. [Google Scholar] [CrossRef] [PubMed]
  5. Gibson, G.R.; Probert, H.M.; Van Loo, J.; Rastall, R.A.; Roberfroid, M.B. Dietary modulation of the human colonic microbiota: Updating the concept of prebiotics. Nutr. Res. Rev. 2004, 17, 259–275. [Google Scholar] [CrossRef] [PubMed]
  6. Slavin, J. Fiber and prebiotics: Mechanisms and health benefits. Nutrients 2013, 5, 1417–1435. [Google Scholar] [CrossRef] [PubMed]
  7. Bindels, L.B.; Delzenne, N.M.; Cani, P.D.; Walter, J. Towards a more comprehensive concept for prebiotics. Nat. Rev. Gastroenterol. Hepatol. 2015. [Google Scholar] [CrossRef] [PubMed]
  8. Aachary, A.A.; Prapulla, S.G. Xylooligosaccharides (XOS) as an Emerging Prebiotic: Microbial Synthesis, Utilization, Structural Characterization, Bioactive Properties, and Applications. Compr. Rev. Food Sci. Food Saf. 2011, 10, 2–16. [Google Scholar] [CrossRef]
  9. Vázquez, M.; Alonso, J.; Domı́nguez, H.; Parajó, J. Xylooligosaccharides: Manufacture and applications. Trends Food Sci. Technol. 2000, 11, 387–393. [Google Scholar] [CrossRef]
  10. Christakopoulos, P.; Katapodis, P. Antimicrobial activity of acidic xylo-oligosaccharides produced by family 10 and 11 endoxylanases. Int. J. Biol. Macromol. 2003, 31, 171–175. [Google Scholar] [CrossRef]
  11. Katapodis, P.; Kavarnou, A.; Kintzios, S. Production of acidic xylo-oligosaccharides by a family 10 endoxylanase from thermoascus aurantiacus and use as plant growth regulators. Biotechnol. Lett. 2002, 24, 1413–1416. [Google Scholar] [CrossRef]
  12. Vardakou, M.; Katapodis, P.; Topakas, E.; Kekos, D.; Macris, B.J.; Christakopoulos, P. Synergy between enzymes involved in the degradation of insoluble wheat flour arabinoxylan. Innov. Food Sci. Emerg. Technol. 2004, 5, 107–112. [Google Scholar] [CrossRef]
  13. Yang, R.; Xu, S.; Wang, Z.; Yang, W. Aqueous extraction of corncob xylan and production of xylooligosaccharides. LWT-Food Sci. Technol. 2005, 38, 677–682. [Google Scholar] [CrossRef]
  14. Yuan, Q.; Zhang, H. Pilot-plant production of xylo-oligosaccharides from corncob by steaming, enzymatic hydrolysis and nanofiltration. J. Chem. Technol. Biotechnol. 2004, 78, 1073–1079. [Google Scholar] [CrossRef]
  15. Niness, K.R. Inulin and Oligofructose: What Are They? J. Nutr. 1999, 129, 1402S–1406S. [Google Scholar] [PubMed]
  16. Carpita, N.C.; Kanabus, J.; Housley, T.L. Linkage Structure of Fructans and Fructan Oligomers from Triticum aestivum and Festuca arundinacea Leaves. J. Plant Physiol. 1989, 134, 162–168. [Google Scholar] [CrossRef]
  17. Lam, K.L.; Chi-Keung Cheung, P. Non-digestible long chain beta-glucans as novel prebiotics. Bioact. Carbohydr. Diet. Fibre 2013, 2, 45–64. [Google Scholar] [CrossRef]
  18. Wisker, E.; Daniel, M. Fermentation of non-starch polysaccharides in mixed diets and single fibre sources: Comparative studies in human subjects and in vitro. Br. J. Nutr. 1998, 80, 253–261. [Google Scholar] [PubMed]
  19. Payne, A.N.; Zihler, A.; Chassard, C.; Lacroix, C. Advances and perspectives in in vitro human gut fermentation modeling. Trends Biotechnol. 2012, 30, 17–25. [Google Scholar] [CrossRef] [PubMed]
  20. Broekaert, W.F.; Courtin, C.M.; Verbeke, K.; Van de Wiele, T.; Verstraete, W.; Delcour, J.A. Prebiotic and Other Health-Related Effects of Cereal-Derived Arabinoxylans, Arabinoxylan-Oligosaccharides, and Xylooligosaccharides. Crit. Rev. Food Sci. Nutr. 2011, 51, 178–194. [Google Scholar] [CrossRef] [PubMed]
  21. Okazaki, M.; Fufikawa, S.; Matsumoto, N. Effect of xylooligosaccharides on the growth of bifidobacteria. Bifidobact. Microflora 1990, 9, 77–86. [Google Scholar] [CrossRef]
  22. Na, M.H.; Kim, W.K. Effects of Xyooligosaccharide Intake on Fecal Bifidobacteria, Lactic acid and Lipid Concentration in Korean Young Women. Korean J. Nutr. 2004, 37, 662–668. [Google Scholar]
  23. Tateyama, I.; Hashii, K.; Johno, I.; Iino, T.; Hirai, K.; Suwa, Y.; Kiso, Y. Effect of xylooligosaccharide intake on severe constipation in pregnant women. J. Nutr. Sci. Vitaminol. (Tokyo) 2005, 51, 445–448. [Google Scholar] [CrossRef] [PubMed]
  24. Koecher, K.J.; Noack, J.A.; Timm, D.A.; Klosterbuer, A.S.; Thomas, W.; Slavin, J.L. Estimation and Interpretation of Fermentation in the Gut: Coupling Results from a 24 h Batch in Vitro System with Fecal Measurements from a Human Intervention Feeding Study Using Fructo-oligosaccharides, Inulin, Gum Acacia, and Pea Fiber. J. Agric. Food Chem. 2014, 62, 1332–1337. [Google Scholar] [CrossRef] [PubMed]
  25. McBurney, M.I.; Thompson, L.U. Effect of human faecal inoculum on in vitro fermentation variables. Br. J. Nutr. 1987, 58, 233. [Google Scholar] [CrossRef] [PubMed]
  26. Schneider, S.M.; Girard-Pipau, F.; Anty, R.; van der Linde, E.G.M.; Philipsen-Geerling, B.J.; Knol, J.; Filippi, J.; Arab, K.; Hébuterne, X. Effects of total enteral nutrition supplemented with a multi-fibre mix on faecal short-chain fatty acids and microbiota. Clin. Nutr. 2006, 25, 82–90. [Google Scholar] [CrossRef] [PubMed]
  27. Carlson, J.; Hospattankar, A.; Deng, P.; Swanson, K.; Slavin, J. Prebiotic Effects and Fermentation Kinetics of Wheat Dextrin and Partially Hydrolyzed Guar Gum in an In Vitro Batch ermentation System. Foods 2015, 4, 349–358. [Google Scholar] [CrossRef] [PubMed]
  28. Caporaso, J.G.; Kuczynski, J.; Stombaugh, J.; Bittinger, K.; Bushman, F.D.; Costello, E.K.; Fierer, N.; Peña, A.G.; Goodrich, J.K.; Gordon, J.I.; et al. QIIME allows analysis of high-throughput community sequencing data. Nat. Methods 2010, 7, 335–336. [Google Scholar] [CrossRef] [PubMed]
  29. Garbe, J.; Gould, T.; Gohl, D.; Knights, D.; Beckman, K. Metagenomics Pipeline, version 1; Gopher-Pipelines: Minneapolis, MN, USA, 2016. [Google Scholar]
  30. Bolger, A.M.; Lohse, M.; Usadel, B. Trimmomatic: A flexible trimmer for Illumina sequence data. Bioinformatics 2014, 30, 2114–2120. [Google Scholar] [CrossRef] [PubMed]
  31. Masella, A.P.; Bartram, A.K.; Truszkowski, J.M.; Brown, D.G.; Neufeld, J.D. PANDAseq: Paired-end assembler for illumina sequences. BMC Bioinform. 2012, 13, 31. [Google Scholar] [CrossRef] [PubMed]
  32. Bonnema, A.L.; Kolberg, L.W.; Thomas, W.; Slavin, J.L. Gastrointestinal tolerance of chicory inulin products. J. Am. Diet. Assoc. 2010, 110, 865–868. [Google Scholar] [CrossRef] [PubMed]
  33. Timm, D.A.; Stewart, M.L.; Hospattankar, A.; Slavin, J.L. Wheat Dextrin, Psyllium, and Inulin Produce Distinct Fermentation Patterns, Gas Volumes, and Short-Chain Fatty Acid Profiles In Vitro. J. Med. Food 2010, 13, 961–966. [Google Scholar] [CrossRef] [PubMed]
  34. Hughes, S.A.; Shewry, P.R.; Gibson, G.R.; Mccleary, B.V.; Rastall, R.A. In vitro fermentation of oat and barley derived b-glucans by human faecal microbiota. FEMS Microbiol. Ecol. 2008, 64, 482–493. [Google Scholar] [CrossRef] [PubMed]
  35. Xiao, L.; Ning, J.; Xu, G. Application of Xylo-oligosaccharide in modifying human intestinal function. Afr. J. Microbiol. Res. 2012, 6, 2116–2119. [Google Scholar] [CrossRef]
  36. Livesey, G. Energy values of unavailable carbohydrate and diets: An inquiry and analysis. Am. J. Clin. Nutr. 1990, 51, 617–637. [Google Scholar] [PubMed]
  37. Cook, S.I.; Sellin, J.H. Review article: Short chain fatty acids in health and disease. Aliment. Pharmacol. Ther. 1998, 12, 499–507. [Google Scholar] [CrossRef] [PubMed]
  38. Malkki, Y.; Autio, K.; Hanninen, O.; Myllymaki, O.; Pelkonen, K.; Suortti, T.; Torronen, R. Oat Bran Concentrates: Physical Properties of Beta-Glucan and Hypocholesterolemic Effects in Rats; FAO: Rome, Italy, 1992. [Google Scholar]
  39. Chen, W.-J.L.; Anderson, J.W.; Jennings, D. Propionate May Mediate the Hypocholesterolemic Effects of Certain Soluble Plant Fibers in Cholesterol-Fed Rats. Exp. Biol. Med. 1984, 175, 215–218. [Google Scholar] [CrossRef]
  40. Chambers, E.S.; Morrison, D.J.; Frost, G.; Mozaffarian, D. Control of appetite and energy intake by SCFA: What are the potential underlying mechanisms? Proc. Nutr. Soc. 2015, 74, 328–336. [Google Scholar] [CrossRef] [PubMed]
  41. Chambers, E.; Viardot, A.; Psichas, A.; Morrison, D. Effects of targeted delivery of propionate to the human colon on appetite regulation, body weight maintenance and adiposity in overweight adults. Gut 2015, 64, 1744–1754. [Google Scholar] [CrossRef] [PubMed]
  42. Zappe, H.; Jones, W.A.; Jones, D.T.; Woods, D.R. Structure of an endo-beta-1,4-glucanase gene from Clostridium acetobutylicum P262 showing homology with endoglucanase genes from Bacillus spp. Appl. Environ. Microbiol. 1988, 54, 1289–1292. [Google Scholar] [PubMed]
  43. Dewulf, E.M.; Cani, P.D.; Claus, S.P.; Fuentes, S.; Puylaert, P.G.; Neyrinck, A.M.; Bindels, L.B.; de Vos, W.M.; Gibson, G.R.; Thissen, J.-P.; et al. Insight into the prebiotic concept: Lessons from an exploratory, double blind intervention study with inulin-type fructans in obese women. Gut 2013, 62, 1112–1121. [Google Scholar] [CrossRef] [PubMed]
  44. Calvani, R.; Miccheli, A.; Capuani, G.; Tomassini Miccheli, A.; Puccetti, C.; Delfini, M.; Iaconelli, A.; Nanni, G.; Mingrone, G. Gut microbiome-derived metabolites characterize a peculiar obese urinary metabotype. Int. J. Obes. 2010, 34, 1095–1098. [Google Scholar] [CrossRef] [PubMed]
  45. Salek, R.M.; Maguire, M.L.; Bentley, E.; Rubtsov, D.V.; Hough, T.; Cheeseman, M.; Nunez, D.; Sweatman, B.C.; Haselden, J.N.; Cox, R.D.; et al. A metabolomic comparison of urinary changes in type 2 diabetes in mouse, rat, and human. Physiol. Genom. 2007, 29, 99–108. [Google Scholar] [CrossRef] [PubMed]
  46. Waldram, A.; Holmes, E.; Wang, Y.; Rantalainen, M.; Wilson, I.D.; Tuohy, K.M.; McCartney, A.L.; Gibson, G.R.; Nicholson, J.K. Top-Down Systems Biology Modeling of Host Metabotype−Microbiome Associations in Obese Rodents. J. Proteome Res. 2009, 8, 2361–2375. [Google Scholar] [CrossRef] [PubMed]
  47. Kassinen, A.; Krogius-Kurikka, L.; Mäkivuokko, H.; Rinttilä, T.; Paulin, L.; Corander, J.; Malinen, E.; Apajalahti, J.; Palva, A. The Fecal Microbiota of Irritable Bowel Syndrome Patients Differs Significantly From That of Healthy Subjects. Gastroenterology 2007, 133, 24–33. [Google Scholar] [CrossRef] [PubMed]
  48. Moore, W.E.; Moore, L.H. Intestinal floras of populations that have a high risk of colon cancer. Appl. Environ. Microbiol. 1995, 61, 3202–3207. [Google Scholar] [PubMed]
  49. Rycroft, C.E.; Jones, M.R.; Gibson, G.R.; Rastall, R.A. A comparative in vitro evaluation of the fermentation properties of prebiotic oligosaccharides. J. Appl. Microbiol. 2001, 91, 878–887. [Google Scholar] [CrossRef] [PubMed]
  50. Wang, X.; Gibson, G.R. Effects of the in vitro fermentation of oligofructose and inulin by bacteria growing in the human large intestine. J. Appl. Bacteriol. 1993, 75, 373–380. [Google Scholar] [CrossRef] [PubMed]
  51. Gibson, G.R.; Beatty, E.R.; Wang, X.; Cummings, J.H. Selective stimulation of bifidobacteria in the human colon by oligofructose and inulin. Gastroenterology 1995, 108, 975–982. [Google Scholar] [CrossRef]
  52. Ramirez-Farias, C.; Slezak, K.; Fuller, Z.; Duncan, A.; Holtrop, G.; Louis, P. Effect of inulin on the human gut microbiota: Stimulation of Bifidobacterium adolescentis and Faecalibacterium prausnitzii. Br. J. Nutr. 2009, 101, 533. [Google Scholar] [CrossRef] [PubMed]
  53. Buchanan, R.; Gibbons, N. Bergey’s Manual of Determinative Bacteriology; Williams & Wilkins Co.: Baltimore, MD, USA, 1974. [Google Scholar]
  54. Salyers, A. Energy sources of major intestinal fermentative anaerobes. Am. J. Clin. Nutr. 1979, 32, 158–163. [Google Scholar] [PubMed]
  55. Collado, M.; Isolauri, E. Distinct composition of gut microbiota during pregnancy in overweight and normal-weight women. Am. J. Clin. Nutr. 2008, 55, 894–899. [Google Scholar]
  56. Kalliomäki, M.; Collado, M. Early differences in fecal microbiota composition in children may predict overweight. Am. J. Clin. Nutr. 2008, 87, 534–538. [Google Scholar] [PubMed]
  57. Santacruz, A. Gut microbiota composition is associated with body weight, weight gain and biochemical parameters in pregnant women. Br. J. Nutr. 2010, 104, 83–84. [Google Scholar] [CrossRef] [PubMed]
  58. Schwiertz, A.; Taras, D.; Schäfer, K.; Beijer, S. Microbiota and SCFA in lean and overweight healthy subjects. Obesity 2010, 18, 190–195. [Google Scholar] [CrossRef] [PubMed]
  59. Knaapen, M.; Kootte, R.S.; Zoetendal, E.G.; de Vos, W.M.; Dallinga-Thie, G.M.; Levi, M.; Stroes, E.S.; Nieuwdorp, M. Obesity, non-alcoholic fatty liver disease, and atherothrombosis: A role for the intestinal microbiota? Clin. Microbiol. Infect. 2013, 19, 331–337. [Google Scholar] [CrossRef] [PubMed]
  60. Nakamura, Y.; Omaye, S. Metabolic diseases and pro-and prebiotics: Mechanistic insights. Nutr. Metab. (Lond.) 2012, 9, 1–11. [Google Scholar] [CrossRef] [PubMed]
  61. Kedia, G.; Vázquez, J.A.; Charalampopoulos, D.; Pandiella, S.S. In Vitro Fermentation of Oat Bran Obtained by Debranning with a Mixed Culture of Human Fecal Bacteria. Curr. Microbiol. 2009, 58, 338–342. [Google Scholar] [CrossRef] [PubMed] [Green Version]
  62. Kim, H.J.; White, P.J. In Vitro Fermentation of Oat Flours from Typical and High β-Glucan Oat Lines. J. Agric. Food Chem. 2009, 57, 7529–7536. [Google Scholar] [CrossRef] [PubMed]
  63. Finegold, S.M.; Li, Z.; Summanen, P.H.; Downes, J.; Thames, G.; Corbett, K.; Dowd, S.; Krak, M.; Heber, D. Xylooligosaccharide increases bifidobacteria but not lactobacilli in human gut microbiota. Food Funct. 2014, 5, 436. [Google Scholar] [CrossRef] [PubMed]
Figure 1. Total gas production comparing fermentation differences among five prebiotic dietary fibers for three individuals at 12 h and 24 h post-exposure to fecal microbiota in an in vitro fermentation system. Data displayed are means (3 donors × 3 replicates = 9) for each prebiotic dietary fiber ± SD. Columns with different letters are significantly different from one another within each time measurement (lowercase: 12 h; uppercase: 24 h). Data were analyzed using ANOVA with Tukey HSD (p < 0.05).
Nutrients 09 01361 g001
Figure 2. Acetate production at 12 h and 24 h of fermentation for five prebiotic dietary fibers displayed as μmol/mL of fermentation inoculum. Data displayed are means (3 donors × 3 replicates = 9) for each prebiotic dietary fiber ± SD. Columns with different letters are significantly different from one another (lowercase: 12 h; uppercase: 24 h). Data were analyzed using ANOVA with Tukey HSD (p < 0.05).
Nutrients 09 01361 g002
Figure 3. Propionate production at 12 h and 24 h of fermentation for five prebiotic dietary fibers displayed as μmol/mL of fermentation inoculum. Data displayed are means (3 donors × 3 replicates = 9) for each prebiotic dietary fiber ± SD. Columns with different letters are significantly different from one another (lowercase: 12 h; uppercase: 24 h). Data were analyzed using ANOVA with Tukey HSD (p < 0.05).
Nutrients 09 01361 g003
Figure 4. Butyrate production at 12 h and 24 h of fermentation for five prebiotic dietary fibers displayed as μmol/mL of fermentation inoculum. Data displayed are means (3 donors × 3 replicates = 9) for each prebiotic dietary fiber ± SD. Columns with different letters are significantly different from one another (lowercase: 24 h; uppercase: 24 h). Data were analyzed using ANOVA with Tukey HSD (p < 0.05).
Nutrients 09 01361 g004
Table 1. Comparison Prebiotic Dietary Fibers Analyzed with in vitro Fermentation System.
Prebiotic Dietary FibersSupplier Information
OatWell (Oatbran containing 28% beta-glucan)DSM Nutritional Products, Ltd. (Kaiseraugust, Switzerland)
WholeFiber (A dried chicory root blend containing: inulin, pectin, hemi/cellulose)WholeFiber, Inc. (Pennington, NJ, USA)
Xylooligosaccharide (XOS)AIDP, Inc. (Industry, CA, USA)
Pure InulinCargill, Inc. (Wayzata, MN, USA)
Pure Beta-glucanMegazyme, Inc. (Bray, Wicklow, Ireland)
Table 2. Demographic Characteristics of Three Fecal Donors.
Demographic characteristicsDonor 1Donor 2Donor 3
Age262522
SexFemaleMaleMale
Body Mass Index (kg/m2)28.126.323.0
Table 3. Combined changes across 24 h of fermentation for Oatwell samples of identified genera 1.
Genera0 h24 hp-Value
Actinobacteria
Bifidobacterium1.220.890.660
Adlercreutzia1.443.000.470
Collinsella48.44140.560.089
Bacteroidetes
Alistipes2.561.330.674
Parabacteroides135.00155.890.952
Bacteroides755.67865.000.192
Firmicutes
Eubacterium0.440.560.817
Veillonella1.111.220.980
Dorea2.333.560.516
Acidaminococcus3.2210.440.817
Clostridium7.678.330.769
Anaerostipes8.116.000.674
Turicibacter8.671.220.286
SMB539.112.110.008 *
Ruminococcus11.2223.220.263
Lactococcus11.6710.670.980
Streptococcus15.228.110.511
Roseburia20.2222.330.980
Oscillospira21.7836.670.121
Lachnospira26.564.440.008 *
Phascolarctobacterium27.78173.330.263
Dialister39.5643.000.560
Blautia41.8953.110.470
Coprococcus49.8939.000.396
Ruminococcus61.3340.670.289
Faecalibacterium136.4466.000.022 *
Proteobacteria
Escherichia0.441.440.325
Haemophilus10.220.670.286
Sutterella10.7814.440.980
Bilophila13.6714.780.788
Verrucomicrobia
Akkermansia5.0012.000.980
1 Replicate samples were pooled among donor at each respective time point (3 donors × 3 replicated = 9). Samples were analyzed between differentially represented OTUs for significant changes after 24 h of fermentation compared to 0 h samples. Values are the number of OTUs after rarefaction to 3668 sequences per sample. Data were analyzed using the Kruskal-Wallis ANOVA test, with the FDR (false discovery rate) multiple comparisons correction. * Indicates significance at p ≤ 0.05.
Table 4. Combined changes across 24 h of fermentation for WholeFiber samples of identified genera 1.
Genera0 h24 hp-Value
Actinobacteria
Adlercreutzia0.893.890.239
Bifidobacterium1.111.110.785
Collinsella68.00299.780.011 *
Bacteroidetes
Alistipes1.110.560.894
Parabacteroides131.44142.000.913
Bacteroides743.56776.560.785
Firmicutes
Eubacterium1.110.780.799
Veillonella1.221.000.960
Dorea2.005.000.785
Acidaminococcus2.6711.330.894
SMB535.674.000.239
Clostridium7.3313.220.896
Anaerostipes10.221.220.239
Ruminococcus10.8919.670.943
Streptococcus12.678.780.785
Turicibacter14.222.440.960
Lachnospira14.7872.000.237
Oscillospira17.2214.890.647
Lactococcus20.449.220.896
Phascolarctobacterium24.6760.440.501
Dialister26.1158.220.943
Roseburia28.566.000.674
Blautia32.4449.440.156
Coprococcus45.7866.440.501
Ruminococcus54.2239.330.261
Faecalibacterium154.8993.110.080
Proteobacteria
Escherichia0.781.440.960
Sutterella4.0032.440.894
Haemophilus10.670.560.107
Bilophila10.677.670.896
Verrucomicrobia
Akkermansia17.003.330.501
1 Replicate samples were pooled among donor at each respective time point (3 donors × 3 replicated = 9). Samples were analyzed between differentially represented OTUs for significant changes after 24 h of fermentation compared to 0 h samples. Values are the number of OTUs after rarefaction to 3668 sequences per sample. Data were analyzed using the Kruskal-Wallis ANOVA test, with the FDR multiple comparisons correction. * Indicates significance at p ≤ 0.05.
Table 5. Combined changes across 24 h of fermentation for xylooligosaccharide samples of identified genera 1.
Genera0 h24 hp-Value
Actinobacteria
Bifidobacterium0.675.220.038 *
Adlercreutzia1.331.780.972
Collinsella58.44154.000.413
Bacteroidetes
Alistipes1.440.560.413
Parabacteroides147.33133.330.972
Bacteroides770.89870.440.189
Firmicutes
Eubacterium0.331.670.364
Veillonella0.670.000.162
Acidaminococcus1.332.330.972
Dorea2.113.670.423
SMB537.335.440.558
Anaerostipes7.443.440.447
Turicibacter8.008.560.972
Clostridium8.444.000.087
Ruminococcus12.7826.110.087
Streptococcus14.114.670.367
Lachnospira21.115.330.038 *
Oscillospira21.3321.780.972
Phascolarctobacterium23.4416.330.972
Lactococcus23.8921.000.982
Roseburia28.8935.330.972
Dialister33.8941.560.831
Blautia39.2265.000.087
Ruminococcus45.1137.330.385
Coprococcus47.1148.670.705
Faecalibacterium148.5679.560.030 *
Proteobacteria
Escherichia0.890.440.972
Haemophilus6.443.110.972
Bilophila17.786.220.107
Sutterella25.7840.890.831
Verrucomicrobia
Akkermansia2.785.000.841
1 Replicate samples were pooled among donor at each respective time point (3 donors × 3 replicated = 9). Samples were analyzed between differentially represented OTUs for significant changes after 24 h of fermentation compared to 0 h samples. Values are the number of OTUs after rarefaction to 3668 sequences per sample. Data were analyzed using the Kruskal-Wallis ANOVA test, with the FDR multiple comparisons correction. * Indicates significance at p ≤ 0.05.
Table 6. Combined changes across 24 h of fermentation for pure inulin samples of identified genera 1.
Genera0 h24 hp-Value
Actinobacteria
Bifidobacterium1.335.440.304
Adlercreutzia1.332.000.845
Collinsella55.11291.440.016 *
Bacteroidetes
Alistipes1.560.890.878
Parabacteroides147.44164.780.887
Bacteroides726.78644.440.652
Firmicutes
Veillonella0.780.560.908
Eubacterium0.891.560.908
Dorea1.787.000.640
Acidaminococcus3.1118.670.887
SMB537.449.110.965
Turicibacter7.784.890.652
Clostridium8.227.110.845
Ruminococcus9.5634.110.309
Anaerostipes11.224.670.652
Streptococcus13.0012.440.887
Lactococcus19.119.670.908
Lachnospira21.004.890.022 *
Phascolarctobacterium26.2221.000.887
Oscillospira26.3310.110.034 *
Roseburia26.7814.110.887
Dialister32.6795.110.887
Blautia38.2250.220.690
Coprococcus48.1160.890.640
Ruminococcus52.3343.000.908
Faecalibacterium148.11187.330.652
Proteobacteria
Escherichia1.001.220.908
Haemophilus9.112.670.652
Sutterella14.0031.220.908
Bilophila16.897.780.309
Verrucomicrobia
Akkermansia7.787.440.304
1 Replicate samples were pooled among donor at each respective time point (3 donors × 3 replicated = 9). Samples were analyzed between differentially represented OTUs for significant changes after 24 h of fermentation compared to 0 h samples. Values are the number of OTUs after rarefaction to 3668 sequences per sample. Data were analyzed using the Kruskal-Wallis ANOVA test, with the FDR multiple comparisons correction. * Indicates significance at p ≤ 0.05.
Table 7. Combined changes across 24 h of fermentation for pure beta-glucan samples of identified genera 1.
Genera0 h24 hp-Value
Actinobacteria
Bifidobacterium0.330.331.000
Adlercreutzia2.001.890.843
Collinsella69.2285.110.723
Bacteroidetes
Alistipes0.780.890.778
Parabacteroides119.56179.780.778
Bacteroides776.11854.330.664
Firmicutes
Eubacterium0.110.440.778
Veillonella0.560.220.778
Dorea0.893.110.110
Acidaminococcus2.3315.110.778
SMB536.114.890.778
Lactococcus6.110.670.778
Anaerostipes7.445.220.778
Turicibacter8.113.000.803
Ruminococcus9.4418.670.166
Clostridium10.113.330.110
Streptococcus14.896.440.256
Roseburia16.1154.330.510
Lachnospira21.223.890.008 *
Oscillospira24.3335.110.389
Phascolarctobacterium29.00125.330.283
Dialister30.5643.670.819
Coprococcus44.1120.780.211
Blautia45.1168.110.408
Ruminococcus59.6744.440.500
Faecalibacterium152.1162.670.008 *
Proteobacteria
Escherichia0.890.560.778
Haemophilus11.000.780.110
Sutterella14.0035.440.778
Bilophila14.4413.890.778
Verrucomicrobia
Akkermansia9.1115.890.778
1 Replicate samples were pooled among donor at each respective time point (3 donors × 3 replicated = 9). Samples were analyzed between differentially represented OTUs for significant changes after 24 h of fermentation compared to 0 h samples. Values are the number of OTUs after rarefaction to 3668 sequences per sample. Data were analyzed using the Kruskal-Wallis ANOVA test, with the FDR multiple comparisons correction. * Indicates significance at p ≤ 0.05.

