Moderately Low Magnesium Intake Impairs Growth of Lean Body Mass in Obese-Prone and Obese-Resistant Rats Fed a High-Energy Diet

Abstract
:
1. Introduction
2. Materials and Methods
2.1. Animal Protocol and Diets
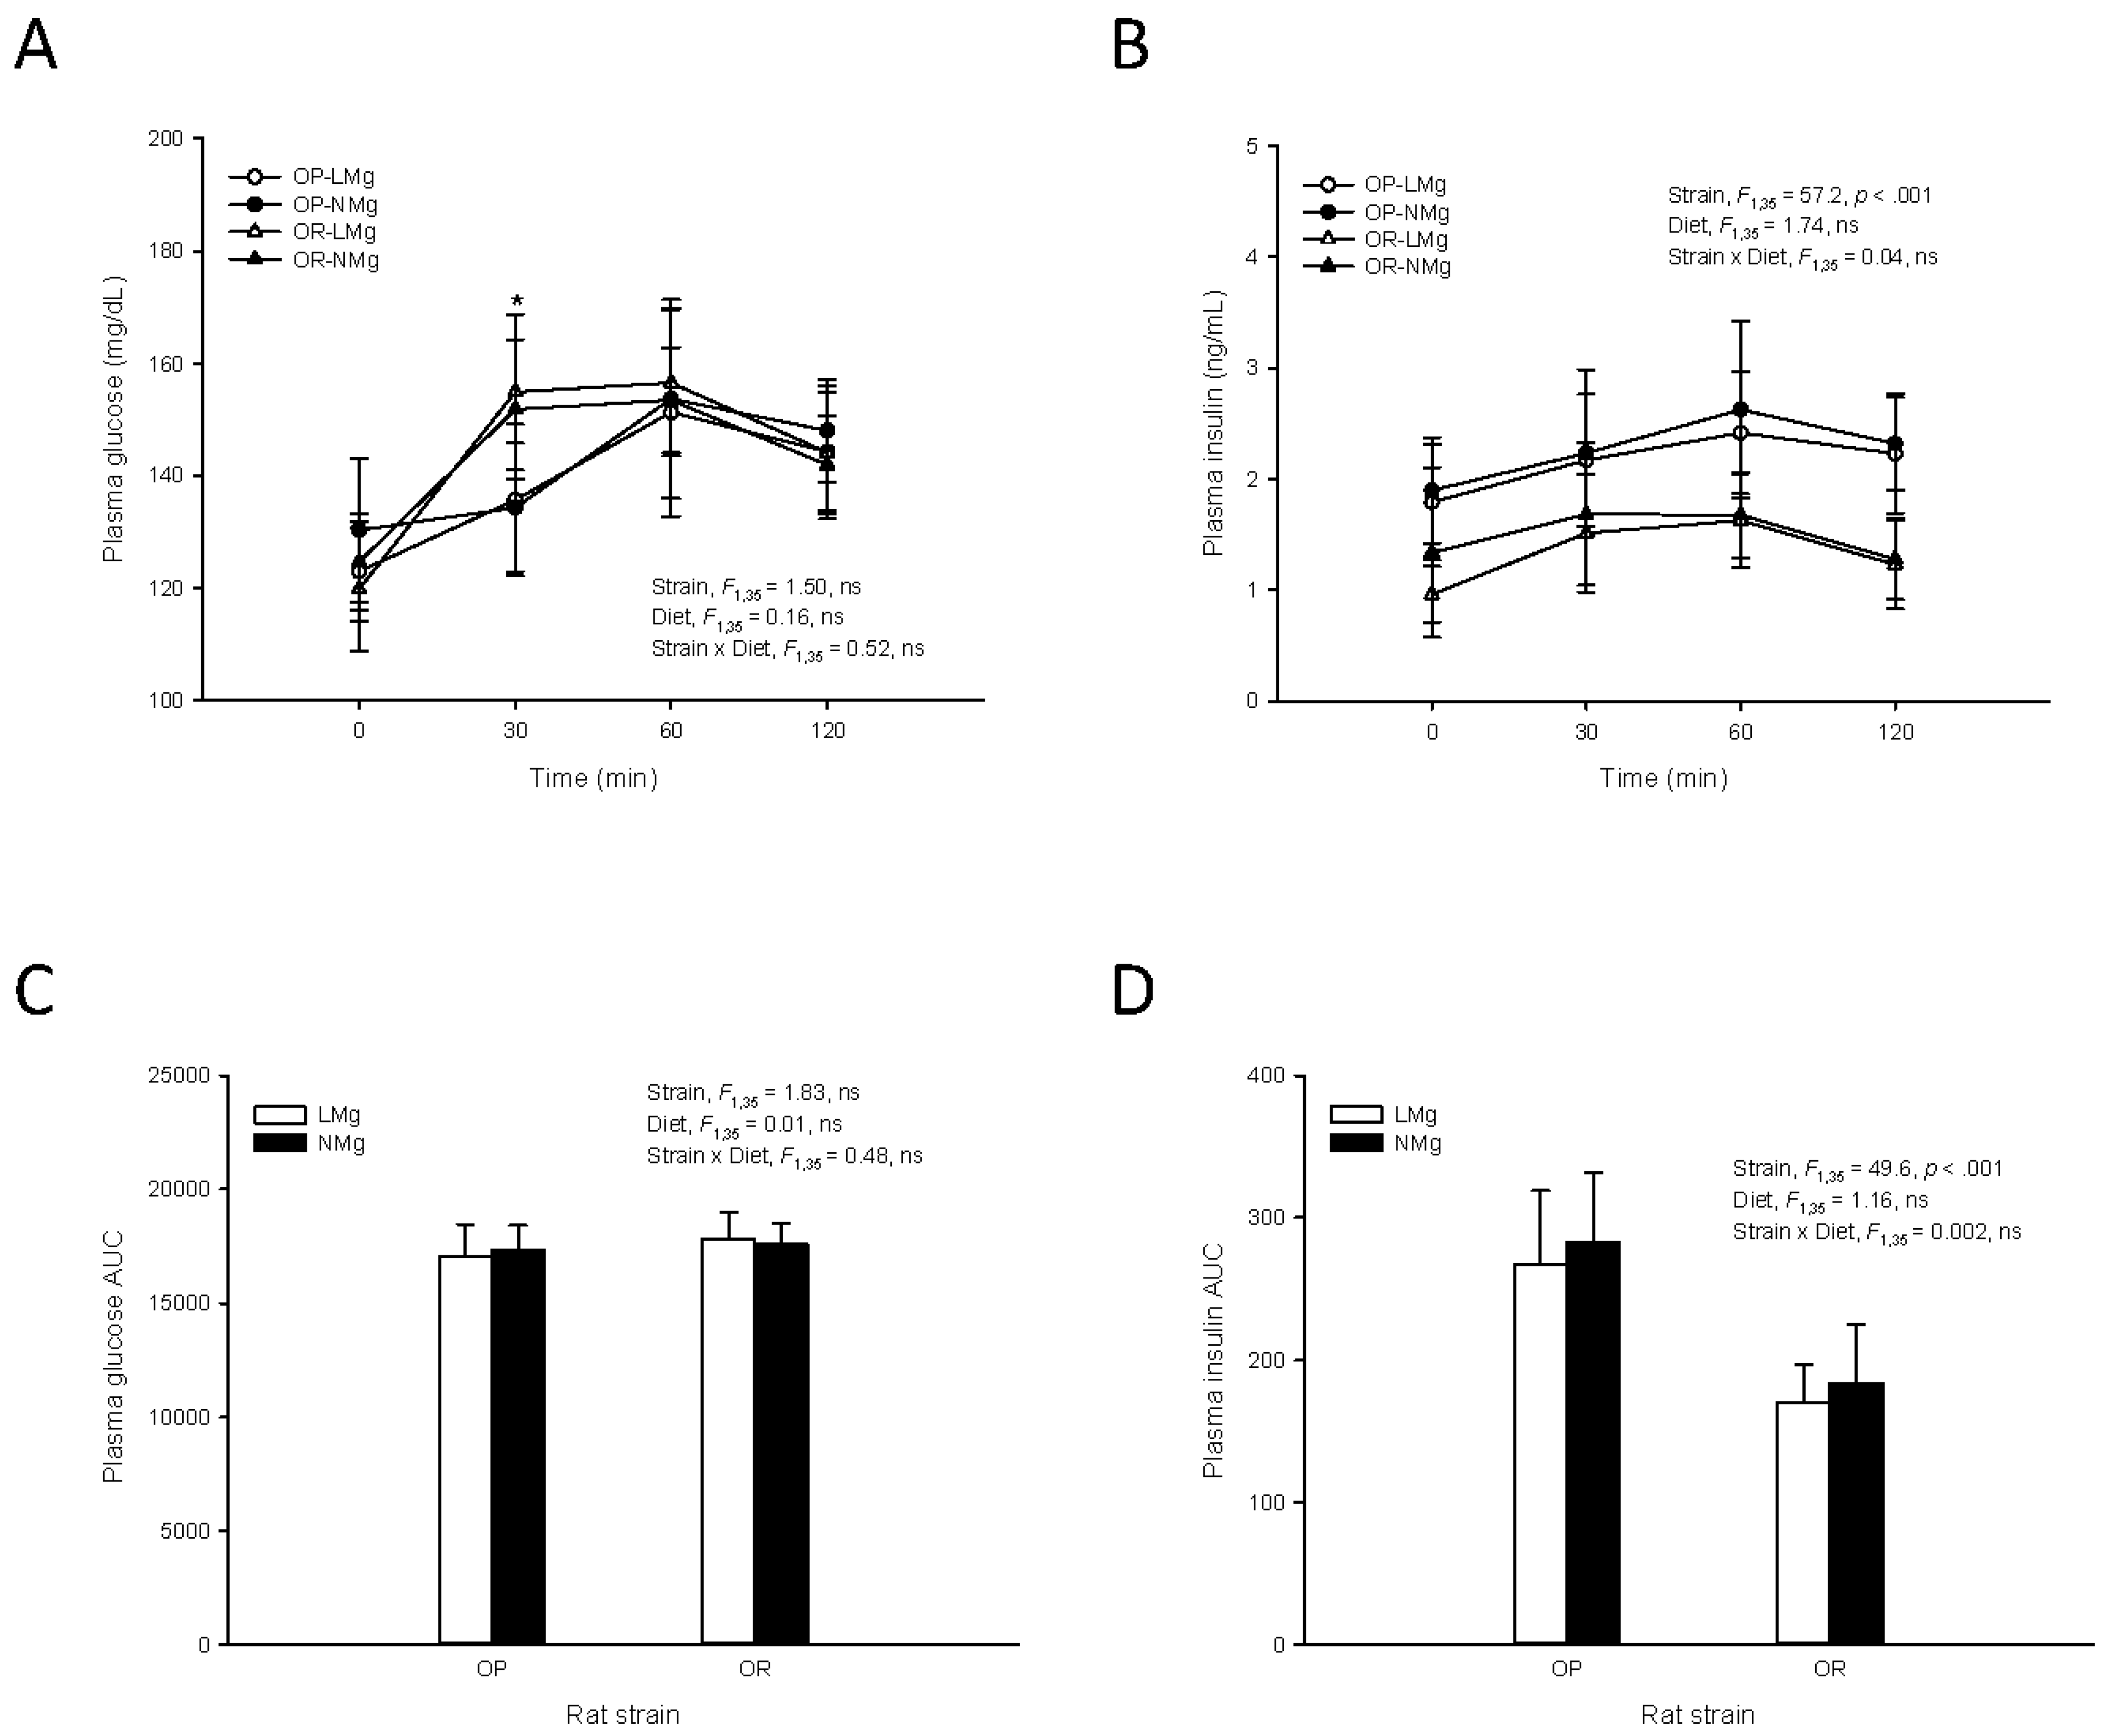
2.2. OGTT
2.3. Femur Isolation and Physical Measurements
2.4. Mineral Analyses
2.5. Assays
2.6. Statistical Analyses
3. Results
4. Discussion
5. Conclusions
Supplementary Materials
Acknowledgments
Author Contributions
Conflicts of Interest
References
- Volpe, S.L. Magnesium in disease prevention and overall health. Adv. Nutr. 2013, 4, 378S–383S. [Google Scholar] [CrossRef] [PubMed]
- Elin, R.J. Magnesium: The fifth but forgotten electrolyte. Am. J. Clin. Pathol. 1994, 102, 616–622. [Google Scholar] [CrossRef] [PubMed]
- Wolf, F.I.; Cittadini, A. Magnesium in cell proliferation and differentiation. Front. Biosci. 1999, 4, D607–D617. [Google Scholar] [CrossRef] [PubMed]
- Cittadini, A.; Wolf, F.I.; Bossi, D.; Calviello, G. Magnesium in normal and neoplastic cell proliferation: State of the art on in vitro data. Magnes. Res. 1991, 4, 23–33. [Google Scholar] [PubMed]
- Ford, E.S.; Mokdad, A.H. Dietary magnesium intake in a national sample of US adults. J. Nutr. 2003, 133, 2879–2882. [Google Scholar] [PubMed]
- Health Canada. Do Canadian Adults Meet Their Nutrient Requirements through Food Intake Alone? Available online: http://www.hc-sc.gc.ca/fn-an/surveill/nutrition/commun/art-nutr-adult-eng.php (accessed on 23 September 2015).
- Pham, P.C.; Pham, P.M.; Pham, S.V.; Miller, J.M.; Pham, P.T. Hypomagnesemia in patients with type 2 diabetes. Clin. J. Am. Soc. Nephrol. 2007, 2, 366–373. [Google Scholar] [CrossRef] [PubMed]
- De Baaij, J.H.; Hoenderop, J.G.; Bindels, R.J. Magnesium in man: Implications for health and disease. Physiol. Rev. 2015, 95, 1–46. [Google Scholar] [CrossRef] [PubMed]
- Bertinato, J.; Xiao, C.W.; Ratnayake, W.M.; Fernandez, L.; Lavergne, C.; Wood, C.; Swist, E. Lower serum magnesium concentration is associated with diabetes, insulin resistance, and obesity in South Asian and white Canadian women but not men. Food Nutr. Res. 2015, 59, 25974. [Google Scholar] [CrossRef] [PubMed]
- Whang, R.; Hampton, E.M.; Whang, D.D. Magnesium homeostasis and clinical disorders of magnesium deficiency. Ann. Pharmacother. 1994, 28, 220–226. [Google Scholar] [PubMed]
- Institute of Medicine. Dietary Reference Intakes for Calcium, Phosphorus, Magnesium, Vitamin D, and Fluoride; National Academy Press: Washington, DC, USA, 1997; pp. 190–249. [Google Scholar]
- Hunt, C.D.; Johnson, L.K. Magnesium requirements: New estimations for men and women by cross-sectional statistical analyses of metabolic magnesium balance data. Am. J. Clin. Nutr. 2006, 84, 843–852. [Google Scholar] [PubMed]
- Venu, L.; Kishore, Y.D.; Raghunath, M. Maternal and perinatal magnesium restriction predisposes rat pups to insulin resistance and glucose intolerance. J. Nutr. 2005, 135, 1353–1358. [Google Scholar] [PubMed]
- Venu, L.; Padmavathi, I.J.; Kishore, Y.D.; Bhanu, N.V.; Rao, K.R.; Sainath, P.B.; Ganeshan, M.; Raghunath, M. Long-term effects of maternal magnesium restriction on adiposity and insulin resistance in rat pups. Obesity 2008, 16, 1270–1276. [Google Scholar] [CrossRef] [PubMed]
- Sales, C.H.; Santos, A.R.; Cintra, D.E.; Colli, C. Magnesium-deficient high-fat diet: Effects on adiposity, lipid profile and insulin sensitivity in growing rats. Clin. Nutr. 2014, 33, 879–888. [Google Scholar] [CrossRef] [PubMed]
- Rude, R.K.; Gruber, H.E.; Norton, H.J.; Wei, L.Y.; Frausto, A.; Kilburn, J. Reduction of dietary magnesium by only 50% in the rat disrupts bone and mineral metabolism. Osteoporos. Int. 2006, 17, 1022–1032. [Google Scholar] [CrossRef] [PubMed]
- Rude, R.K.; Gruber, H.E.; Norton, H.J.; Wei, L.Y.; Frausto, A.; Kilburn, J. Dietary magnesium reduction to 25% of nutrient requirement disrupts bone and mineral metabolism in the rat. Bone 2005, 37, 211–219. [Google Scholar] [CrossRef] [PubMed]
- Rude, R.K.; Gruber, H.E.; Norton, H.J.; Wei, L.Y.; Frausto, A.; Mills, B.G. Bone loss induced by dietary magnesium reduction to 10% of the nutrient requirement in rats is associated with increased release of substance P and tumor necrosis factor-alpha. J. Nutr. 2004, 134, 79–85. [Google Scholar] [PubMed]
- Stendig-Lindberg, G.; Koeller, W.; Bauer, A.; Rob, P.M. Experimentally induced prolonged magnesium deficiency causes osteoporosis in the rat. Eur. J. Intern. Med. 2004, 15, 97–107. [Google Scholar] [CrossRef] [PubMed]
- Jones, J.E.; Schwartz, R.; Krook, L. Calcium homeostasis and bone pathology in magnesium deficient rats. Calcif. Tissue Int. 1980, 31, 231–238. [Google Scholar] [CrossRef] [PubMed]
- Rude, R.K.; Gruber, H.E.; Wei, L.Y.; Frausto, A.; Mills, B.G. Magnesium deficiency: Effect on bone and mineral metabolism in the mouse. Calcif. Tissue Int. 2003, 72, 32–41. [Google Scholar] [CrossRef] [PubMed]
- Rude, R.K.; Kirchen, M.E.; Gruber, H.E.; Meyer, M.H.; Luck, J.S.; Crawford, D.L. Magnesium deficiency-induced osteoporosis in the rat: Uncoupling of bone formation and bone resorption. Magnes. Res. 1999, 12, 257–267. [Google Scholar] [PubMed]
- Rude, R.K.; Singer, F.R.; Gruber, H.E. Skeletal and hormonal effects of magnesium deficiency. J. Am. Coll. Nutr. 2009, 28, 131–141. [Google Scholar] [CrossRef] [PubMed]
- Rude, R.K.; Oldham, S.B.; Sharp, C.F., Jr.; Singer, F.R. Parathyroid hormone secretion in magnesium deficiency. J. Clin. Endocrinol. Metab. 1978, 47, 800–806. [Google Scholar] [CrossRef] [PubMed]
- Orchard, T.S.; Larson, J.C.; Alghothani, N.; Bout-Tabaku, S.; Cauley, J.A.; Chen, Z.; LaCroix, A.Z.; Wactawski-Wende, J.; Jackson, R.D. Magnesium intake, bone mineral density, and fractures: Results from the women’s health initiative observational study. Am. J. Clin. Nutr. 2014, 99, 926–933. [Google Scholar] [CrossRef] [PubMed]
- Kao, W.H.; Folsom, A.R.; Nieto, F.J.; Mo, J.P.; Watson, R.L.; Brancati, F.L. Serum and dietary magnesium and the risk for type 2 diabetes mellitus: The atherosclerosis risk in communities study. Arch. Intern. Med. 1999, 159, 2151–2159. [Google Scholar] [CrossRef] [PubMed]
- Larsson, S.C.; Wolk, A. Magnesium intake and risk of type 2 diabetes: A meta-analysis. J. Intern. Med. 2007, 262, 208–214. [Google Scholar] [CrossRef] [PubMed]
- Ma, J.; Folsom, A.R.; Melnick, S.L.; Eckfeldt, J.H.; Sharrett, A.R.; Nabulsi, A.A.; Hutchinson, R.G.; Metcalf, P.A. Associations of serum and dietary magnesium with cardiovascular disease, hypertension, diabetes, insulin, and carotid arterial wall thickness: The ARIC study. Atherosclerosis risk in communities study. J. Clin. Epidemiol. 1995, 48, 927–940. [Google Scholar] [CrossRef]
- Villegas, R.; Gao, Y.T.; Dai, Q.; Yang, G.; Cai, H.; Li, H.; Zheng, W.; Shu, X.O. Dietary calcium and magnesium intakes and the risk of type 2 diabetes: The Shanghai women’s health study. Am. J. Clin. Nutr. 2009, 89, 1059–1067. [Google Scholar] [CrossRef] [PubMed]
- Cahill, F.; Shahidi, M.; Shea, J.; Wadden, D.; Gulliver, W.; Randell, E.; Vasdev, S.; Sun, G. High dietary magnesium intake is associated with low insulin resistance in the Newfoundland population. PLoS ONE 2013, 8, e58278. [Google Scholar] [CrossRef] [PubMed]
- Reeves, P.G.; Nielsen, F.H.; Fahey, G.C., Jr. AIN-93 purified diets for laboratory rodents: Final report of the American Institute of Nutrition ad hoc writing committee on the reformulation of the AIN-76A rodent diet. J. Nutr. 1993, 123, 1939–1951. [Google Scholar] [PubMed]
- Aziz, A.A.; Kenney, L.S.; Goulet, B.; Abdel-Aal, E. Dietary starch type affects body weight and glycemic control in freely fed but not energy-restricted obese rats. J. Nutr. 2009, 139, 1881–1889. [Google Scholar] [CrossRef] [PubMed]
- Boustany, C.M.; Bharadwaj, K.; Daugherty, A.; Brown, D.R.; Randall, D.C.; Cassis, L.A. Activation of the systemic and adipose renin-angiotensin system in rats with diet-induced obesity and hypertension. Am. J. Physiol. Regul. Integr. Comp. Physiol. 2004, 287, R943–R949. [Google Scholar] [CrossRef] [PubMed]
- Bertinato, J.; Aroche, C.; Plouffe, L.J.; Lee, M.; Murtaza, Z.; Kenney, L.; Lavergne, C.; Aziz, A. Diet-induced obese rats have higher iron requirements and are more vulnerable to iron deficiency. Eur. J. Nutr. 2014, 53, 885–895. [Google Scholar] [CrossRef] [PubMed]
- Bertinato, J.; Lavergne, C.; Vu, N.A.; Plouffe, L.J.; Wood, C.; Griffin, P.; Xiao, C.W. l-Lysine supplementation does not affect the bioavailability of copper or iron in rats. J. Trace Elem. Med. Biol. 2016. [Google Scholar] [CrossRef] [PubMed]
- Moslehi, N.; Vafa, M.; Sarrafzadeh, J.; Rahimi-Foroushani, A. Does magnesium supplementation improve body composition and muscle strength in middle-aged overweight women? A double-blind, placebo-controlled, randomized clinical trial. Biol. Trace Elem. Res. 2013, 153, 111–118. [Google Scholar] [CrossRef] [PubMed]
- Dørup, I.; Clausen, T. Effects of magnesium and zinc deficiencies on growth and protein synthesis in skeletal muscle and the heart. Br. J. Nutr. 1991, 66, 493–504. [Google Scholar] [CrossRef] [PubMed]
- Dørup, I.; Flyvbjerg, A.; Everts, M.E.; Clausen, T. Role of insulin-like growth factor-1 and growth hormone in growth inhibition induced by magnesium and zinc deficiencies. Br. J. Nutr. 1991, 66, 505–521. [Google Scholar] [CrossRef] [PubMed]
- Maggio, M.; Ceda, G.P.; Lauretani, F.; Cattabiani, C.; Avantaggiato, E.; Morganti, S.; Ablondi, F.; Bandinelli, S.; Dominguez, L.J.; Barbagallo, M.; et al. Magnesium and anabolic hormones in older men. Int. J. Androl. 2011, 34, e594–e600. [Google Scholar] [CrossRef] [PubMed]
- Bouxsein, M.L.; Karasik, D. Bone geometry and skeletal fragility. Curr. Osteoporos. Rep. 2006, 4, 49–56. [Google Scholar] [CrossRef] [PubMed]
- Petit, M.A.; Beck, T.J.; Lin, H.M.; Bentley, C.; Legro, R.S.; Lloyd, T. Femoral bone structural geometry adapts to mechanical loading and is influenced by sex steroids: The Penn State young women’s health study. Bone 2004, 35, 750–759. [Google Scholar] [CrossRef] [PubMed]
- Alcock, N.; Macintyre, I. Inter-relation of calcium and magnesium absorption. Clin. Sci. 1962, 22, 185–193. [Google Scholar] [PubMed]
- Bertinato, J.; Lavergne, C.; Plouffe, L.J.; El Niaj, H.A. Small increases in dietary calcium above normal requirements exacerbate magnesium deficiency in rats fed a low magnesium diet. Mag. Res. 2014, 27, 35–47. [Google Scholar]
- Huang, C.-L.; Kuo, E. Mechanism of hypokalemia in magnesium deficiency. J. Am. Soc. Nephrol. 2007, 18, 2649–2652. [Google Scholar] [CrossRef] [PubMed]
- Chang, S.; Graham, B.; Yakubu, F.; Lin, D.; Peters, J.C.; Hill, J.O. Metabolic differences between obesity-prone and obesity-resistant rats. Am. J. Physiol. 1990, 259, R1103–R1110. [Google Scholar] [PubMed]
- Madsen, A.N.; Hansen, G.; Paulsen, S.J.; Lykkegaard, K.; Tang-Christensen, M.; Hansen, H.S.; Levin, B.E.; Larsen, P.J.; Knudsen, L.B.; Fosgerau, K.; et al. Long-term characterization of the diet-induced obese and diet-resistant rat model: A polygenetic rat model mimicking the human obesity syndrome. J. Endocrinol. 2010, 206, 287–296. [Google Scholar] [CrossRef] [PubMed]
- Paulsen, S.J.; Jelsing, J.; Madsen, A.N.; Hansen, G.; Lykkegaard, K.; Larsen, L.K.; Larsen, P.J.; Levin, B.E.; Vrang, N. Characterization of beta-cell mass and insulin resistance in diet-induced obese and diet-resistant rats. Obesity 2010, 18, 266–273. [Google Scholar] [CrossRef] [PubMed]
- Garcia-Martinez, C.; Lopez-Soriano, F.J.; Argiles, J.M. Intestinal glucose absorption is lower in obese than in lean zucker rats. J. Nutr. 1993, 123, 1062–1067. [Google Scholar] [PubMed]
- Chiba, T.; Okimura, Y.; Inatome, T.; Inoh, T.; Watanabe, M.; Fujita, T. Hypocalcemic crisis in alcoholic fatty liver: Transient hypoparathyroidism due to magnesium deficiency. Am. J. Gastroenterol. 1987, 82, 1084–1087. [Google Scholar] [PubMed]
- Mukai, A.; Yamamoto, S.; Matsumura, K. Hypocalcemia secondary to hypomagnesemia in a patient with Crohn’s disease. Clin. J. Gastroenterol. 2015, 8, 22–25. [Google Scholar] [CrossRef] [PubMed]
- Shah, B.R.; Santucci, K.; Finberg, L. Magnesium deficiency as a cause of hypocalcemia in the CHARGE association. Arch. Pediatr. Adolesc. Med. 1994, 148, 486–489. [Google Scholar] [CrossRef] [PubMed]


| Parameter | Groups | ANOVA | |||||
|---|---|---|---|---|---|---|---|
| OP-LMg (n = 25) | OP-NMg (n = 23) | OR-LMg (n = 18) | OR-NMg (n = 23) | Strain | Diet | Strain × Diet | |
| Lean (%) 1 | F1,85 = 9.4, p < 0.01 | F1,85 = 0.9, ns | F1,85 = 0.0, ns | ||||
| wk 0 | 85.5 ± 1.8 | 85.4 ± 1.4 | 85.2 ± 1.5 | 85.3 ± 1.7 | F1,85 = 0.3, ns | ||
| wk 8–9 | 77.2 ± 3.4 | 76.1 ± 3.6 | 79.0 ± 2.3 | 78.2 ± 2.7 | F1,85 = 8.68, p < 0.01 | ||
| wk 14 | 72.2 ± 3.5 | 72.1 ± 4.2 | 75.2 ± 2.5 | 74.5 ± 2.8 | F1,85 = 13.5, p < 0.001 | ||
| Lean (g) 1 | F1,85 = 34.7, p < 0.001 | F1,85 = 4.19, p < 0.05 | F1,85 = 0.32, ns | ||||
| wk 0 | 83.9 ± 22.1 | 83.4 ± 23.3 | 92.1 ± 18.4 | 95.1 ± 17.3 | F1,85 = 5.11, p < 0.05 | F1,85 = 0.085, ns | |
| wk 8–9 | 333 ± 24 | 344 ± 33 | 297 ± 28 | 312 ± 21 | F1,85 = 35.1, p < 0.001 | F1,85 = 5.29, p < 0.05 | |
| wk 14 | 387 ± 29 | 396 ± 29 | 331 ± 26 | 346 ± 21 | F1,85 = 89.3, p < 0.001 | F1,85 = 4.83, p < 0.05 | |
| Fat (%) 1 | F1,85 = 23.8, p < 0.001 | F1,85 = 1.36, ns | F1,85 = 0.061, ns | ||||
| wk 0 | 10.6 ± 1.1 | 10.6 ± 1.2 | 10.0 ± 1.2 | 10.1 ± 0.8 | F1,85 = 4.74, p < 0.05 | ||
| wk 8–9 | 17.9 ± 3.3 | 18.9 ± 3.3 | 14.9 ± 2.2 | 15.9 ± 2.6 | F1,85 = 22.6, p < 0.001 | ||
| wk 14 | 22.6 ± 3.4 | 22.9 ± 4.2 | 18.6 ± 2.7 | 19.7 ± 2.9 | F1,85 = 25.0, p < 0.001 | ||
| Fat (g) 1 | F1,85 = 44.5, p < 0.001 | F1,85 = 3.24, ns | F1,85 = 0.079, ns | ||||
| wk 0 | 10.4 ± 3.1 | 10.3 ± 3.0 | 10.9 ± 2.7 | 11.4 ± 2.7 | F1,85 = 1.42, ns | ||
| wk 8–9 | 78.0 ± 19.7 | 86.2 ± 19.6 | 56.6 ± 12.2 | 64.3 ± 15.0 | F1,85 = 34.8, p < 0.001 | ||
| wk 14 | 122 ± 24 | 127 ± 30 | 83 ± 18 | 93 ± 21 | F1,85 = 52.6, p < 0.001 | ||
| Ing fat (g) 2 | 11.2 ± 2.5 | 11.8 ± 3.2 | 6.4 ± 1.5 | 7.3 ± 2.0 | F1,85 = 85.3, p < 0.001 | F1,85 = 2.04, ns | F1,85 = 0.566, ns |
| Retro fat (g) 2 | 21.7 ± 3.7 | 22.2 ± 4.7 | 13.9 ± 3.2 | 15.3 ± 3.7 | F1,85 = 77.3, p < 0.001 | F1,85 = 1.48, ns | F1,85 = 0.259, ns |
| Mes fat (g) 2 | 10.0 ± 2.5 | 10.7 ± 2.8 | 6.0 ± 1.4 | 7.0 ± 1.6 | F1,85 = 70.4, p < 0.001 | F1,85 = 4.29, p < 0.05 | F1,85 = 0.666, ns |
| Epi fat (g) 2 | 15.8 ± 2.9 | 15.9 ± 4.1 | 9.2 ± 2.7 | 10.9 ± 2.6 | F1,85 = 74.1, p < 0.001 | F1,85 = 2.02, ns | F1,85 = 1.37, ns |
| Parameter | Groups | ANOVA 1 | |||||
|---|---|---|---|---|---|---|---|
| OP-LMg (n = 25) | OP-NMg (n = 23) | OR-LMg (n = 18) | OR-NMg (n = 23) | Strain | Diet | Strain × Diet | |
| Mg (mmol/L) | 0.52 ± 0.11 | 0.74 ± 0.12 | 0.63 ± 0.10 | 0.85 ± 0.13 | F1,85 = 20.0, p < 0.001 | F1,85 = 75.0, p < 0.001 | F1,85 = 0.017, ns |
| Ca (mmol/L) | 2.67 ± 0.10 | 2.58 ± 0.11 | 2.78 ± 0.11 | 2.70 ± 0.12 | F1,85 = 23.2, p < 0.001 | F1,85 = 12.4, p < 0.001 | F1,85 = 0.090, ns |
| P (mmol/L) | 1.77 ± 0.24 | 1.83 ± 0.22 | 1.68 ± 0.17 | 1.75 ± 0.12 | F1,85 = 4.05, p < 0.05 | F1,85 = 2.84, ns | F1,85 = 0.007, ns |
| K (mmol/L) | 3.99 ± 0.33 | 4.20 ± 0.25 | 4.32 ± 0.31 | 4.44 ± 0.21 | F1,85 = 23.1, p < 0.001 | F1,85 = 7.43, p < 0.01 | F1,85 = 0.54, ns |
| Na (mmol/L) | 143 ± 1 | 143 ± 1 | 143 ± 1 | 143 ± 2 | F1,85 = 0.6, ns | F1,85 = 0.8, ns | F1,85 = 0.9, ns |
| PTH (ng/L) | 152 ± 75 c | 125 ± 34 c | 221 ± 81 b | 306 ± 165 a | F1,85 = 48.2, p < 0.001 | F1,85 = 0.89, ns | F1,85 = 5.30, p < 0.05 |
| OC (μg/L) | 25.6 ± 8.2 | 24.8 ± 6.5 | 19.9 ± 6.5 | 21.3 ± 4.0 | F1,85 = 11.1, p < 0.01 | F1,85 = 0.042, ns | F1,85 = 0.628, ns |
| Parameter | Groups | ANOVA 1 | |||||
|---|---|---|---|---|---|---|---|
| OP-LMg (n = 25) | OP-NMg (n = 23) | OR-LMg (n = 18) | OR-NMg (n = 23) | Strain | Diet | Strain × Diet | |
| Mg (mg/g Cr) | 27 ± 10 | 92 ± 25 | 26 ± 11 | 100 ± 31 | F1,85 = 0.01, ns | F1,85 = 308, p < 0.001 | F1,85 = 0.84, ns |
| Ca (mg/g Cr) | 14 ± 2 | 14 ± 2 | 17 ± 3 | 16 ± 3 | F1,85 = 26.8, p < 0.001 | F1,85 = 0.348, ns | F1,85 = 0.058, ns |
| P (mg/g Cr) | 885 ± 302 | 960 ± 415 | 1323 ± 276 | 1261 ± 252 | F1,85 = 29.4, p < 0.001 | F1,85 = 0.009, ns | F1,85 = 1.01, ns |
| K (mg/g Cr) | 2160 ± 430 | 2190 ± 610 | 2530 ± 550 | 2560 ± 550 | F1,85 = 10.7, p < 0.01 | F1,85 = 0.076, ns | F1,85 = 0.00, ns |
| Na (mg/g Cr) | 367 ± 199 | 371 ± 171 | 198 ± 99 | 227 ± 110 | F1,85 = 22.4, p < 0.001 | F1,85 = 0.244, ns | F1,85 = 0.148, ns |
| DPD (nmol/mmol Cr) | 93 ± 21 | 103 ± 24 | 159 ± 36 | 171 ± 49 | F1,85 = 85.9, p < 0.001 | F1,85 = 2.35, ns | F1,85 = 0.037, ns |
| Parameter | Groups | ANOVA 1 | |||||
|---|---|---|---|---|---|---|---|
| OP-LMg (n = 25) | OP-NMg (n = 22) | OR-LMg (n = 18) | OR-NMg (n = 23) | Strain | Diet | Strain × Diet | |
| Mg (mg/g DW) | 2.88 ± 0.26 | 4.55 ± 0.15 | 3.61 ± 0.25 | 4.94 ± 0.15 | F1,84 = 164, p < 0.001 | F1,84 = 1266, p < 0.001 | F1,84 = 3.50, ns |
| Ca (mg/g DW) | 282 ± 8 | 279 ± 5 | 283 ± 11 | 275 ± 9 | F1,84 = 0.71, ns | F1,84 = 9.77, p < 0.01 | F1,84 = 2.08, ns |
| P (mg/g DW) | 137 ± 4 | 139 ± 4 | 138 ± 5 | 136 ± 5 | F1,84 = 0.53, ns | F1,84 = 0.03, ns | F1,84 = 2.36, ns |
| K (mg/g DW) | 1.91 ± 0.11 | 1.96 ± 0.11 | 2.18 ± 0.17 | 2.17 ± 0.09 | F1,84 = 86.8, p < 0.001 | F1,84 = 0.45, ns | F1,84 = 1.33, ns |
| Na (mg/g DW) | 9.18 ± 0.29 | 8.75 ± 0.21 | 8.94 ± 0.45 | 8.50 ± 0.22 | F1,84 = 14.9, p < 0.001 | F1,84 = 45.6, p < 0.001 | F1,84 = 0.00, ns |
| Parameter | Groups | ANOVA 1 | |||||
|---|---|---|---|---|---|---|---|
| OP-LMg (n = 25) | OP-NMg (n = 23) | OR-LMg (n =1 8) | OR-NMg (n = 23) | Strain | Diet | Strain × Diet | |
| Length (mm) 2 | 38.8 ± 0.6 | 39.0 ± 1.0 4 | 38.8 ± 0.7 | 39.1 ± 0.6 | F1,84 = 0.0, ns | F1,84 = 2.4, ns | F1,84 = 0.1, ns |
| Width (mm) 3 | 4.59 ± 0.12 | 4.63 ± 0.28 | 4.16 ± 0.21 | 4.32 ± 0.17 | F1,85 = 76.2, p < 0.001 | F1,85 = 5.65, p < 0.05 | F1,85 = 2.78, ns |
| Length:width ratio | 8.46 ± 0.19 c | 8.49 ± 0.48 4,c | 9.35 ± 0.42 a | 9.05 ± 0.32 b | F1,84 = 87.8, p < 0.001 | F1,84 = 2.96, ns | F1,84 = 4.36, p < 0.05 |
| Wet weight (g) | 0.933 ± 0.050 | 0.951 ± 0.082 4 | 0.899 ± 0.064 | 0.944 ± 0.057 | F1,84 = 2.21, ns | F1,84 = 5.35, p < 0.05 | F1,84 = 0.89, ns |
| Dry weight (g) | 0.686 ± 0.035 | 0.693 ± 0.055 4 | 0.640 ± 0.050 | 0.672 ± 0.041 | F1,84 = 12.0, p < 0.001 | F1,84 = 4.04, p < 0.05 | F1,84 = 1.71, ns |
| Volume (cm3) | 0.596 ± 0.032 | 0.611 ± 0.058 4 | 0.584 ± 0.042 | 0.618 ± 0.038 | F1,84 = 0.06, ns | F1,84 = 6.73, p < 0.05 | F1,84 = 0.99, ns |
| Density (g/cm3) | 1.57 ± 0.02 | 1.56 ± 0.03 4 | 1.54 ± 0.02 | 1.53 ± 0.02 | F1,84 = 30.3, p < 0.001 | F1,84 = 2.9, ns | F1,84 = 0.3, ns |
© 2016 by the authors; licensee MDPI, Basel, Switzerland. This article is an open access article distributed under the terms and conditions of the Creative Commons Attribution (CC-BY) license (http://creativecommons.org/licenses/by/4.0/).
Share and Cite
Bertinato, J.; Lavergne, C.; Rahimi, S.; Rachid, H.; Vu, N.A.; Plouffe, L.J.; Swist, E. Moderately Low Magnesium Intake Impairs Growth of Lean Body Mass in Obese-Prone and Obese-Resistant Rats Fed a High-Energy Diet. Nutrients 2016, 8, 253. https://doi.org/10.3390/nu8050253
Bertinato J, Lavergne C, Rahimi S, Rachid H, Vu NA, Plouffe LJ, Swist E. Moderately Low Magnesium Intake Impairs Growth of Lean Body Mass in Obese-Prone and Obese-Resistant Rats Fed a High-Energy Diet. Nutrients. 2016; 8(5):253. https://doi.org/10.3390/nu8050253
Chicago/Turabian StyleBertinato, Jesse, Christopher Lavergne, Sophia Rahimi, Hiba Rachid, Nina A. Vu, Louise J. Plouffe, and Eleonora Swist. 2016. "Moderately Low Magnesium Intake Impairs Growth of Lean Body Mass in Obese-Prone and Obese-Resistant Rats Fed a High-Energy Diet" Nutrients 8, no. 5: 253. https://doi.org/10.3390/nu8050253
APA StyleBertinato, J., Lavergne, C., Rahimi, S., Rachid, H., Vu, N. A., Plouffe, L. J., & Swist, E. (2016). Moderately Low Magnesium Intake Impairs Growth of Lean Body Mass in Obese-Prone and Obese-Resistant Rats Fed a High-Energy Diet. Nutrients, 8(5), 253. https://doi.org/10.3390/nu8050253