Article

Contribution of Organic Food to the Diet in a Large Sample of French Adults (the NutriNet-Santé Cohort Study)

1
Equipe de Recherche en Epidémiologie Nutritionnelle, Centre de Recherche en Epidémiologie et Statistiques, Université Paris 13, Inserm (U1153), Inra (U1125), Cnam, COMUE Sorbonne Paris Cité, Bobigny F-93017, France
2
Santé Publique, Hôpital Avicenne, 125 rue de Stalingrad, Bobigny F-93017, France
3
Department 'Nutrition, Obésité et Risque Thrombotique', Faculté de Médecine, Aix-Marseille Université, INSERM, UMR 1062, INRA 1260, Marseille 13385, France
*
Author to whom correspondence should be addressed.
Nutrients 2015, 7(10), 8615-8632; https://doi.org/10.3390/nu7105417
Submission received: 31 July 2015 / Revised: 17 September 2015 / Accepted: 9 October 2015 / Published: 21 October 2015

Abstract

:
In developed countries, the demand for organic products continues to substantially increase each year. However, little information is available regarding the level of consumption of organic food and its relative share of the whole diet. Our aim was to provide, using individual consumption data, a detailed description of organic food consumption among French adults. Conventional and organic intakes were assessed using an organic food frequency questionnaire administered to 28,245 French adults participating in the NutriNet-Santé study. P values of Student t-test or Chi-square for the difference between genders were reported. Less than 12% of the respondents reported never consuming organic food in the past year. Women consumed on average 20% organic food in their whole diet per day while men consumed an average of 18%. The proportion of vegetables consumed that came from organic sources was 31% among women and 28% among men. Overall, the estimate of the contribution of organic food from products of plant origin was higher than that from products of animal origin. Our study provides a framework for the exploration of organic consumption and its correlates and can serve as a basis for future studies investigating relationships between the level of organic food consumption and health outcomes.

1. Introduction

It is now widely recognized that current food patterns are unsustainable over the long term [1,2]. It seems necessary to meet the growing demand for food in a manner that is ecologically sustainable. Due to its reduced environmental impact, organic farming might be considered as a potential alternative to intensive industrial agriculture [3,4,5,6,7]. Moreover, with ethical considerations, one of the main reasons for organic food consumption appears to be the alleged beneficial effects on human health [8,9,10]. Nevertheless, strong evidence is lacking concerning nutritional differences between organic and conventional foods [11,12,13,14,15]. Moreover, few studies have investigated the direct impacts of the type of farming on health [16,17,18,19,20]. In a recent, large prospective study [17], it has been shown that there is little or no decrease in the incidence of cancer associated with the consumption of organic food, except possibly for non-Hodgkin lymphoma. However, organic food consumption was assessed using a relatively simple questionnaire and no information about the type of food consumed was collected. It is therefore necessary to go further in the analysis of the organic food diet and the type of food consumed to better understand the potential health effects of such a diet.
In this context, the worldwide organic food market has increased more than four-fold in 12 years, reaching 55 billion euros in 2013 [21]. The European market for organic products was valued at approximately 24.3 billion euros in 2013 [21]. The French organic market, valued at almost 5 billion euros [22], is the second largest in Europe after Germany and before Italy and the third largest organic market in the world [21,22,23]. However, despite this tremendous increase in the past decade, the organic food market remains modest throughout France, representing only 2.6% of the food market in 2014 [22].
According to the French Organic Agency [24], the market share of organic products varies across sectors. In 2013, more than half of the organic sales were fresh products. Thus, this share was 20% for eggs and 10% for milk [24]. This value represented 6% for the 14 most consumed fruits and vegetables (excluding citrus and bananas) while it represented between 2% and 3% for beef and pork meats and only 0.5% for processed meat [24]. That same year, 75% of organic products consumed in France came from France and, among the products imported from other countries, 44% were exotic products such as coffee, tea and chocolate [24].
Besides, according to a report released in 2015 by the same French Agency, 62% of French consumers claim to consume organic food at least once a month [10].
Nevertheless, there is little information available about the place organic food holds in total food intake and its importance according to food groups. Previous studies tend to focus on the frequency of organic food consumption or purchase [25,26,27,28] and few studies [29], none in Europe, examine the quantities of organic food consumed as a percentage of the overall diet. It has been shown that women are more inclined to purchase organic food for the household [30,31] than men. However, little is known about the actual consumption of organic food, in particular with a high level of precision, across genders.
It seems, therefore, crucial to describe the level of organic consumption to better assess health impacts of organic foods according to their contribution to the overall diet and to focus on dose-dependence.
This study aims to provide detailed information about organic food consumption from individual data collected among a large sample of French adults and to give an overall description of the level of organic food consumption, its relative share in the whole diet and the specificities pertaining to individual foods and food groups, as well as the percentages of organic food consumers of each food group.

2. Experimental Section

2.1. Ethics

The present study was conducted according to the guidelines laid down in the Declaration of Helsinki. The NutriNet-Santé study was approved by the Institutional Review Board of the French Institute for Health and Medical Research (IRB Inserm no. 0000388FWA00005831) and the “Commission Nationale de l'Informatique et des Libertés” (CNIL no. 908450 and no. 909216). All subjects signed an electronic informed consent. This study is registered in EudraCT (n2013-000929-31).

2.2. Participants

The NutriNet-Santé Study was launched in May 2009 in France with a scheduled follow-up of at least 10 years. It is an ongoing, web-based, prospective observational cohort which aims at investigating the relationship between nutrition and health as well as the determinants of dietary patterns and nutritional status. The design and methodology of the NutriNet-Santé study have been described in detail elsewhere [32].

2.3. Data Collection

2.3.1. Assessment of Individual Characteristics

Participants filled in self-administrated questionnaires using a dedicated website at baseline and at different months of follow-up. The baseline questionnaires were pilot-tested and then compared against traditional assessment methods [33,34]. These questionnaires were used to regularly collect data on demographic, socioeconomic and lifestyle characteristics, including age, gender, smoking status, physical activity (as measured by the IPAQ [35]), geographical region, marital status, number of children, educational level, socio-professional category and level of income. Income per household unit was calculated using information about household income and composition. Household income per month was divided by the number of consumption units (CU) calculated: 1 CU for the first adult in the household, 0.5 CU for other persons aged 14 or older and 0.3 CU for children under 14 [36]. Current practices of diets (type and reason, history) were also collected [37]. In particular, subjects were asked whether they were following a vegan or a vegetarian diet. A vegetarian diet was defined as a diet that did not include any meat while a vegan diet was defined as a diet that excluded all products of animal origin.

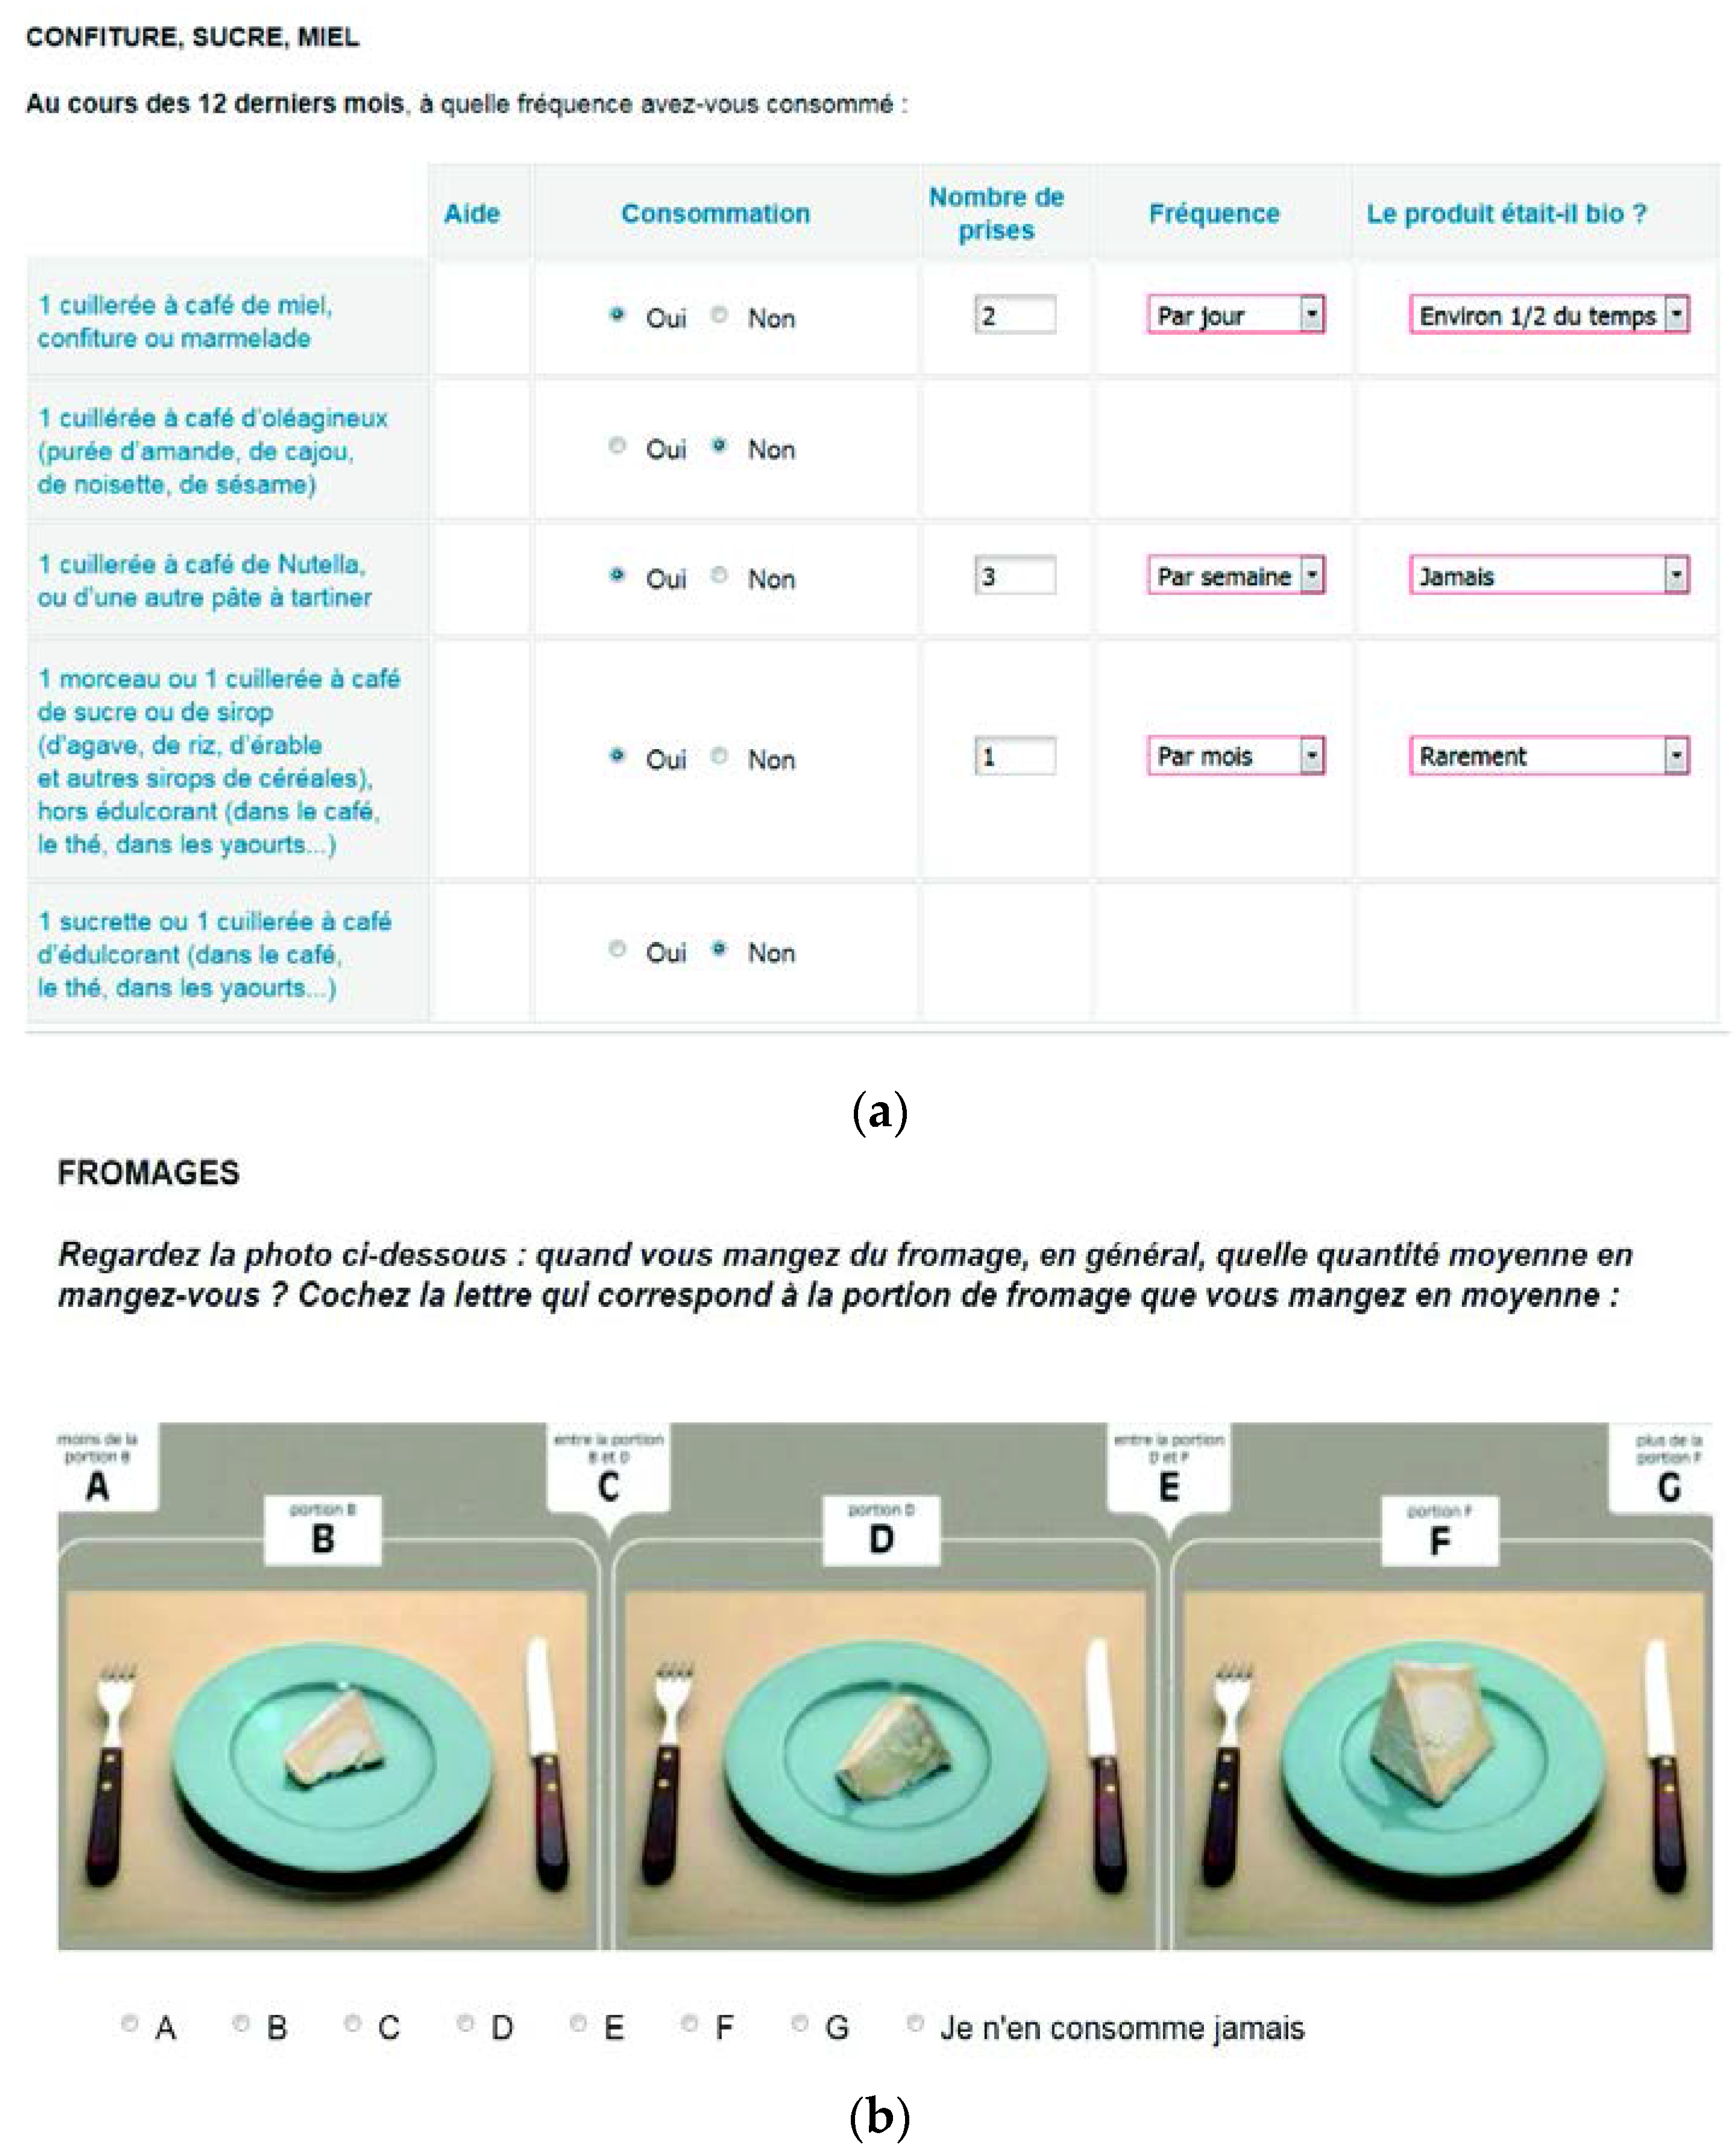
2.3.2. Organic Food Frequency Questionnaire: Org-FFQ

Initially, a semi-quantitative food frequency questionnaire (FFQ) was used in the NutriNet-Santé Study for self-administered assessment of usual dietary intake over the past year among French adults. The reproducibility and relative validity of this FFQ were previously tested against 24-hour dietary records (DRs) and acceptable reproducibility and relative validity were observed [38].
The volunteers were asked to report their consumption frequencies for 264 food and beverage items over the past year. The 264 items were divided into main food group categories. Additional questions inquired about the types of butter and margarine used for frying and baking and on bread. For most food items, subjects were asked to report their consumption frequency on the basis of how many times they ate the standard portion size proposed (typical household measurements such as spoon or standard unit such as a yogurt). The frequency of consumption referred to usual consumption over the past year on an increasing scale including yearly, monthly, weekly or daily units, as suitable, and participants were asked to provide only one answer.
For eight of the main food group categories (cheese and vegan cheese, pâté and vegan pâté, fish, meat, butter used on bread, potatoes, starchy foods and vegetables), which are usually not eaten in a predetermined portion size, the questionnaire included sets of colour photographs. Participants were asked to choose among three photographs showing different portion sizes. Together with the two intermediate and two extreme quantities, seven choices of amounts were therefore possible. For butter on a slice of bread, four portion sizes were proposed. These photographs had been previously validated [37] (Figure 1). Standard portion sizes or portion size corresponding to the photographs were multiplied by the daily frequencies to estimate the intake of each food item in grams.
Based on this original FFQ, the organic food frequency questionnaire (Org-FFQ) was developed. For each food item, except those that do not exist in organic form (i.e., water and sweetener products) a 5-point ordinal scale ranging from “never” to “always” was used to determine the proportion of intake that was of organic origin. Participants were asked to answer the following question: “How often was the product of organic origin?” For butter and margarine used for bread and frying, participants were asked to choose the most frequently consumed item among approximately 20 organic or conventional items. To estimate the organic intake, for each food item, a weight of 0, 0.25, 0.5, 0.75 and 1 was respectively applied to the following modalities: never, rarely, half the time, often and always. In order to better understand the impact of allocating arbitrary percentages, sensitive analyses were performed. A percentage of 10% instead of 25% was allocated to the modality rarely. Furthermore, 20 Monte-Carlo simulations were also performed [39]. For this purpose, to each category of frequency (never, rarely, half-of-the-time, often and always), arbitrary intervals were assigned as follows: the “never” modality was equivalent to a frequency comprising between 0% and 2.5%, rarely between 2.5% and 35%, half of the time between 35% and 65%, often between 65% and 90%, and always between 90% and 100%. It was hypothesized that the modalities were uniformly distributed within those intervals. For one set of data, the same percentage was attributed to one particular modality. Although the food frequency questionnaire used showed acceptable reproducibility and relative validity, the question relating to the frequency of organic food consumption was not validated.
Figure 1. Extracts of the Org-FFQ, NutriNet-Santé Study, N = 28,245; (a) For each food item consumed, the quantity, the frequency of the intake and the relative organic share were asked; (b) For eight categories which are usually not eaten in a predetermined portion size, the questionnaire included sets of colour photographs.
Nutrients 07 05417 g001

2.4. Statistical Analysis

From the 264 food items, 33 food groups were developed on a nutritional basis. Because of the high contribution of beverages in terms of weight to the total intake, we distinguished liquid products from solid ones. In all individuals, we calculated the average quantity (in g/day) of the whole diet, the solid-based diet, the liquid-based diet and the average quantity consumed for the 33 food groups. This was performed for the overall diet and for the organic food diet. In a second step, we assessed the average proportion of organic food consumed in the whole diet, the liquid-based diet, the solid-based diet, and by food group among consumers of each food group, namely the ratio for these indicators.
In a final step, we determined the 10 most popular organic food items according to several criteria. In a first approach, we defined this top 10 in terms of number of consumers. The top 10 organic foods were also calculated in terms of absolute organic intake (g/day) and relative intake. For each food item, the relative organic intake was calculated by averaging the total organic food intake (g/day) out of the total intake (g/day). Finally, in all individuals, we calculated the most frequently consumed organic items by multiplying the daily frequency of consumption by the frequency of consumption in its organic form.
In all individuals and among organic consumers (i.e., consumers who did at least report consuming one organic food item) the following was also calculated: the percentage of subjects who consumed each food group, the percentage of consumers having at least 50% of the food group of organic origin and the percentage of consumers having 100% of the food group of organic origin.
The average total and organic food consumptions (g/day) were also examined for the overall diet and by food groups according to age, formal education, income, location, physical activity and type of diet (meat-eaters vs. vegetarians and vegans). The share of organic food consumption in the diet was also calculated according to these factors and means, standard deviations and medians were provided.
The Org-FFQ was administered over a 5-month period from June to October 2014. A total of 33,384 persons had completed the Org-FFQ. Only participants with a plausible energy intake were included in the analyses for dietary intakes to avoid unrealistic estimates as diet underreporting and overreporting participants were identified. Briefly, basal metabolic rate (BMR) was estimated by Schofield equations [40] according to gender, age, weight and height collected at enrollment in the study. Energy requirement, accounting for physical activity level (set by default at 1.55) and BMR, was compared with energy intake. The ratio between energy intake and energy requirement was calculated and individuals with ratios below or above cutoffs previously identified (0.35 and 1.93) in the FFQ were excluded. Thus, we excluded 2097 individuals with inappropriate energy intake, 2320 individuals with missing covariates and 722 participants residing in overseas territories, thus leaving 28,745 participants available for analysis (20,980 women and 7265 men).
For each gender, weighting was calculated using the iterative proportional fitting procedure according to 2009 national census reports [41] on age, occupational category, area of residence and whether or not the household included at least one child (<18 years).
We compared the socio-demographic characteristics of included and excluded NutriNet-Santé participants using chi-square tests and Student t-tests, as appropriate. Due to well-known differences in dietary patterns across genders, all analyses were performed separately for women and for men.
Descriptive characteristics of the sample are presented as means (± SD) or n% as appropriate and p values of Student t-test or Chi square for the difference between genders are reported.
Tests of statistical significance were 2-sided and the type I error was set at 5%. Statistical analyses were performed using SAS software (version 9.3, SAS Institute Inc., Cary, NC, USA).
All the results presented are weighted data.

3. Results

3.1. Description of the Study Population

To better understand the selected sample, we compared characteristics of individuals who completed the questionnaire (N = 33,384) (before weighting) and excluded NutriNet-Santé participants (N = 123,239). The percentage of women who completed the Org-FFQ was lower (74% vs. 79%), the respondents were also more likely to be retired (36% vs. 14%), older (53.20 ± 14.07 year vs. 44.62 ± 14.20 year) and more often a holder of a master degree (34% vs. 33%).
Sociodemographic and lifestyle characteristics by gender are summarized in Table 1.
Table 1. Sociodemographic and lifestyle characteristics of the weighted sample, NutriNet-Santé Study, N = 28,245.
WomenMenp *
Mean  or %SDMean or %SD
N—not weighted %20,980 (74.28) 7265 (25.72)
N—weighted %14,788.40 (47.64) 13,456.60 (52.36)
Age (years)48.6513.8847.3921.92<0.0001
Educational level <0.0001
 <High school diploma58.39 61.25
 High school16.07 14.56
 Post-secondary graduate25.54 24.19
Income per household unit <0.0001
 <1.200 euros24.68 23.85
 1.200–1800 euros25.50 24.17
 1.800–2.700 euros22.04 24.72
 >2700 euros10.66 15.83
 Missing17.12 11.43
Socio-professional categories <0.0001
 Farmer0.55 1.53
 Craftsman, shopkeeper, business owner1.87 5.14
 Non employed7.74 1.32
 Employee25.31 8.41
 Student4.60 4.40
 Manual worker5.22 23.49
 Intermediate profession14.47 14.53
 Retired28.61 26.12
 Managerial staff4.89 3.37
Location <0.0001
 Rural community24.60 26.23
 Urban unit with a population smaller than 20,000 inhabitants15.32 15.13
 Urban unit with a population between 20,000 and 200,000 inhabitants16.22 16.85
 Urban unit with a population higher than 200,000 inhabitants43.86 41.79
Smoking status <0.0001
 Never smoker52.66 41.56
 Former smoker33.78 42.94
 Current smoker13.56 15.50
Physical activity <0.0001
 High20.92 16.83
 Medium34.02 29.20
 Low31.58 37.87
 Missing13.48 16.10
Vegetarian diet2.88 1.53 <0.0001
Vegan diet3.25 2.93 0.12
Location <0.0001
 Rural community24.60 26.23
 Urban unit with a population smaller than 20,000 inhabitants15.32 15.13
 Urban unit with a population between 20,000 and 200,000 inhabitants16.22 16.85
 Urban unit with a population higher than 200,000 inhabitants43.86 41.79
* p-values based on Student t-test or Chi squared for difference between genders as appropriate; By consumption unit in the household: official weighting system by the French National Institute of Statistics and Economic Studies INSEE; SD, standard deviation.
Compared to women, men were younger while they were more likely to present a post-graduate formal education level, an income per household unit of >2700 euros, and a low physical activity level. They were also more likely to be managerial staff, single and smokers. The percentage of individuals following a vegetarian or vegan diet was higher among women than among men.

3.2. Percentage of Organic Food Consumers by Food Group

The Table S1 provides, in the entire sample and among organic food consumers, (1) the percentage of consumers of each food group; (2) the percentage of consumers having at least 50% of the food group with organic origin and (3) the percentage of consumers having 100% of the food group with organic origin.
The percentage of non-organic food consumers (i.e., individuals consuming 0 g/day of organic foods) was 8.4% in women and 14.7% in men. Vegetables, fruits, cereals and sweetened products were largely consumed by the participants and by organic food consumers in particular, with percentages of consumers higher than 98%. More than a quarter of organic food consumers reported eating at least 50% of vegetables, fruits and related products of organic sources. Milk was consumed by only 35.6% of the study population but 24.4% of the consumers reported consuming at least 50% of their milk from organic sources, while among the 89.4% subjects who consumed dairy products this percentage did not reach 20%.

3.3. Contribution of Organic Food to the Whole Diet by Gender

Table 2 shows the relative contribution of organic food in the whole diet in terms of weight and energy by gender.
As expected, compared to women, men had a higher total intake but a lower intake from organic sources. Women consumed on average 695.62 ± 673.35 g/day of organic food, and men consumed 621.79 ± 1002.10 g/day. The proportion of organic sources in the diet was significantly different across genders: organic foods contributed to 20% to the whole diet among women and 18% among (p < 0.0001). When excluding the liquid products and the water in particular, corresponding proportions were 28% among women and 25% among men.

3.4. Contribution of Organic Food to Food Groups

Results in Table 3 describe the mean intake of 33 food groups (overall and organic). Compared to women, men had higher total food intakes of fruit juices, products of animal origin (meat, processed meat, poultry, eggs, milk and cheese), starchy food, sugary products, alcoholic beverages and soda.
Concerning the contribution of organic food to different food groups, women consumed a significantly higher proportion of organic foods for most food groups compared with men except for processed meat, fish, cheese, alcohol, dairy substitutes and soda. Among women, the contribution of organic food to the total intake ranged from 0.11 ± 0.14 (non-alcoholic drinks) to 0.81 ± 0.26 (meat substitutes) whereas among men, ratios ranged from 0.09 ± 0.20 (non-alcoholic drinks) to 0.76 ± 0.52 (meat substitutes). In both genders, the proportion of fruits and vegetables consumed that came from organic sources was around one-third while this contribution was less than 20% for meat and fish and around one quarter for cereals.
Table S2 shows a comparison between the contributions of organic food to the diet and by food group across gender using a fixed percentage of 25% for the modality rarely, a fixed percentage of 10% for the modality rarely and using Monte-Carlo simulations to affect percentages to each modality.
Attributing a frequency of 10% to rarely did not change substantially the results (−2.5% on average) while the impact of the Monte-Carlo simulations was even lower (−1% on average). The share of organic food in the whole diet was 18% among women and 16% among men when allocating a percentage of 10% to rarely while it was 19% among women and 17% among men when using Monte-Carlo simulations.
Overall, older subjects (i.e., above the median value equals to 48 years old), individuals with high school diploma, with an income per household unit higher than 1800 euros per month, living in rural area, undertaking physical activity of more than 30 min of brisk walking per day, and vegetarians/vegans demonstrated higher intake of organic food (g/day) than their counterparts (Table S3).

3.5. Top 10 Organic Food Items

The top 10 most consumed organic food items in terms of number of consumers, of absolute intake (g/day), of relative organic food intake and of frequency per day are presented in Table 4 for women and men.
In terms of number of consumers, eggs were the products consumed by the largest number of individuals in their organic form among both genders out of the 264 food items. Among the 10 most commonly consumed items (as regards quantity in g/day), six of them (apple, green salad, tomato, citrus fruit, cucumber and peach) in women and five of them in men (apple, green salad, tomato, banana, carrot) were fruits and vegetables. Organic whole bread was also largely consumed in both genders (it held the fourth place in women and the third in men). The food items with the highest organic food contributions were specific foodstuffs rarely consumed by participants in general. Thereby, only a weighted number of “573” women reported eating linseed oil while a weighted number of “695” men reported eating seitan. The food item “honey/jam” was the most frequently consumed item in its organic form in both genders, since this product was consumed in its organic form more than every three days.

3.6. Contribution of Organic Food to the Whole Diet According to Several Sociodemographic and Lifestyle Factors

Table 5 provides the share of organic food in the whole diet according to several factors of variation: gender, age, education, income, location, physical activity and type of diet.
Table 2. Share of organic food in the whole diet by gender (g/day and kcal/day), NutriNet-Santé Study, N = 28,245.
WomenMenp *
n = 20,980n = 7265
TotalOrganicRatioTotalOrganicRatio
MeanSDMeanSDMeanSDMeanSDMeanSDMeanSD
Total Intake (g/day)3408.34949.91695.62673.350.200.183497.161666.2621.791002.100.180.28<0.0001
Liquid intake (g/day) 1108.00461.83290.20328.160.260.251130.69825.85255.77499.490.230.40<0.0001
Solid intake (g/day) 1360.44478.29405.42425.180.280.231396.72812.46366.02624.750.250.38<0.0001
Water intake (g/day)939.9044.34NANANANA969.75982.85NANANANA/
Total intake (kcal/day)1979.06539.19537.74502.910.270.232280.271016.5546.54852.480.240.36<0.0001
Liquid intake (kcal/day) 198.16121.8353.1770.740.270.25246.58248.5956.71125.540.230.39<0.0001
Solid intake (kcal/day) 1780.9005.72484.57460.070.270.232033.69955.08489.83776.980.240.36<0.0001
* p-values based on Student t-test (for difference between ratios); Liquid products (including soups and beverages); Solid products; SD, standard deviation; NA, not applicable.
Table 3. Share of organic food by food groups by gender (g/day), NutriNet-Santé Study, N = 28,245.
Food groupsWomenMenp §
n = 20,980n = 7265
N *N TotalOrganicRatio N *N TotalOrganicRatio
MeanSDMeanSDMeanSD MeanSDMeanSDMeanSD
Vegetables2096214778.38277.93187.84107.36158.410.310.27725313443.91254.34260.3183.43185.500.280.44<0.0001
Soup1969713327.1784.5289.2834.1258.140.340.30642610818.1554.22123.8119.2471.630.330.460.0017
Fruits2092514710.15320.03274.7599.73148.550.290.26724113212.14249.30389.3375.42228.720.280.440.0102
Fruit juice1686511268.1784.6695.2927.5349.920.330.28580310418.8487.40161.3828.7895.160.290.46<0.0001
Nuts1578110032.063.596.541.784.440.350.3051788248.8762.428.351.155.880.330.480.0007
Meat1980113404.1257.1648.269.4916.720.180.22701312613.5288.87143.1914.2539.640.180.350.9520
Processed meat1969413236.6329.4824.094.067.600.150.19697312375.2740.0548.386.4819.820.160.320.0074
Fish2016113622.6241.5636.466.3212.240.150.19699411930.7940.7563.887.4427.530.160.330.0015
Poultry1984913437.1723.4422.415.508.720.270.26696412537.727.9543.616.3515.220.260.420.0006
Eggs2009513743.711.4010.116.177.830.520.34697212698.5414.1740.415.1414.580.400.54<0.0001
Milk68955038.40663.76117.7115.3253.170.290.3222765015.2567.56196.4317.2994.050.280.560.3421
Dairy products1944413286.39162.75129.7933.9456.950.240.27655111963.28134.93173.3125.8972.390.230.440.0015
Cheese2028313936.136.8135.315.1510.530.150.20700912699.9546.0365.887.6323.520.170.33<0.0001
Milky desserts151109678.50512.0223.161.567.470.140.2149948301.99911.9931.791.106.200.120.30<0.0001
Potatoes2077314660.2221.3218.136.1511.120.280.30721613266.0635.4465.718.3619.840.260.460.0001
Bread1794212361.8446.5344.396.0013.220.160.21611811568.3467.8086.719.2331.260.160.340.1516
Cereals ||2084414673.2377.5159.0320.5834.060.280.29718413386.24112.95140.9725.7370.350.240.45<0.0001
Wholegrain products 1748911521.0158.2873.6828.0352.530.370.3055219193.96552.27113.7928.0195.610.370.480.7229
Oil2074414489.6119.8614.227.9910.910.360.32714612882.6917.2126.806.4214.900.330.51<0.0001
Cookies1903213175.3111.1117.471.243.730.150.22651211538.1714.1028.951.466.580.130.31<0.0001
Nonalcoholic drinks **2097814786.71680.03708.18182.76256.340.110.14726213454.841668.141220.4143.17358.470.090.20<0.0001
Sweet2092514743.7346.5135.0311.6619.980.250.24724113229.9654.5359.7412.3825.750.240.380.0238
Fast food2037114204.831.0325.105.059.420.170.22705012767.2265.60311.6111.6578.030.150.32<0.0001
Meat substitutes67964428.2147.9421.507.0219.740.810.2616543306.0386.2435.345.1732.390.760.52<0.0001
Dressing2048914275.827.156.921.503.570.220.26708812758.57.6911.971.425.090.200.39<0.0001
Alcohol1906912420.1960.0281.419.1625.870.140.18689212177.21136.47256.2420.9572.250.160.31<0.0001
Snacks1966613358.929.9111.923.137.960.190.25679812325.110.0024.072.4711.480.170.37<0.0001
Grains93255780.8773.708.192.907.030.700.3122794429.6122.129.561.638.190.640.55<0.0001
Other fats ††1979813777.134.015.481.002.380.250.29652111510.382.795.700.833.490.230.43<0.0001
Dairy substitutes ‡‡61703992.6430.9081.4725.1073.050.630.3314872864.71430.40157.4625.40146.820.650.580.1721
Legumes1880912558.8520.2142.8012.1841.060.310.3165211110420.5348.819.0441.630.280.47<0.0001
Soda1471610210.8856.59117.154.7223.040.110.20491910124.6566.25206.907.4442.630.130.36<0.0001
* Number of consumers of each food group (not weighted); Number of consumers of each food group (weighted); Ratio calculated among consumers of each food group; § p-values based on Student t-test (for difference between ratios); || Including pasta, white rice, muesli, semolina and breakfast cereals; Including wholegrain bread, wholegrain rice and wholegrain pasta; ** Including coffee, tea, chicory, hot chocolate and water; †† Including mayonnaise, fresh cream, vegetal fresh cream; ‡‡ Including soy yogurt, vegetal-based cheese, vegan fresh cheese, soy milk.
Table 4. Top 10 Organic Food items by gender, NutriNet-Santé Study, N = 28,245.
In Terms of Number of ConsumersN *In Terms of Weight ,g/dayIn Terms of Contribution in the Intake §%N *In Terms of Frequency per day
Women n = 20,980
1fried eggs9192apple23.31linseed oil92573honey, jam0.35
2hard boiled eggs8754green salad20.02kombucha91179olive oil0.33
3tomato8655tomato17.08vegan chorizo90626tea0.27
4honey, jam8328whole bread13.91soy milk901979whole bread0.25
5cucumber8096legumes12.18vegan pâté891111herbal tea0.20
6olive oil7949citrus fruit11.51vegan fresh cheese8914089green salad0.20
7green salad7948full fat yoghurt11.01seitan89831chocolate0.17
8strawberry7775cucumber10.3vegan galette882636black coffee0.16
9peas7719peach9.71sprouted seeds871332tomato0.16
10apple7715whole rice9.46safflower oil87134spreadable butter0.15
Men n = 7265
1fried eggs7367apple21.16seitan98695honey, jam0.39
2tomato7215green salad15.28vegan fresh cheese98341whole bread0.28
3honey, jam6889whole bread15.14coconut oil97360olive oil0.27
4olive oil6788tomato13.96vegan pâté96981black coffee0.22
5apple6570banana9.99vegetal-based cheese95254chocolate0.19
6green salad6500legumes9.04kombucha94369tea0.18
7strawberry6477white bread8.74linseed oil93427white bread0.16
8peas6452pasta8.32soy-based cheese92225green salad0.14
9cucumber6429full fat yoghurt8.25vegan chorizo91408spreadable butter0.14
10carrot6216carrot7.98vegan galette891349apple0.13
* Weighted number of consumers of each food item; in all individuals; only solid products were considered; § among consumers of each food item.
Table 5. Share of organic food in the whole diet according to several sociodemographic and lifestyle factors, NutriNet-Santé Study, N = 28,245.
Weighted %Ratiop *
MeanSDMedian
Gender <0.0001
 Women47.640.200.180.14
 Men52.360.180.280.10
Age <0.0001
 ≤Median age (48 years old)50.100.180.250.11
 >Median age (48 years old)49.900.190.180.13
Education <0.0001
 <High school diploma75.110.180.300.10
 ≥High school diploma24.890.210.130.16
Income <0.0001
 <1800 euros57.430.170.250.09
 ≥1800 euros42.570.220.180.16
Location <0.0001
 Rural area25.440.200.220.13
 Urban area (community ≥ 5000 inhabitants)74.560.190.200.12
Physical activity <0.0001
 <30 min brisk walking/day22.250.140.180.07
 ≥30 min brisk walking/day77.750.210.210.16
Type of diet <0.0001
 Meat eaters94.670.170.190.11
 Vegetarians and vegans5.330.470.290.48
* p-values based on Student t-test (for difference between ratios).
Individuals older than 48 years old, with high educational level and income, living in rural area and undertaking medium or high physical activity as well as those who followed a vegan or vegetarian diet had higher contributions of organic food in their intake than their counterparts. The consumption of organic food of half of the vegetarians and vegans constituted more than 48% of their diet, while 50% of the meat eaters had a diet consisting of less than 11% of organic food.

4. Discussion

The current study provides a detailed description of organic food consumption in the whole diet in a large French adult population from the NutriNet-Santé study. Less than 12% of the respondents reported never consuming organic food over the past year. Women consumed on average 20% of organic food in their whole diet per day while men consumed an average of 18%. The proportion of vegetables consumed that came from organic sources was 31% among women and 28% among men and for eggs was 52% among women and 40% among men. These contributions were less than 20% for meat and fish and around one quarter for cereals.
In the current study, we found that the percentage of non-consumers was equal to 11.4%. This was found to be consistent with the survey question asked by the French Organic Agency “Have you consumed any organic products over the past year?” where 12% of the 506 respondents reported never consuming any organic foods. We also found that the percentage of individuals that had reported never consuming any organic foods was lower among women (8.4%) than among men (14.7%). This finding was in accordance with the results of the same survey where 10% of women and 15% of men had reported never consuming organic food [10]. Another noteworthy finding of our study was that the highest consumption of organic food was by women compared to men in terms of absolute intake and in terms of relative share of organic consumption in the diet. This relative share was significantly higher in women than in men (p < 0.0001). These results seem consistent with other studies showing that women are more willing to pay than men for organic food mainly for health considerations [31,42]. In accordance with previous works [28,43,44,45,46], the current study also found that individuals with a high education level, a higher level of physical activity and following a vegetarian or vegan diet had a higher contribution of organic food in their diet compared to their counterparts. Surprisingly, the relative share of organic food in the diet was higher among individuals living in rural areas than those living in urban areas, contradicting previous research [27,45].
To our knowledge, there was only one study which investigated the contribution of organic food to the diet. That study focused on regular organic consumers and was conducted in Australia on a limited number of participants [29]. In their study, two questionnaires were administered to participants; the amount of organic food consumption was calculated based on quantification of serving size by food group among 19 participants. The frequency of organic consumption was also examined for nine food groups (N = 318). Unsurprisingly, as the survey targeted regular consumers of organic foods, higher percentages were obtained for organic food consumption from their study. The study conducted using three 24 h records from 19 participants, found that the percentage of their diet that came from organic sources based on the relative amount in diet was 76.3% from organic sources which compares with 20% in women and 18% in men in our study.
In our study, another important finding was that overall the contribution of organic food to the diet was higher for products of plant origin than for products of animal origin. The only exception was eggs: 52% of the consumption of eggs was of organic origin for women and 40% for men. Eggs were the top food from an animal source consumed in organic form among the top 10 organic foods. In regards to organic animal products’ consumption, organic eggs were followed by organic milk. Our findings were in accordance, for some food groups, with the previously cited Australian study [29]. Thus, according to this study, the most popular organic food groups were fruits and vegetables and the least popular were meat products (including poultry and fish) [29].
In our study, 27.2% of the subjects ate more than half of their vegetables from organic sources and 24.4% of fruit consumers ate more than half of their fruit in organic form. These results are consistent with the survey of the French Organic Agency in which 28% of the respondents ate more than half of their fruits and vegetables in their organic form [10]. It has been found that organic food consumers tend to be large consumers of fruits and vegetable [25,27,28], and in the past decade, the share of land dedicated to organic fruits and vegetables has increased. Thus, the share of organic farms dedicated to fruits and vegetables was found to be 16% while 8% of the farms from all types of production (conventional and organic) in France in 2013 were organic [24].
Regarding meat and fish, the contribution of organic foods to these food groups was lower than 20%. These results may seem high compared to the share of the organic meat in the market which represents 0.77% (pig farming) to 7% (laying hens) of the sector [24]. Nevertheless, they fall within the framework of an increase of organic meat production while overall a decrease of meat consumption is observed (−2.5% in 2013) [47]. Along with the high contribution of organic eggs in egg consumption, organic poultry was found to make a relatively high contribution in the consumption of poultry (27% and 26% in women and men, respectively) compared to other meat products. Consistent with the survey by the French Organic agency, the percentage of consumers having 100% of poultry from organic sources was 6.7% (vs. 5% in the survey) [10]. The relatively low consumption of organic fish was expected given that this foodstuff is mostly available in its conventional form. The sector of organic seafood represented only 1.1% of the market in 2013. Moreover, wild fish do not exist in organic form and organic fish in France are mostly imported [24].
Dairy products and cheese were food groups largely consumed by the study population (consumed by around 90% of participants) unlike milk which was only consumed by 35.6% of the subjects. Nevertheless, the contribution of organic foods to these food groups (around one quarter for dairy products and around 15% for cheese) was lower in comparison to milk (around 30%). When comparing with the market share of organic foods, which represented more than 10% of the milk market in 2013 in France, these results may seem high [24]. Nevertheless, these results follow the trend of the global milk and related product market [48]. Thus, unlike the conventional sector in which milk represented only 10% of the transformations, packaged milk retained a prominent place in the organic sector. However, the trend is reversed for cheeses (11% of the transformations) while they represented 37% of conventional milk transformations [48].
Among both women and men, on average, 37% of the consumption of wholegrain products came from organic sources. This high proportion may be explained by the fact that organic wholegrain products are quite common and largely consumed by organic food consumers [25]. The highest contributions of organic foods (with ratios higher than 0.60 for both men and women) were meat- and dairy-substitutes. This was not surprising as the main part of these foodstuffs is consumed in organic form. This can be explained by the broad range of organic offerings and the fact that some of these products are available almost exclusively in organic form.
In the present study, the contributions of organic food to processed meat, fast food or non-alcoholic beverage consumption were among the lowest. A possible explanation for these results might be the fact that such products are mostly unavailable on the market in organic form. Besides, these products may not be considered “healthy” and therefore are not the organic consumers’ preferred choices as observed before in French adults [25].
The key strengths and original aspects of this study were its large sample size and the innovative approach in the assessment of organic food consumption focusing on absolute and relative shares of organic food in the diet. The large sample size ensures capturing large variations in dietary behaviours and in the amount of organic foods consumed. A further strength of the current study was the use of a semi-quantitative food frequency questionnaire with over 260 items including a very large range of foods, which enabled making a reliable estimation of usual diet over the previous year.
However, several limitations to this study should be mentioned. The contribution of organic food to the diet in the present study seems high regarding its share in the food market [24]. Several hypothesizes may explain such figures.
Firstly, the participants enrolled in our study were volunteers in a nutrition cohort and were probably more interested in nutritional issues and healthy lifestyles including organic food issues than the general population. The participants of the NutriNet-Santé cohort exhibit particular characteristics when compared to the general French population [49]. They are more often women and more often a holder of a university degree. This has led to some self-selection (or recruitment) biases. To partly overcome this limitation, all analyses were weighted for each gender according to age, occupational category, area of residence and whether or not the household included at least one child (<18 years) using the iterative proportional fitting procedure according to national census [41] in order to make our sample more representative socio-demographically of the French population. Nevertheless, the nutrition interest of the subjects of the cohort still remains.
Furthermore, individuals selected in the final sample exhibited particular characteristics when compared to other individuals of the cohort. They were older and more often men. As the questionnaire was optional, organic food consumers were certainly more willing to fill out this questionnaire than non-consumers.
In addition to this recruitment bias, a social desirability bias may have occurred as reported in other work [50]. It has been shown that social desirability traits may influence self-reported dietary measures and, in turn, organic food consumption has been probably overestimated. However, a validation study comparing the same food frequency questionnaire with repeated 24 h records exhibited acceptable relative validity and good reproducibility [38] although the question relating to organic food consumption frequency has not been validated.
Moreover, this high consumption of organic food must be interpreted in the light of the use of the ordinal scale: only five choices were given to participants. Thus, a percentage of 25% was allocated to the frequency “rarely”, which does not reflect the very occasional consumers. Nevertheless, in a sensitive analysis, we attributed a percentage of 10% to the frequency rarely and the results were not substantially modified. Similarly, when using Monte-Carlo simulations, with the modalities which were not set-values but were allowed to vary along a uniform distribution, results remained almost unchanged. Finally, data collection is based on self-reported questionnaires which are prone to measurement errors.
Caution is therefore needed when extrapolating the results to the consumption of the general population. The findings are estimates of the contribution of organic food in the diet using a specific tool in a particular population calculated from self-reported consumption. However, our study provides a particularly original contribution to the literature as there remains a paucity of data concerning the contribution of organic food in the diet. Besides, our findings seem consistent with the current food market in terms of the food groups that are the largest organic contributors.
Additionally, to determine whether participants knew what organic referred to, we tested knowledge of official organic labels through a dedicated questionnaire (data not shown). Among those who responded to both questionnaires (N = 23,010), 93% were able to identify the French organic label “AB”.

5. Conclusions

To conclude, this study is original in its innovative approach, with its focus on organic food consumption as a whole and by food group, and in terms of frequency and of absolute and relative intake. We showed that, for some food groups, organic food consumption was not marginal in the diet of our study population. Overall, organic fruits, vegetables and related products were integral components of the diet. Also, organic eggs were quite widely consumed; however, lesser quantities of organic meat and meat products were consumed. Organic fast food, processed food or sweetened foods had lower contributions and efforts in that regard should be made. Organic food consumers are a very large and heterogeneous group and more research is needed to better characterize the diet of non-, occasional, and regular organic food consumers. Further research should accurately investigate the specificities of such consumers to shed further light on the potential relationships between the level of organic food consumption and health.

Supplementary Materials

Supplementary materials can be accessed at: https://www.mdpi.com/2072-6643/7/10/5417/s1.

Acknowledgments

The NutriNet-Santé cohort study is funded by the following public institutions: Ministère de la Santé, Institut de Veille Sanitaire (InVS), Institut National de la Prévention et de l'Education pour la Santé (INPES), Institut National de la Santé et de la Recherche Médicale (INSERM), Institut National de la Recherche Agronomique (INRA), Conservatoire National des Arts et Métiers (CNAM) and Paris 13 University. The funders had no role in study design, data collection and analysis, decision to publish, or preparation of the manuscript. The BioNutriNet project was supported by the French National Research Agency (Agence Nationale de la Recherche) in the context of the 2013 Programme de Recherche Systèmes Alimentaires Durables (ANR-13-ALID-0001).

Author Contributions

Serge Hercberg, Pilar Galan, Emmanuelle Kesse-Guyot, Sandrine Péneau, Caroline Méjean, Mathilde Touvier and Denis Lairon conceived and designed the experiments. Julia Baudry, Serge Hercberg, Pilar Galan, Emmanuelle Kesse-Guyot, Sandrine Péneau, Caroline Méjean and Mathilde Touvier performed the experiments. Julia Baudry and Emmanuelle Kesse-Guyot analyzed the data. Julia Baudry and Emmanuelle Kesse-Guyot wrote the paper. Julia Baudry, Caroline Méjean, Benjamin Allès, Sandrine Péneau, Mathilde Touvier, Serge Hercberg, Denis Lairon, Pilar Galan and Emmanuelle Kesse-Guyot involved in interpreting results and editing the manuscript. Julia Baudry had primary responsibility for final content. All authors read and approved the final manuscript.

Conflicts of Interest

The authors declare no conflict of interest.

References

  1. Foley, J.A.; DeFries, R.; Asner, G.P.; Barford, C.; Bonan, G.; Carpenter, S.R.; Chapin, F.S.; Coe, M.T.; Daily, G.C.; Gibbs, H.K.; et al. Global consequences of land use. Science 2005, 309, 570–574. [Google Scholar] [CrossRef] [PubMed]
  2. Diet, Nutrition and the Prevention of Chronic Diseases. Available online: http://www.who.int/dietphysicalactivity/publications/trs916/en/gsfao_introduction.pdf (accessed on 11 February 2015).
  3. Gomiero, T.; Pimentel, D.; Paoletti, M.G. Environmental impact of different agricultural management practices: conventional vs. organic agriculture. Crit. Rev. Plant Sci. 2011, 30, 95–124. [Google Scholar] [CrossRef]
  4. Pimentel, D.; Hepperly, P.; Hanson, J.; Douds, D.; Seidel, R. Environmental, energetic, and economic comparisons of organic and conventional farming systems. BioScience 2005, 55, 573–582. [Google Scholar] [CrossRef]
  5. Tuomisto, H.L.; Hodge, I.D.; Riordan, P.; Macdonald, D.W. Does organic farming reduce environmental impacts?—A meta-analysis of European research. J. Environ. Manage. 2012, 112, 309–320. [Google Scholar] [CrossRef] [PubMed]
  6. Agriculture Biologique et Environnement: Des Enjeux Convergents. Available online: http://www.synabio.com/doc/synabio-doc-359.pdf (accessed on 11 February 2015).
  7. Bengtsson, J.; Ahnström, J.; Weibull, A.-C. The effects of organic agriculture on biodiversity and abundance: A meta-analysis: Organic agriculture, biodiversity and abundance. J. Appl. Ecol. 2005, 42, 261–269. [Google Scholar] [CrossRef]
  8. Hughner, R.S.; McDonagh, P.; Prothero, A.; Shultz, C.J.; Stanton, J. Who are organic food consumers? A compilation and review of why people purchase organic food. J. Consum. Behav. 2007, 6, 94–110. [Google Scholar] [CrossRef]
  9. Hjelmar, U. Consumers’ purchase of organic food products. A matter of convenience and reflexive practices. Appetite 2011, 56, 336–344. [Google Scholar] [CrossRef] [PubMed]
  10. Baromètre de Consommation et de Perception des Produits Biologiques en France. Available online: http://www.agencebio.org/sites/default/files/upload/documents/4_Chiffres/BarometreConso/barometre_agence_bio_public.pdf (accessed on 23 June 2015).
  11. Barański, M.; Średnicka-Tober, D.; Volakakis, N.; Seal, C.; Sanderson, R.; Stewart, G.B.; Benbrook, C.; Biavati, B.; Markellou, E.; Giotis, C.; et al. Higher antioxidant and lower cadmium concentrations and lower incidence of pesticide residues in organically grown crops: A systematic literature review and meta-analyses. Br. J. Nutr. 2014, 112, 794–811. [Google Scholar] [CrossRef] [PubMed]
  12. Lairon, D.; Huber, M. Food Quality and Possible Positive Health Effects of Organic Products. In Organic Farming, Prototype for Sustainable Agricultures; Bellon, S., Penvern, S., Eds.; Springer Netherlands: Berlin, Germany, 2014; pp. 295–312. [Google Scholar]
  13. Smith-Spangler, C.; Brandeau, M.L.; Hunter, G.E.; Bavinger, J.C.; Pearson, M.; Eschbach, P.J.; Sundaram, V.; Liu, H.; Schirmer, P.; Stave, C.; et al. Are organic foods safer or healthier than conventional alternatives? A systematic review. Ann. Intern. Med. 2012, 157, 348–366. [Google Scholar] [CrossRef] [PubMed]
  14. Huber, M.; Rembiałkowska, E.; Średnicka, D.; Bügel, S.; van de Vijver, L.P.L. Organic food and impact on human health: Assessing the status quo and prospects of research. NJAS—Wagening. J. Life Sci. 2011, 58, 103–109. [Google Scholar] [CrossRef]
  15. Comparison of composition (nutrients and other substances) of organically and conventionally produced foodstuffs: A systematic review of the available literature. Available online: https://www.schweine.net/services/files/7_org.pdf (accessed on 17 January 2014).
  16. Alfvén, T.; Braun-Fahrländer, C.; Brunekreef, B.; von Mutius, E.; Riedler, J.; Scheynius, A.; van Hage, M.; Wickman, M.; Benz, M.R.; Budde, J.; et al. Allergic diseases and atopic sensitization in children related to farming and anthroposophic lifestyle—the PARSIFAL study. Allergy 2006, 61, 414–421. [Google Scholar] [CrossRef] [PubMed]
  17. Bradbury, K.E.; Balkwill, A.; Spencer, E.A.; Roddam, A.W.; Reeves, G.K.; Green, J.; Key, T.J.; Beral, V.; Pirie, K.; Banks, E.; et al. Organic food consumption and the incidence of cancer in a large prospective study of women in the United Kingdom. Br. J. Cancer 2014, 110, 2321–2326. [Google Scholar] [CrossRef] [PubMed]
  18. Oates, L.; Cohen, M.; Braun, L.; Schembri, A.; Taskova, R. Reduction in urinary organophosphate pesticide metabolites in adults after a week-long organic diet. Environ. Res. 2014, 132, 105–111. [Google Scholar] [CrossRef] [PubMed]
  19. Torjusen, H.; Brantsæter, A.L.; Haugen, M.; Alexander, J.; Bakketeig, L.S.; Lieblein, G.; Stigum, H.; Næs, T.; Swartz, J.; Holmboe-Ottesen, G.; et al. Reduced risk of pre-eclampsia with organic vegetable consumption: Results from the prospective Norwegian Mother and Child Cohort Study. BMJ Open 2014, 4, e006143. [Google Scholar] [CrossRef] [PubMed] [Green Version]
  20. Curl, C.L.; Beresford, S.A.A.; Fenske, R.A.; Fitzpatrick, A.L.; Lu, C.; Nettleton, J.A.; Kaufman, J.D. Estimating pesticide exposure from dietary intake and organic food choices: The Multi-Ethnic Study of Atherosclerosis (MESA). Environ. Health Perspect. 2015, 123, 475–483. [Google Scholar] [CrossRef] [PubMed]
  21. The World of Organic Agriculture. Available online: https://www.fibl.org/fileadmin/documents/shop/1663-organic-world-2015.pdf (accessed on 19 June 2015).
  22. La Bio Poursuit Son Développement et Accroît Son Rayonnement Aupres Des Francais. Available online: http://www.agencebio.org/sites/default/files/upload/dp_conf_de_presse_18_02_2015_val.pdf (accessed on 19 February 2015).
  23. OrganicDataNetwork—Organic Crops: Area and Production Data for Selected Crops. Available online: http://www.organicdatanetwork.net/odn-statistics/odn-statistics-data/odn-statistics-data-crops.html?L=0 (accessed on 15 September 2015).
  24. Agence Bio La Bio en France: De la Production à la Consommation. Available online: http://www.agencebio.org/sites/default/files/upload/documents/4_Chiffres/BrochureCC/CC2013_chap4_France.pdf (accessed on 14 May 2015).
  25. Kesse-Guyot, E.; Péneau, S.; Méjean, C.; Szabo de Edelenyi, F.; Galan, P.; Hercberg, S.; Lairon, D. Profiles of organic food consumers in a large sample of French adults: Results from the Nutrinet-santé cohort study. PLoS ONE 2013, 8, e76998. [Google Scholar] [CrossRef] [PubMed]
  26. Torjusen, H.; Lieblein, G.; Naes, T.; Haugen, M.; Meltzer, H.M.; Brantsaeter, A.L. Food patterns and dietary quality associated with organic food consumption during pregnancy; data from a large cohort of pregnant women in Norway. BMC Public Health 2012, 12, 612. [Google Scholar] [CrossRef] [PubMed]
  27. Petersen, S.B.; Rasmussen, M.A.; Strøm, M.; Halldorsson, T.I.; Olsen, S.F. Sociodemographic characteristics and food habits of organic consumers—A study from the Danish National Birth Cohort. Public Health Nutr. 2013, 16, 1810–1819. [Google Scholar] [CrossRef] [PubMed]
  28. Eisinger-Watzl, M.; Wittig, F.; Heuer, T.; Hoffmann, I. Customers purchasing organic food—Do they live healthier? Results of the German national nutrition survey II. Eur. J. Nutr. Food Saf. 2015, 5, 59–71. [Google Scholar] [CrossRef]
  29. Oates, L.; Cohen, M.; Braun, L. Characteristics and consumption patterns of Australian organic consumers. J. Sci. Food Agric. 2012, 92, 2782–2787. [Google Scholar] [CrossRef] [PubMed]
  30. Lockie, S.; Lyons, K.; Lawrence, G.; Grice, J. Choosing organics: A path analysis of factors underlying the selection of organic food among Australian consumers. Appetite 2004, 43, 135–146. [Google Scholar] [CrossRef] [PubMed]
  31. Olivas, R.; Bernabéu, R. Men’s and women’s attitudes toward organic food consumption. A Spanish case study. Span. J. Agric. Res. 2012, 10, 281–291. [Google Scholar] [CrossRef]
  32. Hercberg, S.; Castetbon, K.; Czernichow, S.; Malon, A.; Mejean, C.; Kesse, E.; Touvier, M.; Galan, P. The Nutrinet-Santé Study: A web-based prospective study on the relationship between nutrition and health and determinants of dietary patterns and nutritional status. BMC Public Health 2010, 10, 242. [Google Scholar] [CrossRef] [PubMed] [Green Version]
  33. Touvier, M.; Kesse-Guyot, E.; Méjean, C.; Pollet, C.; Malon, A.; Castetbon, K.; Hercberg, S. Comparison between an interactive web-based self-administered 24 h dietary record and an interview by a dietitian for large-scale epidemiological studies. Br. J. Nutr. 2011, 105, 1055–1064. [Google Scholar] [CrossRef] [PubMed]
  34. Touvier, M.; Méjean, C.; Kesse-Guyot, E.; Pollet, C.; Malon, A.; Castetbon, K.; Hercberg, S. Comparison between web-based and paper versions of a self-administered anthropometric questionnaire. Eur. J. Epidemiol. 2010, 25, 287–296. [Google Scholar] [CrossRef] [PubMed] [Green Version]
  35. Hagströmer, M.; Oja, P.; Sjöström, M. The International Physical Activity Questionnaire (IPAQ): A study of concurrent and construct validity. Public Health Nutr. 2006, 9, 755–762. [Google Scholar] [CrossRef] [PubMed]
  36. INSEE (Institut National de la Statistique et des Etudes Economiques) Website. Available online: http://www.insee.fr/en/methodes/ (accessed on 23 February 2015).
  37. Le Moullec, N.; Deheeger, M.; Preziosi, P.; Monteiro, P.; Valeix, P.; Rolland-Cachera, M.-F.; de Courcy, P.G.; Christides, J.-P.; Cherouvrier, F.; Galan, P.; et al. Validation du manuel-photos utilisé pour l’enquête alimentaire de l’étude SU.VI.MAX. Cah. Nutr. Diététique 1996, 31, 158–164. [Google Scholar]
  38. Kesse-Guyot, E.; Castetbon, K.; Touvier, M.; Hercberg, S.; Galan, P. Relative validity and reproducibility of a food frequency questionnaire designed for French adults. Ann. Nutr. Metab. 2010, 57, 153–162. [Google Scholar] [CrossRef] [PubMed]
  39. Rubinstein, R.Y.; Kroese, D.P. Simulation and the Monte Carlo Method, Student Solutions Manual; John Wiley & Sons: New York, NY, USA, 2011. [Google Scholar]
  40. Schofield, W.N. Predicting basal metabolic rate, new standards and review of previous work. Hum. Nutr. Clin. Nutr. 1985, 39, 5–41. [Google Scholar] [PubMed]
  41. INSEE (Institut National de la Statistique et des Etudes Economiques) French National Census Data. Available online: http://www.insee.fr/fr/ppp/bases-de-donnees/recensement/populations-legales/default.asp?annee=2009 (accessed on 6 June 2013).
  42. Isenhour, C.; Ardenfors, M. Gender and sustainable consumption: Policy implications. Int. J. Innov. Sustain. Dev. 2009, 4, 135–149. [Google Scholar] [CrossRef]
  43. Schifferstein, H.N.J.; Oude Ophuis, P.A.M. Health-related determinants of organic food consumption in The Netherlands. Food Qual. Prefer. 1998, 9, 119–133. [Google Scholar] [CrossRef]
  44. Eating “Green”: Motivations behind organic food consumption in Australia. Available online: http://onlinelibrary.wiley.com.gate2.inist.fr/doi/10.1111/1467–9523.00200/abstract (accessed on 15 September 2015).
  45. Torjusen, H.; Brantsæter, A.L.; Haugen, M.; Lieblein, G.; Stigum, H.; Roos, G.; Holmboe-Ottesen, G.; Meltzer, H.M. Characteristics associated with organic food consumption during pregnancy; data from a large cohort of pregnant women in Norway. BMC Public Health 2010, 10, 775. [Google Scholar] [CrossRef] [PubMed]
  46. Pearson, D.; Henryks, J.; Jones, H. Organic food: What we know (and do not know) about consumers. Renew. Agric. Food Syst. 2011, 26, 171–177. [Google Scholar] [CrossRef]
  47. Observatoire Viandes BIO 2014: Une Dynamique Toujours Positive (Interbev). Available online: http://www.revenuagricole.fr/focus-technique/conduite-et-gestion-du-troupeau/89-focus-marches/eleveur-viande/eleveur-viande-memos-debouches-filiere/14977-observatoire-viandes-bio-2014-une-dynamique-toujours-positive-interbev (accessed on 7 April 2015).
  48. Centre National Interprofessionnel de l’Economie Laitière Rapport annuel 2013–2014. Available online: http://infos.cniel.com/uploads/tx_hpoindexbdd/4p_bio_2014__2_.pdf (accessed on 7 April 2015).
  49. Andreeva, V.A.; Salanave, B.; Castetbon, K.; Deschamps, V.; Vernay, M.; Kesse-Guyot, E.; Hercberg, S. Comparison of the sociodemographic characteristics of the large NutriNet-Santé e-cohort with French Census data: The issue of volunteer bias revisited. J. Epidemiol. Community Health 2015, 69, 893–898. [Google Scholar] [CrossRef] [PubMed]
  50. Hebert, J.R.; Hurley, T.G.; Peterson, K.E.; Resnicow, K.; Thompson, F.E.; Yaroch, A.L.; Ehlers, M.; Midthune, D.; Williams, G.C.; Greene, G.W.; et al. Social desirability trait influences on self-reported dietary measures among diverse participants in a multicenter multiple risk factor trial. J. Nutr. 2008, 138, 226S–234S. [Google Scholar] [PubMed]

