Vitamin D Status in Malaysian Men and Its Associated Factors


Abstract
:
1. Introduction
2. Experimental Section
2.1. Subjects
2.2. Research Ethics
2.3. Variables Collected
2.4. Statistical Analysis
3. Results

| Ethnicity | Chinese (n = 233) | Malays (n = 150) | p-value | ||
|---|---|---|---|---|---|
| Variable | Mean | SD | Mean | SD | |
| Age (years) | 46.6 | 13.5 | 39.4 | 17.0 | <0.001 |
| Height (cm) | 168.5 | 6.4 | 166.4 | 6.6 | 0.002 |
| Body Fat Percentage (%) | 21.9 | 5.7 | 22.9 | 7.0 | 0.130 |
| Waist Circumference (cm) | 87.5 | 8.7 | 89.0 | 12.3 | 0.206 |
| Calcaneal Speed of Sound (m/s) | 1516.5 | 26.7 | 1527.0 | 28.2 | 0.108 a |
| Serum Total Calcium (mmol/L) | 2.2 | 0.1 | 2.3 | 0.1 | <0.001 |
| Serum Inorganic Phosphate (mmol/L) | 1.1 | 0.1 | 1.2 | 0.1 | <0.001 |
| Variable | Median | IQR | Median | IQR | p-value |
| Body Weight (kg) | 68.1 | 14.7 | 67.9 | 21.0 | 0.298 |
| Body Mass Index (kg/m2) | 24.0 | 5.1 | 24.8 | 7.7 | 0.013 |
| Serum 25(OH)D Level (nmol/L) | 60.2 | 13.9 | 54.6 | 16.0 | <0.001 |
| Serum PTH Level | 43.4 | 22.0 | 42.8 | 20.2 | 0.609 b |
| IPAQ Score (MET-min/week) | 1099.0 | 2055.0 | 1,854.0 | 3,711.3 | <0.001 b |
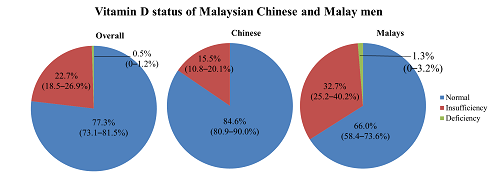
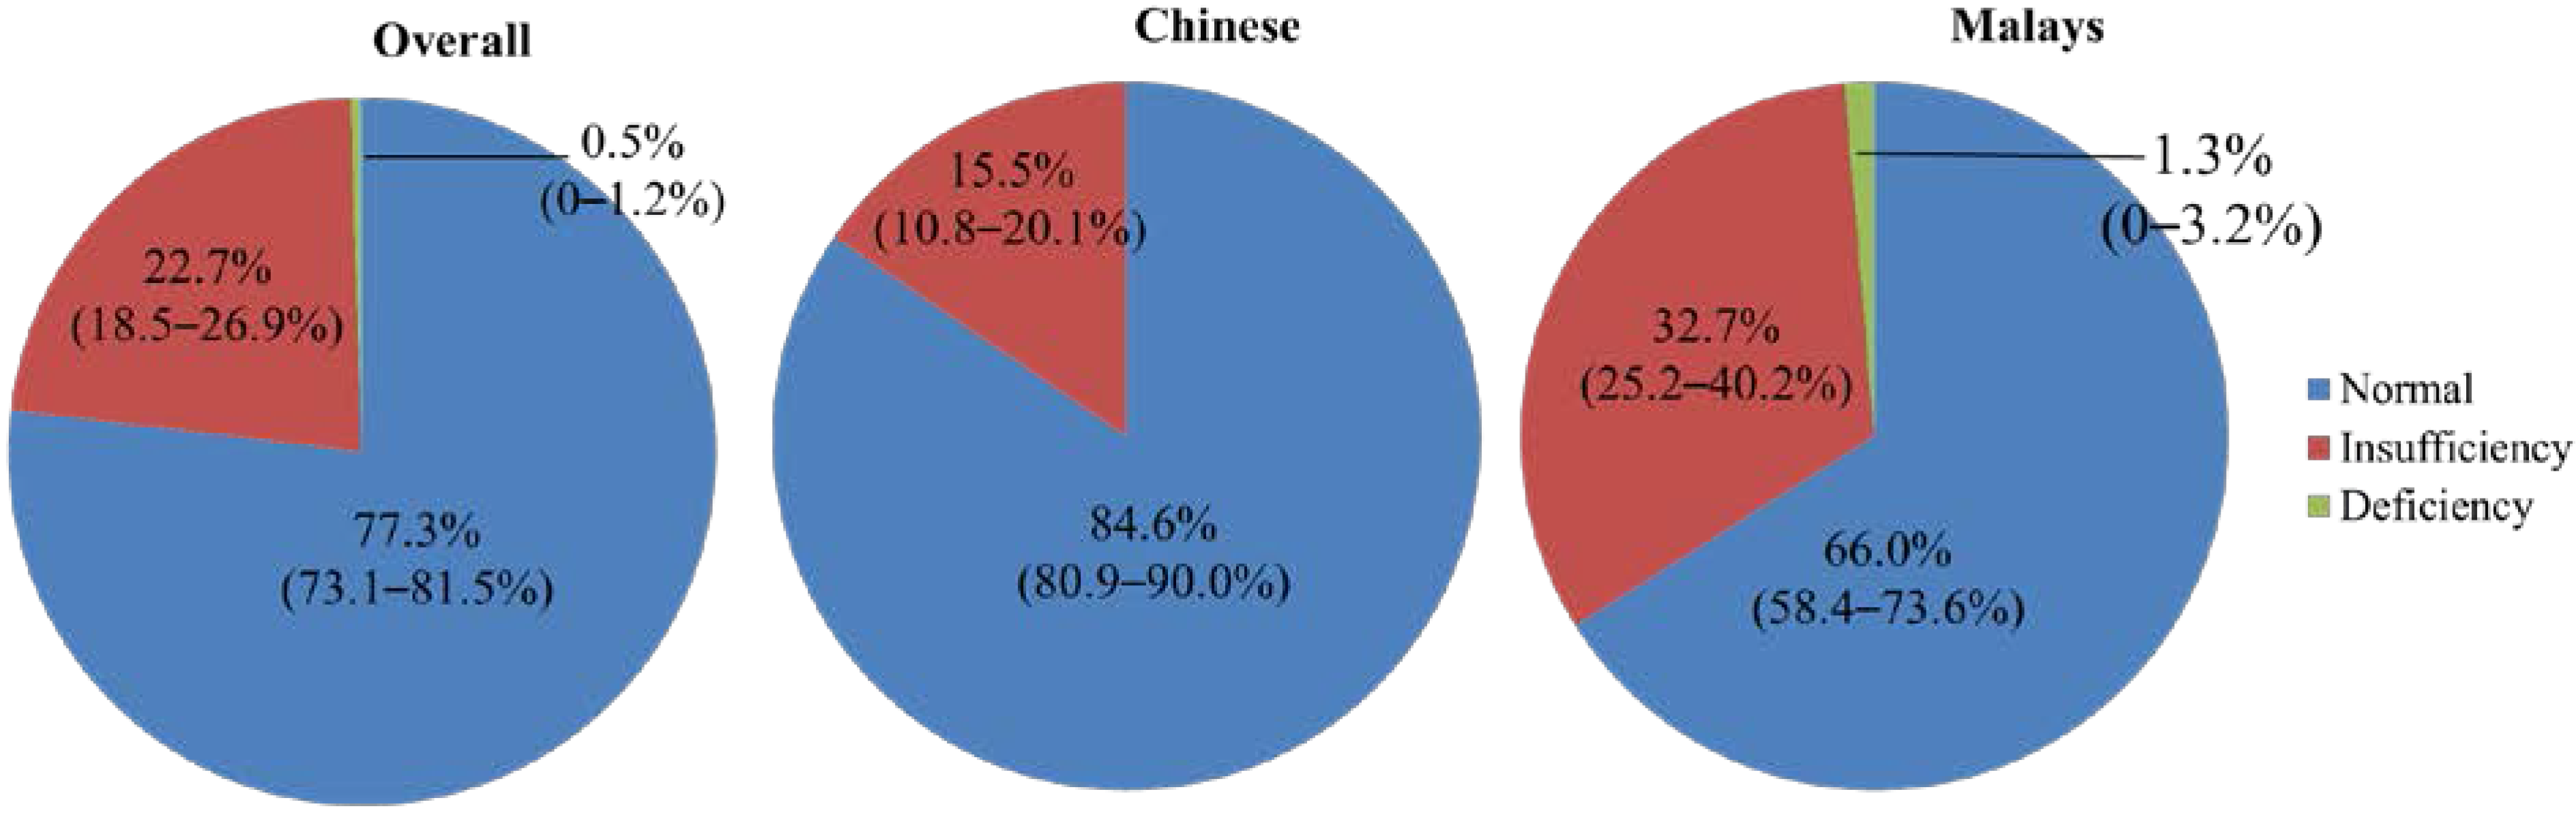
| Vitamin D Status | n | % (95% CI) | n | % (95% CI) | p-value |
| Deficiency | 0/2 | 0 | 2/2 | 100 | n/a |
| Insufficiency | 36/85 | 42.4 (31.9–52.9) | 49/85 | 57.7 (47.2–68.2) | 0.159 |
| Normal | 197/296 | 66.6 (61.2–72.0) | 99/296 | 33.5 (28.1–38.9) | <0.001 c |
| Vitamin D status | Subjects with 25(OH)D Level < 50 nmol (n = 87) | Subjects with 25(OH)D Level ≥ 50 nmol (n = 296) | p-value | ||
|---|---|---|---|---|---|
| Variable | Mean | SD | Mean | SD | |
| Age (years) | 40.0 | 16.2 | 44.9 | 15.0 | 0.009 |
| Height (cm) | 167.2 | 6.2 | 167.8 | 6.6 | 0.519 |
| Percentage of Body Fat (%) | 23.8 | 6.4 | 21.8 | 6.1 | 0.011 |
| Waist Circumference (cm) | 90.2 | 10.6 | 87.5 | 10.1 | 0.027 |
| Calcaneal Speed of Sound (m/s) | 1522.0 | 29.2 | 1520.2 | 27.3 | 0.292 a |
| Serum Total Calcium (mmol/L) | 2.3 | 0.1 | 2.3 | 0.1 | 0.120 |
| Serum Inorganic Phosphate (mmol/L) | 1.1 | 0.1 | 1.1 | 0.1 | 0.037 |
| Variable | Median | IQR | Median | IQR | p-value |
| Body Weight (kg) | 69.9 | 20.0 | 67.0 | 16.4 | 0.012 |
| Body Mass Index (kg/m2) | 25.6 | 6.6 | 24.0 | 5.3 | 0.002 |
| Serum 25(OH)D Level (nmol/L) | 44.3 | 6.8 | 61.6 | 11.8 | <0.001 |
| Serum PTH Level | 43.3 | 26.5 | 43.0 | 20.7 | 0.279 b |
| IPAQ Score (MET-min/week) | 1580.0 | 2284.0 | 1386.0 | 2730.0 | 0.465 b |
| Age Group (Years) | N | Serum 25(OH)D Level (nmol/L) | Vitamin D Status (%) | |||
|---|---|---|---|---|---|---|
| Mean | SD | Deficiency | Insufficiency | Sufficiency | ||
| 20–29 | 91 | 54.7 | 13.1 | 1.1 | 33.0 | 65.9 |
| 30–39 | 58 | 58.3 | 12.0 | 1.7 | 22.4 | 75.9 |
| 40–49 | 78 | 60.3 a | 11.1 | 0.0 | 15.4 | 84.6 |
| 50–59 | 93 | 60.4 a | 12.1 | 0.0 | 20.4 | 79.6 |
| ≥60 | 63 | 60.2 a | 11.8 | 0.0 | 17.5 | 82.5 |
| Overall | 383 | 58.7 | 12.2 | 0.5 | 22.2 | 77.3 |
| Variables | Standardized Regression | p-value |
|---|---|---|
| Ethnicity (Chinese vs. Malays (reference)) | 0.205 | <0.001 |
| Age | 0.150 | 0.003 |
| BMI | −0.136 | 0.007 |
| Low PA vs. Moderate PA | −0.090 | 0.142 |
| Low PA vs. High PA | 0.131 | 0.034 |
| Variable | Standardized Regression | p-value |
|---|---|---|
| Serum Calcium | −0.018 | 0.737 |
| Serum Inorganic Phosphate | 0.009 | 0.861 |
| PTH Q1 vs. Q2 | −0.063 | 0.300 |
| PTH Q1 vs. Q3 | −0.068 | 0.269 |
| PTH Q1 vs. Q4 | −0.139 | 0.025 |

| Variables | Standardized Regression | p-value |
|---|---|---|
| PTH Q1 vs. Q2 | −0.083 | 0.152 |
| PTH Q1 vs. Q3 | −0.024 | 0.687 |
| PTH Q1 vs. Q4 | −0.022 | 0.706 |
| 25(OH)D level | 0.067 | 0.171 |
| Serum Total Calcium (mmol/L) | 0.020 | 0.705 |
| Serum Inorganic Phosphate (mmol/L) | −0.001 | 0.979 |
4. Discussion
5. Conclusions
Acknowledgments
Author Contributions
Conflicts of Interest
References
- Lehmann, B.; Meurer, M. Vitamin D metabolism. Dermatol. Ther. 2010, 23, 2–12. [Google Scholar] [CrossRef] [PubMed]
- Christakos, S.; Ajibade, D.V.; Dhawan, P.; Fechner, A.J.; Mady, L.J. Vitamin D: Metabolism. Endocrinol. Metab. Clin. N. Am. 2012, 38, 1–11. [Google Scholar]
- Alshahrani, F.; Aljohani, N. Vitamin D: Deficiency, sufficiency and toxicity. Nutrients 2013, 5, 3605–3616. [Google Scholar] [CrossRef] [PubMed]
- Thacher, T.D.; Clarke, B.L. Vitamin D insufficiency. Mayo Clin. Proc. 2011, 86, 50–60. [Google Scholar] [CrossRef] [PubMed]
- Holick, M.F.; Binkley, N.C.; Bischoff-Ferrari, H.A.; Gordon, C.M.; Hanley, D.A.; Heaney, R.P.; Murad, M.H.; Weaver, C.M. Evaluation, treatment, and prevention of vitamin D deficiency: An endocrine society clinical practice guideline. J. Clin. Endocrinol. Metab. 2011, 96, 1911–1930. [Google Scholar] [CrossRef]
- Institute of Medicine. Dietary Reference Intakes for Calcium and Vitamin D; Institute of Medicine: Washington, DC, USA, 2011. [Google Scholar]
- World Health Organization. Scientific Group on the Prevention and Management of Osteoporosis. In Prevention and Management of Osteoporosis: Report of a Who Scientific Group; World Health Organization: Geneva, Switzerland, 2003. [Google Scholar]
- Huotari, A.; Herzig, K.H. Vitamin D and living in northern latitudes—An endemic risk area for Vitamin D deficiency. Int. J. Circumpolar Health 2008, 67, 164–178. [Google Scholar] [CrossRef] [PubMed]
- Abiaka, C.; Delghandi, M.; Kaur, M.; Al-Saleh, M. Vitamin D status and anthropometric indices of an Omani study population. Sultan Qaboos Univ. Med. J. 2013, 13, 224–231. [Google Scholar] [CrossRef] [PubMed]
- Ardawi, M.S.M.; Sibiany, A.M.; Bakhsh, T.M.; Qari, M.H.; Maimani, A.A. High prevalence of Vitamin D deficiency among healthy saudi arabian men: Relationship to bone mineral density, parathyroid hormone, bone turnover markers, and lifestyle factors. Osteoporos. Int. 2012, 23, 675–686. [Google Scholar] [CrossRef] [PubMed]
- Rahnavard, Z.; Eybpoosh, S.; Homami, M.R.; Meybodi, H.A.; Azemati, B.; Heshmat, R.; Larijani, B. Vitamin D deficiency in healthy male population: Results of the Iranian multi-center osteoporosis study. Iran. J. Public Health 2010, 39, 45–52. [Google Scholar] [PubMed]
- Green, T.J.; Skeaff, C.M.; Rockell, J.E.; Venn, B.J.; Lambert, A.; Todd, J.; Khor, G.L.; Loh, S.P.; Muslimatun, S.; Agustina, R.; et al. Vitamin D status and its association with parathyroid hormone concentrations in women of child-bearing age living in Jakarta and Kuala Lumpur. Eur. J. Clin. Nutr. 2008, 62, 373–378. [Google Scholar] [CrossRef]
- Moy, F.M.; Bulgiba, A. High prevalence of Vitamin D insufficiency and its association with obesity and metabolic syndrome among Malay adults in Kuala Lumpur, Malaysia. BMC Public Health 2011, 11. [Google Scholar] [CrossRef] [PubMed]
- Ho-Pham, L.T.; Nguyen, N.D.; Lai, T.Q.; Eisman, J.A.; Nguyen, T.V. Vitamin D status and parathyroid hormone in a urban population in Vietnam. Osteoporos. Int. 2011, 22, 241–248. [Google Scholar] [CrossRef] [PubMed]
- Khor, G.L.; Chee, W.S.; Shariff, Z.M.; Poh, B.K.; Arumugam, M.; Rahman, J.A.; Theobald, H.E. High prevalence of Vitamin D insufficiency and its association with bmi-for-age among primary school children in Kuala Lumpur, Malaysia. BMC Public Health 2011, 11. [Google Scholar] [CrossRef] [PubMed]
- Rahman, S.; Chee, W.; Yassin, Z.; Chan, S. Vitamin D status among postmenopausal Malaysian women. Asia Pac. J. Clin. Nutr. 2004, 13, 255–260. [Google Scholar]
- Forrest, K.Y.; Stuhldreher, W.L. Prevalence and correlates of Vitamin D deficiency in US adults. Nutr. Res. 2011, 31, 48–54. [Google Scholar] [CrossRef] [PubMed]
- Hannan, M.T.; Litman, H.J.; Araujo, A.B.; McLennan, C.E.; McLean, R.R.; McKinlay, J.B.; Chen, T.C.; Holick, M.F. Serum 25-hydroxyVitamin D and bone mineral density in a racially and ethnically diverse group of men. J. Clin. Endocrinol. Metab. 2008, 93, 40–46. [Google Scholar] [CrossRef] [PubMed]
- Chin, K.-Y.; Ima-Nirwana, S.; Mohamed, I.N.; Hanapi Johari, M.; Ahmad, F.; Mohamed Ramli, E.S.; Wan Ngah, W.Z. Insulin-like growth factor-1 is a mediator of age-related decline of bone health status in men. Aging Male 2014, 17, 102–106. [Google Scholar] [CrossRef] [PubMed]
- Chin, K.; Ima-Nirwana, S.; Mohamed, I.; Aminuddin, A.; Johari, M.; Ngah, W. Thyroid-stimulating hormone is significantly associated with bone health status in men. Int. J. Med. Sci. 2013, 10, 857–863. [Google Scholar] [CrossRef] [PubMed]
- Chin, K.-Y.; Soelaiman, I.-N.; Mohamed, I.N.; Ibrahim, S.; Wan Ngah, W.Z. The effects of age, physical activity level, and body anthropometry on calcaneal speed of sound value in men. Arch. Osteoporos. 2012, 7, 135–145. [Google Scholar] [CrossRef] [PubMed]
- Rosen, C.J.; Abrams, S.A.; Aloia, J.F.; Brannon, P.M.; Clinton, S.K.; Durazo-Arvizu, R.A.; Gallagher, J.C.; Gallo, R.L.; Jones, G.; Kovacs, C.S.; et al. Iom committee members respond to endocrine society Vitamin D guideline. J. Clin. Endocrinol. Metab. 2012, 97, 1146–1152. [Google Scholar] [CrossRef]
- Heaney, R.P.; Holick, M.F. Why the IOM recommendations for Vitamin D are deficient. J. Bone Miner. Res. Off. J. Am. Soc. Bone Miner. Res. 2011, 26, 455–457. [Google Scholar] [CrossRef]
- Hawkins, R. Total 25-OH Vitamin D concentrations in Chinese, Malays and Indians. Ann. Lab. Med. 2013, 33, 156–158. [Google Scholar] [CrossRef] [PubMed]
- Armas, L.A.G.; Dowell, S.; Akhter, M.; Duthuluru, S.; Huerter, C.; Hollis, B.W.; Lund, R.; Heaney, R.P. Ultraviolet-B radiation increases serum 25-hydroxy Vitamin D levels: The effect of UVB dose and skin color. J. Am. Acad. Dermatol. 2007, 57, 588–593. [Google Scholar] [CrossRef] [PubMed]
- Libon, F.; Cavalier, E.; Nikkels, A.F. Skin color is relevant to Vitamin D synthesis. Dermatology 2013, 227, 250–254. [Google Scholar]
- Brenner, M.; Hearing, V.J. The protective role of melanin against UV damage in human skin. Photochem. Photobiol. 2008, 84, 539–549. [Google Scholar]
- Rucker, D.; Allan, J.A.; Fick, G.H.; Hanley, D.A. Vitamin D insufficiency in a population of healthy western Canadians. CMAJ 2002, 166, 1517–1524. [Google Scholar] [PubMed]
- MacLaughlin, J.; Holick, M.F. Aging decreases the capacity of human skin to produce Vitamin D3. J. Clin. Investig. 1985, 76, 1536–1538. [Google Scholar] [CrossRef] [PubMed]
- Riverin, B.; Dewailly, E.; Côté, S.; Johnson-Down, L.; Morin, S.; Dodin, S. Prevalence of Vitamin D insufficiency and associated factors among Canadian Cree: A cross-sectional study. Can. J. Public Health 2013, 104, 291–297. [Google Scholar]
- Choi, H.S.; Oh, H.J.; Choi, H.; Choi, W.H.; Kim, J.G.; Kim, K.M.; Kim, K.J.; Rhee, Y.; Lim, S.K. Vitamin D insufficiency in Korea—A greater threat to younger generation: The Korea national health and nutrition examination survey (KNHANES) 2008. J. Clin. Endocrinol. Metab. 2011, 96, 643–651. [Google Scholar] [CrossRef] [PubMed]
- Hirani, V.; Cumming, R.G.; Blyth, F.M.; Naganathan, V.; Le Couteur, D.G.; Handelsman, D.J.; Waite, L.M.; Seibel, M.J. Vitamin D status among older community dwelling men living in a sunny country and associations with lifestyle factors: The concord health and ageing in men project, Sydney, Australia. J. Nutr. Health Aging 2013, 17, 587–593. [Google Scholar] [CrossRef] [PubMed]
- Jääskeläinen, T.; Knekt, P.; Marniemi, J.; Sares-Jäske, L.; Männistö, S.; Heliövaara, M.; Järvinen, R. Vitamin D status is associated with sociodemographic factors, lifestyle and metabolic health. Eur. J. Nutr. 2013, 52, 513–525. [Google Scholar] [CrossRef] [PubMed]
- Wortsman, J.; Matsuoka, L.Y.; Chen, T.C.; Lu, Z.; Holick, M.F. Decreased bioavailability of Vitamin D in obesity. Am. J. Clin. Nutr. 2000, 72, 690–693. [Google Scholar] [PubMed]
- Wat, W.Z.M.; Leung, J.Y.Y.; Tam, S.; Kung, A.W.C. Prevalence and impact of Vitamin D insufficiency in southern Chinese adults. Ann. Nutr. Metab. 2007, 51, 59–64. [Google Scholar] [CrossRef] [PubMed]
- De Rui, M.; Toffanello, E.D.; Veronese, N.; Zambon, S.; Bolzetta, F.; Sartori, L.; Musacchio, E.; Corti, M.C.; Baggio, G.; Crepaldi, G.; et al. Vitamin D deficiency and leisure time activities in the elderly: Are all pastimes the same? PLoS One 2014, 9. [Google Scholar] [CrossRef]
- Aloia, J.F.; Talwar, S.A.; Pollack, S.; Feuerman, M.; Yeh, J.K. Optimal Vitamin D status and serum parathyroid hormone concentrations in African American women. Am. J. Clin. Nutr. 2006, 84, 602–609. [Google Scholar] [PubMed]
- Need, A.G.; Horowitz, M.; Morris, H.A.; Nordin, B.C. Vitamin D status: Effects on parathyroid hormone and 1,25-dihydroxy Vitamin D in postmenopausal women. Am. J. Clin. Nutr. 2000, 71, 1577–1581. [Google Scholar] [PubMed]
- Kauppi, M.; Impivaara, O.; Mäki, J.; Heliövaara, M.; Marniemi, J.; Montonen, J.; Jula, A. Vitamin D status and common risk factors for bone fragility as determinants of quantitative ultrasound variables in a nationally representative population sample. Bone 2009, 45, 119–124. [Google Scholar] [CrossRef] [PubMed]
- Saquib, N.; von Muhlen, D.; Garland, C.F.; Barrett-Connor, E. Serum 25-hydroxyVitamin D, parathyroid hormone, and bone mineral density in men: The rancho bernardo study. Osteoporos. Int. 2006, 17, 1734–1741. [Google Scholar] [CrossRef] [PubMed]
- Chin, K.-Y.; Soelaiman, I.-N.; Mohamed, I.N.; Mohamed, N.; Shuid, A.N.; Muhammad, N.; Wan Ngah, W.Z. Discrepancy between the quantitative ultrasound value of Malaysian men and the manufacturer’s reference and the impact on classification of bone health status. J. Clin. Densitom. 2013, 16, 189–195. [Google Scholar] [CrossRef] [PubMed]
- Chin, K.-Y.; Soelaiman, I.-N.; Mohamed, I.N.; Ngah, W.Z.W. Serum testosterone, sex hormone-binding globulin and total calcium levels predict the calcaneal speed of sound in men. Clinics 2012, 67, 911–916. [Google Scholar] [CrossRef] [PubMed]
- Chin, K.-Y.; Soelaiman, I.-N.; Mohamed, I.N.; Shahar, S.; Teng, N.I.M.F.; Suhana Mohd Ramli, E.; Ahmad, F.; Aminuddin, A.; Wan Ngah, W.Z. Testosterone is associated with age-related changes in bone health status, muscle strength and body composition in men. Aging Male 2012, 15, 240–245. [Google Scholar] [CrossRef] [PubMed]
- Statistics Department of Malaysia. Population Distribution and Basic Demographic Characteristics; Statistics Department of Malaysia: Putrajaya, Malaysia, 2011.
- Moayyeri, A.; Adams, J.E.; Adler, R.A.; Krieg, M.A.; Hans, D.; Compston, J.; Lewiecki, E.M. Quantitative ultrasound of the heel and fracture risk assessment: An updated meta-analysis. Osteoporos. Int. 2012, 23, 143–153. [Google Scholar] [CrossRef] [PubMed]
- Chin, K.-Y.; Ima-Nirwana, S. Calcaneal quantitative ultrasound as a determinant of bone health status: What properties of bone does it reflect? Int. J. Med. Sci. 2013, 10. [Google Scholar] [CrossRef]
© 2014 by the authors; licensee MDPI, Basel, Switzerland. This article is an open access article distributed under the terms and conditions of the Creative Commons Attribution license (http://creativecommons.org/licenses/by/4.0/).
Share and Cite
Chin, K.-Y.; Ima-Nirwana, S.; Ibrahim, S.; Mohamed, I.N.; Wan Ngah, W.Z. Vitamin D Status in Malaysian Men and Its Associated Factors. Nutrients 2014, 6, 5419-5433. https://doi.org/10.3390/nu6125419
Chin K-Y, Ima-Nirwana S, Ibrahim S, Mohamed IN, Wan Ngah WZ. Vitamin D Status in Malaysian Men and Its Associated Factors. Nutrients. 2014; 6(12):5419-5433. https://doi.org/10.3390/nu6125419
Chicago/Turabian StyleChin, Kok-Yong, Soelaiman Ima-Nirwana, Suraya Ibrahim, Isa Naina Mohamed, and Wan Zurinah Wan Ngah. 2014. "Vitamin D Status in Malaysian Men and Its Associated Factors" Nutrients 6, no. 12: 5419-5433. https://doi.org/10.3390/nu6125419
APA StyleChin, K.-Y., Ima-Nirwana, S., Ibrahim, S., Mohamed, I. N., & Wan Ngah, W. Z. (2014). Vitamin D Status in Malaysian Men and Its Associated Factors. Nutrients, 6(12), 5419-5433. https://doi.org/10.3390/nu6125419