1. Introduction
Parkinson’s disease (PD) is estimated to impact over 11 million people worldwide, and the Global Burden of Disease analyses indicate it is among the fastest-growing neurological disorders globally [
1,
2]. In the United States alone, the economic burden was estimated to be
$51.9 million for the 1 million diagnosed individuals in 2017 [
3]. Despite extensive research efforts, no established therapies have been shown to slow, halt, or reverse disease progression [
4]. Contributing factors include heterogeneity in disease presentation, incomplete understanding of the underlying pathophysiology, and methodological challenges in trial design, including the limited availability of outcome measures that capture early-stage disease burden [
2].
Traditional PD severity scales, including clinician-rated motor assessments and stage-based classifications, rely heavily on observable motor features that emerge later in the disease course. The Movement Disorders Society- Unified Parkinson’s Disease Rating Scale (MDS-UPDRS) [
5] is the current gold standard in clinical trials [
6,
7,
8], yet currently employed instruments have demonstrated floor effects that limit sensitivity in early PD [
9]. Recent expert and stakeholder evaluations have further concluded that traditional clinical outcome assessments, including the MDS-UPDRS, are insufficiently sensitive to early clinical change and day-to-day symptom burden [
10]. Although psychometrically robust, the MDS-UPDRS does not provide a global subjective severity rating and may inadequately capture symptom domains that people with PD report as bothersome [
11,
12]. In concert with biological heterogeneity and incomplete understanding of disease mechanisms, reliance on motor-centric clinician-rated scales represents a methodological challenge that may constrain the detection of gradual, multisystem, and patient-perceived changes expected from many interventions, particularly in early disease.
Nutrition, dietary patterns, and nutraceutical interventions are widely used and actively studied, yet research on these exposures is limited by outcome measures that are often insensitive to gradual, patient-perceived change and poorly suited to remote longitudinal studies. This is particularly problematic for nutrition-based interventions, whose effects are predicted to be modest and cumulative. Regulatory agencies have therefore emphasized the use of validated patient–reported outcomes (PROs) [
13]. Establishing the validity and responsiveness of the PRO-PD instrument is a necessary step before longitudinal datasets can be meaningfully analyzed in relation to dietary and nutritional exposures, making this work directly relevant to the scope of
Nutrients.
The Patient–Reported Outcomes in Parkinson’s Disease (PRO-PD) scale was developed as a patient-centered, continuous outcome measure designed to quantify both motor and non-motor symptom severity without reliance on in-clinic assessments. It was designed to be sensitive early in disease, stable across daily fluctuations, and capable of detecting gradual change over time. The scale was constructed iteratively over several weeks of patient care, followed by a review of the existing literature and circulation among individuals with PD and Movement Disorders Specialists, with additional symptoms incorporated through successive rounds of feedback. To minimize respondent burden, simplicity was emphasized throughout development. Design features included the use of a consistently labeled slider bar (left = good, right = bad) and usability testing to ensure successful completion by a 10-year-old child (OA). Individuals are asked to report the average severity of symptoms over the preceding week, a design choice intended to reduce the influence of medication-related daily fluctuations that can confound snapshot assessments, although some difficulty with estimating averages is anticipated for certain individuals. The English version of the scale has been in use since 2013 [
14] and subsequently translated and formally validated in Swedish in 2022 [
15], and is being employed as an outcome measure in various clinical trials in Sweden, Australia, and the USA, ClinicalTrial ID: NCT05528302, NCT03152721, and NCT02194816, respectively.
Despite its increasing use as a remote patient–reported outcome measure, the psychometric properties of the English version of the PRO-PD scale have not been comprehensively evaluated. The primary objective of this study was therefore to assess the psychometric performance of PRO-PD, including (1) convergent validity with established clinician-rated and patient–reported PD instruments; (2) discriminative (known-groups) validity, defined as the ability to differentiate participants by disease severity and duration; and (3) responsiveness, assessed by examining whether longitudinal changes in PRO-PD correspond to patient-perceived change using anchor-based methods and clinically meaningful thresholds.
3. Results
Available demographic data on study participants is presented in
Table 1.
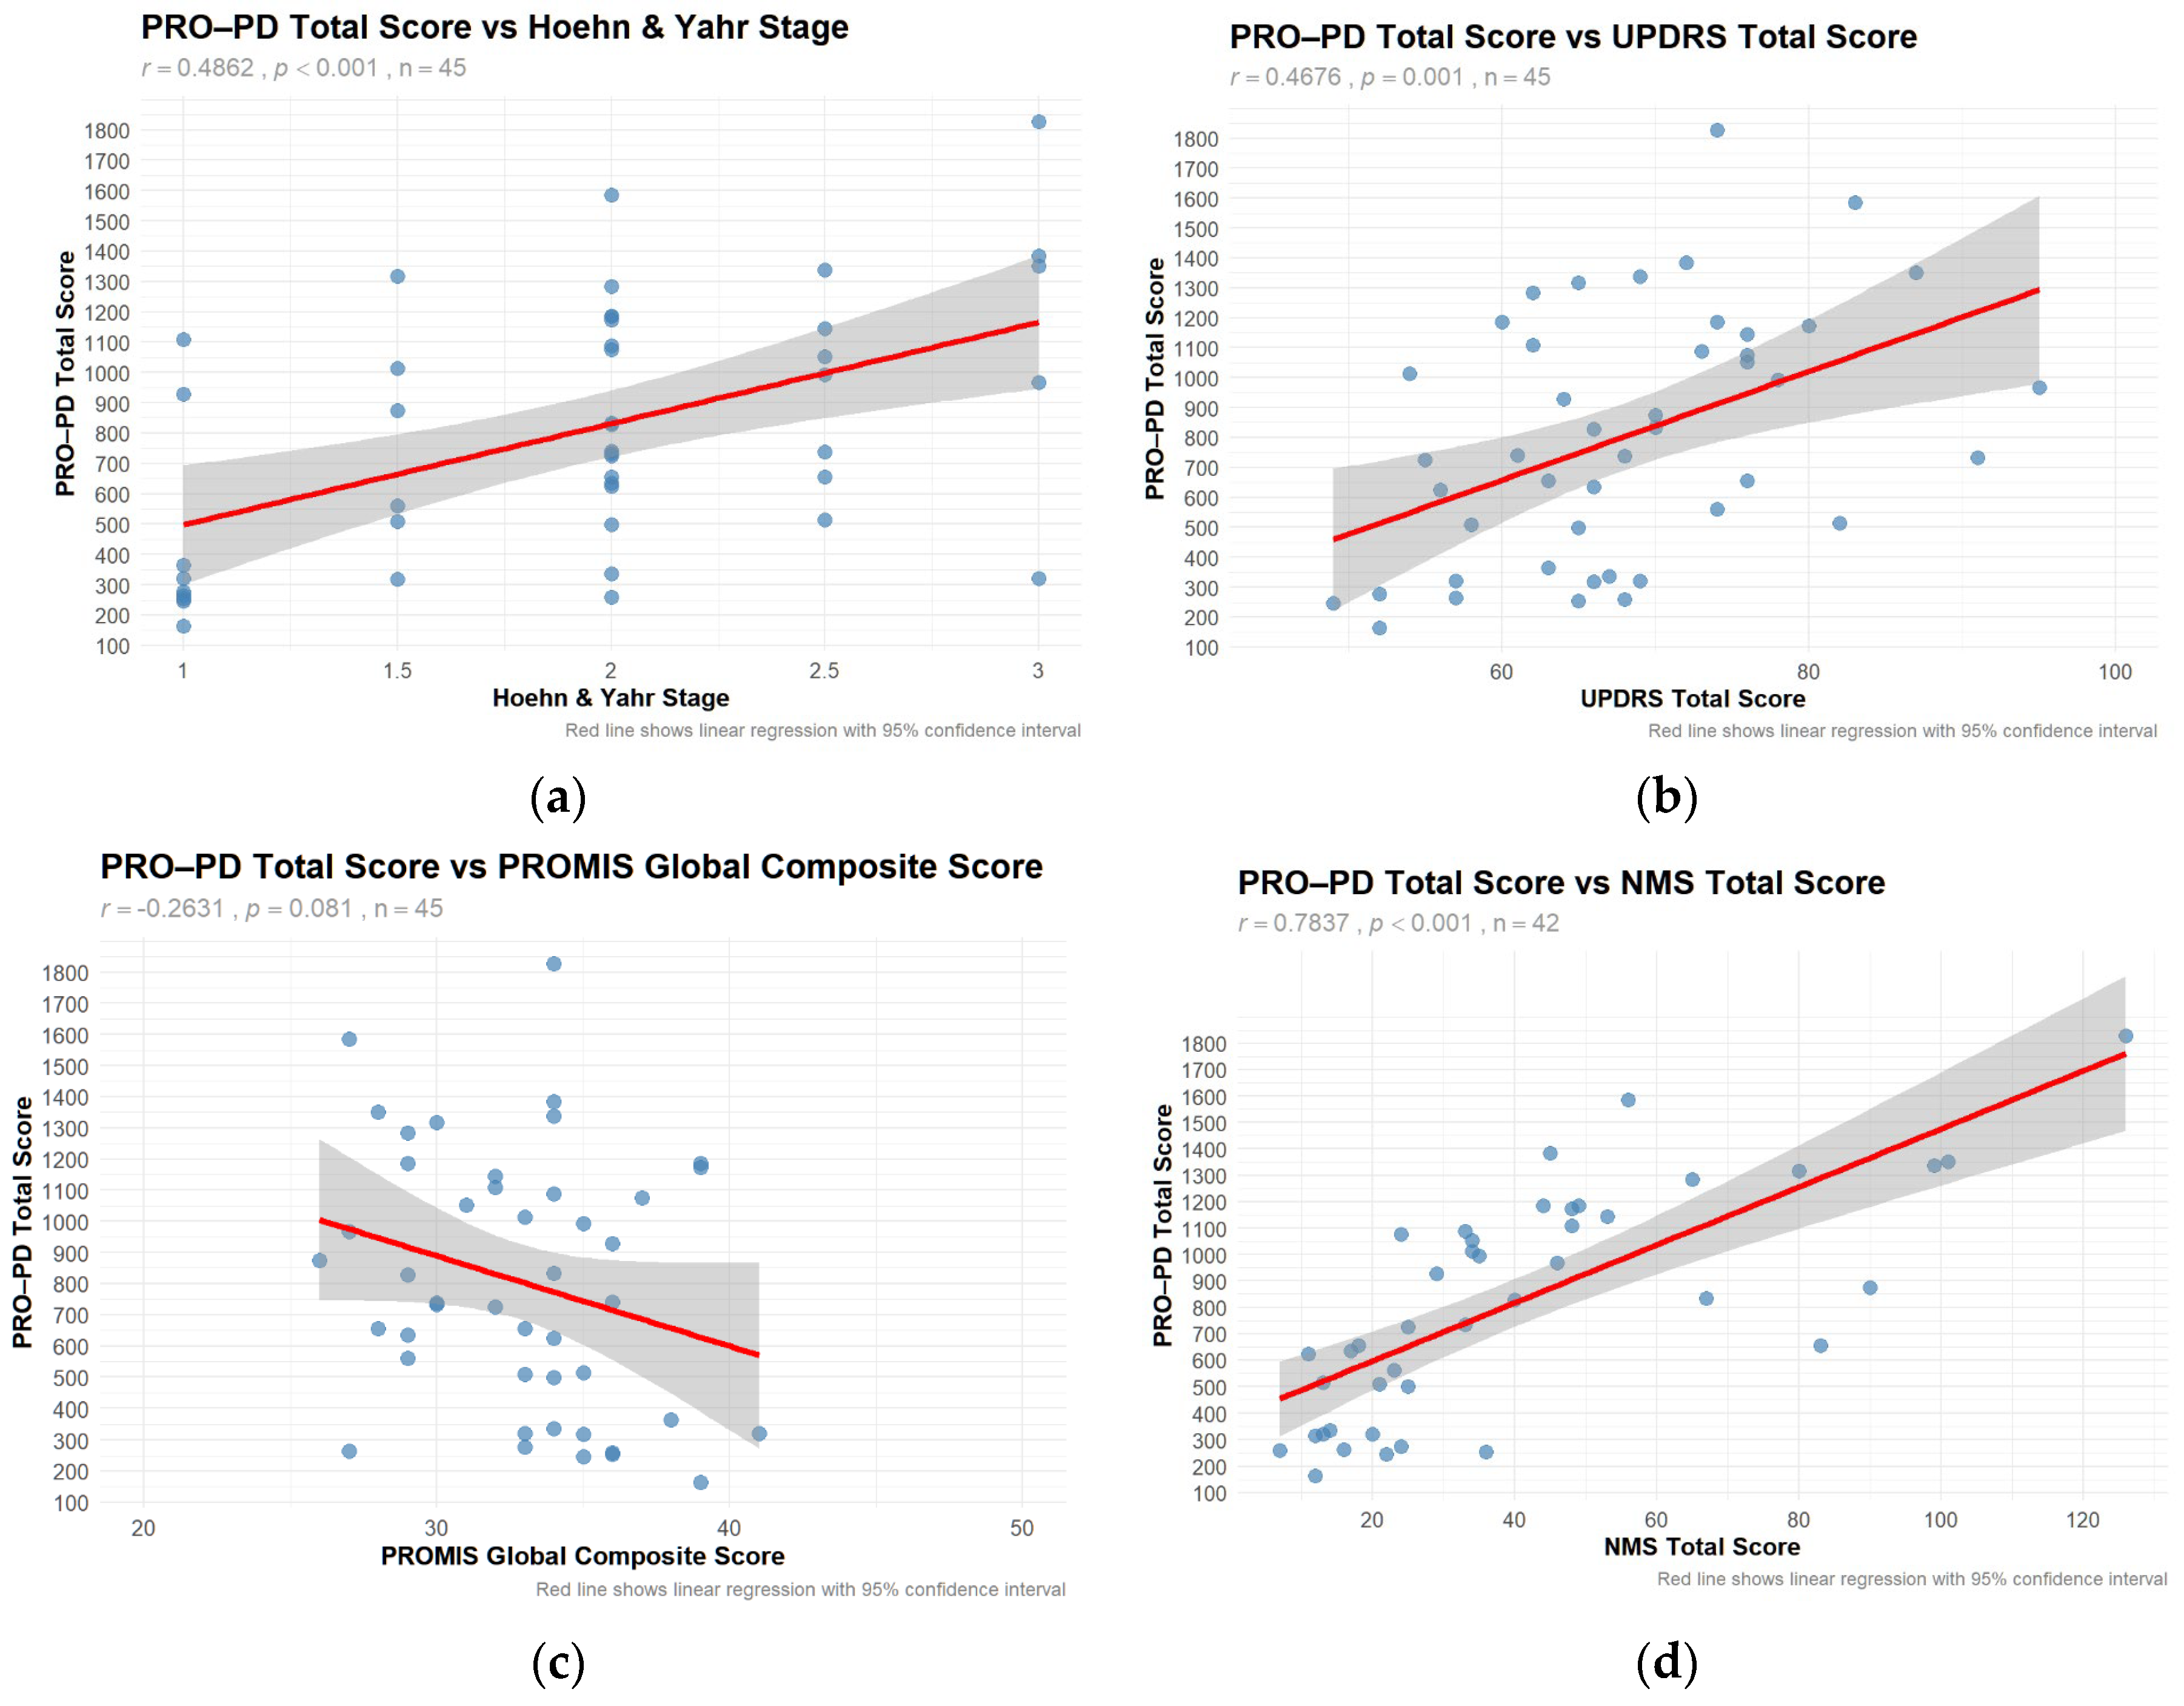
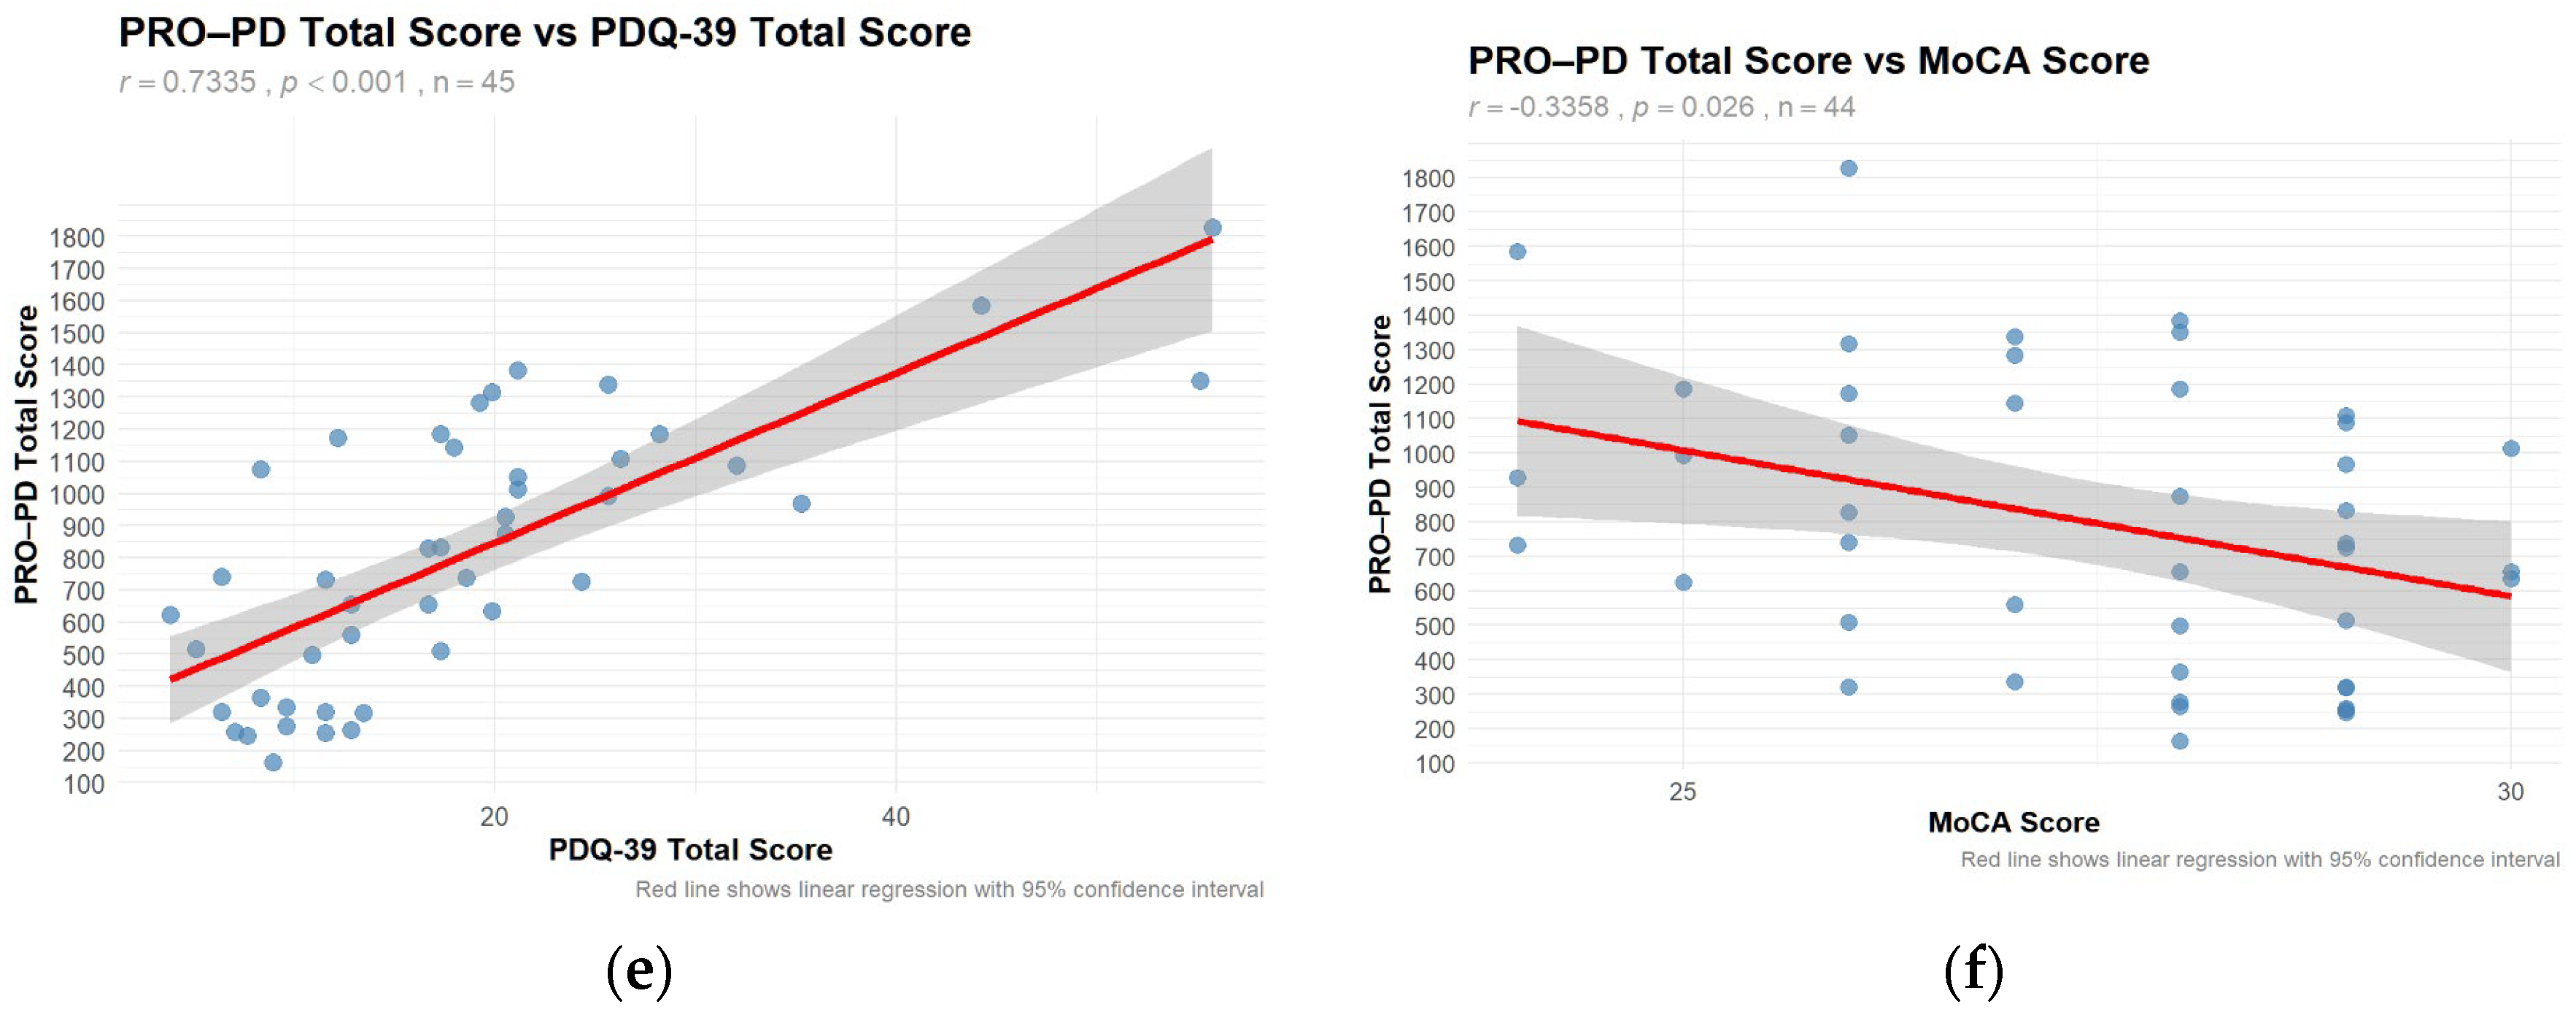
Using the PRO-PD scores that had a corresponding in-person clinical evaluation related to a PD research study (
n = 45), correlation coefficients between PRO-PD and historically used scales [
5,
13] were calculated (
Figure 1a–f). Not only did PRO-PD correlate with standard ‘motor’ assessments (HY: r = 0.4862,
p < 0.001; UPDRS: r = 0.4676,
p = 0.001) it was also correlated with quality of life (PROMIS: r = −0.2631,
p = 0.081; PDQ-39: r = 0.7335,
p < 0.001), non-motor symptoms (NMSS, r = 0.7837,
p < 0.001), and cognitive function (MoCA: r = −0.3358,
p = 0.026).
Descriptive statistics for each symptom and item-level psychometric characteristics for both datasets are presented in
Table 2. Across the large remote-monitoring cohort (
n = 2612), item distributions demonstrated minimal ceiling effects and generally acceptable skewness, with floor effects exceeding 15% primarily for hallucinations/delusions (37.1%) and nausea (30.6%). Corrected item–total correlations were ≥0.30 for most items, with lower correlations observed for tremor and sense of smell. This pattern closely mirrors findings from the Swedish PRO-PD validation study [
15], which similarly reported the lowest item–total correlations for tremor (0.19) and olfaction (0.22), as well as the highest floor effects for hallucinations and nausea. Ceiling effects remained minimal in both datasets (<15% for all items), consistent with the scale’s capacity to capture higher symptom severity. Any minor differences in ceiling proportions between the small in-person sample and the large remote cohort likely reflect sample size and sampling variability rather than mode of administration. The smaller in-person dataset (
n = 46) demonstrated comparable item-level patterns, with greater variability attributable to sample size. Overall, consistency in item performance across datasets and concordance with prior validation findings support the stability of the PRO-PD item structure across populations and modes of administration.
3.1. Internal Consistency
Internal consistency was high for both samples: Cronbach’s α = 0.93 (95% CI: 0.90–0.96) for Small Data and 0.95 (95% CI: 0.947–0.951) for Big Data.
3.2. Temporal Stability (Test–Retest Reliability)
Temporal stability was good (ICC = 0.78 overall; 0.89 at 6 months). Item-level ICCs with 95% confidence intervals are presented in
Table S5 (Supplementary Materials). Two items (Control of body temperature and Medication side effects) showed very high baseline-to-6-month ICC values (0.984 and 1.000, respectively). These reflect minimal within-person variation over this interval: many participants reported identical or near-identical values at both time points. For medication side effects, ICC = 1.000 with a zero-width confidence interval occurs when residual (within-person) variance is negligible; the bootstrap interval collapses at the ceiling. These values do not indicate a computational error but rather high temporal stability for these specific items over 6 months. Point estimates remain valid for the normative database.
3.3. Factor Analysis
To facilitate comparison with the Swedish validation study, a confirmatory factor analysis (CFA) was first conducted using the previously identified eight-factor structure. Model fit indices indicated suboptimal fit (CFI and TLI < 0.90;
Table S2). Consequently, exploratory factor analyses were performed, evaluating solutions with four to seven factors. Scree plot inflection and the Kaiser criterion (eigenvalue > 1) supported retention of four factors (
Figure S1, Table S3). Parallel analysis suggested five factors. However, we retained four based on interpretability and parsimony. The fifth factor did not yield a conceptually distinct domain, and the four-factor solution demonstrated clearer clinical relevance (
Figure S2). Medication side effects, nausea, and dyskinesia were retained in the model despite being primary treatment-related complications rather than intrinsic disease manifestations. In the factor solution, these symptoms loaded most strongly on the autonomic domain, which may suggest these complications manifest through autonomic pathways, as dopaminergic therapies can affect gastrointestinal motility, blood pressure regulation, and other autonomic functions.
Although the 4-factor solution explained a lower proportion (47.6%) of total variance than the previously proposed 8-factor structure (61%) (
Table S4), variance explained alone is not a sufficient criterion for model adequacy. The Swedish 8-factor solution was derived using exploratory methods and maximized variance by subdividing correlated symptom domains, whereas confirmatory testing in the present dataset demonstrated suboptimal model fit. The four-factor solution represents a more parsimonious and interpretable structure, prioritizing latent construct validity and overall model fit over variance maximization. This approach aligns with contemporary psychometric standards for patient–reported outcome validation.
3.4. PRO-PD in Relation to Demographic and Clinical Characteristics
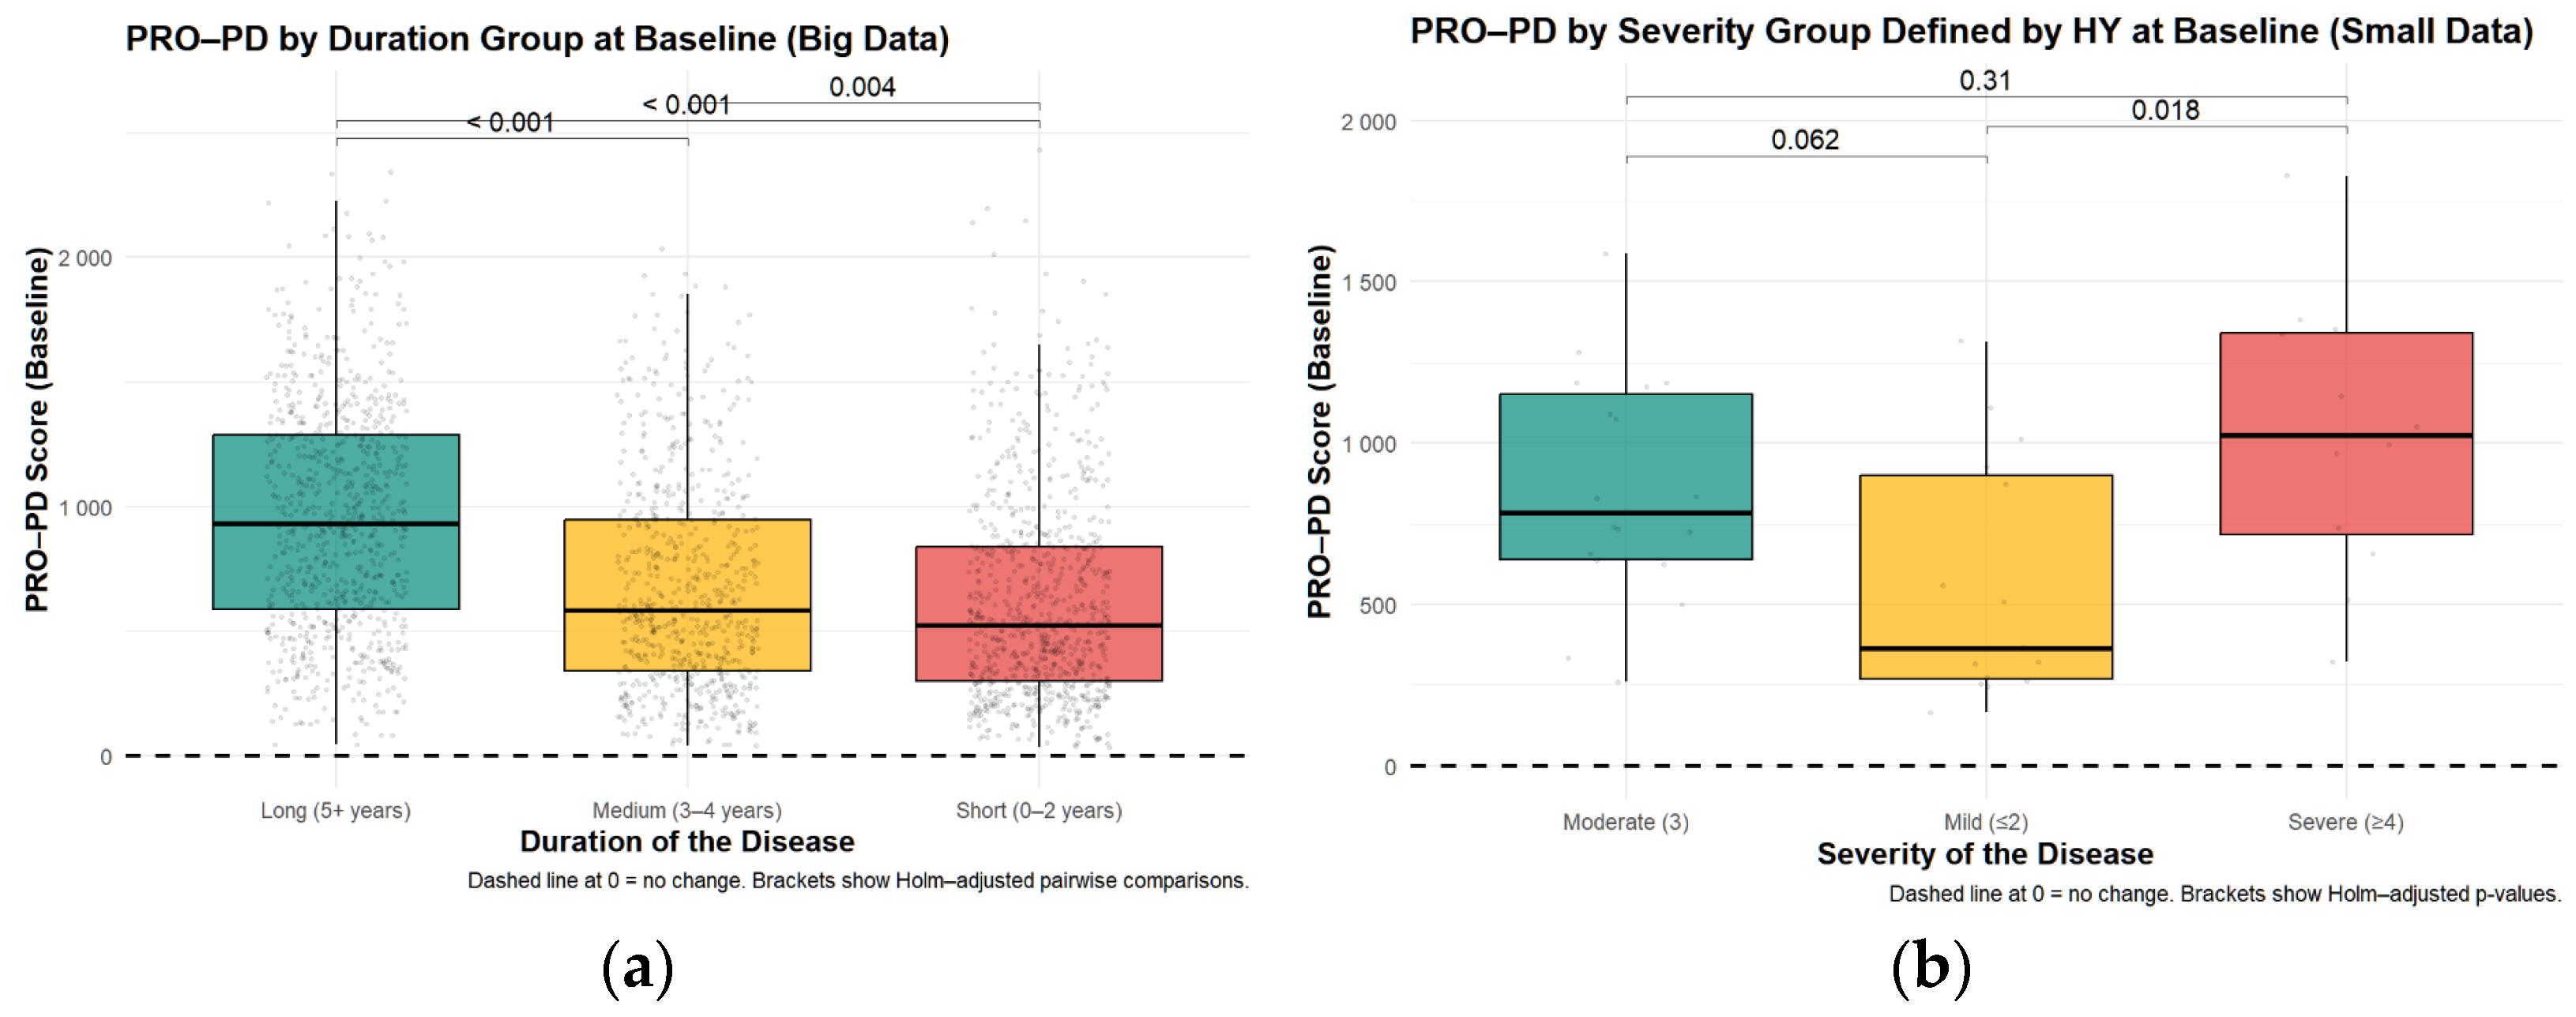
Baseline PRO-PD scores were examined across disease duration groups (0–2 years, 3–4 years, and ≥5 years since diagnosis). The large sample size (
n = 2612) provided substantial statistical power to detect clinically meaningful differences in PRO-PD scores for known clinical groups, supporting the robustness of these comparisons. In the smaller in-person dataset, no significant differences in total PRO-PD scores were observed across duration groups (Kruskal–Wallis χ
2 = 2.29,
df = 2,
p = 0.318). This non-significant finding may reflect limited statistical power (
n = 46 divided across three groups) rather than a true absence of association. In contrast, in the large remote-monitoring dataset, PRO-PD scores differed significantly by disease duration (Kruskal–Wallis χ
2 = 251.87,
df = 2,
p < 2.2 × 10
−16). Pairwise comparisons using Wilcoxon rank-sum tests with Holm adjustment confirmed significant differences between all duration groups, with higher PRO-PD scores observed in individuals with longer disease duration. Specifically, comparisons between the ≥5-year group and both the 3–4-year and 0–2-year groups were highly significant (both
p < 2 × 10
−16), as was the comparison between the 3–4-year and 0–2-year groups (
p = 0.0037). These differences are illustrated in
Figure 2a,b, which shows a stepwise increase in baseline PRO-PD scores with increasing years since diagnosis.
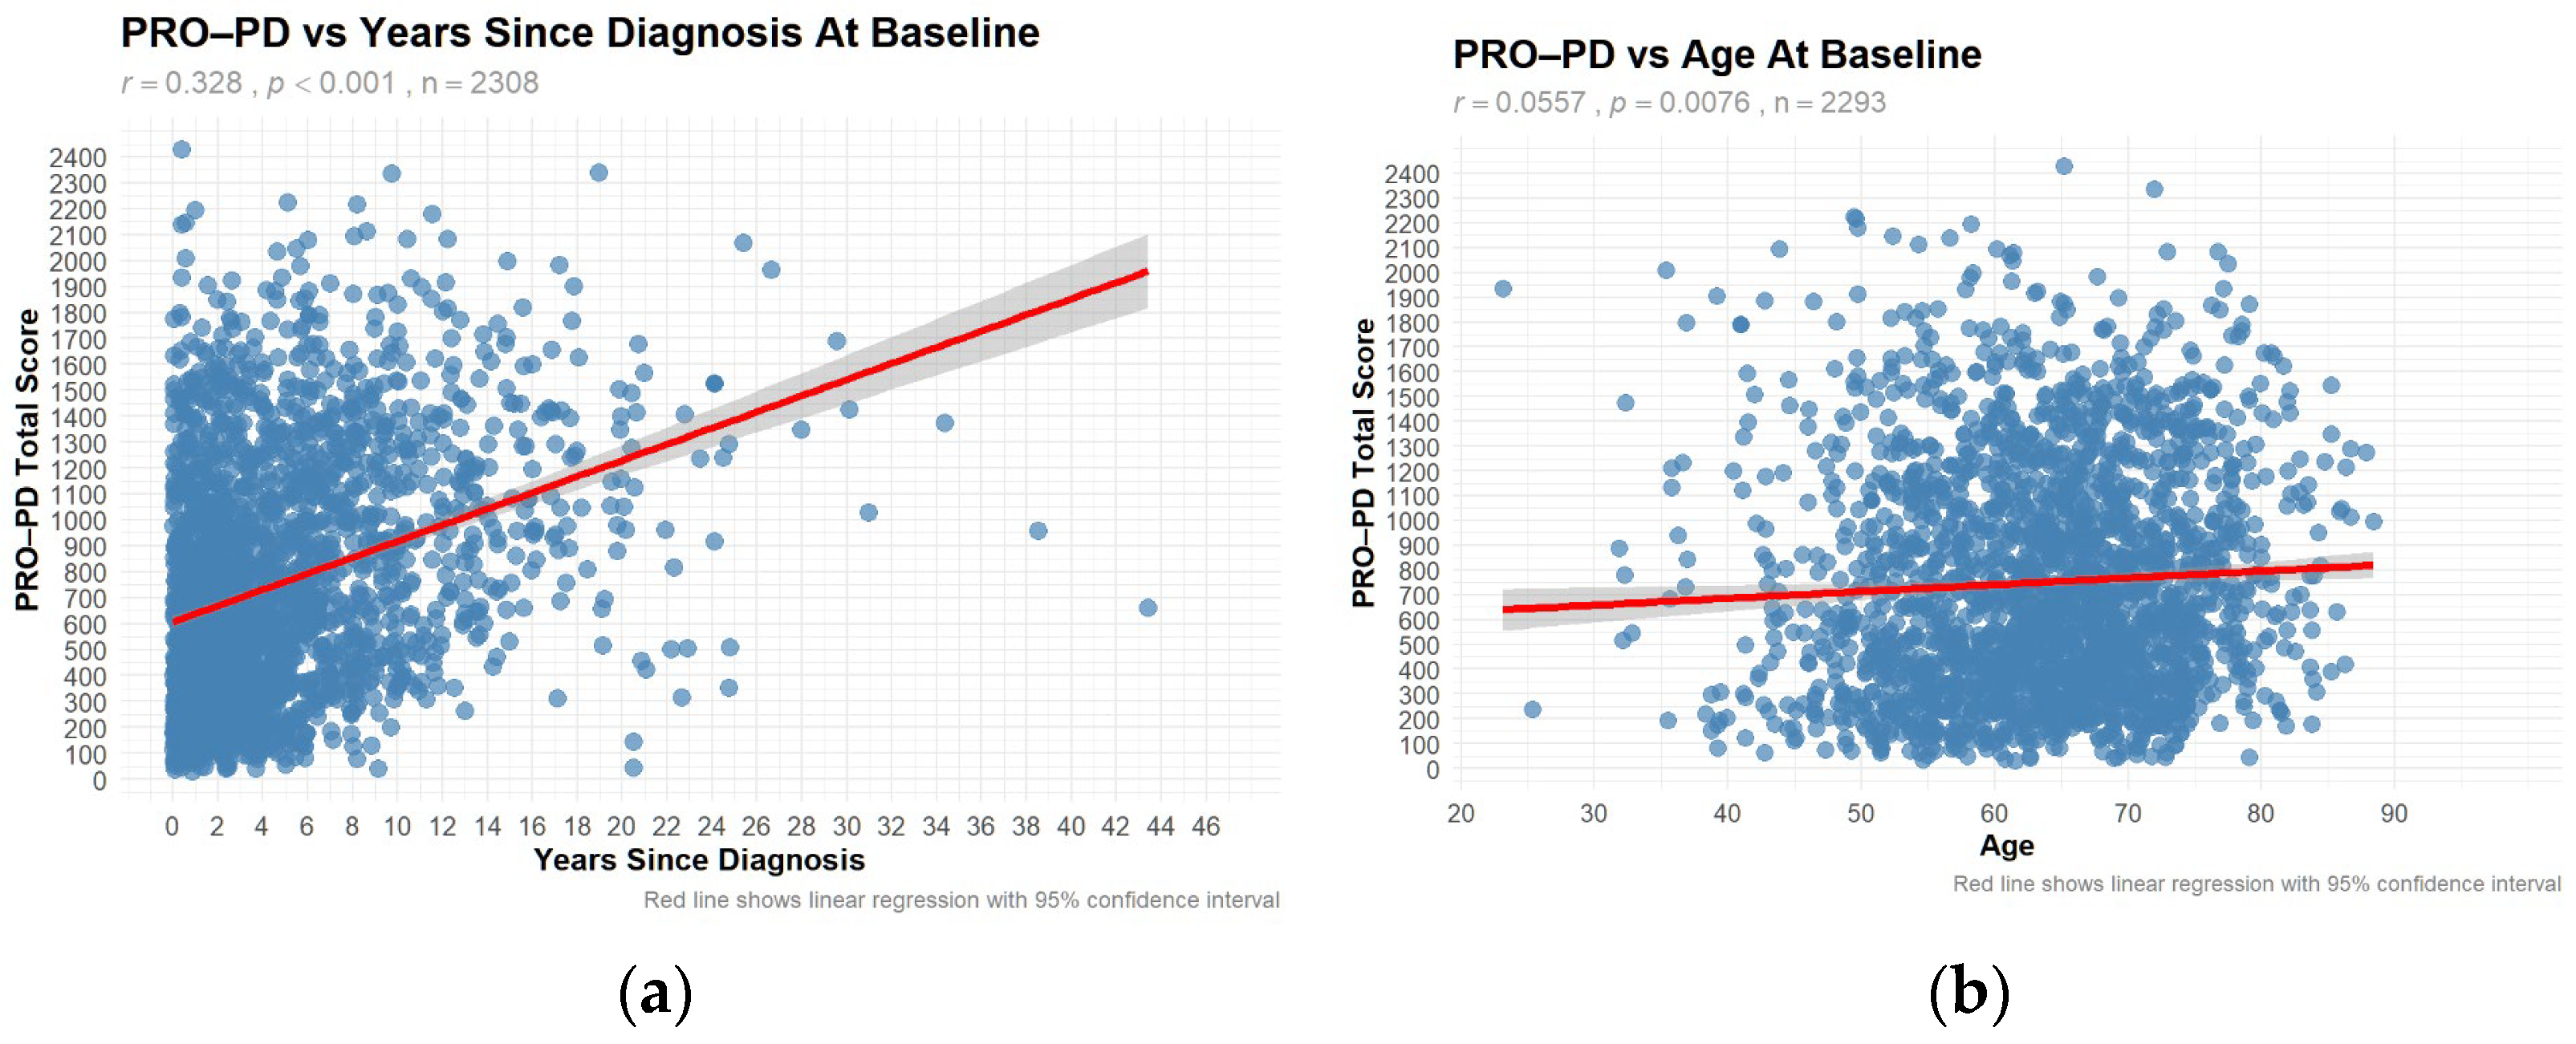
Only the large data demonstrated a significant correlation between PRO-PD and years since diagnosis (r = 0.328,
p < 0.001) and age (r = 0.0557,
p = 0.0076) (
Figure 3a,b). The correlation with years since diagnosis was also observed in a Swedish study [
14], where similar results were obtained.
3.5. PRO-PD by Gender at Baseline
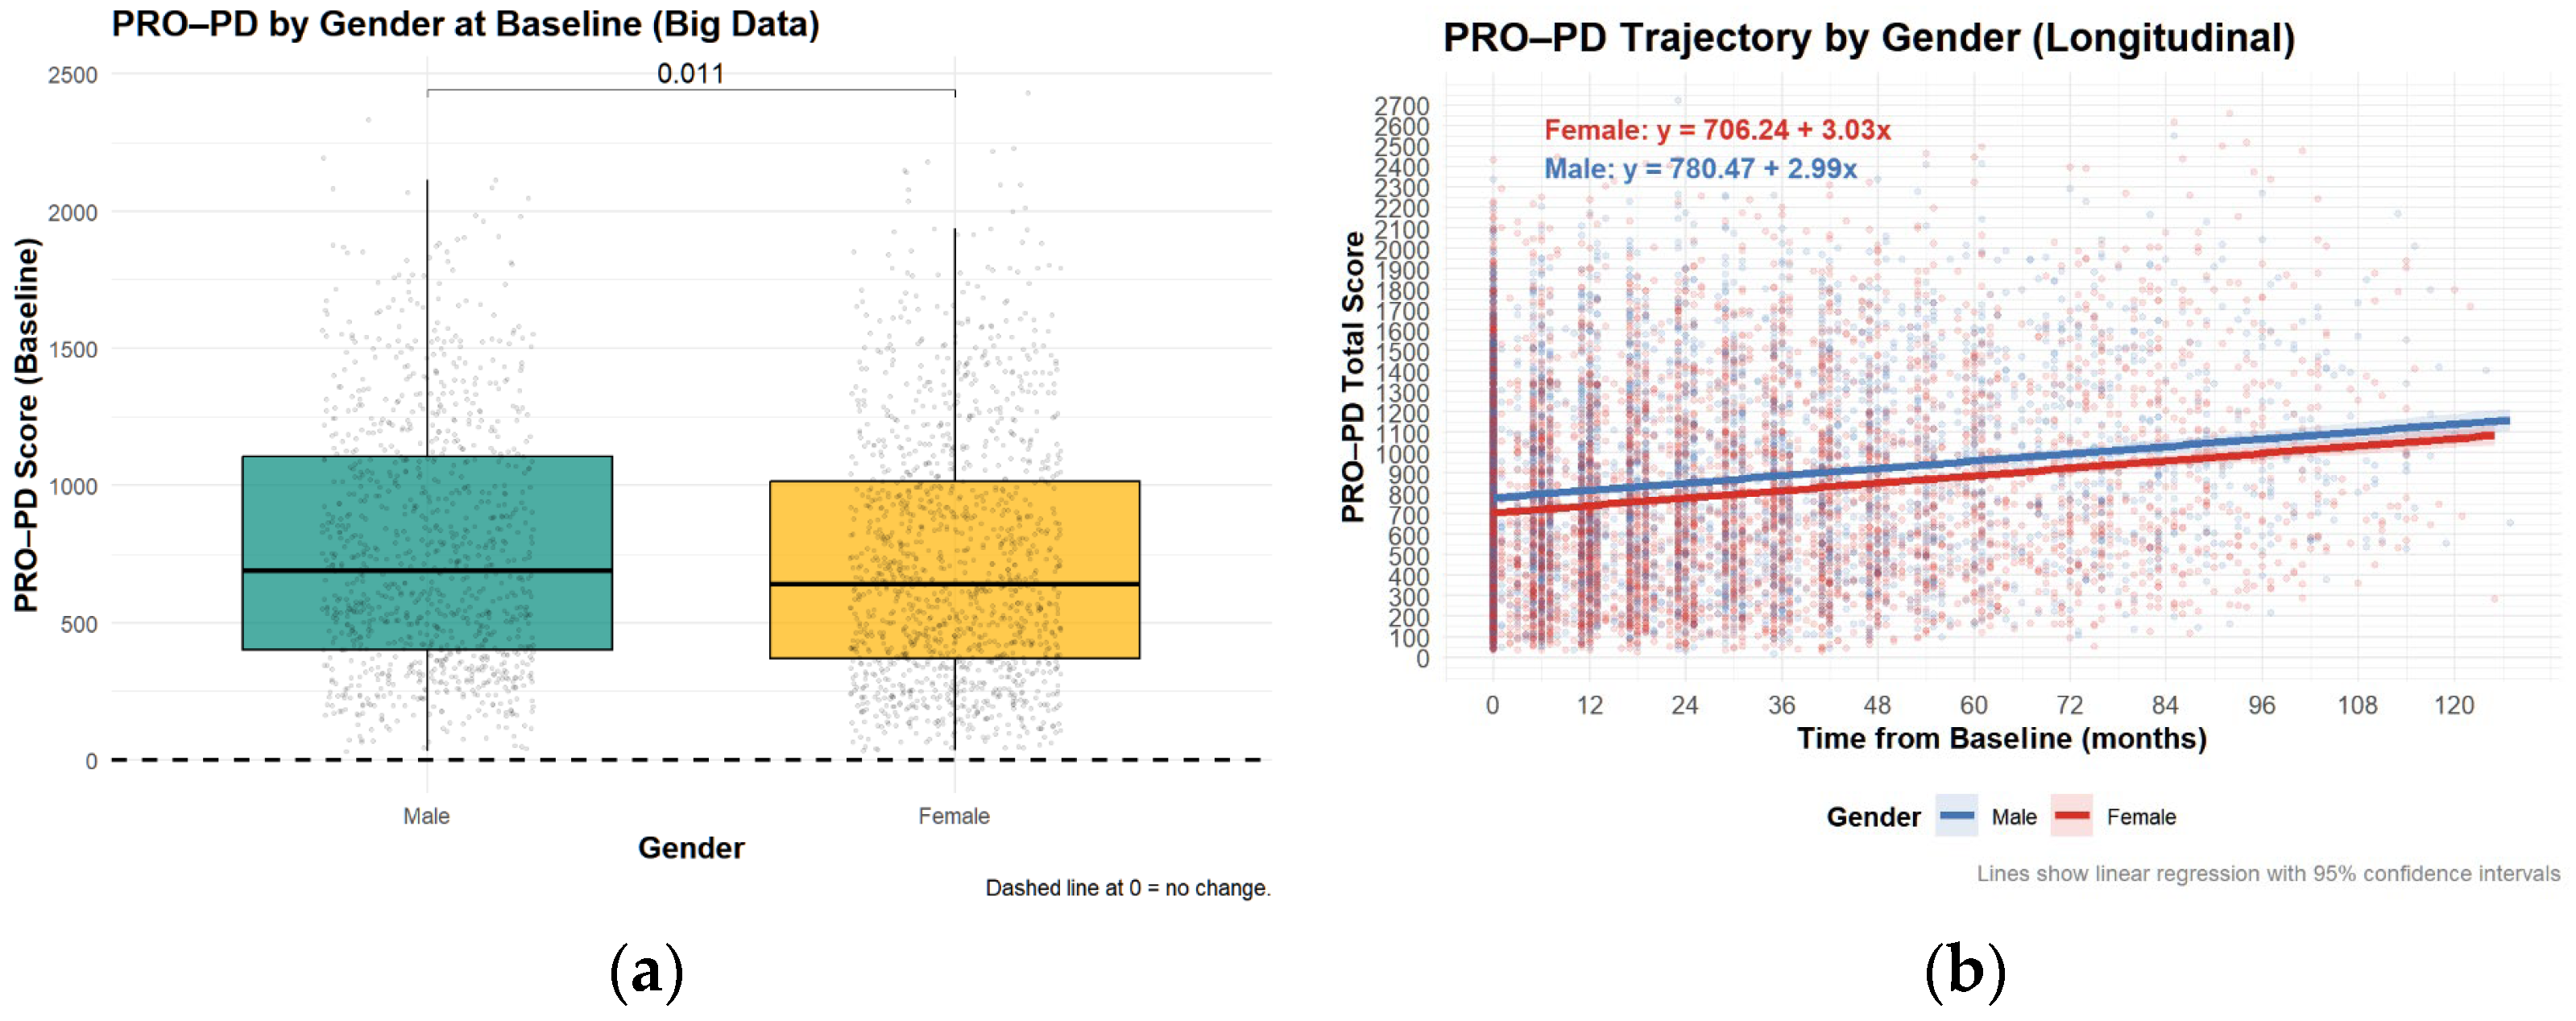
Contrary to the Swedish study, there was a significant difference in PRO-PD scores between sexes, although the difference was not clinically relevant (
Figure 4).
3.6. Minimally Clinically Important Difference (MCID)
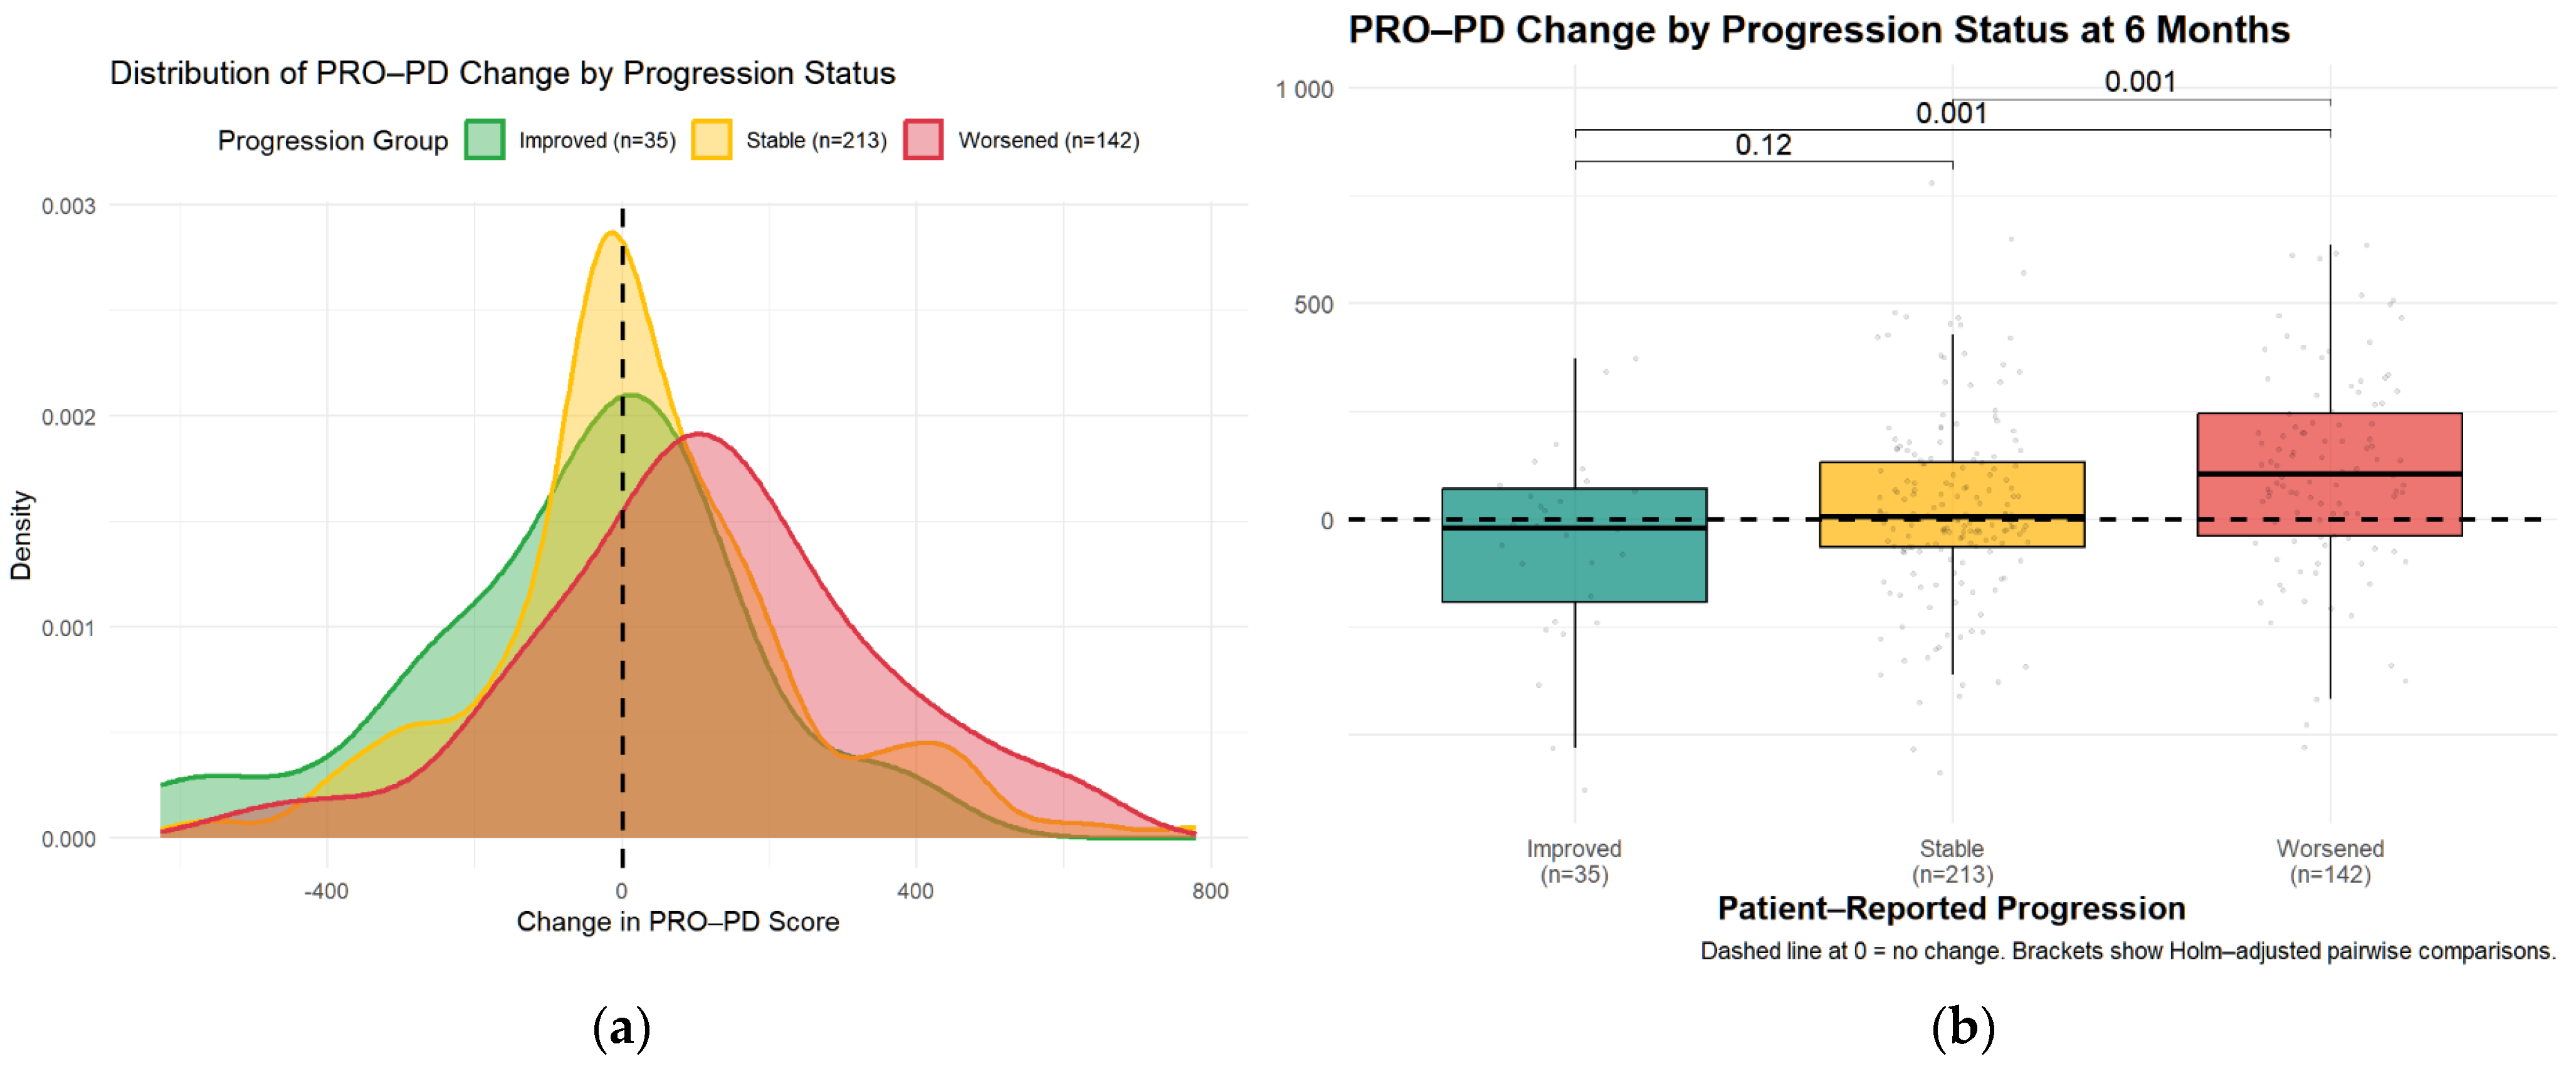
Minimal clinically important difference (MCID) was evaluated using an anchor question administered at six months. Of 390 participants, 35 (9%) reported improvement, 142 (36%) reported worsening, and 213 (55%) reported no change. Median PRO-PD change was 7 in the stable group, −20 in the improved group, and +106.5 in the worsened group. Kruskal–Wallis testing demonstrated significant differences between the worsened group and both the stable and improved groups (both
p = 0.0015), with no significant difference between stable and improved participants (
Figure 5). These findings were confirmed using a multinomial regression approach presented later in this section.
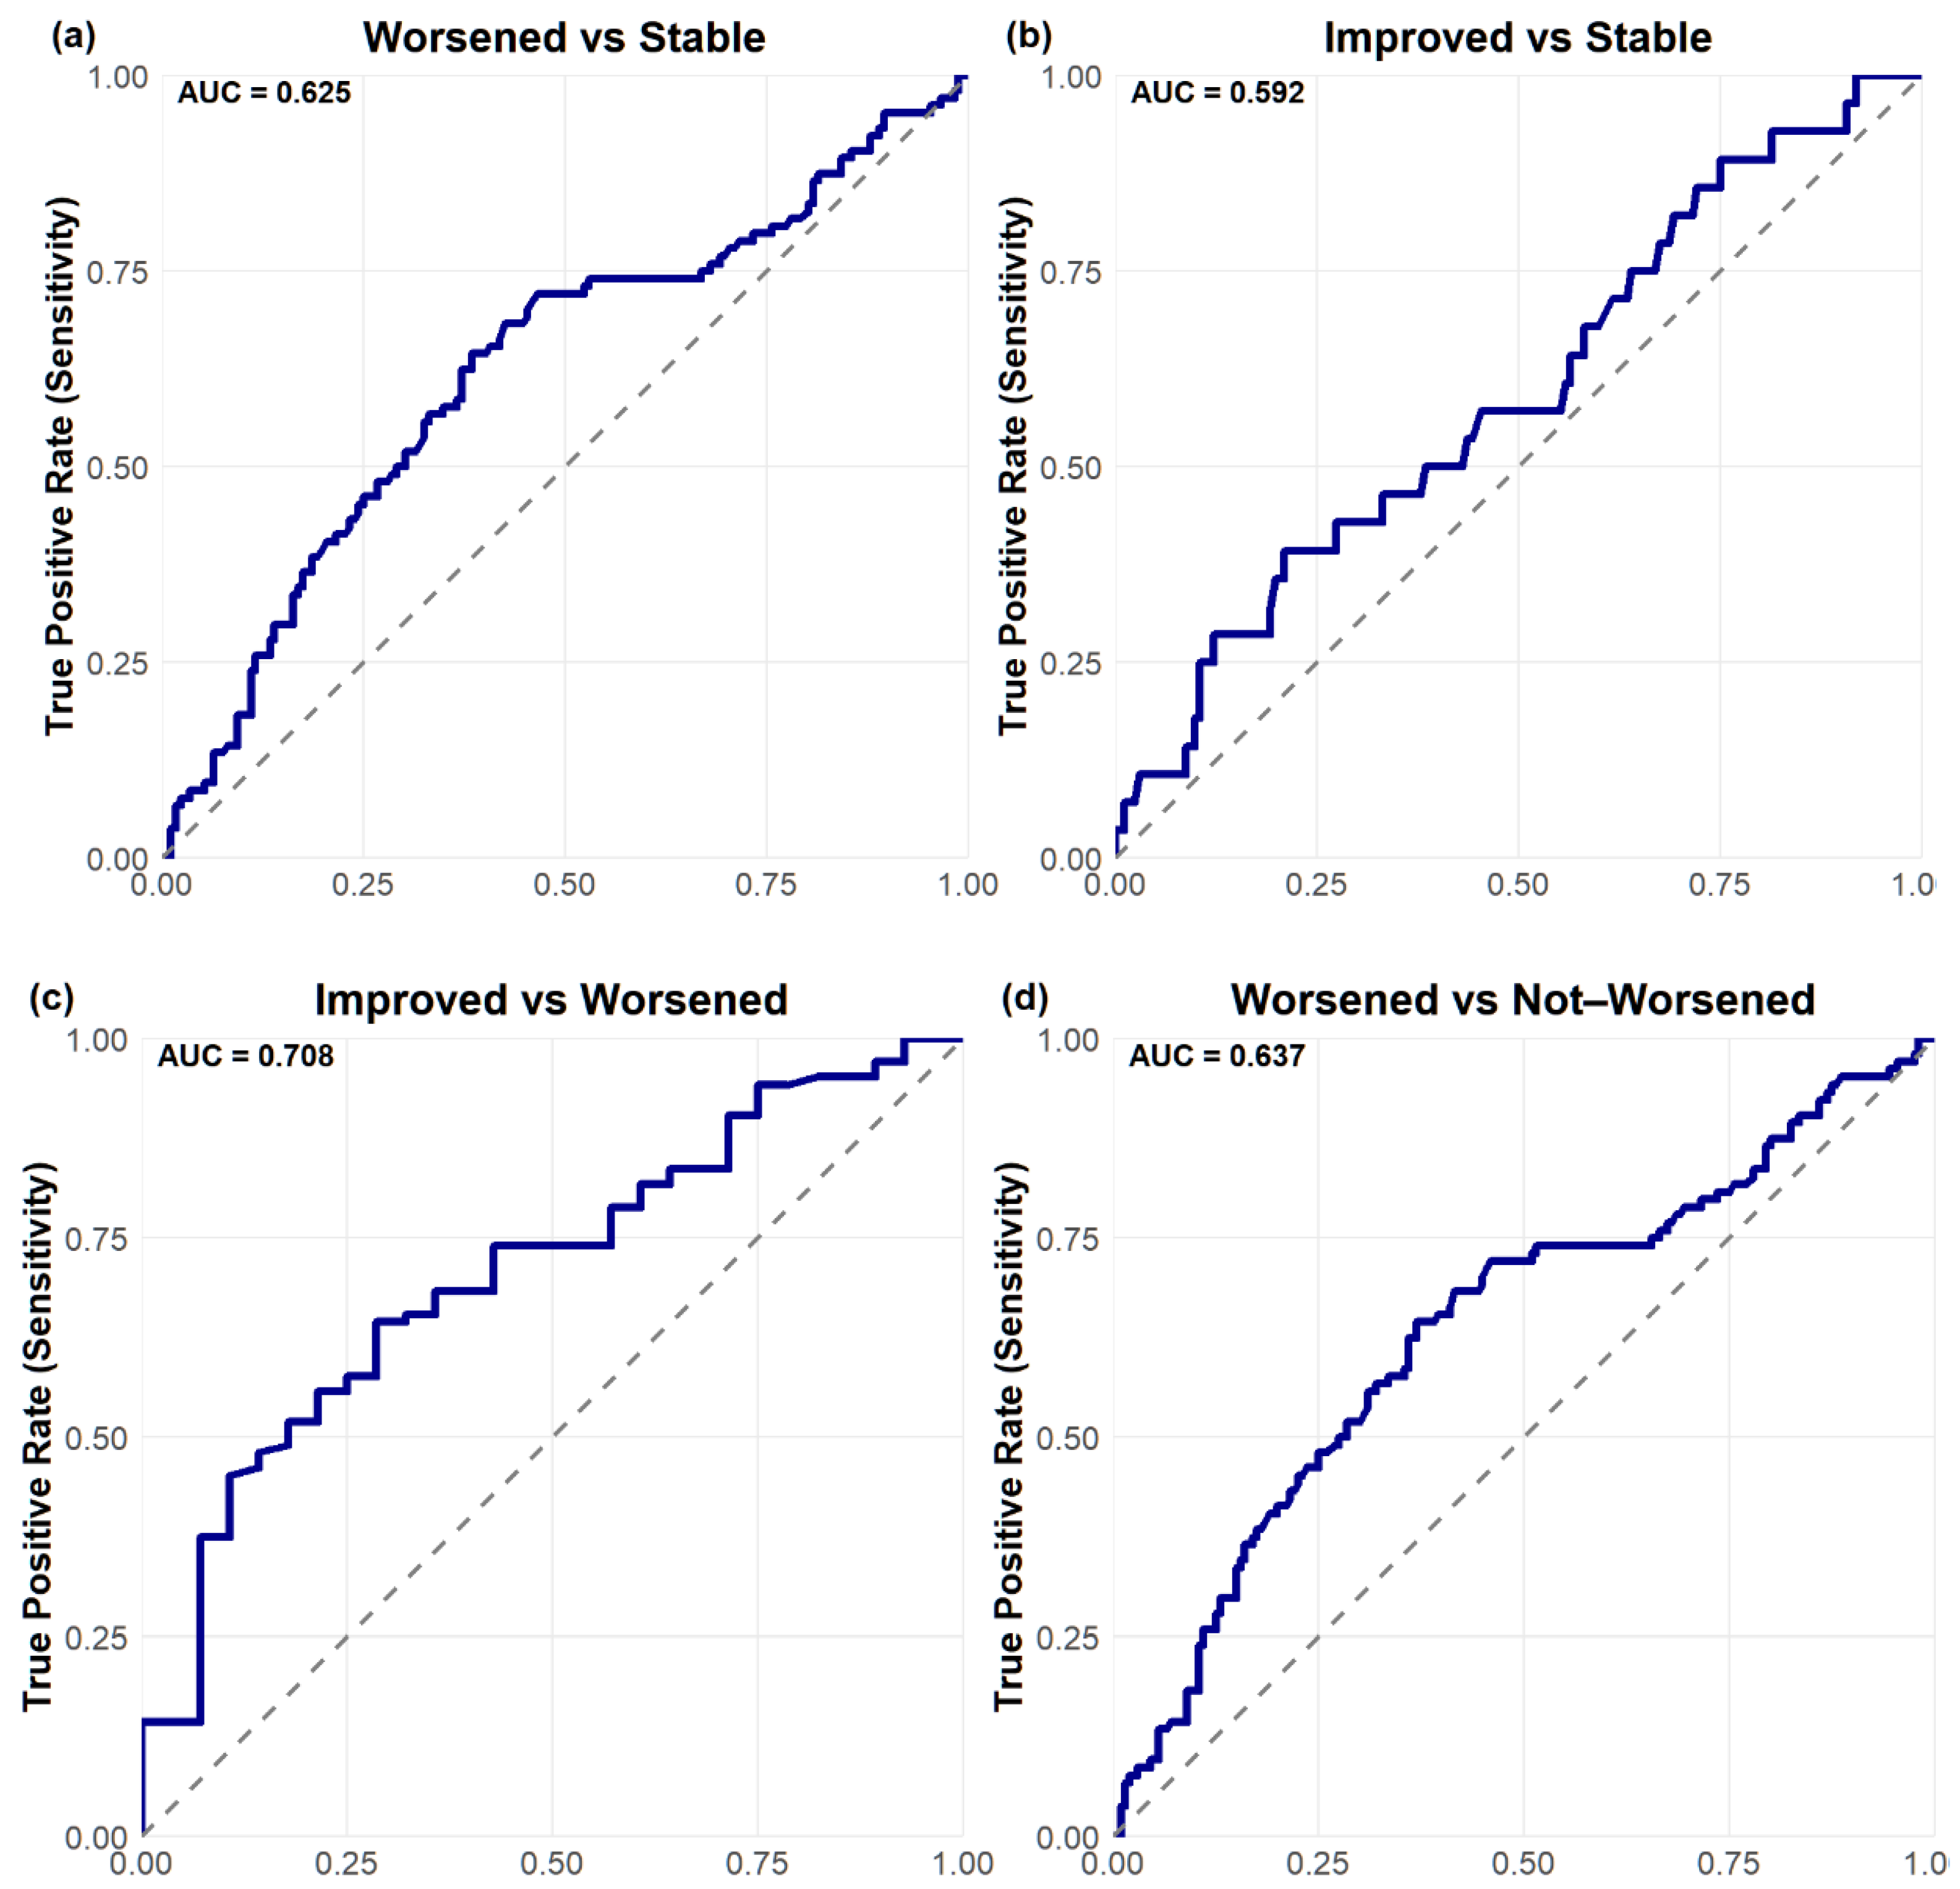
Receiver operating characteristic (ROC) analyses identified a PRO-PD change threshold of +53.5 points distinguishing worsened from stable participants, which was identical for worsened versus not worsened (stable/improved) classifications. This threshold corresponds closely to the Swedish validation study [
14], which reported a cutoff of 119 points over a longer follow-up interval, suggesting approximately linear symptom progression over shorter time frames. The MCID for improvement was −78.5 points, indicating a larger magnitude of change required to detect improvement compared with deterioration. Discrimination was modest for improved versus stable participants (AUC = 0.592) and acceptable for improved versus worsened participants (AUC = 0.708). Classification of worsened versus not worsened yielded an AUC of 0.637, with a sensitivity of 0.644 and a specificity of 0.630 (
Figure 6.
Table 3).
A substantial proportion of participants reporting stable status demonstrated large PRO-PD changes, suggesting potential recall bias or response shift in anchor-based self-assessment. Accordingly, some misclassification may reflect limitations of patient–reported anchors rather than scale performance. Future studies should further refine MCID thresholds using objective clinical anchors (
Table 4).
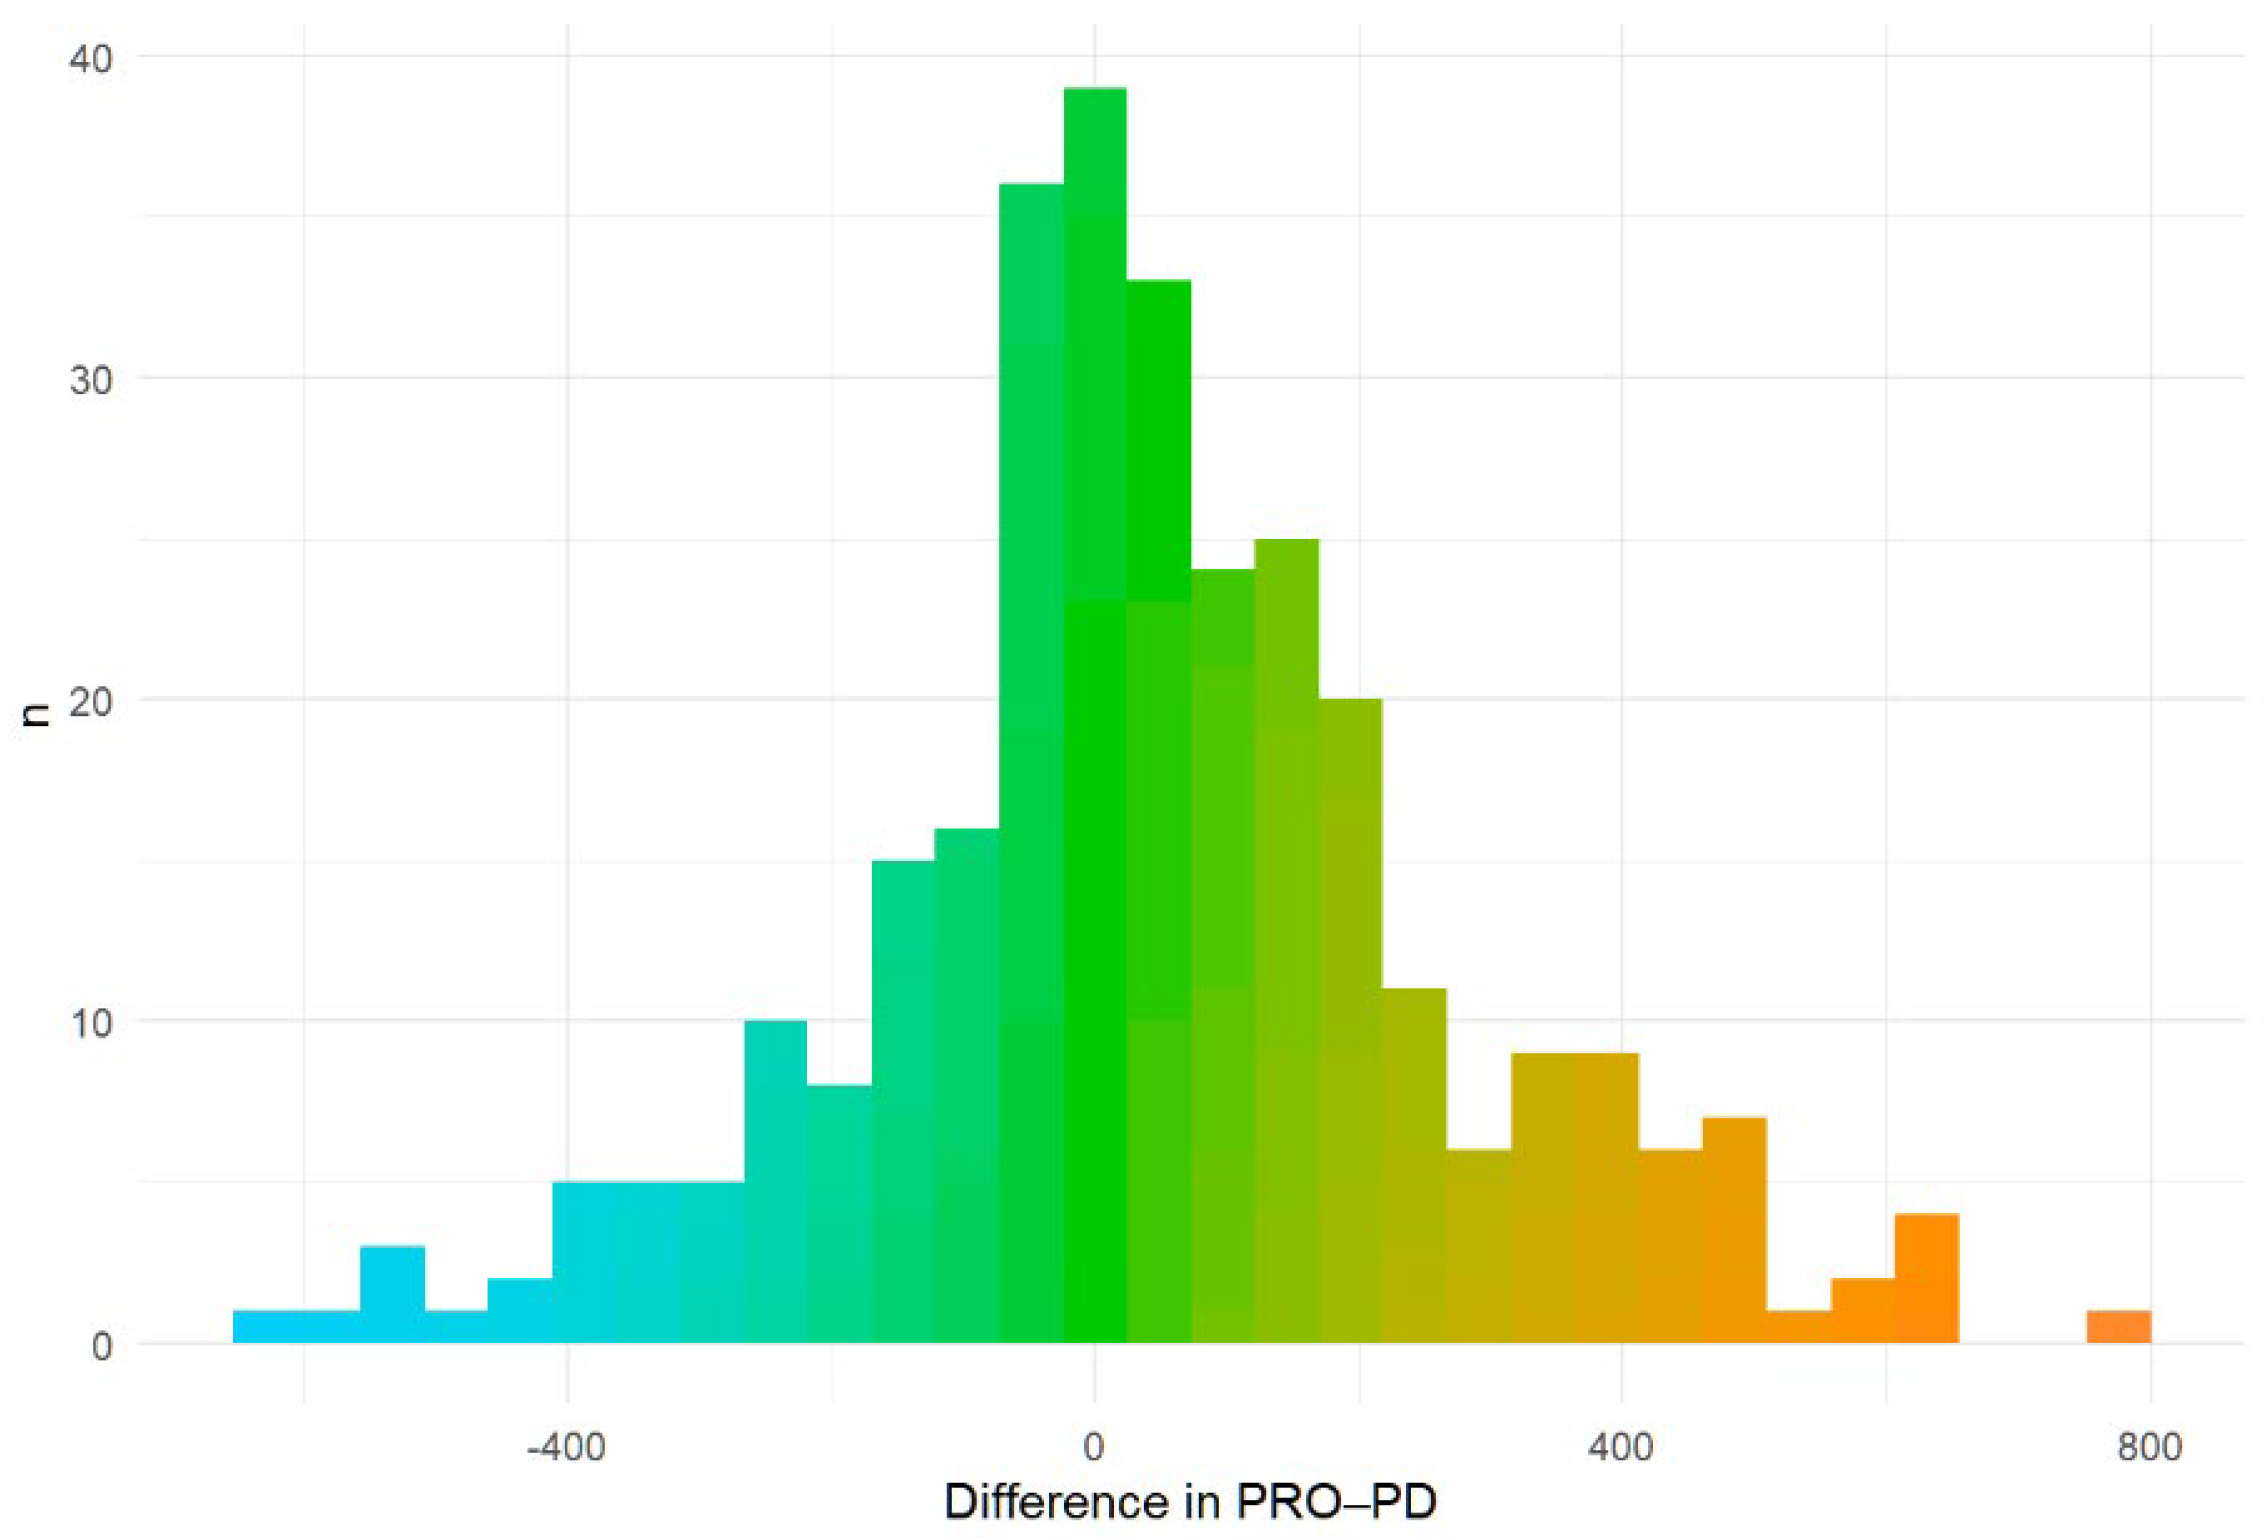
Over a six-month period, 213 (54.6%) reported remaining stable (mean change 7 [IQR: −65, 133]), 35 (9.0%) reported improvement (mean change −20.0, [IQR: −192.8, 70], and 142 (36.4%) worsened (mean change: 106.5, [IQR: −38, 246] (
Figure 7).
To further evaluate whether a change in PRO-PD score discriminated among self-reported progression categories, a multinomial logistic regression model was fit with progression status (improved, stable, worsened) as the outcome and 6-month change in PRO-PD as the predictor, using the stable group as the reference. Greater increases in PRO-PD score were significantly associated with higher odds of being classified as worsened versus stable (OR = 1.002 per unit increase; p = 0.0028). In contrast, increasing PRO-PD change scores were associated with lower odds of being classified as improved versus stable, although this association did not reach conventional statistical significance (OR = 0.998; p = 0.055). These findings were concordant with non-parametric analyses, in which overall group differences were significant (Kruskal–Wallis p < 0.001), and pairwise comparisons demonstrated significant separation between stable and worsened groups (Holm-adjusted p = 0.0015), but weaker discrimination between improved and stable participants. Consistency across analytical approaches supports the construct validity of PRO-PD change scores for differentiating patient-perceived worsening, with more modest sensitivity for detecting improvement over a 6-month interval.
4. Discussion
This study provides the first comprehensive psychometric validation of the PRO-PD as a patient–reported outcome measure capable of detecting clinically meaningful change in PD, with relevance to nutrition- and lifestyle-based research. Across two independent datasets, the PRO-PD demonstrated excellent internal consistency, good temporal stability, strong convergent validity with established clinical scales, and robust known-groups validity. Importantly, the scale captured symptom burden across motor and non-motor domains, aligning with contemporary views of PD as a multi-system condition and addressing key limitations of motor-centric outcome measures.
Factor analytic findings support a parsimonious four-domain structure encompassing neurobehavioral, autonomic, motor, and mood/motivation symptoms. Although this structure explained less variance than the previously proposed eight-factor model, it demonstrated superior interpretability and construct validity under confirmatory testing. This trade-off reflects a well-recognized psychometric principle: variance maximization alone does not ensure meaningful latent structure. The four-factor structure aligns conceptually with neuropathological staging of PD, whereby Braak stages 1–2 involve olfactory and lower brainstem regions (early non-motor features), later spreading to midbrain dopaminergic regions and eventually to limbic and neocortical areas. Consistent with this framework, several items loading on the autonomic and sleep-related domains (e.g., constipation, dysautonomia, REM sleep behavior disorder) have been associated with early brainstem involvement, whereas the motor factor reflects dysfunction of the nigrostriatal dopaminergic system that becomes prominent with substantia nigra degeneration. In contrast, symptoms clustering within cognitive and neuropsychiatric domains may reflect later limbic and cortical involvement. Although factor analysis captures patterns of symptom co-occurrence rather than temporal disease stages, the observed clustering of clinically meaningful symptom domains is broadly consistent with the spatial progression of pathology described in Braak staging and supports the biological plausibility of the identified factor structure. This four-factor structure also has potential clinical implications. These clinically recognizable symptom clusters may facilitate more structured assessment of multidimensional symptom burden. Grouping symptoms into these domains may help clinicians and patients interpret patient–reported outcomes more intuitively, track domain-specific changes over time, and identify areas of disproportionate symptom impact.
Anchor-based analyses established asymmetric MCID thresholds, with smaller changes required to detect worsening than improvement, a pattern consistent with prior PD studies and patient–reported outcome research more broadly. The MVP study used a three-category anchor (improved, stable, worsened), enabling asymmetric MCID thresholds for both improvement and worsening, whereas the Swedish study compared only deteriorated versus unchanged. The present study also explicitly examined patterns of misclassification in anchor-based MCID estimation, attributing discordance between PRO-PD change and self-reported status to limitations of patient–reported anchors rather than scale performance. The moderate discrimination observed for improvement likely reflects both biological asymmetry and limitations of global recall anchors, rather than inadequate scale sensitivity. The strong concordance between non-parametric, multinomial, and ROC-based methods supports the robustness of the identified thresholds and provides practical benchmarks for interpreting longitudinal change in interventional studies.
Floor and ceiling effects were examined to assess the dynamic range of the PRO-PD items. Ceiling effects were minimal across items in both datasets, indicating that responses rarely clustered at the maximum score and that it retains sensitivity for detecting worsening symptoms. Floor effects were more common for several items, which is expected in a heterogeneous population where many symptoms are absent in a subset of individuals. Overall, the observed distribution supports the ability of the PRO-PD to capture a broad spectrum of symptom severity without substantial saturation at the extremes. These characteristics are particularly important for outcome measures intended for longitudinal monitoring.
4.1. Limitations
This study has several limitations. PD remains a clinicopathologic diagnosis, with definitive confirmation possible only at autopsy. Although in-person examination, specialist history, and biomarker confirmation would have enhanced diagnostic certainty, such assessments were not feasible within the remote design. Diagnostic misclassification cannot be excluded, and some participants’ diagnoses may evolve over time. The remote, patient–reported nature limits independent verification of diagnoses and symptom severity. Findings should be interpreted considering reliance on participant-reported diagnosis and symptom experience.
The convergent validity sample (n = 46) was small and drawn from a single clinical trial, limiting generalizability. Hoehn and Yahr staging was unavailable in the MVP cohort (remote design), and known-groups validity by disease severity was therefore evaluated only in the small in-person sample (n = 46), limiting statistical power for that comparison. The anchor-based MCID analyses relied on patient recall of global change over 6 months, which may be subject to recall bias or response shift, particularly among individuals reporting stable symptoms despite large PRO-PD changes. The number of participants classified as improved was relatively small (n = 35), which may limit statistical power for detecting improvement and contribute to the more modest AUC values observed for improved versus stable comparisons. The moderate AUC values for discriminating improved versus stable participants suggest that detecting improvement may be more challenging than detecting worsening. Estimates of the MCID for improvement should be interpreted cautiously and will require confirmation in future studies with larger numbers of improving participants.
While these findings support the utility of the PRO-PD total score for capturing overall symptom burden at the population level, its validity and clinical usefulness for individual patient management remain to be established. Future studies are needed to determine whether PRO-PD scores can assist clinicians in goal setting, identifying patients at higher risk for adverse outcomes, or monitoring response to therapeutic interventions over time. The four-factor structure identified in the analysis may provide an additional framework for interpreting symptom patterns within the overall PRO-PD score, but its role in guiding clinical decision-making will require further evaluation.
Table S1 provides a structured comparison of PRO-PD’s strengths and limitations relative to the MDS-UPDRS. Notably, while PRO-PD offers advantages in remote monitoring and patient-centeredness, it lacks the objective motor assessments and regulatory acceptance of established clinician-rated scales.
4.2. Conclusions
The PRO-PD demonstrates strong psychometric performance, sensitivity to clinically meaningful change, and minimal floor effects in early PD. Its rapid completion time (<10 min), remote accessibility without requiring trained administrators, and responsiveness to patient-perceived symptom burden position it as a complementary outcome measure for intervention trials where traditional motor-centric scales may lack sensitivity or feasibility. These properties support its use as a patient–reported outcome measure in intervention studies, including those evaluating nutrition, lifestyle, or pharmacologic approaches, where patient-perceived symptom burden is of interest. Although the validation itself is not directly related to nutrition, it is a necessary prerequisite for further research, including studies building diet scores with PRO-PD as the response variable. No analyses in this manuscript were designed to test the effects of diet, nutraceuticals, or lifestyle factors on PD symptoms, and no causal inferences should be drawn regarding such exposures. Future work should include wearable sensor comparison, external validation, and prospective intervention studies to confirm the scale’s responsiveness and clinical utility.