Household Composition May Modify the Association Between Home Cooking and Dietary Diversity Among Japanese Corporate Employees
 ,
, 
Abstract
1. Introduction
2. Materials and Methods
2.1. Study Design and Participants
2.2. Questionnaire on Location, Job Type, Home Cooking, Dining Area, Family Composition, and Food Groups
2.3. Statistical Analysis
2.3.1. Associations Between Household and Lifestyle Factors and Dietary Diversity (Shannon Index)
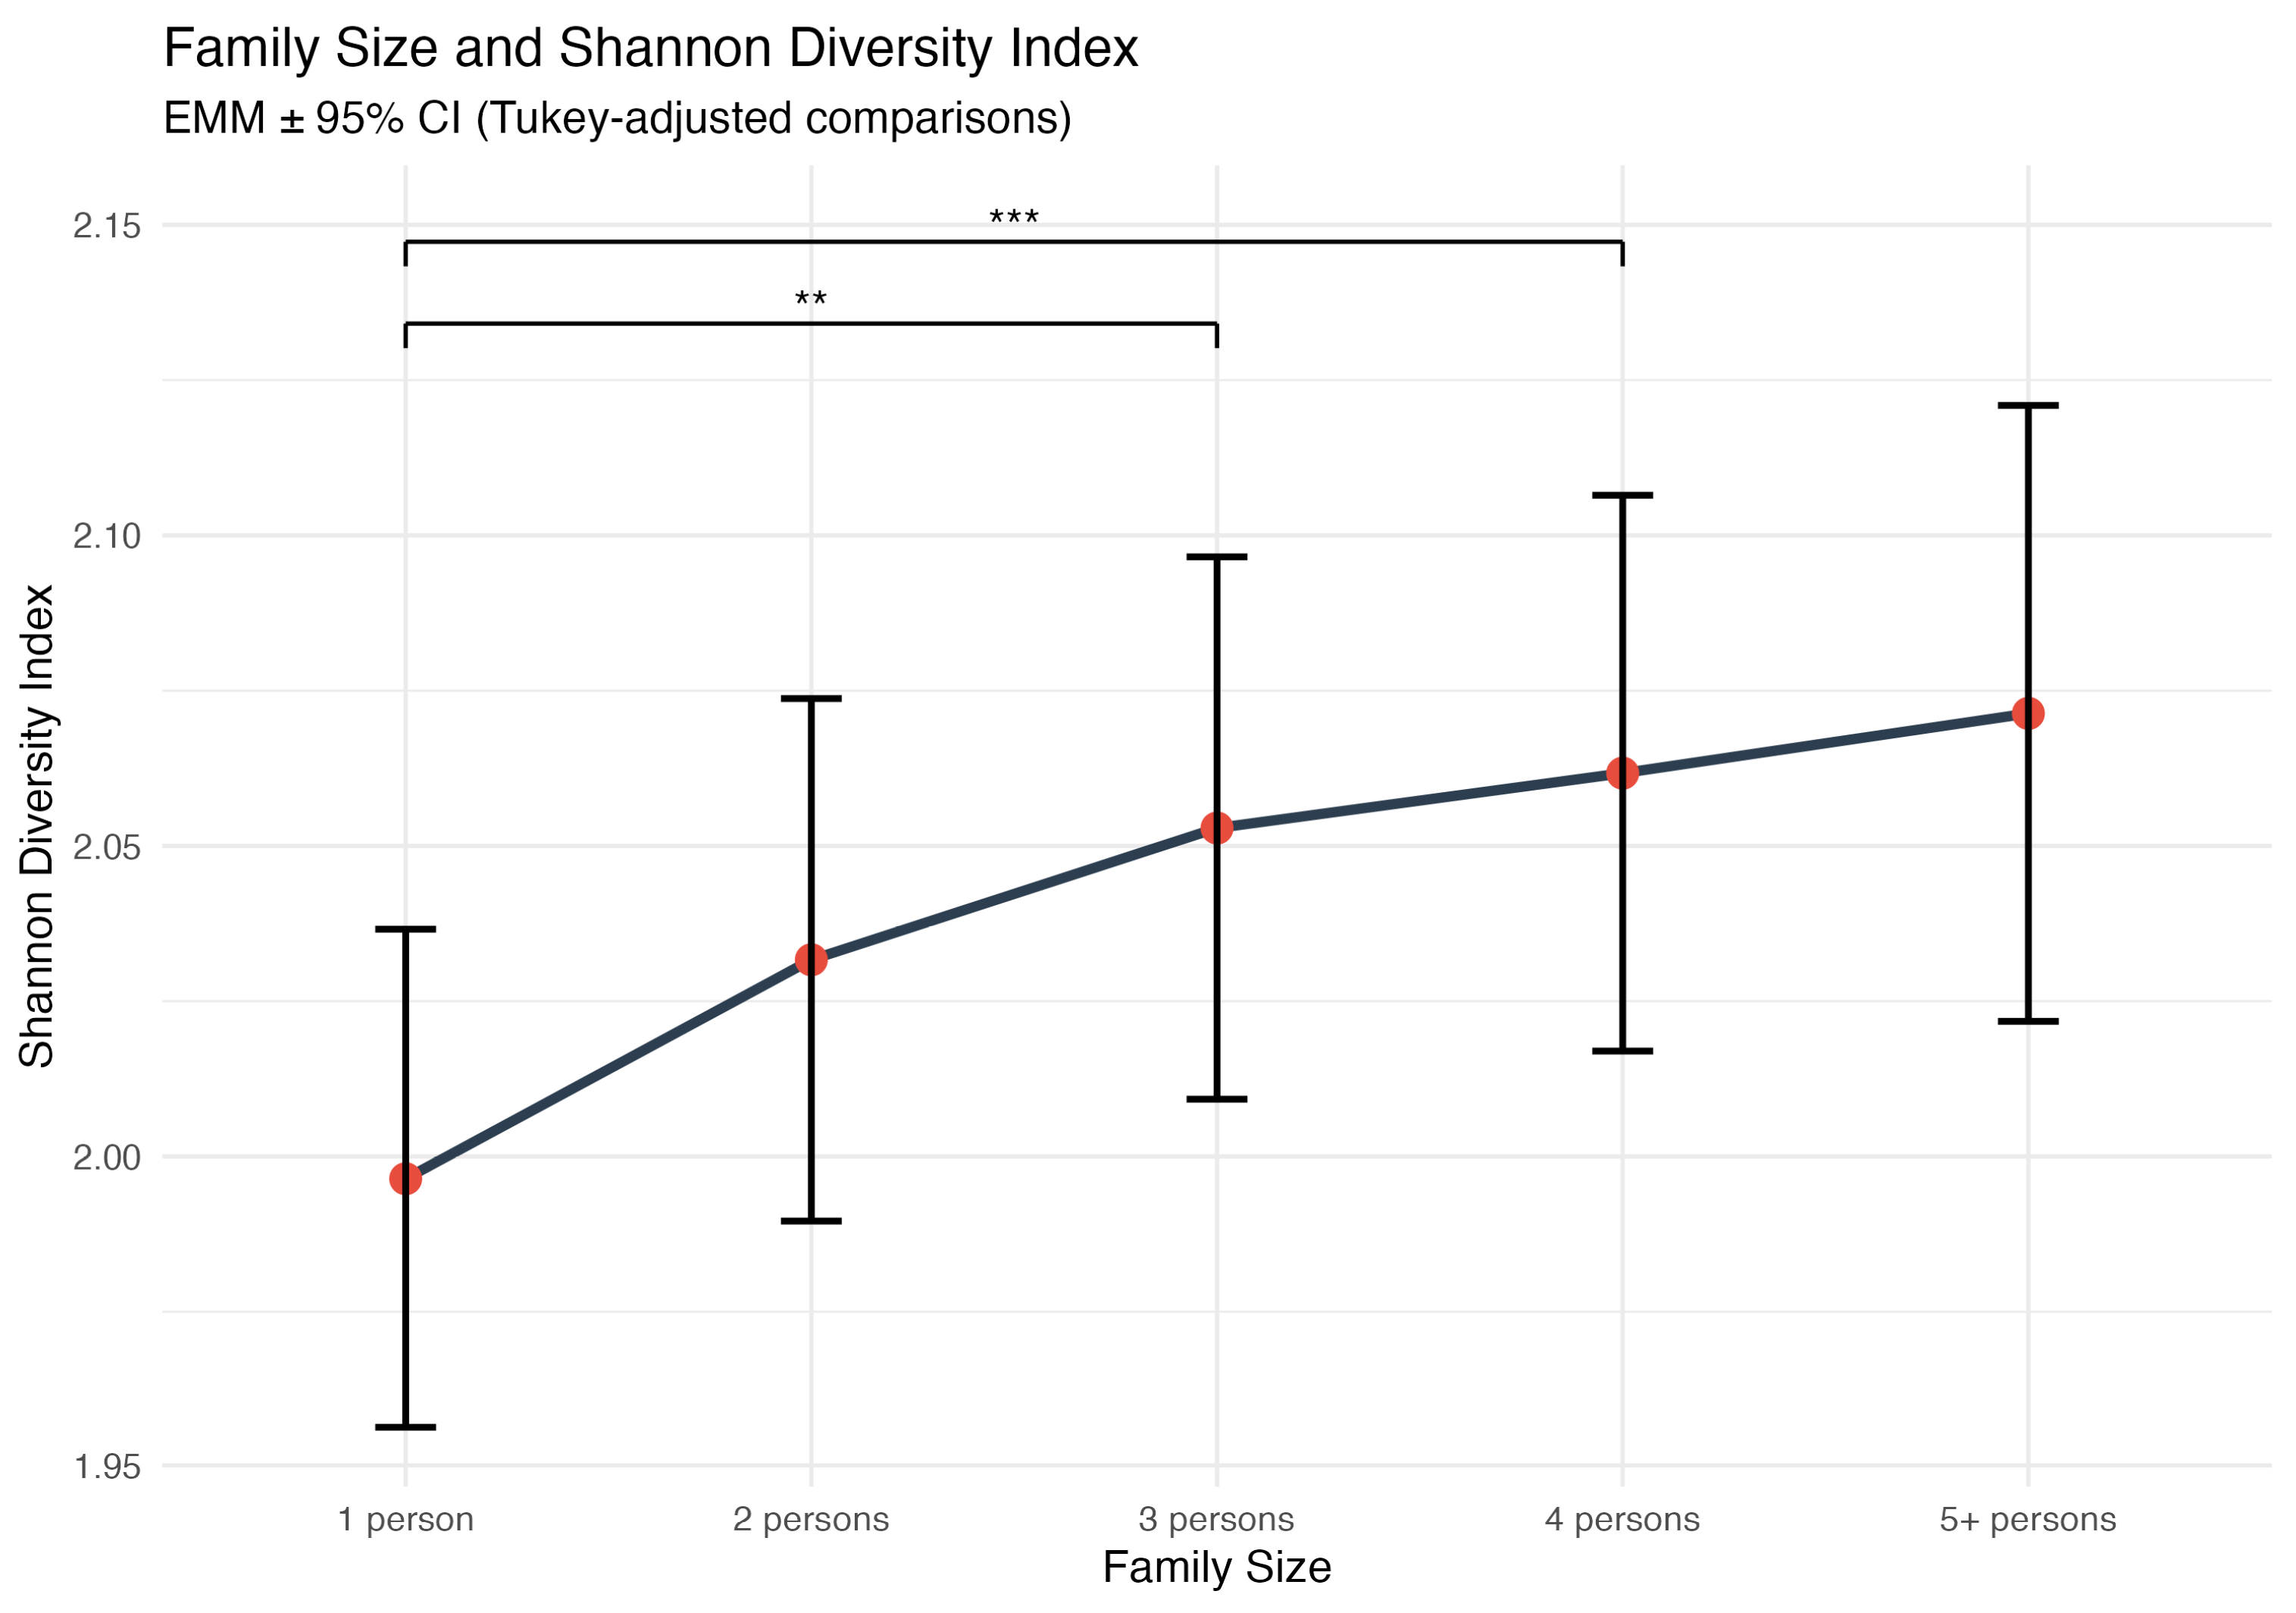
2.3.2. Associations Between Family Size and the Shannon Diversity Index of Food Intake
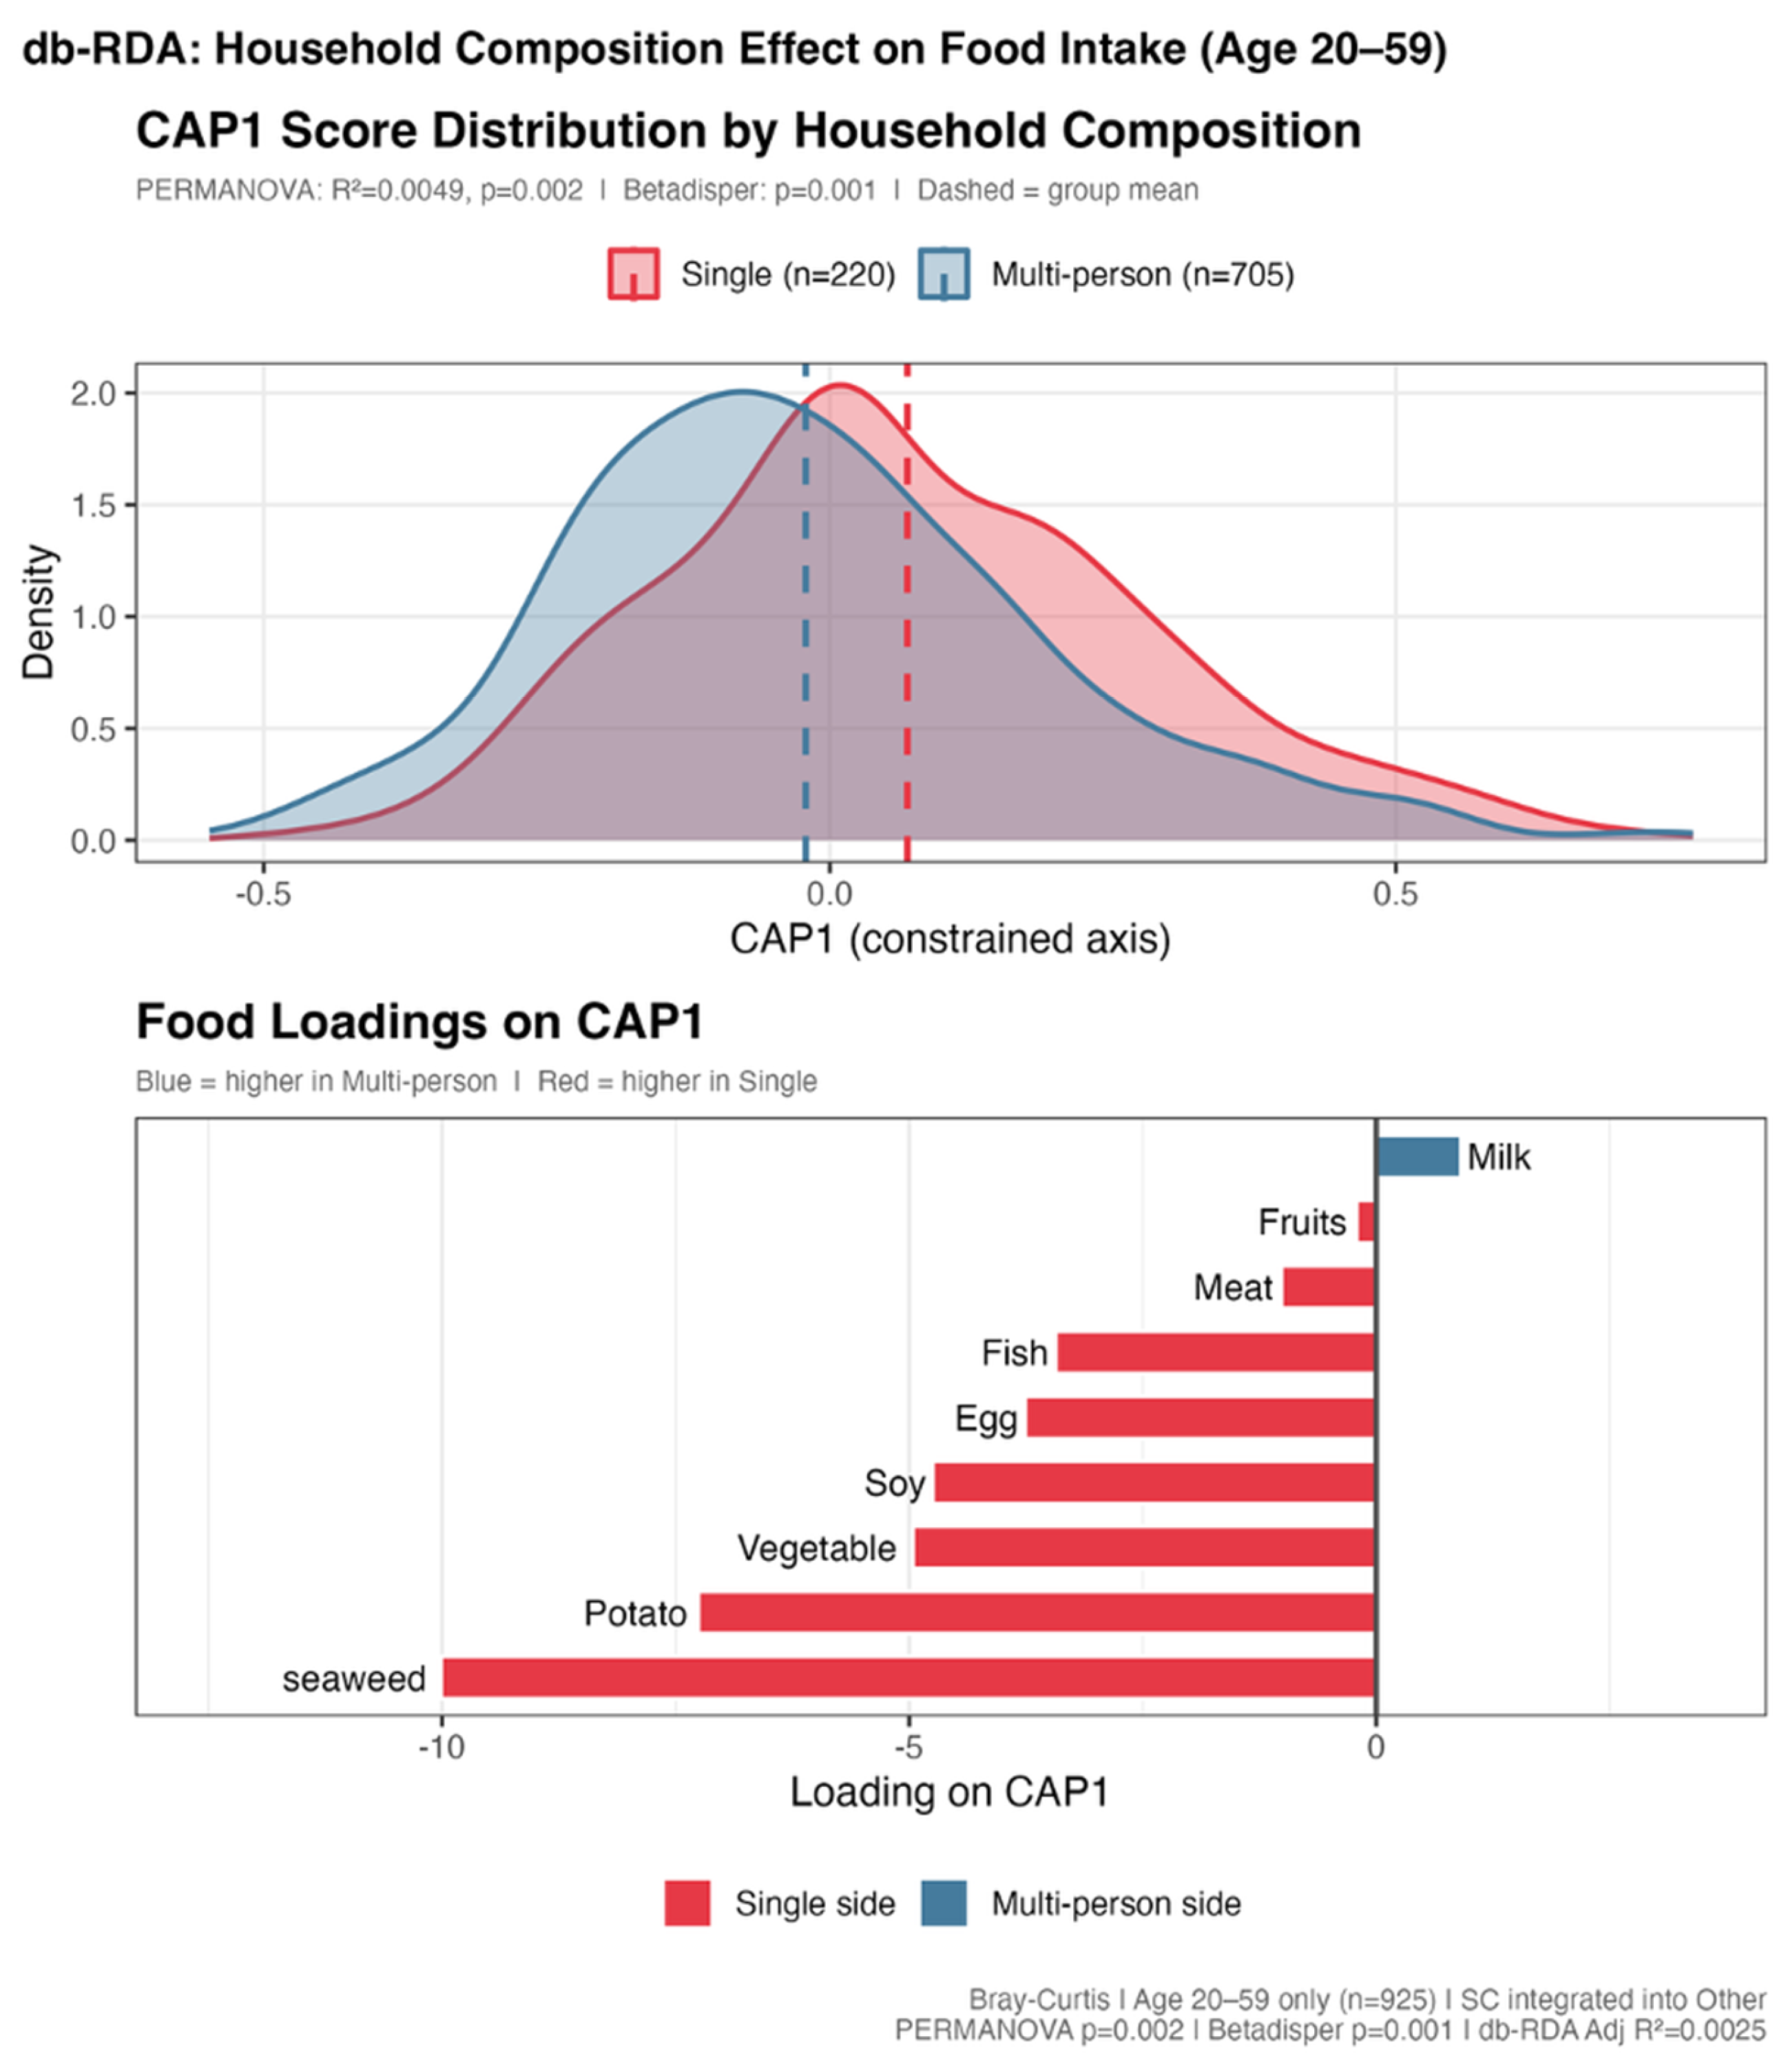
2.3.3. Redundancy Analysis (RDA)
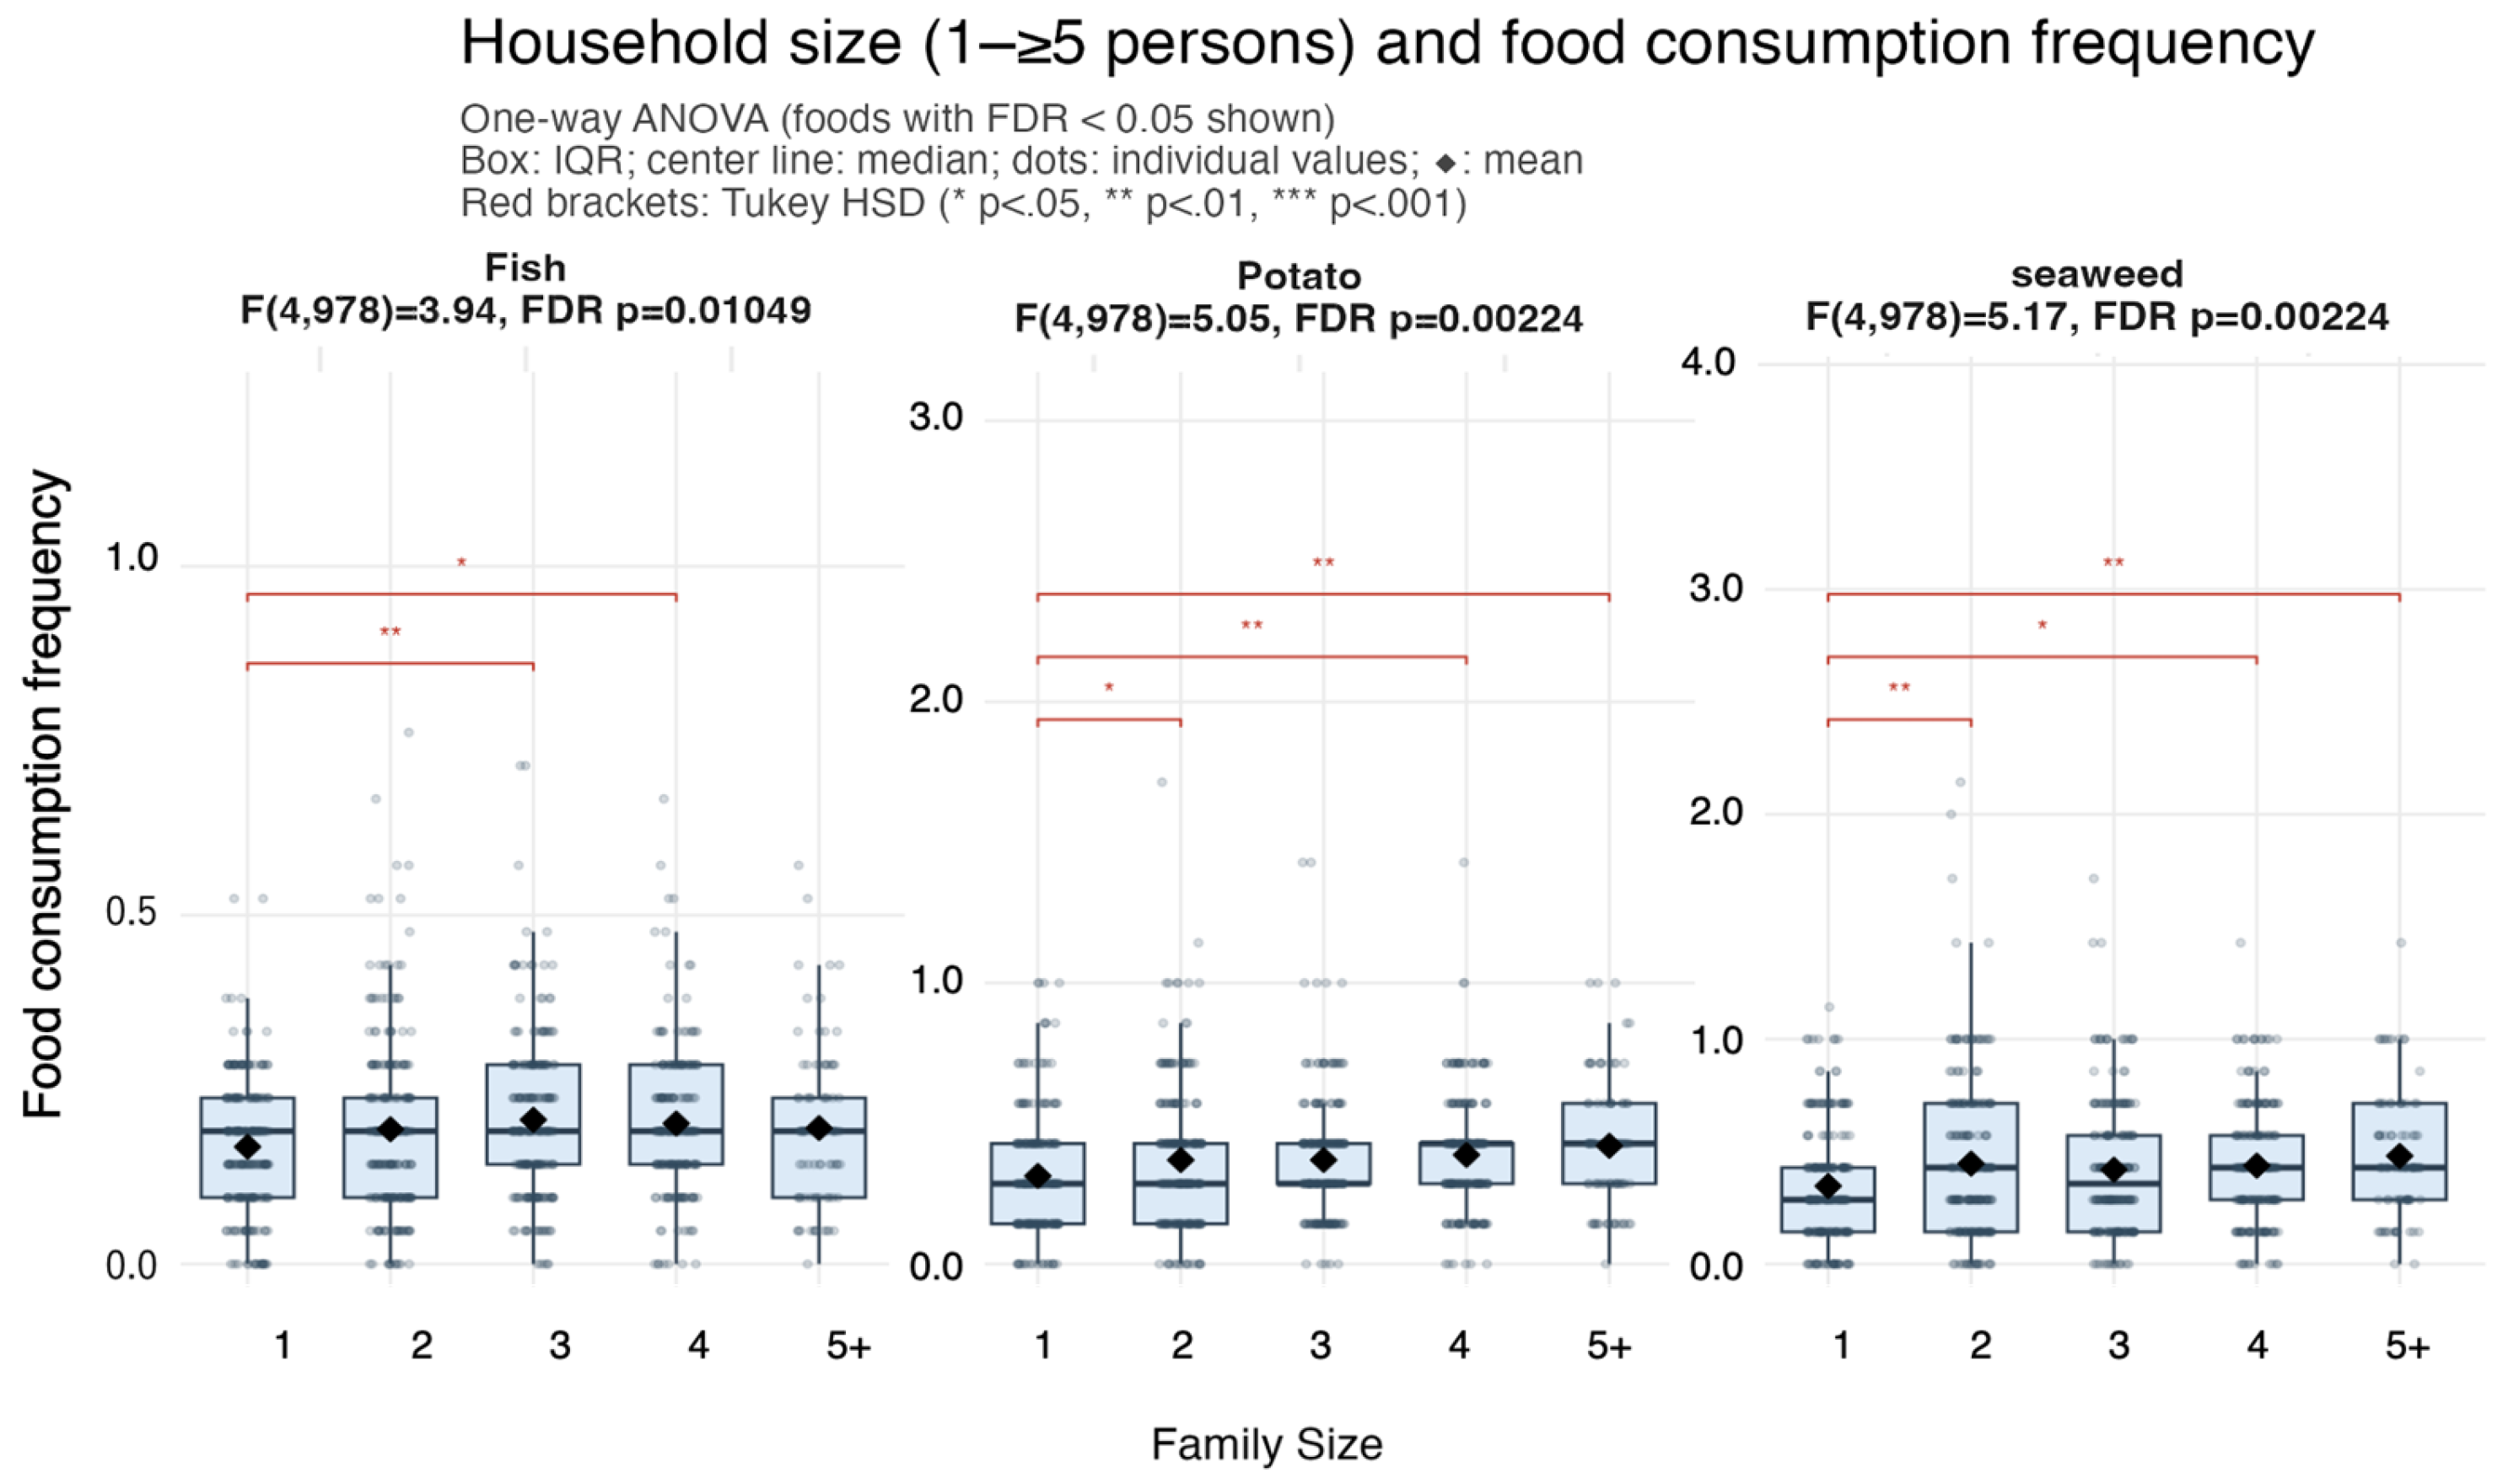
2.3.4. Dietary Intake Frequency by Household Type: Adjusted Comparisons Across Food Categories (ANCOVA)
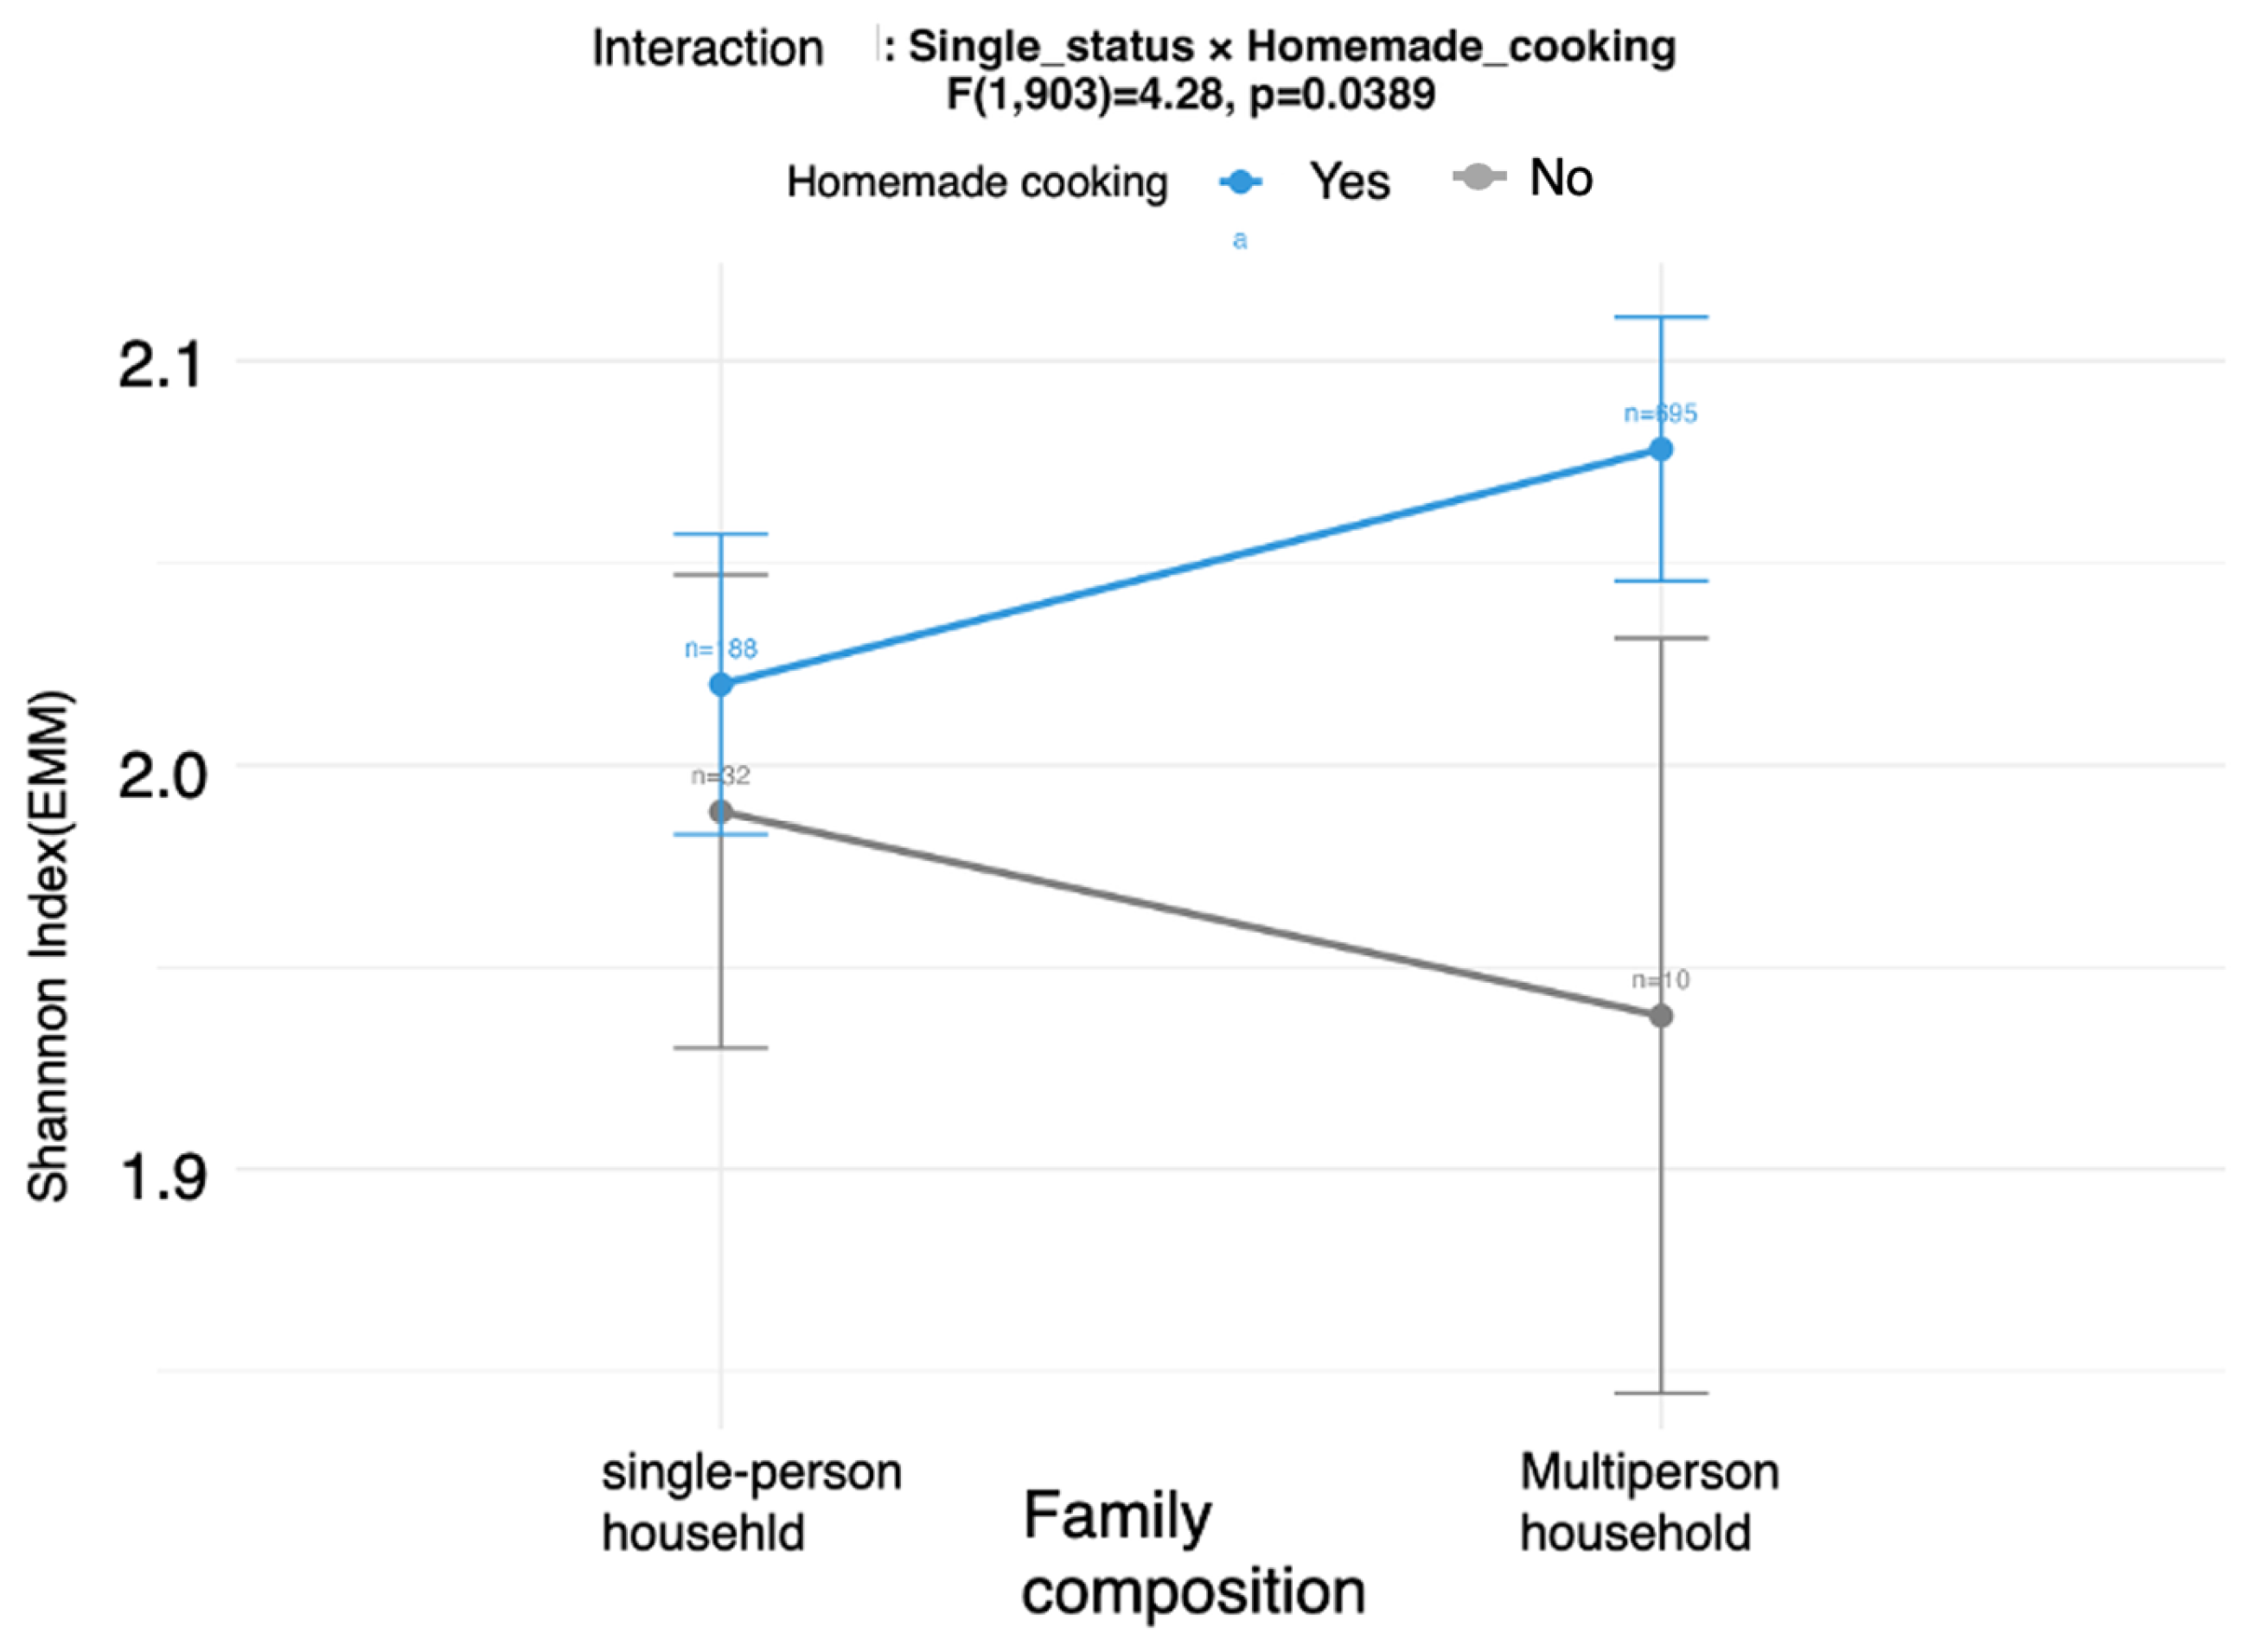
2.3.5. Interactive Effects of the Household Type and Homemade Cooking on Dietary Diversity: Type III ANOVA
3. Results
3.1. Baseline Demographic, Dietary, and Lifestyle Characteristics by Household Type
3.2. Associations Between Household and Lifestyle Factors and the Dietary Diversity (Shannon Index): Type III ANOVA
3.3. Relationships Between the Shannon Index and Family Structure
3.4. RDA Analysis
3.5. Dietary Intake Frequency by Household Type: Adjusted Comparisons Across Food Categories (ANCOVA)
3.6. Post Hoc Comparison of Dietary Diversity (Shannon Index) by Household Type and Homemade Cooking: Estimated Marginal Means and Simple Main Effects
4. Discussion
5. Conclusions
Author Contributions
Funding
Institutional Review Board Statement
Informed Consent Statement
Data Availability Statement
Acknowledgments
Conflicts of Interest
References
- U.S. Department of Agriculture; U.S. Department of Health and Human Services. Dietary Guidelines for Americans, 2020–2025, 9th ed.; U.S. Department of Agriculture: Washington, DC, USA, 2020. Available online: https://www.dietaryguidelines.gov/sites/default/files/2020-12/Dietary_Guidelines_for_Americans_2020-2025.pdf (accessed on 10 January 2026).
- Kesari, A.; Noel, J.Y. Nutritional Assessment. In StatPearls [Internet]; StatPearls Publishing: Treasure Island, FL, USA, 2023. Available online: https://www.ncbi.nlm.nih.gov/books/NBK580496/ (accessed on 10 January 2026).
- Huang, W.C.; Huang, Y.C.; Lee, M.S.; Doong, J.Y.; Pan, W.H.; Chang, H.Y. The Combined Effects of Dietary Diversity and Frailty on Mortality in Older Taiwanese People. Nutrients 2022, 14, 3825. [Google Scholar] [CrossRef] [Scilit]
- Otsuka, R.; Tange, C.; Nishita, Y.; Kato, Y.; Tomida, M.; Imai, T.; Ando, F.; Shimokata, H. Dietary Diversity and All-Cause and Cause-Specific Mortality in Japanese Community-Dwelling Older Adults. Nutrients 2020, 12, 1052. [Google Scholar] [CrossRef] [Scilit] [PubMed]
- Chalermsri, C.; Ziaei, S.; Ekström, E.-C.; Muangpaisan, W.; Aekplakorn, W.; Satheannopakao, W.; Rahman, S.M. Dietary Diversity Associated with Risk of Cardiovascular Diseases among Community-Dwelling Older People: A National Health Examination Survey from Thailand. Front. Nutr. 2022, 9, 1002066. [Google Scholar] [CrossRef] [Scilit] [PubMed]
- Hsiao, F.Y.; Peng, L.N.; Lee, W.J.; Chen, L.K. Higher Dietary Diversity and Better Healthy Aging: A 4-Year Study of Community-Dwelling Middle-Aged and Older Adults from the Taiwan Longitudinal Study of Aging. Exp. Gerontol. 2022, 168, 111929. [Google Scholar] [CrossRef] [Scilit]
- Reguant-Closa, A.; Pedolin, D.; Herrmann, M.; Nemecek, T. Review of Diet Quality Indices That Can Be Applied to the Environmental Assessment of Foods and Diets. Curr. Nutr. Rep. 2024, 13, 351–362. [Google Scholar] [CrossRef] [Scilit] [PubMed]
- Bullock, S.L.; Miller, H.M.; Ammerman, A.S.; Viera, A.J. Comparisons of Four Diet Quality Indexes to Define Single Meal Healthfulness. J. Acad. Nutr. Diet. 2022, 122, 149–158. [Google Scholar] [CrossRef] [Scilit]
- Miller, V.; Webb, P.; Micha, R.; Mozaffarian, D.; Global Dietary Database. Defining Diet Quality: A Synthesis of Dietary Quality Metrics and Their Validity for the Double Burden of Malnutrition. Lancet Planet. Health 2020, 4, e352–e370. [Google Scholar] [CrossRef] [Scilit]
- Katz, D.L.; Rhee, L.Q.; Aronson, D.L. Application of the Healthy Eating Index in a Multicultural Population: Introduction of Adaptive Component Scoring. Front. Nutr. 2025, 12, 1511230. [Google Scholar] [CrossRef] [Scilit]
- Trijsburg, L.; Talsma, E.F.; de Vries, J.H.M.; Kennedy, G.; Kuijsten, A.; Brouwer, I.D. Diet Quality Indices for Research in Low- and Middle-Income Countries: A Systematic Review. Nutr. Rev. 2019, 77, 515–540. [Google Scholar] [CrossRef] [Scilit]
- Monteiro, C.A.; Louzada, M.L.; Steele-Martinez, E.; Cannon, G.; Andrade, G.C.; Baker, P.; Bes-Rastrollo, M.; Bonaccio, M.; Gearhardt, A.N.; Khandpur, N.; et al. Ultra-processed foods and human health: The main thesis and the evidence. Lancet 2025, 406, 2667–2684. [Google Scholar] [CrossRef] [Scilit] [PubMed]
- Iizuka, K. Is the Use of Artificial Sweeteners Beneficial for Patients with Diabetes Mellitus? The Advantages and Disadvantages of Artificial Sweeteners. Nutrients 2022, 14, 4446. [Google Scholar] [CrossRef] [Scilit] [PubMed] [PubMed Central]
- Martínez Steele, E.; Popkin, B.M.; Swinburn, B.; Monteiro, C.A. The share of ultra-processed foods and the overall nutritional quality of diets in the US: Evidence from a nationally representative cross-sectional study. Popul. Health Metr. 2017, 15, 6. [Google Scholar] [CrossRef] [Scilit]
- Iizuka, K.; Yanagi, K.; Deguchi, K.; Ushiroda, C.; Yamamoto-Wada, R.; Ishihara, T.; Naruse, H. The Alpha and Beta Diversities of Dietary Patterns Differed by Age and Sex in Young and Middle-Aged Japanese Participants. Nutrients 2025, 17, 2205. [Google Scholar] [CrossRef] [Scilit] [PubMed]
- de Castro, J.M. Family and Friends Produce Greater Social Facilitation of Food Intake than Other Companions. Physiol. Behav. 1994, 56, 445–455. [Google Scholar] [CrossRef] [Scilit]
- Ruddock, H.K.; Brunstrom, J.M.; Vartanian, L.R.; Higgs, S. A Systematic Review and Meta-Analysis of the Social Facilitation of Eating. Am. J. Clin. Nutr. 2019, 110, 842–861. [Google Scholar] [CrossRef] [Scilit] [PubMed]
- Utter, J.; Larson, N.; Berge, J.M.; Eisenberg, M.E.; Fulkerson, J.A.; Neumark-Sztainer, D. Family Meals among Parents: Associations with Nutritional, Social and Emotional Wellbeing. Prev. Med. 2018, 113, 7–12. [Google Scholar] [CrossRef] [Scilit]
- Yokoyama, Y.; Nishi, M.; Murayama, H.; Amano, H.; Taniguchi, Y.; Nofuji, Y.; Narita, M.; Matsuo, E.; Seino, S.; Kawano, Y.; et al. Association of Dietary Variety with Body Composition and Physical Function in Community-Dwelling Elderly Japanese. J. Nutr. Health Aging 2016, 20, 691–696. [Google Scholar] [CrossRef] [Scilit]
- R Core Team. R: A Language and Environment for Statistical Computing; R Foundation for Statistical Computing: Vienna, Austria, 2026; Available online: https://www.r-project.org (accessed on 10 January 2026).
- Medeiros, M.F.A.; Silva, S.G.B.; Teixeira, C.D.; Lima, S.C.V.C.; Marchioni, D.M.; Jacob, M.C.M. Assessment of Biodiversity in Food Consumption Studies: A Systematic Review. Front. Nutr. 2022, 9, 832288. [Google Scholar] [CrossRef] [Scilit] [PubMed]
- Singh, R.; McDonald, D.; Hernandez, A.R.; Song, S.J.; Bartko, A.; Knight, R.; Salathé, M. Temporal Nutrition Analysis Associates Dietary Regularity and Quality with Gut Microbiome Diversity: Insights from the Food & You Digital Cohort. Nat. Commun. 2025, 16, 8635. [Google Scholar] [CrossRef] [Scilit]
- Larson, N.I.; Nelson, M.C.; Neumark-Sztainer, D.; Story, M.; Hannan, P.J. Shared Meals among Young Adults Are Associated with Better Diet Quality and Predicted by Family Meal Patterns during Adolescence. Public Health Nutr. 2013, 16, 883–893. [Google Scholar] [CrossRef] [Scilit]
- Mills, S.; Brown, H.; Wrieden, W.; White, M.; Adams, J. Frequency of Eating Home Cooked Meals and Potential Benefits for Diet and Health: Cross-Sectional Analysis of a Population-Based Cohort Study. Int. J. Behav. Nutr. Phys. Act. 2017, 14, 109. [Google Scholar] [CrossRef] [Scilit]
- Horning, M.L.; Fulkerson, J.A.; Friend, S.E.; Neumark-Sztainer, D. Associations among Nine Family Dinner Frequency Measures and Child Weight, Dietary, and Psychosocial Outcomes. J. Acad. Nutr. Diet. 2016, 116, 991–999. [Google Scholar] [CrossRef] [Scilit] [PubMed] [PubMed Central]
- Lee, H.; Kim, S.-J.; Kang, M. Comparative Study on Eating Habits and Health of Single-Person and Multi-Person Households. PLoS ONE 2025, 20, e0327763. [Google Scholar] [CrossRef] [Scilit]
- Moon, W.; Ham, S.; Suk, Y. Dietary behaviors and food waste typologies in single-person households using nationally representative data in South Korea. Waste Manag. 2026, 216, 115446. [Google Scholar] [CrossRef] [Scilit]



| Variable | Overall (n = 925) | Single (n = 220) | Multiple (n = 705) | p Value | Statistical Test |
|---|---|---|---|---|---|
| N | 925 | 220 | 705 | ||
| Sex, n (%) [Male] | 407 (44.0%) | 91 (41.4%) | 316 (44.8%) | ||
| Age group, n (%) | <0.001 *** | Chi-square | |||
| 20s | 122 (13.2%) | 68 (30.9%) | 54 (7.7%) | ||
| 30s | 257 (27.8%) | 60 (27.3%) | 197 (27.9%) | ||
| 40s | 317 (34.3%) | 45 (20.5%) | 272 (38.6%) | ||
| 50s | 229 (24.8%) | 47 (21.4%) | 182 (25.8%) | ||
| BMI, mean ± SD | 22.41 ± 3.51 | 21.97 ± 3.26 | 22.55 ± 3.57 | 0.024 * | Mann–Whitney |
| Median [IQR] | 21.78 [20.03–24.01] | 21.28 [19.83–23.68] | 21.91 [20.08–24.06] | ||
| Location, n (%) | <0.001 *** | Chi-square | |||
| Osaka | 339 (36.6%) | 77 (35.0%) | 262 (37.2%) | ||
| Kyoto | 103 (11.1%) | 33 (15.0%) | 70 (9.9%) | ||
| Tokyo | 118 (12.8%) | 24 (10.9%) | 94 (13.3%) | ||
| Mie (Ueno) | 277 (29.9%) | 52 (23.6%) | 225 (31.9%) | ||
| Other | 88 (9.5%) | 34 (15.5%) | 54 (7.7%) | ||
| Job type, n (%) | 0.001 ** | Chi-square | |||
| Administrative | 236 (25.5%) | 43 (19.5%) | 193 (27.4%) | ||
| Production/Technical | 366 (39.6%) | 76 (34.5%) | 290 (41.1%) | ||
| R&D | 189 (20.4%) | 63 (28.6%) | 126 (17.9%) | ||
| Sales | 116 (12.5%) | 35 (15.9%) | 81 (11.5%) | ||
| Other | 18 (1.9%) | 3 (1.4%) | 15 (2.1%) | ||
| Homemade cooking, n (%) | <0.001 *** | Chi-square | |||
| No | 42 (4.5%) | 32 (14.5%) | 10 (1.4%) | ||
| Yes | 883 (95.5%) | 188 (85.5%) | 695 (98.6%) | ||
| Dining area, n (%) | 0.498 | Chi-square | |||
| Convenience store | 109 (11.8%) | 23 (10.5%) | 86 (12.2%) | ||
| Eat out | 136 (14.7%) | 37 (16.8%) | 99 (14.0%) | ||
| Employee cafeteria | 551 (59.6%) | 132 (60.0%) | 419 (59.4%) | ||
| Healthy lunch | 3 (0.3%) | 0 (0.0%) | 3 (0.4%) | ||
| Homemade lunchbox | 99 (10.7%) | 19 (8.6%) | 80 (11.3%) | ||
| None | 27 (2.9%) | 9 (4.1%) | 18 (2.6%) | ||
| Family composition, n (%) | <0.001 *** | Chi-square | |||
| 1 person | 220 (23.8%) | 220 (100.0%) | 0 (0.0%) | ||
| 2 persons | 204 (22.1%) | 0 (0.0%) | 204 (28.9%) | ||
| 3 persons | 208 (22.5%) | 0 (0.0%) | 208 (29.5%) | ||
| 4 persons | 207 (22.4%) | 0 (0.0%) | 207 (29.4%) | ||
| ≥5 persons | 86 (9.3%) | 0 (0.0%) | 86 (12.2%) |
| Source | Df | MS | F(df1, df2) | P | η2p | 95% CI | Sig. |
|---|---|---|---|---|---|---|---|
| Age group | 3 | 0.006 | F(3, 898) = 0.32 | 0.814 | 0.001 | [0.000, 0.005] | |
| Sex | 1 | 0.004 | F(1, 898) = 0.18 | 0.67 | 0.000 | [0.000, 0.006] | |
| Age group × Sex | 3 | 0.006 | F(3, 898) = 0.30 | 0.82 | 0.001 | [0.000, 0.005] | |
| Family composition | 4 | 0.123 | F(4, 898) = 6.24 | <0.001 | 0.027 | [0.010, 0.047] | *** |
| Location | 4 | 0.017 | F(4, 898) = 0.87 | 0.48 | 0.004 | [0.000, 0.011] | |
| Home cooking frequency | 1 | 0.116 | F(1, 898) = 5.89 | 0.015 | 0.007 | [0.001, 0.021] | * |
| Dining area | 5 | 0.030 | F(5, 898) = 1.50 | 0.19 | 0.008 | [0.000, 0.018] | |
| Job type | 4 | 0.033 | F(4, 898) = 1.67 | 0.16 | 0.007 | [0.000, 0.018] | |
| BMI | 1 | 0.013 | F(1, 898) = 0.65 | 0.42 | 0.001 | [0.000, 0.008] | |
| Residual | 898 | 0.020 |
| Family Size | EMM (Shannon) | 95% CI (Lower–Upper) | F (df1 = 4, df2 = 900)/p for Family_Size | Partial η2 (Family_Size) | Significant Pairwise Differences (Tukey) |
|---|---|---|---|---|---|
| 1 person | 1.973 | 1.922–2.025 | F = 6.45, p < 0.001 | 0.028 | 1 vs. 3, 1 vs. 4, 1 vs. 5+ |
| 2 persons | 2.009 | 1.956–2.062 | – | ||
| 3 persons | 2.03 | 1.976–2.084 | 1 vs. 3 | ||
| 4 persons | 2.039 | 1.983–2.094 | 1 vs. 4 | ||
| 5+ persons | 2.05 | 1.992–2.109 | 1 vs. 5+ |
| Food | Model 2 | ||||||
| EMM (Single) | EMM (Multiple) | Diff | F | η2p | p (FDR) | Sig. | |
| Meat | 0.44 | 0.46 | −0.023 | 1.44 | 0.0015 | 0.41 | n.s. |
| Fish | 0.18 | 0.20 | −0.024 | 7.67 | 0.0078 | 0.013 | * |
| Egg | 0.26 | 0.29 | −0.038 | 8.61 | 0.0087 | 0.010 | * |
| Milk | 0.71 | 0.68 | 0.022 | 0.56 | 0.0006 | 0.51 | n.s. |
| Soy | 0.54 | 0.58 | −0.035 | 0.99 | 0.0010 | 0.41 | n.s. |
| Vegetable | 0.73 | 0.77 | −0.037 | 0.99 | 0.0010 | 0.41 | n.s. |
| Fruits | 0.43 | 0.42 | 0.0093 | 0.11 | 0.0001 | 0.75 | n.s. |
| Seaweed | 0.38 | 0.45 | −0.075 | 10.74 | 0.0109 | 0.005 | ** |
| Potato | 0.32 | 0.39 | −0.069 | 15.36 | 0.0155 | <0.001 | *** |
| Oil | — | — | — | — | — | — | — |
| Food | Model 3 | ||||||
| EMM (Single) | EMM (Multiple) | Diff | F | η2p | p (FDR) | Sig. | |
| Meat | 0.44 | 0.46 | −0.023 | 1.427 | 0.002 | 0.38 | n.s. |
| Fish | 0.18 | 0.20 | −0.024 | 7.621 | 0.008 | 0.013 | * |
| Egg | 0.26 | 0.2936 | −0.037 | 8.235 | 0.008 | 0.013 | * |
| Milk | 0.70 | 0.68 | 0.021 | 0.489 | 0.0005 | 0.55 | n.s. |
| Soy | 0.54 | 0.58 | −0.037 | 1.153 | 0.0012 | 0.38 | n.s. |
| Vegetable | 0.73 | 0.77 | −0.039 | 1.102 | 0.0011 | 0.38 | n.s. |
| Fruhits | 0.42 | 0.42 | 0.0062 | 0.047 | <0.001 | 0.83 | n.s. |
| Seaweed | 0.37 | 0.45 | −0.077 | 11.17 | 0.0113 | 0.004 | ** |
| Potato | 0.32 | 0.39 | −0.070 | 15.77 | 0.016 | <0.001 | *** |
| Oil | — | — | — | — | — | — | — |
| Source | df | MS | F (df1, 903) | p | η2p | 95% CI | Sig. |
|---|---|---|---|---|---|---|---|
| Intercept | 1 | 42.39 | — | <0.001 | — | — | *** |
| Single status | 1 | 0.019 | 0.97 | 0.33 | 0.001 | [0.000, 1.000] | n.s. |
| Homemade cooking | 1 | 0.027 | 1.35 | 0.25 | 0.002 | [0.000, 1.000] | n.s. |
| Age group | 3 | 0.031 | 1.58 | 0.19 | 0.005 | [0.000, 1.000] | n.s. |
| Sex | 1 | 0.0093 | 0.47 | 0.49 | <0.001 | [0.000, 1.000] | n.s. |
| Location | 4 | 0.020 | 1.04 | 0.39 | 0.005 | [0.000, 1.000] | n.s. |
| Dining area | 5 | 0.028 | 1.40 | 0.22 | 0.008 | [0.000, 1.000] | n.s. |
| Job type | 4 | 0.034 | 1.72 | 0.14 | 0.008 | [0.000, 1.000] | n.s. |
| BMI | 1 | 0.016 | 0.80 | 0.37 | <0.001 | [0.000, 1.000] | n.s. |
| Single status × Homemade cooking | 1 | 0.084 | 4.28 | 0.04 | 0.005 | [0.000, 1.000] | * |
| Residual | 903 | 0.020 | — | — | — | — | — |
Disclaimer/Publisher’s Note: The statements, opinions and data contained in all publications are solely those of the individual author(s) and contributor(s) and not of MDPI and/or the editor(s). MDPI and/or the editor(s) disclaim responsibility for any injury to people or property resulting from any ideas, methods, instructions or products referred to in the content. |
© 2026 by the authors. Licensee MDPI, Basel, Switzerland. This article is an open access article distributed under the terms and conditions of the Creative Commons Attribution (CC BY) license.
Share and Cite
Matsuura, H.; Hiraiwa, E.; Deguchi, K.; Ushiroda, C.; Yamamoto-Wada, R.; Iizuka, K. Household Composition May Modify the Association Between Home Cooking and Dietary Diversity Among Japanese Corporate Employees. Nutrients 2026, 18, 1704. https://doi.org/10.3390/nu18111704
Matsuura H, Hiraiwa E, Deguchi K, Ushiroda C, Yamamoto-Wada R, Iizuka K. Household Composition May Modify the Association Between Home Cooking and Dietary Diversity Among Japanese Corporate Employees. Nutrients. 2026; 18(11):1704. https://doi.org/10.3390/nu18111704
Chicago/Turabian StyleMatsuura, Hitomi, Eri Hiraiwa, Kanako Deguchi, Chihiro Ushiroda, Risako Yamamoto-Wada, and Katsumi Iizuka. 2026. "Household Composition May Modify the Association Between Home Cooking and Dietary Diversity Among Japanese Corporate Employees" Nutrients 18, no. 11: 1704. https://doi.org/10.3390/nu18111704
APA StyleMatsuura, H., Hiraiwa, E., Deguchi, K., Ushiroda, C., Yamamoto-Wada, R., & Iizuka, K. (2026). Household Composition May Modify the Association Between Home Cooking and Dietary Diversity Among Japanese Corporate Employees. Nutrients, 18(11), 1704. https://doi.org/10.3390/nu18111704